Abstract
Objectives
Non-invasive venous waveform analysis (NIVA) is a recently described, novel technique to assess intravascular volume status. Waveforms are captured with a piezoelectric sensor; analysis in the frequency domain allows for calculation of a “NIVA value” that represents volume status. The aim of this report was to determine the effects of vasoactive agents on the venous waveform and calculated NIVA values.
Design
Porcine experimental model.
Setting
Operating theatre.
Participants
A piezoelectric sensor was secured over the surgically exposed saphenous vein in eight anesthetized pigs.
Main outcome measures
NIVA value, pulmonary capillary wedge pressure (PCWP), and mean arterial pressure prior to and post intravenous administration of 150–180 µg of phenylephrine or 100 µg of sodium nitroprusside.
Results
Phenylephrine led to a decrease in NIVA value (mean 9.2 vs. 4.6, p < 0.05), while sodium nitroprusside led to an increase in NIVA value (mean 9.5 vs. 11.9, p < 0.05). Mean arterial pressure increased after phenylephrine (p < 0.05) and decreased after sodium nitroprusside (p < 0.05). PCWP did not change significantly after phenylephrine (p = 0.25) or sodium nitroprusside (p = 0.06).
Conclusions
Vasoactive agents lead to changes in non-invasively obtained venous waveforms in euvolemic pigs, highlighting a potential limitation in the ability to NIVA to estimate static volume in this setting. Further studies are indicated to understand the effects of vasoactive agents in the setting of hypovolemia and hypervolemia.
Keywords: Animal models of human disease, basic science research, cardiology, cardiology, other vascular biology, vascular biology
Introduction
Venous waveform analysis has recently been developed as a novel technique to accurately assess intravascular volume.1–6 The peripheral venous system is the most compliant vascular compartment of the body, and thus serves as a volume reservoir containing ∼70% of the circulating blood volume.7 Because of its high compliance, the magnitude of the venous waveform is low and changes in volume are accompanied by minimal changes in pressure, rendering absolute peripheral venous pressure measurements difficult to interpret. However, studies that have analyzed harmonics of the heart rate frequency in the frequency domain of the venous waveform have revealed that the relative power contributions of the pulse rate and its harmonics change with volume and can be quantified into a value that is representative of volume status.1–6
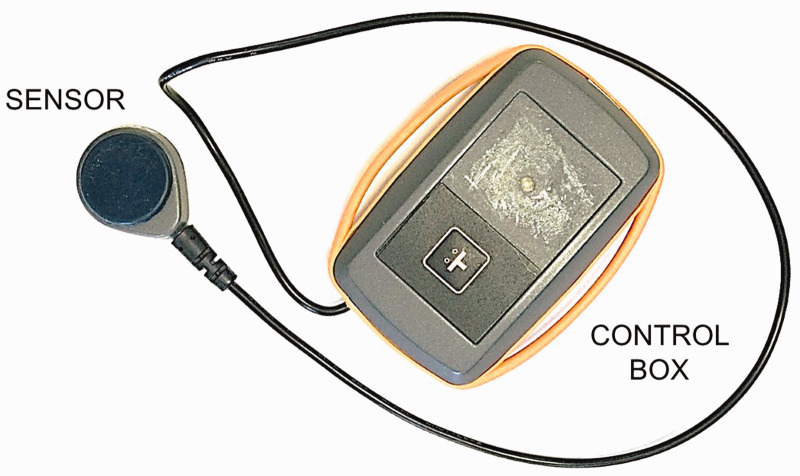
Non-Invasive Venous waveform Analysis (NIVA) is an innovative, non-invasive method of capturing the peripheral venous waveform for analysis using a piezoelectric sensor connected to a control box (Figure 1). The piezoelectric sensor is applied to the skin directly over the superficial veins of the wrist and captures small deflections in the skin that occur as a result of the pulsatile venous waveform. An early prototype device has demonstrated the ability to identify small volumes of blood loss, volume removed during hemodialysis, and correlation with a wide range of pulmonary capillary wedge pressures (PCWP), the gold-standard estimate of left ventricular preload, in patients undergoing right heart catheterization (n = 83, r = 0.69, p < 0.05).1–3
Figure 1.
Prototype NIVA device consisting of a piezoelectric sensor and control box.
While there is growing evidence to support venous waveform analysis as a technique to monitor volume status, little is known as to how the venous waveform may be affected by vasoactive agents and whether this may confound analysis of volume status. The aim of this study was to determine the effect of vasoconstriction and vasodilation on non-invasively captured venous waveforms utilizing a porcine model.
Materials and methods
Porcine model
Under an approved Institutional Animal Care and Use Committee protocol, eight adult female Yorkshire pigs, 40–45 kg (Oak Hill Genetics, Ewing, IL), were intubated and ventilated with a volume-controlled ventilator (Hallowell EMC, Pittsfield, MA) at 8 mL/kg tidal volumes with oxygen FiO2 1.0, a positive end-expiratory pressure of 5 cmH2O and I:E ratio 1:2. Respiratory rate (16–22 breaths/min) was titrated to maintain an end-tidal CO2 of 35–40 mmHg. General anesthesia was maintained with 1% isoflurane (Primal Healthcare, Boston, MA).
Surgical exposure of the saphenous vein in the hindlimb was obtained and a 20-mm piezoelectric sensor (ADInstruments, Colorado Springs, CO) was secured directly over the vein for continuous waveform acquisition. This direct exposure of the vein ensured that the acquired signal was purely venous and avoided attenuation of the signal from the thick porcine skin. Phenylephrine (PE) 150–180 µg IV was administered in eight pigs, followed by a 15-min equilibration period and then sodium nitroprusside (SNP) 100 µg IV in seven pigs. Additional central hemodynamic monitoring included pulmonary capillary wedge pressure (PCWP) in five pigs obtained via placement of a Swan Ganz Catheter (Edwards Lifesciences, Irvine, CA) in the right internal jugular vein, and mean arterial pressure (MAP) obtained from an arterial transducer in the left carotid artery. Hemodynamic measures were obtained within 1 min prior to and post administration of these vasoactive agents.
Venous waveform analysis
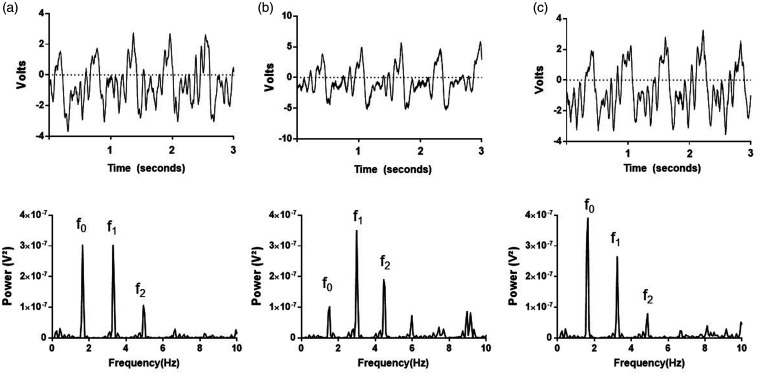
Venous waveforms obtained with the piezoelectric sensor were obtained at a sampling frequency of 1000 Hz and viewed in LabChart software (ADInstruments, Colorado Springs, CO). Waveforms were converted from the time to the frequency domain using a fast Fourier transform (16k windows). Two blinded study personnel independently determined and recorded peak powers of the fundamental frequency (f0) and its harmonics (f1–2) within 1 min prior to and post administration of PE or SNP (Figure 2). NIVA values, which are designed to be representative of volume status, were calculated as in the previous studies using a proprietary algorithm that incorporates the relative power contributions of each cardiac frequency (f0–2) in relation to the total signal power.1,3 This algorithm was originally developed using venous harmonics obtained from athletes before and after exercise, using a least-squares analysis to create an algorithm that correlated with insensible fluid losses quantified by changes in weight (unpublished data); the algorithm has since been validated in patients undergoing elective right heart catheterization through correlation with PCWP and absolute blood loss during mild hemorrhage.1,3 Three NIVA values were derived by each independent observer from non-overlapping, low-noise segments of the venous waveform signal and averaged for analysis. From these datapoints, the ratio of the power of f1 to f0 was also calculated to more clearly elucidate morphologic changes in the waveform.
Figure 2.
Representative raw waveform (top) and fast Fourier transform (bottom) at (a) baseline and after (b) phenylephrine or (c) sodium nitroprusside.
Statistical analysis
Statistical analyses were performed using GraphPad Prism (GraphPad Software Inc., La Jolla, CA). Comparison of NIVA values, power of f1 to f0, PCWP, and MAP prior to and post administration of PE or SNP was performed with a two-tailed paired Wilcoxon test. Means and standard error of the mean are also reported. P-values <0.05 were considered significant.
Results
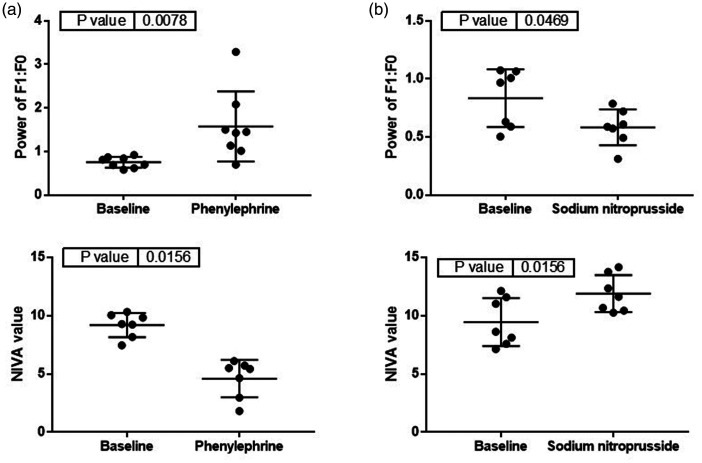
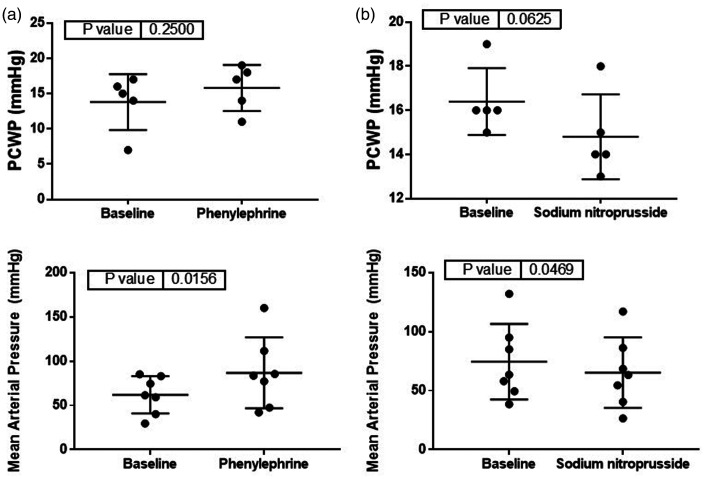
Phenylephrine, a vasoconstrictor, led to a significant decrease in NIVA value (9.2 ± 0.4 vs. 4.6 ± 0.6, p < 0.05, Figure 3) and increase in MAP (62 ± 8 vs. 87 ± 15, p < 0.05, Figure 4). Sodium nitroprusside, a vasodilator, resulted in a significant increase in NIVA value (9.5 ± 0.8 vs. 11.9 ± 0.6, p < 0.05, Figure 3) and decrease in MAP (75 ± 12 vs. 65 ± 11, p < 0.05, Figure 4). The ratio of the power of f1 to f0 was significantly increased with phenylephrine (0.75 ± 0.04 vs. 1.6 ± 0.3, p < 0.05, Figure 3) and significantly decreased with SNP (0.83 ± 0.09 vs. 0.58 ± 0.06, p < 0.05, Figure 3). There were no significant changes noted to PCWP with either phenylephrine (14 ± 2 vs. 16 ± 1, p = 0.41, Figure 4) or nitroprusside (16 ± 0.7 vs. 15 ± 0.9, p = 0.18, Figure 4).
Figure 3.
Changes in the ratio of the power of f1 to f0 (top) and NIVA value (bottom) after administration of (a) phenylephrine or (b) sodium nitroprusside (n = 7).
Figure 4.
Changes in pulmonary capillary wedge pressure (PCWP, top, n = 5) and mean arterial pressure (MAP, bottom, n = 7) after administration of (a) phenylephrine or (b) sodium nitroprusside.
Discussion
Venous waveform analysis has been described in recent literature as a promising method for estimation of intravascular volume status.1,3–6 In particular, non-invasive capture of peripheral venous waveforms using a piezoelectric sensor, known as NIVA, has demonstrated accuracy in identifying small volumes of blood loss as well as correlation with a wide range of pulmonary capillary wedge pressures (PCWP), an estimate of cardiac filling.1,3 A better understanding of clinical variables that affect venous waveforms will help identify limitations of this technology toward volume assessment to ensure safe utilization in a patient population where vasoactive agents are administered.
Administration of vasoactive agents is common in hospital settings, and thus an understanding of the effects of vascular tone on venous waveforms has clinical relevance. This study demonstrates that administration of phenylephrine, a vasoconstrictor, or sodium nitroprusside, a vasodilator has discordant effects on the venous waveform. Administration of phenylephrine appears to dampen the power of the pulse rate frequency (f0) relative to the first harmonic of the pulse rate frequency (f1). This suggests that the fundamental frequency, or the waveform generated by the pulse rate, as detected externally is dampened after venoconstriction. It is hypothesized that the harmonics of the pulse rate are generated through reflection of the fundamental waveform from the vein wall and surrounding tissues. Therefore, the observed increase in the power of f1 in relation to f0 with venoconstriction is likely also partially explained by an accompanied decrease in compliance of the venous wall. These changes underlie the observed decrease in NIVA value, a quantitative measure used in previous studies to estimate the volume status and calculated using the relative powers of f0-2, with phenylephrine. Volume changes during the experiments are assumed to be minimal given the short time-frame (15–20 min). Based on these results, the NIVA value underestimated volume status in the presence of PE in this study. Sodium nitroprusside, a venodilator, led to opposite effects on the non-invasively obtained venous signal compared to phenylephrine. Namely, the relative power of f1 in relation to f0 decreased with venodilation and NIVA value increased. Thus, the NIVA value overestimated the volume status in the presence of SNP in this study.
Of note, PCWP did not change significantly with either phenylephrine or sodium nitroprusside administration; however, the sample size was small (n = 5) and may not have been appropriately powered to detect a difference. MAP increased with phenylephrine and decreased with nitroprusside, as would be expected with the respective increase and decrease in systemic vascular tone and resistance.
This report suggests a potential limitation for the use of NIVA, a recently described technique for static volume assessment, in patients who are actively receiving vasoactive infusions. However, additional experiments after controlled hemorrhage and volume overload will better define whether these changes persist in these settings. Further porcine experiments of controlled hemorrhage and volume overload in the setting of a continuous infusion of phenylephrine or nitroprusside may also better define whether venous waveforms can still detect dynamic volume changes in these settings. Additionally, surgical placement of the sensor directly on the vein and absence of the extravascular tissue may have had an effect on the propagation and amplitudes of the higher harmonics of the pulse rate, which may also have affected calculation of a NIVA value. However, this was chosen as the most appropriate technique due to the increased thickness of porcine skin compared to human soft tissue as well as to ensure that captured signals were purely venous. Although future experiments comparing signals from a sensor placed directly over a cutdown of the vein to a sensor placed on the skin overlying the vein may help clarify the differences in calculated NIVA values between the two techniques at various volume states, this was not deemed necessary in this report to demonstrate that fundamental signal changes are observed with altered venous tone that may affect the algorithmic calculation of a NIVA value.
Acknowledgements
Not applicable.
Contributorship
CB, BA, and KH contributed to research design, data analysis, and critical manuscript revision. MP contributed to data analysis and manuscript preparation. SE contributed to research design and DC contributed to data analysis. PL, JHS, and JH contributed to critical revision of the manuscript.
Declaration of conflicting interests
The author(s) declared the following potential conflicts of interest with respect to the research, authorship, and/or publication of this article: Kyle Hocking, PhD, is the Founder, CEO and President of VoluMetrix and an inventor on intellectual property in the field of venous waveform analysis assigned to Vanderbilt and licensed to VoluMetrix. Colleen Brophy, MD, is the Founder and CMO of VoluMetrix and an inventor on intellectual property in the field of venous waveform analysis assigned to Vanderbilt and licensed to VoluMetrix. Jon Whitfield, ME is an engineer and owns stock with VoluMetrix. Susan Eagle, MD is the former founder and CEO of VoluMetrix and an inventor on intellectual property in the field of venous waveform analysis assigned to Vanderbilt and licensed to VoluMetrix. Bret Alvis, MD, owns stock in VoluMetrix and an inventor on intellectual property in the field of venous waveform analysis assigned to Vanderbilt and licensed to VoluMetrix and is married to the COO of VoluMetrix.
Ethical approval
This study was performed in accordance with the Vanderbilt University Medical Center Institutional Review Board and an approved Institutional Animal Care and Use Committee protocol.
Funding
The author(s) disclosed receipt of the following financial support for the research, authorship, and/or publication of this article: This work was supported by the National Science Foundation Grant Number 1549576 to KH. This work was also supported by a Grant from the National Institutes of Health Grant Number 1R01HL148244-01 to BA and grant number 5F32HL140849-02 to MP.
Guarantor
Monica Polcz.
ORCID iDs
Monica Polcz https://orcid.org/0000-0001-8744-5982
Kyle M Hocking https://orcid.org/0000-0002-3603-7185
Devin Chang https://orcid.org/0000-0001-7943-5469
References
- 1.Alvis BD, McCallister R, Polcz M, et al. Non-Invasive Venous waveform Analysis (NIVA) for monitoring blood loss in human blood donors and validation in a porcine hemorrhage model. J Clin Anesth 2020; 61: 109664. [DOI] [PMC free article] [PubMed] [Google Scholar]
- 2.Alvis BD, Polcz M, Miles M, et al. Non-invasive venous waveform analysis (NIVA) for volume assessment in patients undergoing hemodialysis: an observational study. BMC Nephrol 2020; 21: 194. [DOI] [PMC free article] [PubMed] [Google Scholar]
- 3.Alvis BD, Polcz M, Huston JH, et al. Observational study of noninvasive venous waveform analysis to assess intracardiac filling pressures during right heart catheterization. J Card Fail 2020; 26: 136–141. [DOI] [PubMed] [Google Scholar]
- 4.Hocking KM, Alvis BD, Baudenbacher F, et al. Peripheral i.v. analysis (PIVA) of venous waveforms for volume assessment in patients undergoing haemodialysis. Br J Anaesth 2017; 119: 1135–1140. [DOI] [PubMed] [Google Scholar]
- 5.Miles M, Alvis BD, Hocking K, et al. Peripheral intravenous volume analysis (PIVA) for quantitating volume overload in patients hospitalized with acute decompensated heart failure – a pilot study. J Card Fail 2018; 24: 525–532. [DOI] [PubMed] [Google Scholar]
- 6.Hocking KM, Sileshi B, Baudenbacher FJ, et al. Peripheral venous waveform analysis for detecting hemorrhage and iatrogenic volume overload in a porcine model. Shock 2016; 46: 447–452. [DOI] [PubMed] [Google Scholar]
- 7.Gelman S. Venous function and central venous pressure: a physiologic story. Anesthesiology 2008; 108: 735–748. [DOI] [PubMed] [Google Scholar]


