

Abstract
A high-resolution, two-dimensional cloud-resolving model with spectral-bin microphysics is used to study the impact of aerosols on precipitation processes in both a tropical oceanic and a midlatitude continental squall line with regard to three processes: latent heating (LH), cold pool dynamics and ice microphysics. Evaporative cooling in the lower troposphere is found to enhance rainfall in low cloud condensation nuclei (CCN) concentration scenarios in the developing stages of a midlatitude convective precipitation system. In contrast, the tropical case produced more rainfall under high CCN concentrations. Both cold pools and low-level convergence are stronger for those configurations having enhanced rainfall. Nevertheless, latent heat release is stronger (especially after initial precipitation) in the scenarios having more rainfall in both the tropical and midlatitude environment. Sensitivity tests are performed to examine the impact of ice and evaporative cooling on the relationship between aerosols, LH and precipitation processes. The results show that evaporative cooling is important for cold pool strength and rain enhancement in both cases. However, ice microphysics play a larger role in the midlatitude case compared to the tropical. Detailed analysis of the vertical velocity governing equation shows that temperature buoyancy can enhance updrafts/downdrafts in the middle/lower troposphere in the convective core region; however, the vertical pressure gradient force (PGF) is the same order and acts in the opposite direction. Water loading is small but on the same order as the net PGF-temperature buoyancy forcing. The balance among these terms determines the intensity of convection.
Keywords: aerosol, CCN, precipitation, cold pool, latent heat, convection
1. Introduction
Aerosols are a critical factor in the atmospheric hydrological cycle and radiation budget. As a major reason for clouds to form and a significant attenuator of solar radiation, aerosols affect climate in several ways. Current research suggests that aerosol effects on clouds could further extend to precipitation, both through the formation of cloud particles and by exerting persistent radiative forcing on the climate system. However, the various mechanisms behind these effects, in particular the ones connected to precipitation, are not yet well understood [see reviews by Levin and Cotton, 2008, Khain, 2009, and Tao et al., 2012].
Compared to typical global circulation and climate models, cloud-resolving models (CRMs) use more sophisticated and relatively realistic representations of cloud microphysical processes, and they can reasonably well resolve the structure and life cycles of clouds and cloud systems (with sizes ranging from about 2–1000 km). CRMs also allow for direct interaction among clouds, outgoing longwave (cooling) and incoming solar (heating) radiation, as well as ocean and land surface processes [see reviews by Tao, 2003, 2007; Randall et al., 2003; and Tao and Moncrieff, 2009]. There are several major advantages in using CRMs to study the interactive processes between clouds, precipitation and aerosols. For example, the use of a sophisticated microphysics scheme (liquid and ice) and a fine horizontal resolution can provide relatively realistic cloud optical properties, which are crucial for determining radiation budgets. With a high spatial resolution, each atmospheric grid is considered either completely cloudy (overcast) or clear; no partial cloudiness is assumed as with GCMs. In addition, the life cycle of clouds, precipitation and aerosols can be simulated by CRMs. CRMs can also have better cloud dynamic processes in terms of aerosol transport [see reviews by Thompson et al., 1997; Ekman et al., 2004, 2006; and Yin et al., 2005].
Recently, many different studies have used CRMs to examine the role of aerosols on mixed-phase convective clouds (c.f., Table 1). These modeling studies have many differences in terms of model configuration (two- vs three-dimensional, single case study vs ensemble simulations), domain size, grid spacing (150 – 3000 m), microphysics (i.e., two-moment bulk, simple or sophisticated spectral-bin), turbulence (1st or 1.5 order turbulent kinetic energy), radiation, lateral boundary conditions (i.e., closed, cyclic or radiative open), cases (isolated convection vs organized systems) and model integration time (e.g., from 2.5 to 48 up to 100s of hours in order to reach convective-radiative equilibrium). A simple metric, the percent change in time-integrated precipitation (dP = 100 * (Phigh – Plow) / Plow) as a result of a set increase in the number concentration of CCN (dN0 = Nhigh – Nlow), has been used to examine the impact of aerosol concentration on surface rainfall. Phigh – Plow is the difference in surface rainfall between the high and low CCN concentrations, and Nhigh – Nlow is the number concentration difference between the high and low CCN. Among these modeling studies, the most striking difference is that cumulative precipitation can either increase or decrease in response to higher concentrations of CCN. Phillips et al. [2002], Khain et al. [2004, 2005], Khain and Pokrovsky [2004], Teller and Levin [2006], Cheng et al. [2010], Fan et al. [2013], Saleeby et al. [2010], Storer et al. [2010], Seigel et al. [2013], and Grant and van den Heever [2015] changed the number concentrations of CCN gradually and found robust decreases in cumulative precipitation for higher concentrations of CCN. This is completely opposite from the results from Wang [2005], Khain et al. [2005], Lee et al. [2009], Fan et al. [2007b], Lebo and Morrison [2014], and Igel et al. [2013]. Variations in the microphysics scheme, vertical wind shear, atmospheric static stability and relative humidity (dry vs. moist) could lead to different aerosol impacts on precipitation [Storer et al., 2010; Fan et al., 2012a,b; Storer and van den Heever, 2013; Kalina et al., 2014; Grant and van den Heever, 2015]. Also, the different stages of a convective system’s life cycle may also respond differently to changes in aerosols in terms of precipitation [Tao et al., 2007; van den Heever and Cotton, 2007]. Note that these modeling studies are for different convective systems that developed in different environments, and the results are based on different models and microphysical schemes
Table 1:
Summary of precipitation sensitivity (dP) to increases in the number of CCN (dN0) for different studies. Note that van den Heever et al. [2006] used a linear CCN concentration profile that ranged from 300 cm−3 at 4 km above ground level to 1000 cm−3 near the surface; GCCN and IN effects from van den Heever et al. [2006] and Teller and Levin [2006] are excluded from the table; only five of the total 30 cases from Wang [2005] are displayed in the table. Updated and modified from Tao et al. [2007]. The results from van den Heever et al. [2011, 2013] are based on 100-day integrations using a 10,000-km domain with cyclic lateral boundary conditions, whereas Morrison and Grabowski [2011] are based on 6-day integrations, a 240-km domain, and 240 ensembles with imposed large-scale advective forcing. Note that this list of papers is not complete. This table was adapted from Tao et al. [2007, 2012].
| Reference | case | dN0 (Nclean) [cm−3] CNN # | dP (%) | Model specifications | |
|---|---|---|---|---|---|
| Phillips et al. [2002] | New Mexico | 1950 (800) | −14. | 1D, bin | |
| 4200 (800) | −30. | 1D, bin | |||
| Khain and Pokrovsky [2004] | Texas | 40 (10) | −16. | 2D, bin | |
| 90 (10) | −19. | 2D, bin | |||
| 290 (10) | −53. | 2D, bin | |||
| 1250 (10) | −88. | 2D, bin | |||
| Khain et al [2005] | GATE | 1160 (100) | −3. | 2D, bin | |
| Khain et al [2005] | PRESTORM | 1160 (100) | +258. | 2D, bin | |
| Wang [2005] | ITCZ | 400(100) | +180. | 3D, bulk | |
| 800 (100) | +340. | 3D, bulk | |||
| 1,200(100) | +540. | 3D, bulk | |||
| 1,500 (100) | +700. | 3D, bulk | |||
| Lynn et al. [2005] | Florida | 1,250 (10) | −5. | 3D, bin, 400×199 | |
| Teller and Levin [2006] | Winter-time eastern Mediterranean | 210(100) | −27. | 2D, bin | |
| 510 (100) | −55. | 2D, bin | |||
| 810 (100) | −73. | 2D,bin | |||
| 1,260 (100) | −93. | 2D, bin | |||
| van den Heever et al. [2006] | CRYSTAL | 350 (300) | −22. | 3D, bulk | |
| Tao et al [2007] | TOGA COARE | 2400 (100) | +58. | 2D, bin, 1024 grid | |
| PRESTORM | 1900 (600) | −24. | 2D, bin, 1024 grid | ||
| CRYSTAL | 1900 (600) | −13. | 2D, bin, >1024 grid | ||
| Fan et al [2007a] | A sea-breeze induced convective event (Houston, TX) | 30,000 (3000) | +9. | 2D, bin | |
| van den Heever and Cotton [2007] | METROMEX (St. Louis, June 8, 1999 convective storm) | 3D, bulk | |||
| GCCN = 0.01 cm−3 | Early stage | 2000 (800) | −12 | 3D, bulk | |
| Late stage | 2000 (800) | −1 | 3D, bulk | ||
| GCCN = 0.1 cm−3 | Early stage | 2000 (1200) | +5 | 3D, bulk | |
| Late stage | 2000 (1200) | −2 | 3D, bulk | ||
| GCCN = 0.2 cm−3 | Early stage | 2000 (1200) | +26 | 3D, bulk | |
| Late stage | 2000 (1200) | −1 | 3D, bulk | ||
| Lee et al [2008a,b,2009] | ARM-A | 900 (100) | + 18. | 2D, bulk | |
| Fan et al [2009] | TWP-ICE and China | 1,100 (110) | +/− (Depends on the wind shear | 2D, bin | |
| Lee and Feingold [2010] | TWP-ICE | 450 (50) | +9. | 2D, bin | |
| Cheng et al [2010] | A front system (Northern Taiwan) | 9,000 (1000) 900 (100) |
−12 ~0 |
3D, bulk | |
| Saleeby et al [2010] | Marine Warm Rain Events: January 22–23, 1998; February 2–3, 2004; April 2–3, 2007 (East China Sea) | Observed AOD for each event, ranging from 0.02 to 0.7 optical depth | 3D, bulk | ||
| ¼ x OBS | −38 | 3D, bulk | |||
| ½ x OBS | −21 | 3D, bulk | |||
| Observed AOD (OBS) | - | 3D, bulk | |||
| 2 x OBS | −3.5 | 3D, bulk | |||
| Storer et al. [2010] | Idealized Super Cells | 100 (6,400) | −30–40 | 3D, bulk | |
| van den Heever et al [2011] | TOGA COARE Tropical R-C Equilibrium | 25 (375) 400–1,600 |
+2 −6 |
2D, bulk | |
| Morrison and Grabowski [2011] | TWP-ICE | 354, 2,780, 6,130 | −0.4 | 2D, bulk | |
| Fan et al [2012a] | AMF-China | 8600 (1600) |
+18% for SBM −12% for Morrison |
3D, bin, 251×201 | |
| Fan et al. [2012b] | AMF-China: weak and strong wind shear SGP: weak and strong wind shear | 1700 (280) | Weak wind shear: +7% for AMF-China (warm cloud base) and +4% for SGP (cold cloud base) Stronger wind shear: +3% for AMF-China and −4% for SGP. | 3D, bin | |
| Fan et al [2013] | Long-time (monthly) simulations at TWP, SGP and Southeast China | 1700 (280) | +5 to +7% at TWP and SEC −2% at SGP (decrease and increase offset). Rain rate PDF changed significantly. | 3D, bin, 300×300 | |
| Igel et al [2013] | North American Extra- tropical Cyclone, (Warm Front Region) | 800 (400) | +1.4 | 3D, bulk | |
| 1600 (400) | +2.1 | 3D, bulk | |||
| Seigel et al [2013] | Idealized Squall Line (Africa) | ~30, 125, 175 (Vertical varied with Maximum value) | ~ −20–30 | 3D, bulk | |
| Storer and van den Heever [2013] | Tropical Deep Convection (TOGA COARE) | 100 (900) 800 (2400) |
−25 ~+10 |
2D, bulk | |
| Grant and van den Heever [2014] | Idealized Sea Breeze Convection (Africa) | 500 (200) | −15% | 3D, bulk | |
| 2000 (200) | −40% | 3D, bulk | |||
| Lebo and Morrison [2014] | Idealized Squall Line | 100(900) | +20 Weak wind shear | 3D, bulk | |
| Kalina et al [2014] | Idealized Super Thunderstorms | 100 – 10,000 100 – 5,000 |
−50% (low RH) + <5 % (high RH) (Depends on moist/dry condition) |
3D, bulk | |
| Grant and van den Heever [2015] | Idealized Supercell (moist profile) | 400 (100) | ~ +10 | 3D, bulk | |
| 1600 (100) | ~ −5 | ~ | |||
| Idealized Supercell (low-level dry layer) | 400 (100) | ~ −2 | ~ | ||
| 1600 (100) | ~ −20 | ~ | |||
| Idealized Supercell (mid-level dry layer) | 400 (100) | 0 | ~ | ||
| 1600 (100) | ~ −20 | ~ | |||
| Idealized Multicell (moist profile) | 400 (100) | ~ −1 | ~ | ||
| 1600 (100) | ~ +1 | ~ | |||
| Idealized Multicell (low-level dry layer) | 400 (100) | ~ +20 | ~ | ||
| 1600 (100) | ~ +100 | ~ | |||
| Idealized Multicell (mid-level dry layer) | 400 (100) | 0 | ~ | ||
| 1600 (100) | ~ −15 | ~ | |||
Different physical processes have been proposed to explain aerosol impacts on deep convective precipitation. These processes include latent heating (LH), cold-pool dynamics and ice microphysics. However, these hypotheses were based on different models and different cases. In this paper, three different hypotheses are examined using the same model with the same microphysics scheme and same cases. The relationships between LH, convective updrafts and downdrafts and precipitation processes with different aerosol concentrations, and the different physical processes responsible for the aerosol impact on precipitation are also examined. CRM simulations based on two deep convective precipitation systems from vastly different environments, one tropical oceanic and one midlatitude continental, and that have differing surface rainfall responses to changes in aerosols, will be used for this study.
The physical processes hypothesized to invigorate convection are reviewed in section 2. Section 3 describes the model and cases used in this study. The results including sensitivity tests on evaporative cooling, and the summary, are presented in sections 4 and 5, respectively.
2. Physical Processes Responsible for the CCN Effect on Precipitation
In general, three mechanisms have been proposed to explain the enhancement of precipitation due to changes (increased or decreased) in the aerosol concentration and are described in the following subsections.
2.1. Latent Heating Effect
The first mechanism is the creation of stronger updrafts/downdrafts resulting from enhanced latent heat release for high-CCN scenarios. This effect can be termed the latent heat – dynamic effect, which includes LH from both condensational growth and the freezing of water drops. Wang [2005], Rosenfeld et al., [2008] and Li et al. [2013] indicated that precipitation increases in tropical deep convection due to higher CCN concentrations through this latent heat effect. Khain et al. [2005] also found that for cases where there were enhanced precipitation with higher CCN concentrations, clouds were associated with stronger updrafts/downdrafts as well as stronger convergence in the boundary layer, which increases the chance to trigger secondary clouds and prolong the lifetime of convective systems. Van den Heever and Cotton [2007], Lee et al. [2008] and Storer et al. [2010] also demonstrated the influence of aerosols on secondary storm development and its effect on increasing precipitation.
2.2. Cold Pool Effect
The second mechanism is based on the potential for stronger evaporative cooling due to more but smaller cloud droplets under high CCN concentration conditions. Stronger evaporative cooling can enhance the strength of the near surface cold pool. When the enhanced cold pool interacts with low-level wind shear, convergence can become stronger, producing more vigorous convection that ultimately leads to enhanced surface precipitation [i.e., Khain et al., 2005, Tao et al., 2007]. This positive feedback mechanism is termed the cold pool effect. Note that stronger evaporative cooling occurs in the developing stages of convective cloud systems. Lee et al. [2009] also demonstrated that stronger evaporative cooling occurred under higher aerosol concentrations and consequently lead to enhanced surface precipitation. Lebo and Morrison [2014] showed that changes in aerosol loading could alter raindrop size and number concentration, which can affect cold pool strength via changes in evaporation. The balance between the cold pool and low-level wind shear–induced vorticity [Rotunno et al., 1988] can therefore be changed by an aerosol perturbation. However, there are other studies (both modeling and observational) in the literature that find that under higher CCN concentrations there are fewer but larger raindrops, reduced evaporation rates and therefore warmer cold pools [e.g., Altaratz et al., 2007, Storer et al., 2010; May et al., 2011; Saleeby et al., 2010, Khain et al., 2011, Morrison, 2012, Loftus and Cotton, 2014, Grant and Van den Heever, 2015].
2.3. Cold Microphysics Effect
The third mechanism is the CCN effect on ice-phase microphysics. For example, Wang [2005] and Rosenfeld et al. [2008] suggested that with higher CCN concentrations, there is a greater increase in total water content consisting of numerous small liquid particles. This leads to less efficient collision-coalescence and hence less raindrop formation, which allows for more droplets to be carried above the freezing level and become supercooled where they can then enhance riming. This can then enhance latent heat release via freezing. Among the major microphysical conversion processes, riming is found to be most sensitive to aerosol concentration [Cheng et al., 2010]. As a result, rain production is mainly from ice phase microphysics. Cheng et al. [2010] further showed that increasing the CCN concentration leads to more cloud droplets and cloud ice. Storer and van den Heever [2013] also showed that the collision and coalescence processes and the production of rain from ice are sensitive to aerosol concentrations. The impact of changes in cloud droplets and cloud ice on the resulting surface precipitation is termed the cold microphysics effect.
The three physical mechanisms can affect each other, making it difficult to isolate each mechanism independently. For example, stronger evaporative cooling (the cold pool effect) can be due to more evaporation associated with stronger convective downdrafts (the latent heating effect). The cold microphysics effect can affect both the latent heating and the cold pool effect and vise-versa. More numerous cloud droplets (due to more CCN) can also lead to more ice nucleation and thus a higher number of snow and graupel particles which, when melted, form more but smaller raindrops that cause stronger evaporative cooling below the cloud base. Convection may be strengthened due to either the latent heating effect or the cold pool effect with the induced stronger updrafts then leading to higher super-saturation and thus enhanced ice deposition and nucleation.
3. Numerical model and cases
3.1. Model
The model used in this study is the same as in Tao et al. [2007]. It is the two-dimensional (2D) version of the Goddard Cumulus Ensemble (GCE) model. The equations that govern the cloud-scale motion are anelastic by filtering out sound waves. The subgrid-scale turbulence used in the model is based on Klemp and Wilhelmson [1978]. The effect of condensation on the generation of subgrid-scale kinetic energy is also incorporated into the model [Soong and Ogura, 1980]. The model includes interactive solar [Chou et al., 1998] and thermal infrared [Chou and Suarez, 1994] radiation parameterization schemes.
The spectral-bin microphysics developed by Khain et al. [2005] has been implemented into the GCE model [Tao et al., 2007 and Li et al., 2009]. Its ice-phase collection coefficients have been modified based on comparisons with radar observations [Li et al., 2010]. The collisional growth formulation is based on solving stochastic kinetic equations for the size distributions of water droplets (cloud droplets and raindrops), and six types of ice particles: pristine ice crystals (columnar and plate-like), snow (dendrites and aggregates), graupel, and frozen drops/hail. In the scheme, hail is high density and originates from the direct freezing of water drops and grows via the collection of super-cooled water while graupel is moderate density and forms when snow aggregates collect super-cooled water droplets. Each hydrometeor type is described by a size distribution using 33 categories (mass bins). Size spectra of atmospheric aerosols are also described using 33 bins. The initial aerosol size distribution is represented by the sum of 3 lognormal distributions [Jaenicke, 1993]:
where D is the particle diameter, N is the number concentration, and σ is the standard deviation of the log-normal distributions. The subscript i represents three different size modes in atmospheric aerosols: the Aitken mode, the accumulation mode and the coarse mode. This size distribution (activation) is different from that used in Tao et al. [2007]. The marine background spectrum (Ni=133, 66.6, and 3.1 cm−3; Di = 0.008, 0.266 and 0.58 μm, and logsi= 0.657, 0.210 and 0.396) is used for the TOGA COARE control case, and the remote continental spectrum (Ni=3200, 2900, and 0.3 cm−3; Di = 0.02, 0.116 and 1.8 μm, and logsi= 0.161, 0.217 and 0.380) is used for the PRESTORM control case. In the high CCN scenarios, the background number concentrations are simply increased by 10 fold. Aerosol concentration is held constant with height for particles with radius smaller than 2μm. The large aerosol concentration is constant from the surface to 1 km, and then decreases exponentially with an e-folding factor of 2 km.
The aerosol spectra were taken from Jaenicke [1993] and are compilations of ground measurements at various locations. These spectra are based on data from different observations and are normalized consistently. Since aerosol observations are not available for either PRESTORM or TOGA COARE cases, these observation-based aerosol concentrations were used to represent aerosol concentrations in different environmental conditions (oceanic vs. continental). The high values in the remote continental spectrum are mainly in the Aitken mode and accumulation mode. There are two pieces of evidence that suggest that these values are not saturating the aerosol effect. First, only the coarse mode and the tail (large sizes) of the accumulation mode become activated in the PRESTORM case. The actual cloud droplet concentrations are comparable to the previous study [Tao et al., 2007] where an idealized CCN=C*Sk spectrum was used. Second, similar small aerosol effects were presented in Tao et al. [2007] for the same PRESTORM case with C=600 cm−3 for the low-CNN scenario and 6000 cm−3 for the high-CNN scenario. The vertical aerosol distributions of aerosols are based on field observation results [i.e., Fridlind et al., 2012]. Aerosols enter and exit via the open lateral boundaries. The lower boundary is held constant. Aerosol wet deposition is included in the simulations, but dry deposition is ignored. The environment becomes cleaner after precipitation passes through.
All scalar variables (potential temperature, mixing ratio of water vapor, turbulence coefficients, and all hydrometeor classes) use forward time differencing and a positive definite advection scheme with a non-oscillatory option [Smolarkiewicz and Grabowski, 1990]. The dynamic variables, u and w, use a fourth-order accurate advection scheme and leapfrog time integration. Details of the GCE model description and improvements can be found in Tao and Simpson [1993] and Tao et al. [2014].
Radiative open lateral boundary conditions are used [Klemp and Wilhelmson, 1978]. A large horizontal domain is used in this study to simulate the large convective system and minimize the reflection of convectively-generated gravity waves at the lateral boundaries [see Fovell and Ogura, 1988]. The top boundary condition is free slip (i.e., the vertical velocity is assumed to be zero as are the vertical gradients of horizontal wind velocity and other scalar variables). In addition, a Rayleigh relaxation (or damping) layer is applied above 15 km to damp convectively-generated gravity waves near the top of the model domain, which is above 20 km. There are 1024 horizontal grid points with a resolution of 1 km in the center 720 points and laterally-stretched grids on either side. Use of the stretched horizontal grid makes the model less sensitive to the choice of gravity wave speed associated with the open lateral boundary conditions [Fovell and Ogura, 1988]. For the present study, a stretched vertical coordinate with 33 levels is used. The model has finer resolution (80 and 40 meters for the PRESTORM and TOGA COARE cases, respectively) in the boundary layer and coarser resolution (about 1000 meters) at upper levels. The model time step is 5 s. Convection is initiated by imposing a cold air mass at the beginning of the simulation, imitating the cold pool dynamics that generate new convection at the leading edge of the respective squall lines.
3.2. Cases
Two cases from vastly different environments, a tropical oceanic squall system observed during TOGA COARE (the Tropical Ocean and Global Atmosphere Coupled Ocean-Atmosphere Response Experiment, which occurred over the Pacific Ocean warm pool from November 1992 to February 1993), and a midlatitude continental squall system observed during PRESTORM (the Preliminary Regional Experiment for STORM-Central, which occurred in Kansas and Oklahoma during May-June 1985), are used to identify the physical processes that are responsible for enhancing the precipitation processes associated with deep convective systems as a result of changing CCN concentrations.
The 22 February 1993 TOGA COARE squall line has been well studied [Jorgensen et al., 1997; Redelsperger et al., 2000; Trier et al., 1996, 1997; Wang et al., 1996, 2003]. The sounding used to initialize the model is from LeMone et al. [1994]. Surface fluxes are included in the model for this case using the TOGA COARE flux algorithm [Fairall et al., 1996; Wang et al., 1996]. The 10–11 June 1985 PRESTORM case has also been well studied [e.g., Johnson and Hamilton, 1988; Rutledge et al., 1988; Tao et al., 1995, 1996; Yang and Houze, 1995; Lang et al., 2003]. The PRESTORM environment is fairly unstable and relatively dry. The model is initialized with a single sounding taken at 2330 UTC from Pratt, KS, which was taken ahead of the squall line. Radiation is included but not surface fluxes. The freezing level is approximately 4.5 km for the TOGA COARE case and 3 km for the PRESTORM case. Both the TOGA COARE and PRESTORM cases are well-organized, long-lived mesoscale convective systems. These two cases were also simulated by Tao et al. [2007] and found to have different responses to changes in CCN concentration.
The two cloud systems presented in this study formed into organized, linear structures (i.e., squall lines). A 2D simulation, therefore, can provide a reasonable approximation of their line-normal structure. Since the real atmosphere is 3D, further 3D cloud-resolving simulations are still needed to address aerosol-precipitation interactions. In addition, a finer resolution and large domain are required to solidify interactive aerosol-cloud-precipitation processes further.
3.3. Numerical Experiments
A total of ten numerical experiments are conducted; Table 2 shows the numerical experiments (names), their descriptions and domain mean rainfall amount. The first two (P-low and P-high) experiments are for the PRESTORM case using low and high CCN concentrations, respectively. The third and fourth (T-low and T-high) are for the TOGA COARE case using low and high CCN concentrations, respectively. The next four experiments (P-low-warm, P-high-warm, T-low-warm, and T-high-warm) are the same as the first four experiments except that they use warm rain physics only. The P-low-evap and T-high-evap cases are used to examine the impact of evaporation processes on aerosol-precipitation interaction. More discussion on the numerical experiments is presented in the following section.
Table 2:
Numerical experiments performed in this study. “P” and “T” stand for the PRESTORM and TOGA COARE cases, respectively. “low” and “high” stand for low and high CCN concentration, respectively. “Warm” is for warm rain only, and “evap” indicates reduced evaporative cooling.
| Case Name | Description | Domain mean rainfall (mm) |
|---|---|---|
| P-low | PRESTORM continental case clean/background CCN over land | 58.4 |
| P-high | 10 times CCN concentration as P-low | 40.7 |
| P-low-warm | Same as P-low except for all ice microphysics are off | 60.7 |
| P-high-warm | Same as P-high except for all ice microphysics are off | 61.8 |
| P-low-evap | Same as P-low except for evaporation is turned off from the surface to 3km, between 1 and 3 hours | 51.0 |
| T-low | TOGA-COARE maritime case clean/background CCN over ocean | 19.0 |
| T-high | 10 times CCN concentration as T-low | 33.0 |
| T-low-warm | Same as T-low except for all ice microphysics are off | 18.0 |
| T-high-warm | Same as T-high except for all ice microphysics are off | 24.7 |
| T-high-evap | Same as T-high except for evaporation is turned off from the surface to 4km, between 0 and 1.5 hours | 26.4 |
4. Results
Figure 1 shows time sequences of the model-estimated domain mean surface rainfall rate for the TOGA COARE and PRESTORM cases. Note that there are some minor differences between these and previous results published in Tao et al. [2007]. These differences are due to the use of a different CCN activation. Nevertheless, the main results are the same between this and the Tao et al. [2007] study. For example, rain suppression in the high CCN concentration (i.e., polluted environment) runs is evident in both studies for both cases but only during the first hour of the simulations, while rain reaches the ground early in both studies for low CCN situations for both cases. Also, during the mature stage of the simulations, the effect of increasing the CCN concentration ranges from rain suppression in the PRESTORM case to rain enhancement in the TOGA COARE case (see Table 2 for the detailed amounts for this study). These results still indicate that model simulations of the whole life cycle of convective system are needed in order to assess the impact of aerosols on precipitation processes. Please see Tao et al. [2007, 2012] for more discussion.
Figure 1:

Time series of GCE model-simulated domain mean surface rainfall rate (mm h-1) for the (a) TOGA COARE and (b) PRESTORM case. The blue and red lines represent the low CCN and high CCN scenario, respectively.
4.1. Latent heating and evaporative cooling effects
Total LH consists of condensation, deposition, and freezing. Time series of total LH for the high- and low-CCN scenarios are shown in Fig. 2 for the TOGA COARE case. The model results clearly show that the total LH in the T-high scenario is much larger than that for the T-low during the 12 h model integration. In addition, the mean total LH profiles show that heating reaches higher in altitude, indicating taller cloud tops and stronger convection for the T-high simulation. Figures 2(c) and (d) also indicate that the low-level evaporative cooling is quite different between the T-low and T-high scenarios. The high CCN scenario shows stronger, deeper evaporative cooling profiles than the low (also see Fig. S1 in the supplement). Stronger evaporative cooling can enhance the near surface cold-pool strength. When the cold pool interacts with the low-level wind shear, the convergence could become stronger, producing stronger convection in the T-high case (see Fig. S2 in the supplement). This can lead to more vigorous precipitation and therefore enhanced surface precipitation (i.e., a positive feedback).
Figure 2:

Time-height cross sections of model-simulated domain mean total heating (K h-1) for the TOGA COARE case for the (a) T-low and (b) T-high scenario. (c) and (d) are the same as (a) and (b) except for evaporative cooling (K h-1).
Rain suppression in the PRESTORM high CCN concentration (i.e., polluted environment) run is evident for the P-high scenario (Fig. 1b). The total LH in the P-high scenario is slightly weaker than in the P-low at upper levels (~ above 7 km) during the 12-h model integrations (Figs. 3a and b). The evaporative cooling is also slightly weaker at low altitude (surface to 3 km) for the high-CCN run (Figs. 3c and d). These results are completely opposite to the TOGA COARE case wherein stronger evaporative cooling and LH occur in the high-CCN run. In addition, the total LH and evaporative cooling are much stronger in the PRESTORM case than those in the TOGA COARE case. This result is due to the high convective available potential energy (CAPE) and drier environmental in the PRESTORM case (see Table 3 in Tao et al. 2007).
Figure 3:

Time-height cross sections of model-simulated domain mean total heating (K h-1) for the PRESTORM case for (a) P-low (low CCN) and (b) P-high (high CCN) conditions. (c) and (d) are the same as (a) and (b) except for evaporative cooling (K h-1). Note the color bar scales are different from the TOGA COARE case in Figure 2.
More rain reaches the surface after an hour and a half of model integration in the T-high simulation as compared to the T-low simulation (Fig. 1a). During this period, more evaporative cooling in the T-high simulation is already evident from the model results (Fig. 2d). Figures 4(a) and (b) show the vertical profiles of the time and domain mean LH and evaporative cooling during the early stage of the simulated TOGA COARE high and low CCN scenarios. During the first hour of model integration, evaporative cooling is stronger (2–3 K/day), and LH is also slightly stronger (less than 0.5 K/day) for the T-high scenario. Evaporative cooling is still stronger and occurs in a narrow area near the leading edge of the system for the T-high run for the first two hours of model integration (see Fig. S1 in the supplement). The strongest evaporative cooling for the T-low run is not at the leading edge of the system. The strongest LH occurs in a narrow region and at the leading edge of the system for both the T-high and T-low scenarios (see Fig. S1 in the supplement), but LH is much stronger for the T-high scenario than the T-low after 1.5 h model integration. Peak LH is between 2 and 5 km and indicates development of low-level cloud (warm-rain) during the first two hours of model integration (Fig. 2). Note that the strongest LH occurs between 2 and 3 hours of model integration for the T-high scenario (Fig. 2a).
Figure 4:

Profiles of domain-average microphysical heating/cooling rates: (a) total heating between 0 and 60 minutes for the TOGA COARE experiments, (b) total evaporative cooling for the TOGA COARE experiments between 0 and 60 minutes, (c) total latent heating between 60 and 150 minutes for the PRESTORM experiments, and (d) total evaporative cooling for the PRESTORM experiments between 60 and 150 minutes. The solid and dashed lines represent the low and high CCN scenarios, respectively.
The total LH profiles, especially above 5 km, are quite similar for the low and high-CCN scenarios during the first 1 to 2.5 hours of model integration for PRESTORM case (Fig. 4c). But, the total LH is stronger (1–2 K/day) between 2 and 4 km for the P-low scenario. The evaporative cooling is also stronger at lower levels in the P-low run for the PRESTORM case (Fig. 4d). This could be related to the early onset of rainfall in that run and because rain evaporation dominates the lower levels for this case. Note that the results show that there are less small rain (< 2 mm) droplets for the P-high scenario than the P-low. In addition, the strongest evaporative cooling is located in a very narrow region at the leading edge after 3.5 hours of model integration in the P-low run in contrast to the P-high (see Fig. S3 in the supplement). The results also show that strong LH occurs within a narrow region and at the leading edge of each system for both the P-high and P-low runs as with the TOGA COARE runs (see Fig. S3 in the supplement)
The role of total LH and evaporative cooling with regard to enhancing surface rainfall is examined during the developing/early stages of the TOGA COARE and PRESTORM cases. For TOGA COARE, LH is slightly larger for the high-CCN scenario than the low; however, low-level evaporative cooling is stronger for the high-CCN scenario. The low-level evaporative cooling and its interaction with the low-level convergence zone could be the key physical process that enables more surface rainfall to be generated for the TOGA COARE squall line under high aerosol loading. For the PRESTORM case, P-low does have more small raindrops. It also has more low-level evaporative cooling compared to P-high. Also, with the dry environment in the PRESTORM case, evaporation rates will be high in both the clean and polluted scenarios, and hence the impact of aerosols may be reduced. In contrast, the moist environment limits the evaporation rates in the TOGA COARE case such that aerosols may be required to make droplets sufficiently small in order to achieve reasonable evaporation rates [Tao et al., 2007].
Figure 5 shows Hovmoller diagrams of low-level convergence and low-level equivalent potential temperature perturbations for the P-low and P-high simulations. The low-level equivalent potential temperature perturbations (averaged vertically from the lowest model level to z=3 km) can be used as an indicator of the cold pool strength. Only the first 4 hours of data are plotted here in order to emphasize details of the cold pool structures because the differences in surface rainfall (Fig. 1b) and evaporative cooling (Figs. 3c and d) already emerged within this time. Figures 5e and 5f also show the vertical structure of the equivalent potential temperature perturbations and convective updrafts (contour lines at 1, 5 and 10 m/s). Both cases simulate a narrow, linear convective system. The low-level convergence and cold pool are both stronger in the P-low scenario than in the P-high scenario. These features are clearly shown after 1.5 hours of model integration. Evaporative cooling at the lowest levels is also stronger in the P-low case after 1.5 hours (Figs. 3c and 3d) as is the surface rainfall (Fig. 1b). The highest surface rainfall rates are located in the low-level convergence zone. The vertical cold pool structure is only slightly stronger in the P-low scenario than the P-high scenario. The convective updrafts are located near and above the cold pool. There are also remnants of convective cells above the cold pool and over a broad area that extends 100 km from the leading edge of the system. This feature has been observed [i.e., Rutledge et al., 1988 and Johnson and Hamilton, 1988] and simulated by many CRMs [i.e., Dudhia et al., 1987; Rotunno et al., 1988; Lafore and Moncrieff, 1989 and many others]. Note that the maximum convective updrafts are quite similar between the P-high and P-low scenarios [shown in Fig. 3 in Tao et al., 2007]. The small differences in maximum updrafts are due to the PRESTORM environment being fairly unstable with a CAPE of 2300 J/kg.
Figure 5:

Near surface convergence and cold pool structures for the PRESTORM case. Near surface convergence (the average from the surface to z=3 km) for the P-low and P-high scenarios is plotted in 5(a) and 5(b), respectively. The thin black lines in 5(a) and 5(b) indicate 0.01 mm/hr of surface rainfall and the thick black lines 5 mm/hr of surface rainfall. The middle two panels are Hovmoller diagrams of near surface equivalent potential temperature perturbation (averaged from the surface to z=3 km) for the P-low 5(c) and P-high 5(d) scenarios. Vertical cross of instantaneous equivalent potential temperature perturbation at 3 hours are plotted in 5(e) for P-low and 5(f) for P-high. The black contour lines indicate vertical velocities of 1 m/s, orange contours 5 m/s, and red contours 10 m/s.
There are similarities and differences between the PRESTORM and TOGA COARE cases in terms of low-level convergence, cold pools, and the vertical structures of the simulated systems (Fig. 6). Both the PRESTORM and TOGA COARE cases have narrow low-level convergence zones, cold pools at the leading edge of the system and convective updrafts located above the cold pools. However, the cold pools and convective updrafts are much weaker in the TOGA COARE case due to a weaker CAPE (1776 J/kg) as compared with the PRESTORM case. Also, surface rainfall was enhanced in the high CCN simulation, T-high, which was not the case for PRESTORM. Low-level convergence is stronger in the T-high simulation than in the T-low (Fig. 6 a and b). It is much stronger than in the T-low after 1.5 hours of model integration. The low-level cold pool is also stronger in the T-high run than in the T-low between 0.5 and 1.5 hours of model integration. This is consistent with the evaporative cooling shown in Fig. 2. There is more rainfall (i.e., enhancement) in the T-high scenario than in the T-low after 1.5 hours of model integration (Fig. 1a). Figure 6 also shows that the cold pool is “warmer” at the leading edge of the stronger convergence zone in the T-low scenario. The cold pool is “colder” at the leading edge of or close to the stronger convergence zone in the T-high scenario, especially after initial stage of model simulations. This feature is also shown in the vertical structures (Figs. 6e and f) and is the reason for the more upright vertical velocity structure shown in Fig. 6f. Therefore, the enhanced cold pool (driven by evaporative cooling) interacting with convergence can allow for new (or secondary) clouds to be deeper. This could also enhance rainfall in the T-high scenario (compared to the T-low) in the TOGA COARE precipitation system.
Figure 6:
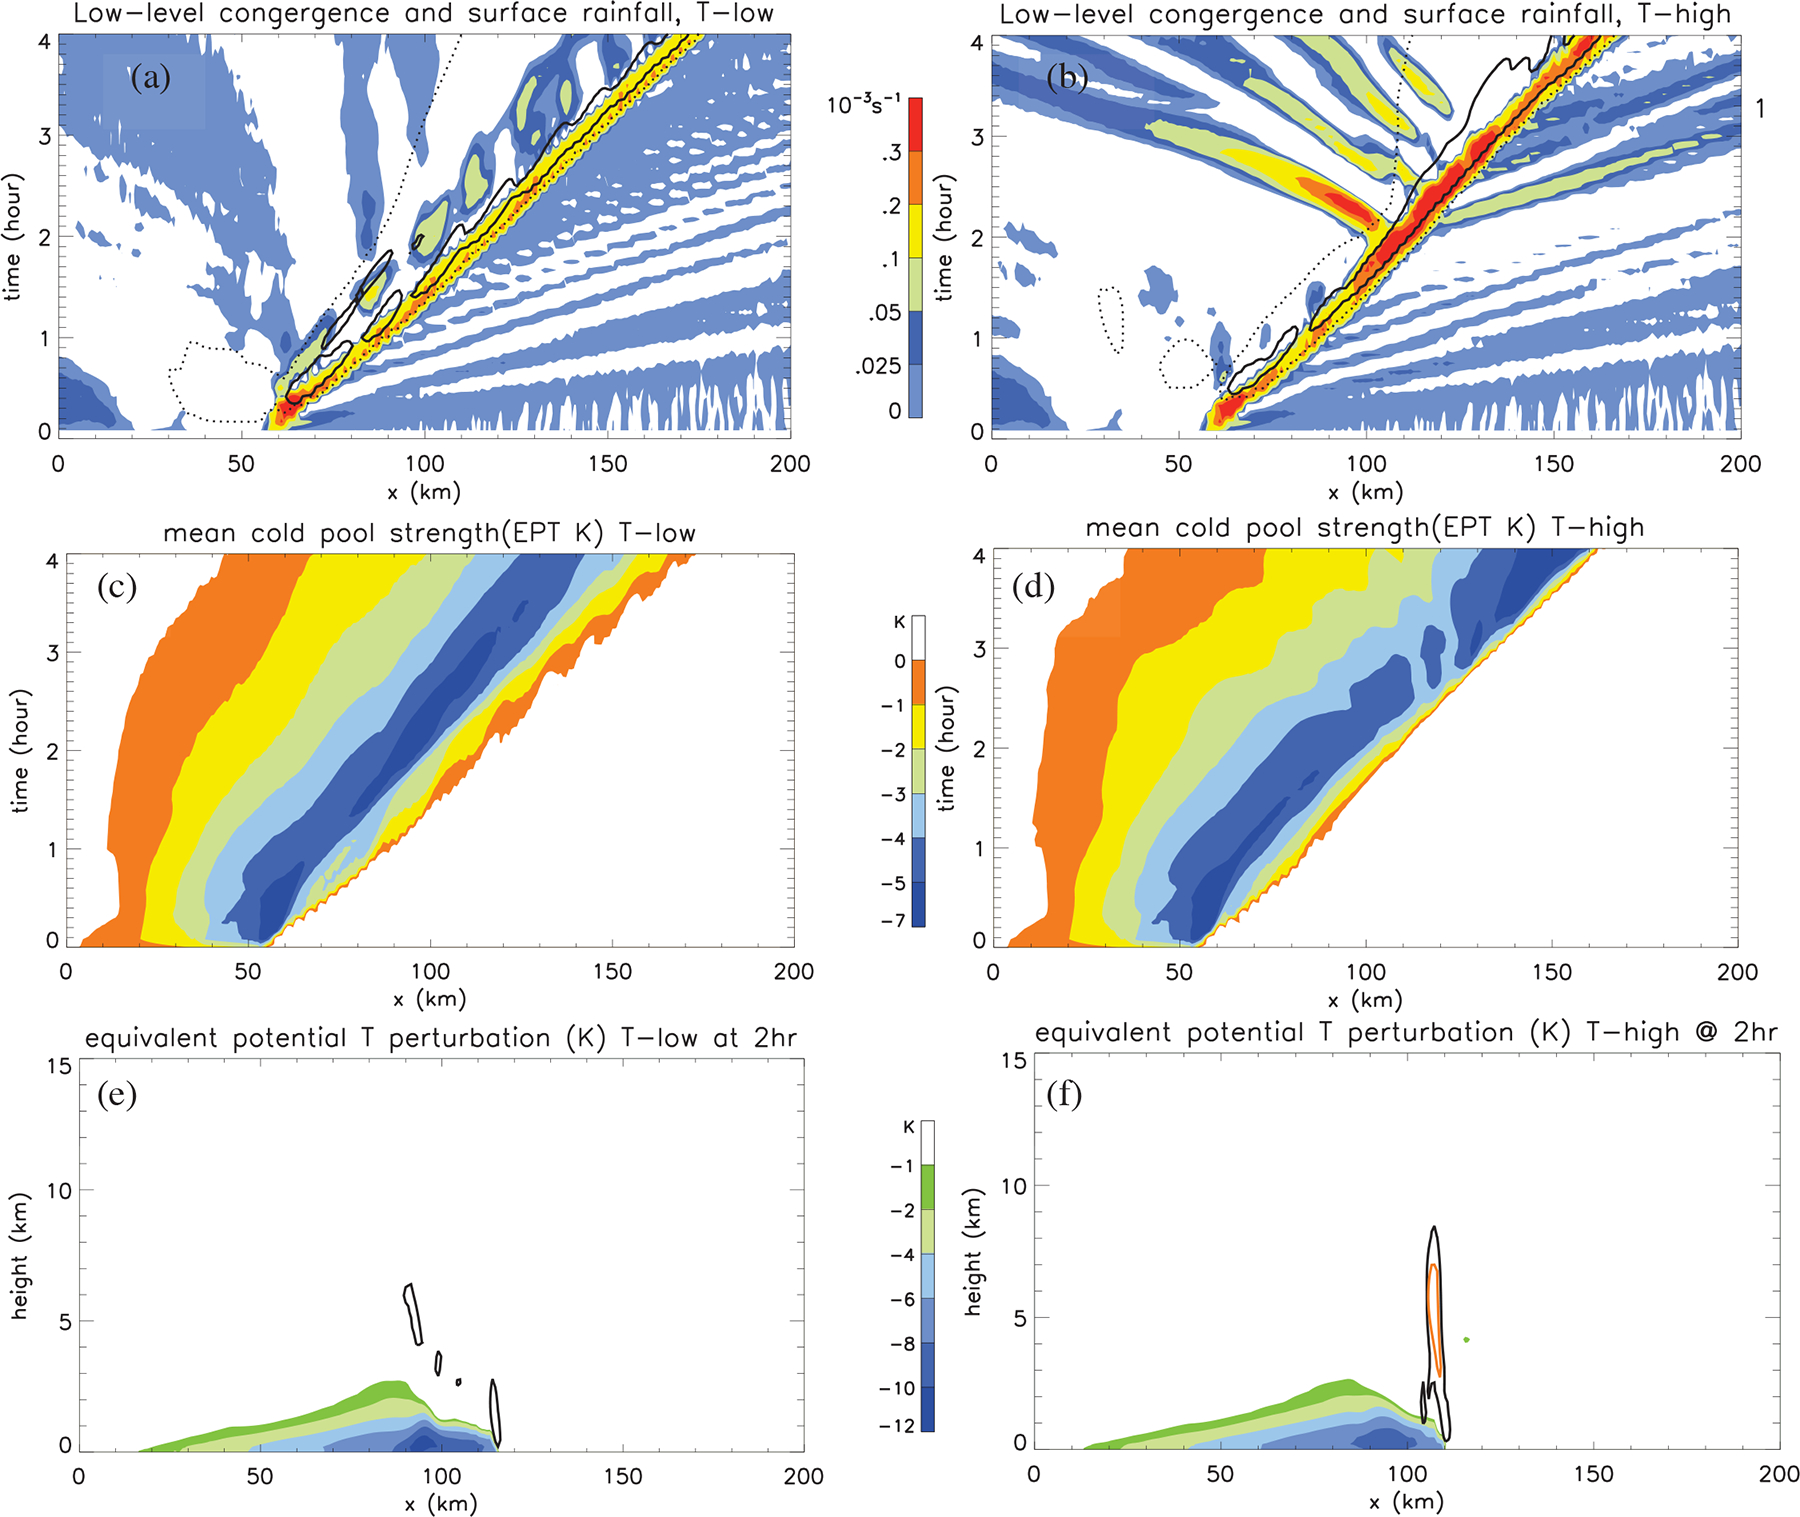
Same as Fig. 5 except for the TOGA-COARE case. (e) and (f) are the instantaneous equivalent potential temperature perturbations at 2 hours.
4.2. Warm Rain Only
The third hypothesis regarding the invigoration of convective precipitation systems in high CCN environments is the cold microphysics effect. Sensitivity experiments are performed by turning off the ice processes to examine the impact of ice microphysics on aerosol-precipitation interactions (similar tests were conducted in Tao et al., [2007]). In these sensitivity tests, the following microphysical processes are included: (1) condensation/evaporation of liquid drops, (2) drop/drop collision/coalescence, (3) turbulence effects on liquid drop collisions, (4) collisional breakup, and (5) sedimentation of liquid. These warm-rain only tests still allow condensation to occur above the freezing level in place of deposition. In addition, the warm rain scenario does not allow riming and freezing processes, which result in more cold rain and melting. Therefore, the differences between the pairs of control runs (low CCN vs. high CCN) and the warm-rain only runs can be used to assess and examine the role of ice microphysics in producing the sensitivities between the low-CCN and high-CCN environments.
Figure 7 shows time sequences of model-estimated domain mean surface rainfall rate without ice processes (warm rain only). For the PRESTORM case, the mean surface rainfall under both low CCN and high CCN conditions is quite similar. This suggests that the ice processes are crucial in suppressing surface precipitation and increasing the portion of light rain in a high-CCN environment. For TOGA COARE, rain suppression due to a high CCN concentration is again only evident during the first hour or so of the simulation. For the entire period, increasing CCN still enhances rainfall, the same as with the full ice run. These results suggest that the main mechanisms for CCN enhancing surface rainfall exist in warm rain microphysics. However, ice-phase microphysics can further enhance the surface rainfall amount in the T-high scenario as compared with the T-high-warm scenario, because the majority of surface rainfall in this case comes from warm rain.
Figure 7:

Same as Fig. 1 except for the warm rain only simulations.
The total LH and evaporative cooling (Figs. 2 and 8) for the TOGA COARE case for the low-CCN scenario are quite similar between the control and warm rain only simulations and indicate that ice processes appear to play only a secondary role in terms of their aerosol impact in this scenario. The total LH between the control and warm rain only simulations for the high-CCN scenario is likewise similar for the first 1.5 hours of model integration. Thus, during the development and early mature stages of the high CCN simulations, ice processes again appear to have little impact on the aerosol effect as LH and evaporative cooling are nearly identical to the full physics control run (Figs. 2b and d). However, after 2 hours of simulation, the total LH in the high CCN full physics control run is larger and deeper, especially above the freezing level where there are more episodes of deep, LH penetrations, than in the warm rain only simulation. Likewise, Figs. 2d and 8d indicate that the low-level evaporative cooling becomes quite different with the warm rain run exhibiting much stronger and somewhat deeper (as evaporation replaces sublimation above the freezing level in the warm rain run) low-level evaporation, which in turn enhances the near surface cold-pool. The difference between the low- and high-CCN simulations (Figs. 8c and d) is greater than that between the control pair (Figs. 2c and d). As in the control run, evaporative cooling, which affects cell regeneration in convective systems, is still determined mainly by warm rain processes for the TOGA COARE case.
Figure 8:

Same as Fig. 2 except for the warm rain only simulation.
For the PRESTORM warm rain experiments, the differences in total LH and evaporative cooling are not significant between the P-high-warm and P-low-warm cases (Fig. 9). The differences are quite small during the first 3 hours (early stage) of the model simulations. This could be the reason for the similar surface rainfall between the high and low CCN situations. Note that there is a jump in latent heat release around 4 and 5 hour, respectively, for the low and high CCN cases. Consequently, there is enhanced evaporative cooling and surface rainfall. The difference in LH and evaporative cooling is quite small because the PRESTORM environment is both fairly unstable with a convective available potential energy (CAPE) of 2300 J/kg and relatively dry and therefore already conducive for evaporation. In addition, these results also suggest that ice microphysics play an important role in the aerosol impact for the PRESTORM case.
Figure 9:

Same as Fig. 3 except for the warm rain only simulation.
These warm-rain only sensitivity tests still allow condensation to occur above the freezing level in place of deposition. These tests examine the water phase microphysics; their associated latent heating and evaporative cooling are responsible for the greater sensitivity shown in the TOGA COARE case in contrast to the PRESTORM case. Khain and Sednev [1996] applied spectral bin microphysics to a precipitation event that occurred in the eastern Mediterranean coastal zone. Their results also showed that ice processes did not have a significant effect on the location of precipitation events, the vertical velocity or rainfall accumulation. However, their results did show that ice processes can delay precipitation formation and alter the spatial distribution of precipitation.
4.3. The effect of latent heating on vertical velocity
With the LH effect, updrafts/downdrafts could be enhanced as a result of enhanced latent heat release. The relationship between thermodynamic buoyancy (or latent heat release) and convective updrafts and downdrafts is analyzed to identify whether or not LH is the main physical process enhancing surface rainfall due to aerosol-precipitation interactions. The vertical velocity equation is shown as follows:
where, u, and w are the horizontal and vertical velocity, the variables θ and qv are potential temperature and water vapor, is the air density, is non-dimensional pressure (where p and poo are dimensional and reference pressures, respectively, with poo taken as 1000 hPa), cp is the specific heat of dry air at constant pressure, ql is the liquid and ice water loading, and Dw is diffusion (turbulence term). The prime means the deviation from the horizontal mean (represented by the bar over a variable). Please see Soong and Ogura [1973, 1980] and Tao and Soong [1986] for details on this equation. The turbulence term is very small and the advection term also small in the middle and upper troposphere compared to the pressure gradient force and buoyancy term. In the lower troposphere, the advection term is about 1/3 of the pressure gradient force. It is positive (i.e., it acts to increase vertical velocity) beneath 1.5 – 2 km and negative (i.e., it acts to decrease vertical velocity) above that.
Figure 10 shows the vertical pressure gradient force , buoyancy effect due to temperature buoyancy forcing or latent heat release , water vapor buoyancy force , and water loading effect (−gql) for the PRESTORM case. Both buoyancy due to water vapor and the loading effect are quite small compared to PGF and LHR. LHR is positive (negative) in the middle (low) troposphere where the convective updrafts (downdrafts) are located. This implies that latent heat release (heating by condensation and/or deposition) will enhance updrafts in the middle troposphere while negative LH (i.e., cooling by evaporation) will enhance downdrafts in the low troposphere. The buoyancy due to water vapor change is positive (negative) in the middle (low) troposphere (Fig. 10c). It has the same effect on convective drafts as the LH effect except with one order smaller magnitude. It also has a smaller effect than the loading effect.
Figure 10:

Vertical cross sections of the (a) vertical pressure gradient force (PGF), (b) buoyancy effect due to latent heat release (LHR), (c) water vapor buoyancy force and (d) water loading effect for the P-low case at 3 hours. Note that there is a difference in scales.
Figure 11(a) shows the domain mean vertical profiles of PGF and the LH effect for the low-CCN and high-CCN scenarios. Both PGF and LH are slightly larger in the low-CCN scenario than in the high-CCN scenario. Their net effect on updrafts and downdrafts is about the same (Fig. 11(b)). Their net effect is also about the same magnitude as the loading effect. This suggests that the loading effect is quite important but in a negative way with regard to convective updraft enhancement. The relative roles of the PGF, LH effect, water vapor buoyancy force and water loading effect on the vertical velocity are the same for the TOGA COARE case.
Figure 11:

Domain mean vertical profiles of PGF [solid lines in (a)] and the LHR effect [dashed lines in (a)] for the P-low (black) and P-high (red) scenario for the PRESTORM case at 3 hours. The net effect of the PGF and LH are shown in (b) (solid lines) together with the water loading term [dashed lines in (b)].
The relationship between thermodynamic buoyancy (latent heat release), vertical pressure gradient force, and drag from water loading associated with convective updrafts and downdrafts has been previously studied [Soong and Ogura, 1973; Schlesinger, 1980; Knupp and Cotton, 1985; Tao et al., 1995 and Storer and van den Heever, 2013]. For example, Soong and Ogura [1973] showed the importance of the PGF on cloud development. Their results also indicated that PGF is the same order of magnitude as the thermal buoyancy force in the core regions of clouds. PGF acted in the opposite direction of the net force due to the excess heat, moisture, and weight of liquid water (there were no ice processes in their model). The current modeling results are consistent with Soong and Ogura [1973] except that the importance of the water loading effect has been identified.
Tao et al. [1995] also showed that PGF and buoyancy oppose each other and are larger than the water loading. They suggested that the water-loading effect plays an important role for initiating downdrafts. Their study was focused on cloud downdrafts and was based on trajectory analyses. Recently, Storer and van den Heever [2013] indicated that the drag associated with condensate loading is an important factor in determining the average updraft strength for tropical deep convective clouds.
4.4. Reduction of evaporative cooling
Evaporative cooling from rain is one of the major microphysics processes that produce cold pools in the lower troposphere. It is also one of the hypotheses associated with the enhancement of precipitation and surface rainfall due to aerosols. Sensitivity tests in terms of reduced evaporation are conducted. These tests aim to identify whether evaporative cooling is the main physical process enhancing surface rainfall due to aerosol-precipitation interactions. Note that in spectral-bin microphysics, water drops and their interactions with one another span the whole size spectrum. There is no clear distinction between cloud droplets and raindrops, and thus evaporative cooling comes from the entire size spectrum (i.e., from small cloud droplets to large precipitating raindrops). Reduced evaporation can impact surface rainfall in three ways. First, it could allow more / larger raindrops to reach the surface. This could produce more surface rainfall. Second, it could allow less cooling in the low troposphere and consequently affect relative humidity (and reduce relative humidity due to a higher temperature), but it could also allow for more evaporative cooling due to a lower relative humidly. This could either favor or not favor the enhancement of precipitation processes and therefore surface rainfall. Third, the cold pool strength could be weakened. This could affect secondary convective generation and reduce the surface rainfall (the hypothesis discussed in the 2nd section). Which factor dominates could depend on the large-scale (or mesoscale) environment.
In the first sensitivity test, evaporation is completely removed from 1 to 3 hours of model integration, from the surface to 3 km, for the PRESTORM P-low scenario. This is because evaporative cooling is quite similar between the P-low and P-high simulations during the first hour of model integration (see Fig. 3). Figure 12 shows time sequences of the model-estimated domain mean surface rainfall rate for the three different scenarios (P-low, P-high and P-low-evap, which is P-low without evaporation from 1 to 3 hours from 0 to 3 km). The total rainfall amount is reduced from 58.4 mm for the (clean) control simulation to 40.7 mm for the reduced evaporation simulation. In the P-low-evap scenario, rainfall increased significantly after the first hour of model integration due to the first impact (more/larger raindrops reach the surface). After 3 hours, when evaporation is turned back on, rainfall is initially reduced due to the reverse of the first impact (fewer/smaller raindrops reach the surface); however, rainfall continues at a reduced rate until the cold pool is replenished (figure not shown) and eventually increases back to a level similar to the clean scenario at around 7 hours.
Figure 12:
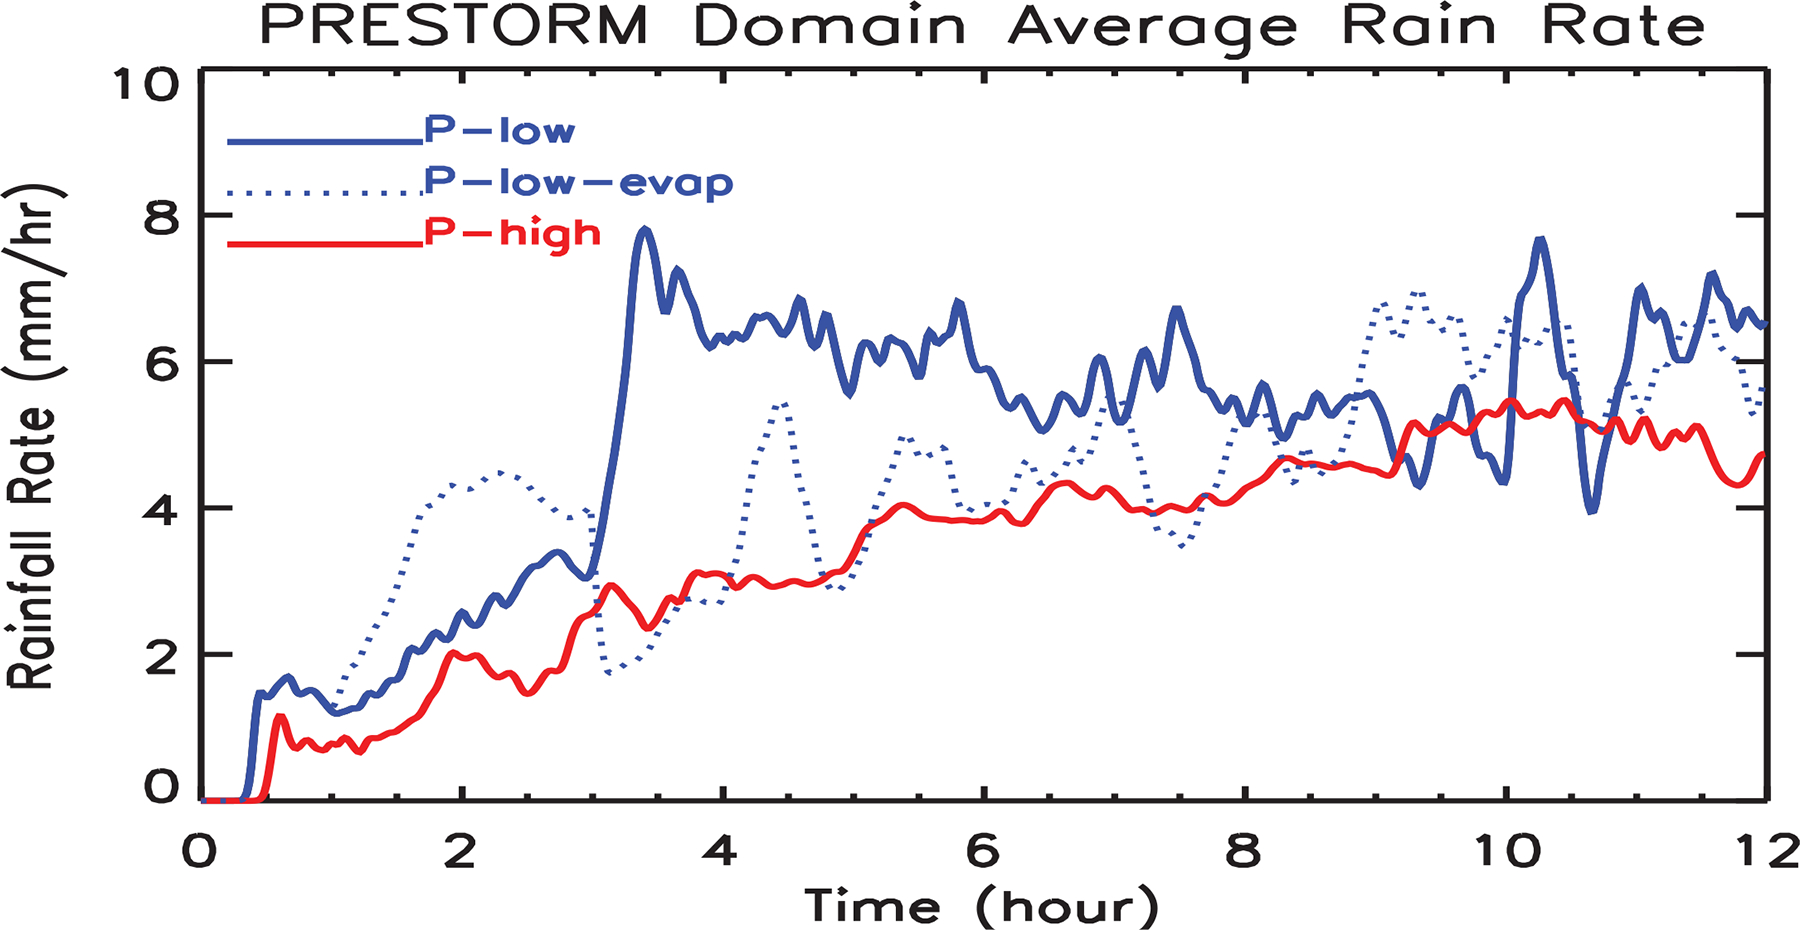
Time series of surface rainfall for the PRESTORM case. The solid blue line is for the P-low case; the red solid line is for the P-high case; and the blue dotted line is the sensitivity test P-low-evap where both cloud and rain evaporation term were turned off from the surface to 3km between 1 and 3 hours.
For the TOGA COARE case, T-high is used to show the sensitivity to evaporation. P-low and T-high have the most rainfall and evaporation for their respective cases and therefore are likely to show the greatest response to changes in evaporation. For the T-high case, the evaporation rate is reduced 100 % only for the first 1.5 hours of model integration, from the surface to a height of 4 km. The results show that the total amount of accumulated surface precipitation is reduced (from 33.0 mm to 26.6 mm) compared to the T-high run (Fig. 13). The results also show that rainfall increased significantly for the first one and half hours of model integration due to the first impact of reduced evaporation (more rainfall reaches the surface) and are consistent with the PRESTORM case. The rainfall amount was also only slightly reduced compared to the T-high scenario but is still more than the T-low after 1.5 hour of model integration. Eventually, the rainfall amount and temporal variation of the surface rainfall is quite similar between the simulation without evaporation and the clean run after 6.5 hours of model integration (Fig. 13). Different environmental conditions (moist vs. dry, differing stability or convective available potential energy) could be the reason for this difference. Evaporative cooling is quite efficient and could have more impact on convective systems in a drier environment (i.e., the P-high scenario).
Figure 13:

Time series of surface rainfall for the TOGA COARE case. The solid blue line is for the T-low case; the solid red line is for the T-high case; and the red dotted line is the sensitivity test T-high-evap where both cloud and rain evaporation term were turned off from surface to 4km, between 0 and 1.5 hours, for the T-high case.
An additional run with evaporation reduced by 50% over the first 1.5 hours of model integration was also conducted for the T-high scenario. Rainfall is almost identical between these two runs even after the first 1.5 hours of model integration (plot not shown). This is because the temporal domain-mean LH and evaporative cooling are quite similar (Fig. 14). Both cases should have smaller-sized droplets due to high CCN concentrations. By reducing evaporation, some of the smaller drops will remain, and hence light rainfall will be possible. It should also reduce the relative humidly and therefore allow more evaporative cooling to occur later on. This could explain why the evaporative cooling does not change in these two cases. Consequently, the LH does not change significantly either (Figs. 14b and c).
Figure 14:
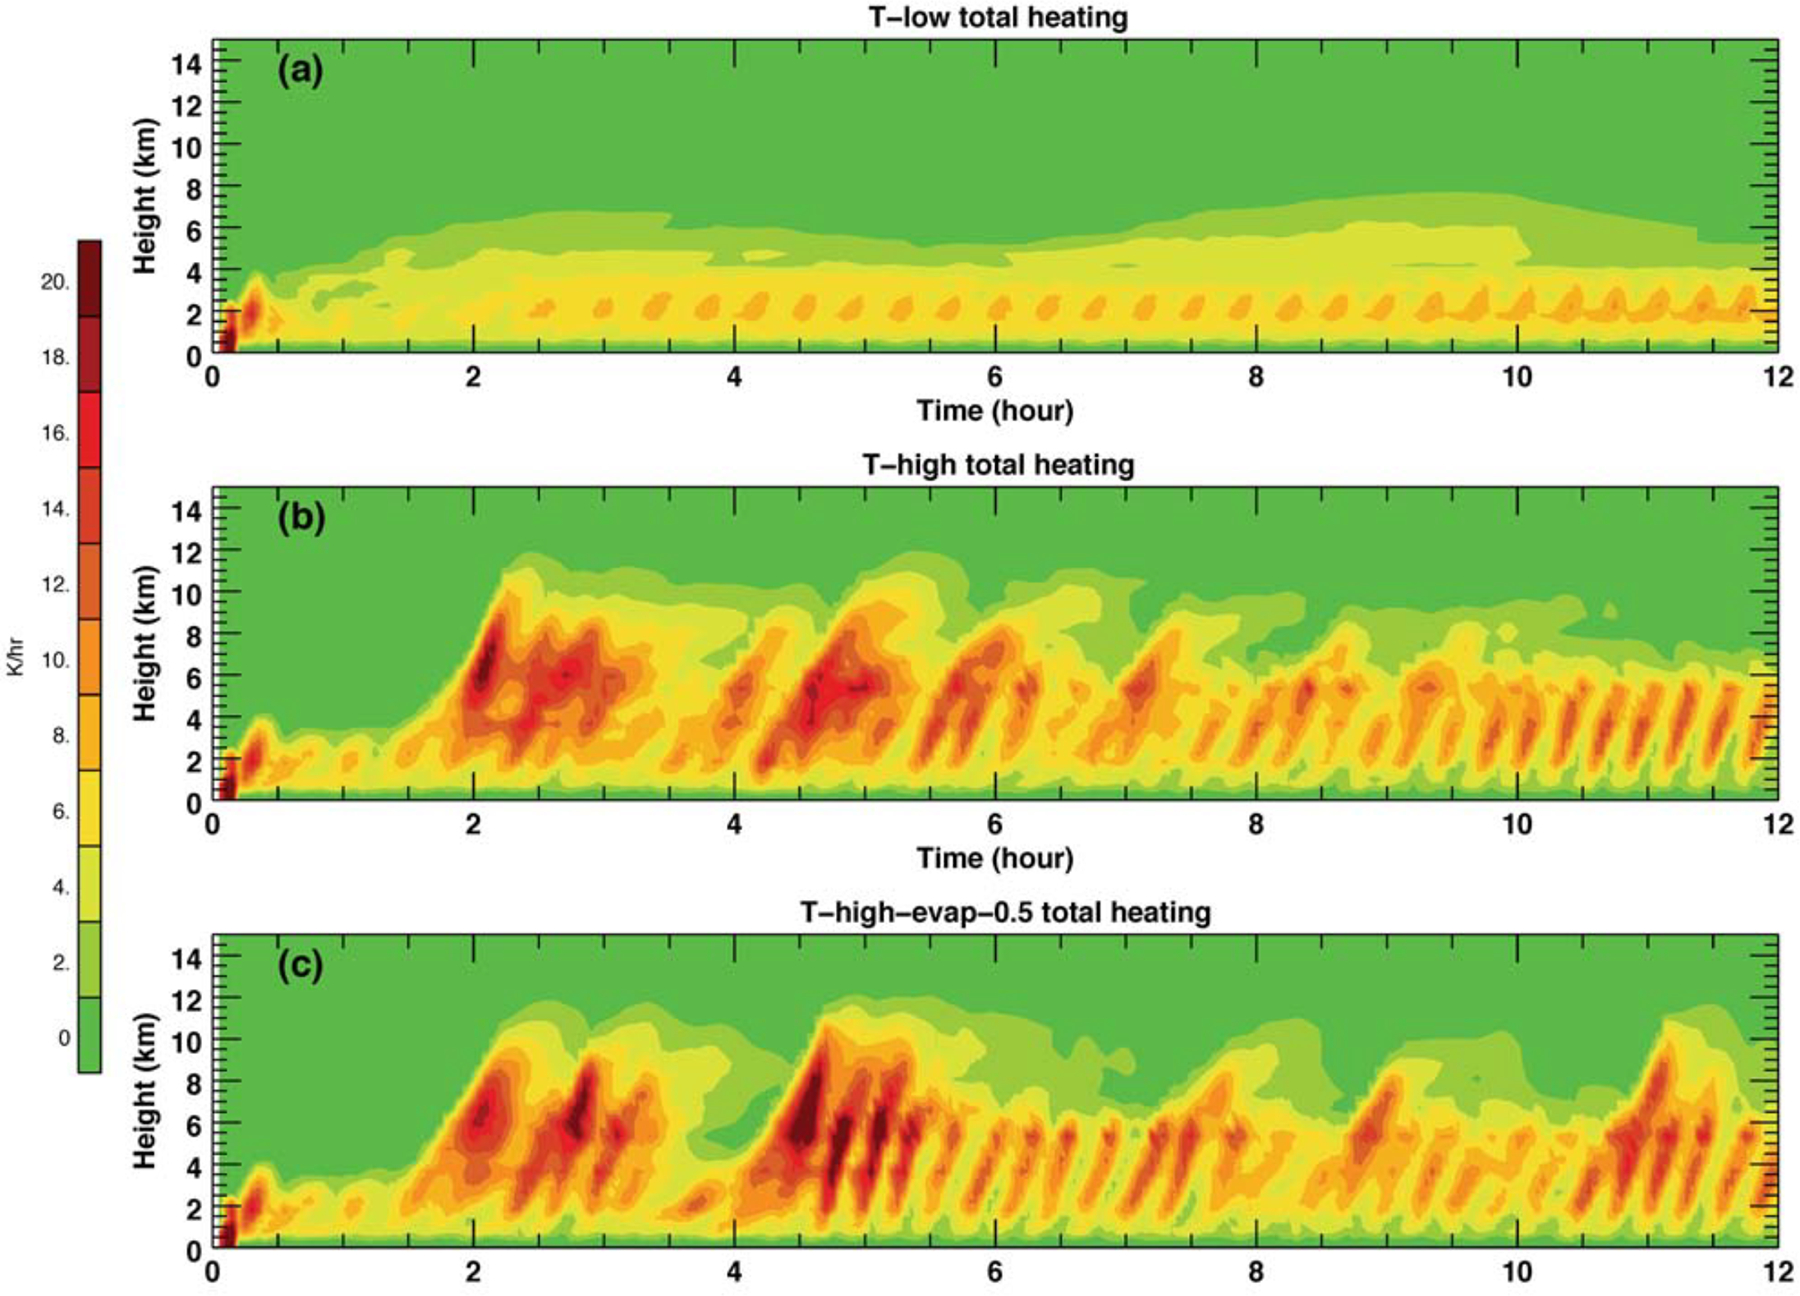
Time-height cross sections of total latent heating for the TOGA COARE case for (a) T-low, (b) T-high, and (c) T-high-evap-0.5 case where the rain evaporation rate is reduced by 50% for the first 1.5 hours from 0 to 4km.
5. Summary
A 2D CRM with detailed spectral-bin microphysics is used to examine and identify the dominant physical processes that determine precipitation enhancement as a result of high CCN concentrations. Two cases are simulated using idealized initial aerosol concentrations: a tropical, linear convective system during TOGA COARE and a summertime, midlatitude squall line during PRESTORM. A pair of model simulations, an experiment with low (clean) and an experiment with high CCN concentrations (polluted environment), is conducted for each case. The latent heating and evaporative cooling associated with three different potential processes (i.e., latent heating, cool-pool and ice microphysics) that could determine the aerosol impact on deep convective precipitation are examined. The relationship between vertical velocities, vertical pressure gradient force, buoyancy (latent heat and water vapor) and the water loading effect are also examined to identify the important processes for convective development. Sensitivity tests are performed to examine the impact of ice and evaporative cooling on the relationship between aerosols and precipitation processes. The major highlights are as follows:
For the scenarios in which rainfall is enhanced (i.e., T-high and P-low), low-level cold pools and convergence are stronger than in their counterpart scenarios (i.e., T-low and P-high). The low-level evaporative cooling is also stronger in the T-high and P-low cases, especially in the early stages (i.e., the first 1–3 hours of model integration) of the convective systems. The results also suggest that latent heating and evaporative cooling (and cold pools) are the key processes associated with the enhanced rainfall during the mature stage of these two deep convective, precipitating cloud systems (i.e., Figs. 2 and 3). The importance of latent heating and evaporative cooling over the whole life cycle of convective cloud systems was also addressed in Khain [2009].
For the TOGA COARE (tropical) case, the T-high-warm scenario still produces more rainfall than the T-low-warm as with the original full physics simulations. This is because the latent heating and evaporative cooling are quite similar between the ice and warm rain only simulations. This result suggests that the ice processes do not have a major impact on aerosol-precipitation interaction for this case. For the PRESTORM (midlatitude) case, the P-high-warm and P-low-warm simulations produce similar total rainfall amounts. In contrast, the P-high and P-low simulations have much larger differences. This suggests that ice processes are crucial in suppressing surface precipitation in the high CCN environment.
For both the PRESTORM (P-low) and TOGA COARE (T-high) high rainfall scenarios, the total rainfall amount is reduced in sensitivity tests in which evaporation is restricted (see Table 2). However, rainfall increased significantly during the period in which evaporation was eliminated because more rain could reach the surface. The simulated cold pools are also much weaker compared to the run with full evaporation in the PRESTORM case. The results also show that overall rainfall was still more than in the high (low) CCN scenario for the PRESTORM (TOGA COARE) case. This is because the cold pool was replenished and eventually become stronger. Similar to other studies [e.g., Khain et al., 2005; Khain, 2009], our results suggest that evaporative cooling can affect the cold pool strength.
For both the TOGA COARE and PRESTORM cases, the temperature buoyancy term can enhance updrafts via heating due to condensation and deposition in the middle troposphere and downdrafts via evaporative cooling in the lower troposphere in the convective core region (see Fig. 10). However, PGF is the same order of magnitude as the temperature buoyancy forcing and acts in the opposite direction. This suggests that PGF is as important as the temperature buoyancy term in determining the cloud velocity strength. The water loading and water vapor buoyancy terms are quite small compared to PGF and temperature buoyancy forcing. But, the water loading term is the same order as the net difference between PGF and temperature buoyancy forcing. This suggests that the water-loading effect could be quite important for vertical velocities associated with clouds. These results are consistent with previous modeling results for isolated clouds [Soong and Ogura, 1973], from trajectory analysis [Tao et al., 1995], and for multi-cloud systems [Storer and van den Heever, 2013].
Almost all previous CRM studies (including the present one) used idealized chemical compositions and CCN concentrations in the simulations [e.g., van den Heever et al., 2006]. Furthermore, the spatial distribution of CCN was assumed to be uniform, at least horizontally. A non-homogeneous CCN distribution (from observations or from large-scale modeling/analyses), consistent with non-homogeneous initial meteorological conditions, is needed to assess aerosol-precipitation interactions [i.e., Shi et al., 2014]. A 2D simulation provides a good approximation to the observed linear convective systems in this study; however, 3D CRM simulations are needed to address aerosol-precipitation interactions more fully. Furthermore, CRM studies need to compare model results with observed cloud features such as dynamical and microphysical profiles, cloud extent, evolution of organization, radar reflectivity, and rainfall. Combining observations and modeling can enable us to better understand the response of clouds and precipitation to aerosols and their interactive feedbacks.
Supplementary Material
Key Points.
Increasing aerosol number concentrations could either enhance or reduce surface precipitation. Enhanced near surface cold pool strength is important in precipitation enhancement. Other processes include modifications of latent heat release and ice microphysics by aerosols.
Acknowledgments:
This research was supported by the NASA Precipitation Measurement Missions (PMM), the NASA Modeling, Analysis, and Prediction (MAP) Program, and the Office of Science (BER), U.S. Department of Energy/Atmospheric System Research (DOE/ASR) Interagency Agreement (No. DE-AI02-04ER63755). The authors are grateful to Drs. Ramesh Kakar and David B. Considine at NASA headquarters for their support of this research. Acknowledgment is also made to the NASA Goddard Space Flight Center and NASA Ames Research Center computing facilities and to Dr. Tsengdar Lee at NASA HQ for the computational resources used in this research. We would like to thank Drs. J. Fan and S. van den Heever for updating Table 1 and Mr. Stephen Lang for proofing the manuscript. We also thank three anonymous reviewers for their constructive comments that improved this paper significantly. All simulation data are freely available upon request to: xiaowen.li@nasa.gov.
References:
- Altaratz O, Koren I, and Reisin T, (2007), Aerosols’ influence on the interplay between condensation, evaporation and rain in warm cumulus cloud. Atmos. Chem. Phys, 7, 12 687–12 714. [Google Scholar]
- Cheng C-T, Wang W-C, and Chen J-P (2010), Simulation of the effects of increasing cloud condensation nuclei on mixed-phase clouds and precipitation of a front system, Atmos. Res, 96, 461–476, doi: 10.1016/j.atmosres.2010.02.005. [DOI] [Google Scholar]
- Chou M-D, and Suarez MJ (1994), An efficient thermal infrared radiation parameterization for use in general circulation models. NASA Tech. Memo 104606, 85pp. [Google Scholar]
- Chou M-D, Suarez MJ, Ho C-H, Yan M-H, and Lee K-T (1998), Parameterizations for Cloud Overlapping and Shortwave Single-Scattering Properties for Use in General Circulation and Cloud Ensemble Models, J. Clim, 11, 202–214. [Google Scholar]
- Dudhia J, W MM, and So DWK (1987), The two-dimensional dynamics of West African squall lines. Quart. J. Roy. Meteoro. Soc, 113, 121–146. [Google Scholar]
- Ekman A, Wang C, Storm J, and Kreici R (2006), Explicit simulation of aerosol physics in a cloud-resolving model: Aerosol transport and processing in the free troposphere; J. Atmos. Sci, 63, 682–696. [Google Scholar]
- Ekman A, Wang C, Wilson J, and Strom J (2004), Explicit simulation of aerosol physics in a cloud-resolving model: A sensitivity study based on an observed convective cloud, Atmos. Chem. Phys, 4, 773–791. [Google Scholar]
- Fairall CW, Bradley EF, Rogers DP, Edson JB, and Young GS (1996), Bulk parameterization of air-sea fluxes for Tropical Ocean Global Atmosphere Coupled Ocean-Atmosphere Response Experiment, J. Geophys. Res, 101, 915–929. [Google Scholar]
- Fan J, Zhang R, Li G, Tao W-K, and Li X (2007), Simulation of cumulus clouds using a spectral microphysics cloud-resolving model, J. Geophys. Res, 112, D04201, doi: 10.1029/2006JD007688. [DOI] [Google Scholar]
- Fan J, Yuan T, Comstock JM, Ghan S, et al. (2009), Dominant role by vertical wind shear in regulating aerosol effects on deep convective clouds, J. Geophys. Res, 114, D22206, doi: 10.1029/2009JD012352. [DOI] [Google Scholar]
- Fan J, Leung LYR, Li Z, Morrison H, Chen H, Zhou Y, Qian Y, and Wang Y (2012a), Aerosol impacts on clouds and precipitation in Eastern China: Results from bin and bulk microphysics, J. Geophy. Res. D. (Atmospheres), 117, D00K36, doi: 10.1029/2011JD016537. [DOI] [Google Scholar]
- Fan J, Rosenfeld D, Ding Y, Leung LYR, and Li Z (2012b), Potential aerosol indirect effects on atmospheric circulation and radiative forcing through deep convection, Geophy. Res. Lett, 39, L09806, doi: 10.1029/2012GL051851. [DOI] [Google Scholar]
- Fan J, Leung LYR, Rosenfeld D, Chen Q, Li Z, Zhang J, and Yan H (2013), Microphysical effects determine macrophysical response for aerosol impacts on deep convective clouds, Proc. National Acad. Sci, 110(48), E4581–E4590, doi: 10.1073/pnas.1316830110. [DOI] [PMC free article] [PubMed] [Google Scholar]
- Fovell RG and Ogura Y (1988), Numerical simulation of a midlatitude squall line in two dimensions. J. Atmos. Sci, 45, 3846–3879. [Google Scholar]
- Fridlind AM, Ackerman AS, Chaboureau J-P, Fan J, Grabowski WW, Hill AA, Jones TR, Khaiyer MM, Liu G, Minnis P, Morrison H, Nguyen L, Park S, Petch JC, Pinty J-P, Schumacher C, Shipway BJ, Varble AC, Wu X, Xie S, and Zhang M (2012), A comparison of TWP-ICE observational data with cloud-resolving model results. J. Geophy. Res, 117, D05204, doi: 10.1029/2011JD016595. [DOI] [Google Scholar]
- Grant LD and van den Heever SC (2014), Aerosol-cloud-land surface interactions within tropical sea breeze convection. J. Geophy. Res, 119, 8340–8361. [Google Scholar]
- Grant LD, and van den Heever SC (2015), Cold pool and precipitation responses to aerosol loading: modulation by dry layers. J. Atmos. Sci, 72, 1398–1408. [Google Scholar]
- Igel AL, Van Den Heever SC, Naud CM, Saleeby SM, and Posselt DJ (2013), Sensitivity of warm-frontal processes to cloud-nucleating aerosol concentrations, J. Atmos. Sci, 70, 1768–1783. [Google Scholar]
- Jaenicke R (1993), Tropospheric aerosols Aerosol-Cloud-Climate Interactions. Hobbs PV (ed.), Academic Press, 1–31. [Google Scholar]
- Johnson RH, and Hamilton PJ (1988), The relationship of surface pressure features to the precipitation and airflow structure of an intense midlatitude squall line, Mon. Wea. Rev, 116, 1444–1472. [Google Scholar]
- Jorgensen DP, LeMone MA, and Trier SB (1997), Structure and evolution of the 22 February 1993 TOGA COARE squall line: Aircraft observations of precipitation, circulation, and surface fluxes, J. Atmos. Sci, 54, 1961–1985. [Google Scholar]
- Kalina EA, Friedrich K, Morrison H, and Bryan GH (2014), Aerosol effects on idealized supercell thunderstorms in different environments. J. Atmos. Sci, 71, 164–186. [Google Scholar]
- Khain AP and Sednev I (1996), Simulation of precipitation formationin the Eastern Mediterranean coastal zone using a spectral microphysics cloud ensemble model, Atmos. Res, 43, 77–110. [Google Scholar]
- Khain A, Pokrovsky A, Pinsky M, Seigert A, and Phillips V (2004), Simulation of effects of atmospheric aerosols on deep turbulent convective clouds using a spectral microphysics mixed-phase cumulus cloud model. Part I: Model description and possible applications. J. Atmos. Sci, 61, 2983–3001. [Google Scholar]
- Khain A, and Pokrovsky A (2004), Simulation of effects of atmospheric aerosols on deep turbulent convective clouds using a spectral microphysics mixed-phase cumulus cloud model. Part II: Sensitivity study. J. Atmos. Sci, 61, 2963–2982. [Google Scholar]
- Khain A, Rosenfeld D, and Pokrovsky A (2005), Aerosol impact on the dynamics and microphysics of deep convective clouds. Q. J. R. Meteorol. Soc, 131, 1–25. [Google Scholar]
- Khain AP (2009), Effects of aerosols on precipitation: a review. Environ. Res. Lett 4, doi: 10.1088/1748-9326/4/1/015004. [DOI] [Google Scholar]
- Khain AP, Rosenfeld D, Pokrovsky A, Blahak U, Ryzhkov A (2011), The role of CCN in precipitation and hail in a mid-latitude storm as seen in simulations using a spectral (bin) microphysics model in a 2D dynamic frame Atmospheric Research 99 (2011) 129–146. [Google Scholar]
- Klemp JB, and Wilhelmson RB (1978), The simulation of three-dimentional convective storm dynamics. J. Atmos. Sci, 35, 1070–1096. [Google Scholar]
- Knupp KR, and Cotton WR (1985), Convective cloud downdraft structure: An interpretive survey. Rev. Geophys, 23, 183–215. [Google Scholar]
- Lafore J-P, and Moncrieff MW (1989), A numerical investigation of the organization and interaction of the convective and stratiform regions of tropical squall lines. J. Atmos. Sci, 46, 521–544. [Google Scholar]
- Lang S, Tao W-K, Simpson J, and Ferrier B (2003), Modeling of convectivestratiform precipitation processes: Sensitivity to partitioning methods. J. Appl. Meteor, 42, 505–527. [Google Scholar]
- Lebo ZJ and Morrison H (2014), Dynamical effects of aerosol perturbations on simulated idealized squall lines, Mon. Wea. Rev, 142, 991–1009, doi: 10.1175/MWRD-13-00156.1, 2014. [DOI] [Google Scholar]
- Lee SS, and Feingold G (2010), Precipitating cloud-system response to aerosol perturbations, Geophys. Res. Lett, 37, L23806, doi: 10.1029/2010GL045596. [DOI] [Google Scholar]
- Lee SS, Donner LJ, Phillips VTJ, and Ming Y (2008), Examination of aerosol effects on precipitation in deep convective clouds during the 1997 ARM summer experiment, Q. J. R. Meteorol. Soc, 134(634), doi: 10.1002/qj.287. [DOI] [Google Scholar]
- Lee SS, Donner LJ, and Phillips VTJ (2009), Impacts of aerosol chemical composition on microphysics and precipitation in deep convection, Atmos. Res, 94, 10.1016/j.atmosres.2009.05.015. [DOI] [Google Scholar]
- LeMone MA, Jorgensen DP, and Smull BF (1994), The impact of two convective systems of sea surface stresses in COARE. Preprints, Sixth Conf. On Mesoscale Processes, Portland, OR, Amer. Meteor. Soc, 40–44. [Google Scholar]
- Levin Z, and Cotton WR (2009), Aerosol pollution impact on precipitation: A scientific review, Springer, 386pp. [Google Scholar]
- Li X, Tao W-K, Khain A, Simpson J, and Johnson D (2009), Sensitivity of a cloud-resolving model to the bulk and explicit bin microphysical schemes. Part I. Comparisons. J. Atmos. Sci, 66, 3–21. [Google Scholar]
- Li X, Tao W-K, Matsui T, Liu C, and Masunaga H (2010), Improving a spectral bin microphysical scheme using long-term TRMM satellite observations. Quart. J. Roy. Meteor. Soc, 136, 382–399. [Google Scholar]
- Li X, Tao W-K, Masunaga H, Gu G, and Zeng X (2013), Aerosol Effects on Cumulus Congestus Population over the Tropical Pacific: A Cloud-Resolving Modeling Study. J. Meteor. Soc. Japan, 91(6), 817–833. [Google Scholar]
- Loftus AM, and Cotton WR (2014), Examination of CCN impacts on hail in a simulated supercell storm with triple-moment hail bulk microphysics, Atmos. Res, 147–148, 183–204. [Google Scholar]
- Lynn BH, Khain A, Dudhia J, Rosenfeld D, Pokrovsky A, and Seifert A (2005), Spectral (bin) microphysics coupled with a mesoscale model (MM5) part II: Simulation of a CaPE rain event with a squall line, Mon. Weather Rev, 133, 59–71. [Google Scholar]
- May PT, Bringi VN, and Thurai M, (2011), Do we observe aerosol impacts on DSDs in strongly forced tropical thunderstorms? J. Atmos. Sci, 68, 1902–1910. [Google Scholar]
- Morrison H, and Grabowski WW, (2011), Cloud-system resolving model simulations of aerosol indirect effects on tropical deep convection and its thermodynamic environment. Atmos. Chem. Phys, 11, 10503–10523, doi: 10.5194/acp-11-10503-2011. [DOI] [Google Scholar]
- Morrison H, (2012), On the robustness of aerosol effects on an idealized supercell storm simulated with a cloud system-resolving model. Atmos. Chem. Phys, 12, 7689–7705, doi: 10.5194/acp-12-7689-2012. [DOI] [Google Scholar]
- Phillips VTJ, Choularton TW, Blyth AM, and Latham J (2002), The influence of aerosol concentrations on the glaciation and precipitation of a cumulus cloud, Q. J. R. Meteorol. Soc, 128(581), 951–971. [Google Scholar]
- Randall D, Khairoutdinov M, Arakawa A and Grabowski W (2003), Breaking the cloud parameterization deadlock, Bull. Amer. Meteor. Soc, 84, 1547–1564, doi: 10.1175/BAMS-84-11-1547. [DOI] [Google Scholar]
- Redelsperger J-L, and Co-authors (2000), A GCSS model intercomparison for a tropical squall line observed during TOGA-COARE. Part I: Cloud-resolving models. Quar. J. Roy. Meteor. Soc, 126, 823–863. [Google Scholar]
- Rosenfeld D, Lohmann U, Raga GB, O’Dowd CD, Kulmala M, Fuzzi S, Reissell A, and Andreae MO (2008), Flood or drought: How do aerosols affect precipitation? Science, 321, 1309–1313. [DOI] [PubMed] [Google Scholar]
- Rotunno R, Klemp JB, and Weisman ML (1988), A theory for strong, long-lived squall lines. J. Atmos. Sci, 45, 463–485. [Google Scholar]
- Rutledge SA, Houze RA Jr., and Biggerstaff MI (1988), The Olkahoma-Kansas mesoscale convective system of 10–11 June 1985: Precipitation structure and single-doppler radar analysis, Mon. Wea. Rev, 116, 1409–1430. [Google Scholar]
- Saleeby SM, Berg W, Van Den Heever S, and L’ecuyer T (2010), Impact of cloud-nucleating aerosols in cloud-resolving model simulations of warm-rain precipitation in the East China Sea. J. Atmos. Sci, 67, 3916–3930. [Google Scholar]
- Schlesinger RE (1980), A three-dimensional numerical model of an isolated thunderstorm. Part II: Dynamics of updraft splitting and mesovortex couplet evolution. J. Armos. Sci, 37, 395–420. [Google Scholar]
- Seigel RB, van den Heever SC, and Saleeby SM (2013), Mineral dust indirect effects and cloud radiative feedbacks of a simulated idealized nocturnal squall line, Atmos. Chem. Phys, 13, 4467–4485. [Google Scholar]
- Shi JJ, Matsui T, Tao W-K, Peters-Lidard C, Chin1 M, Tan Q, and Kemp E (2014), Implementation of an Aerosol-Cloud Microphysics-Radiation Coupling into the NASA Unified WRF: Simulation Results for the 6–7 August 2006 AMMA Special Observing Period, Quart. J. Roy. Meteor. Soc,. 140, 2158–2175. doi: 10.1002/qj.2286 [DOI] [Google Scholar]
- Smolarkiewicz PK, and Grabowski WW (1990), The multidimensional positive advection transport algorithm: Nonoscillatory option. J. Comput. Phys, 86, 355 375. [Google Scholar]
- Soong S-T, and Ogura Y (1973), A comparison between axisymmetric and slab-symmetric cumulus models. J. Atmos. Sci, 30, 879–893. [Google Scholar]
- Soong S-T, and Ogura Y (1980), Response of trade wind cumuli to large-scale processes. J. Atmos. Sci, 37, 2035–2050. [Google Scholar]
- Storer RL, van den Heever SC and Stephens GL (2010), Modeling aerosol impacts on convection under differing storm environments. J. Atmos. Sci, 67, 3904–3915. [Google Scholar]
- Storer RL, and van den Heever SC (2013), Microphysical processes evident in aerosol forcing of tropical deep convective clouds, J. Atmos. Sci, 70, 430–446. [Google Scholar]
- Tao W-K, and Simpson J (1993), Goddard Cumulus Ensemble model. Part I: Model description. Terr. Atmos. Oceanic Sci, 4, 35–72. [Google Scholar]
- Tao W-K (2003), Goddard Cumulus Ensemble (GCE) model: Application for understanding precipitation processes, AMS Meteorological Monographs - Cloud Systems, Hurricanes and TRMM. 107–138. [Google Scholar]
- Tao WK (2007), Cloud resolving modeling, J. Met. Soc. Japan, 85B, 305–330. [Google Scholar]
- Tao W-K, and Moncrieff M (2009), Multi-scale cloud-system modeling. Rev. Geophys, 47, RG4002, doi: 10.1029/2008RG000276. [DOI] [Google Scholar]
- Tao W-K, Li X, Khain A, Matsui T, Lang S, and Simpson J (2007), Role of atmospheric aerosol concentration on deep convective precipitation: Cloud-resolving model simulations, J. Geophys. Res, 112, D24S18, doi: 10.1029/2007JD008728. [DOI] [Google Scholar]
- Tao W-K, Scala J, Simpson J (1995), The effects of melting processes on the development of a tropical and a midlatitude squall line, J. Atmos. Sci, 52, 1934–1948. [Google Scholar]
- Tao W-K, Lang S, Simpson J, Sui C-H, Ferrier B, and Chou M-D (1996), Mechanisms of cloud-radiation interaction in the tropics and midlatitudes, J. Atmos. Sci, 53, 2624–2651. [Google Scholar]
- Tao W-K and Soong S-T (1986), A study of the response of deep tropical clouds to mesoscale processes: Three-dimensional numerical experiments. J. Atmos. Sci, 43, 2653–2676. [Google Scholar]
- Tao W-K, Chen J-P, Li Z-Q, Wang C and Zhang C-D (2012), The Impact of Aerosol on convective cloud and precipitation. Rev. Geophys, 50, RG2001, doi: 10.1029/2011RG000369. [DOI] [Google Scholar]
- Tao W-K, Lang S, Zeng X, Li X, Matsui T, Mohr K, Posselt D, Chern J, Peters-Lidard C, Norris PM, Kang I-S, Choi I, Hou A, Lau K-M, Yang Y-M (2014), The Goddard Cumulus Ensemble model (GCE): Improvements and applications for studying precipitation processes. Atmos. Res, 15, 392–424 [Google Scholar]
- Teller A, and Levin Z (2006), The effects of aerosols on precipitation and dimensions of subtropical clouds: a sensitivity study using a numerical cloud model, Atmos. Chem. Phys, 6, 67–80. [Google Scholar]
- Thompson AM, Tao W-K, Pickering KE, Scala JR and Simpson J (1997), Tropical deep convection and Ozone formation, Bull. Amer. Meteor. Soc, 78, 1043–1054. [Google Scholar]
- Trier SB, Skamarock WC, LeMone MA, Parsons DB, and Jorgensen DP (1996), Structure and evolution of the 22 February 1993 TOGA COARE squall line: Numerical simulations, J. Atmos. Sci, 53, 2861–2886. [Google Scholar]
- Trier SB, Skamarock WC, and LeMone MA (1997), Structure and evolution of the 22 Februaru 1993 TOGA COARE squall line: Organization mechanisms inferred from numerical simulation, J. Atmos. Sci, 54, 386–407. [Google Scholar]
- van den Heever SC, Carrio GG, Cotton WR, Demott PJ, and Prenni AJ (2006), Impact of nucleating aerosol on Florida storms. Part1: Mesoscale simulations, J. Atmos. Sci, 63, 1752–1775. [Google Scholar]
- van den Heever SC, and Cotton WR (2007), Urban aerosol impacts on downwind convective storms, J. Appl. Meteor. Clim, 46, 828–850, doi: 10.1175/JAM2492.1. [DOI] [Google Scholar]
- van den Heever SC, Stephens GL, and Wood NB (2011), Aerosol indirect effects on tropical convection characteristics under conditions of radiative-convective equilibrium. J. Atmos. Sci, 68, 699–718. [Google Scholar]
- Wang C (2005), A model study of the response of tropical deep convection to the increase of CCN concentration. 1. Dynamics and microphysics. J. Geophys. Res, 110, D21211, doi: 10.1029/2004JD005720. [DOI] [Google Scholar]
- Wang Y, Tao W-K, and Simpson J (1996), The impact of a surface layer on a TOGA COARE cloud system development. Mon. Wea. Rev, 124, 2753–2763. [Google Scholar]
- Wang Y, Tao W-K, Simpson J, and Lang S (2003), The sensitivity of tropical squall lines to surface fluxes: Three-dimensional cloud resolving model simulations. Quart. J. Roy. Meteor. Soc, 129, 987–1006. [Google Scholar]
- Yang M-J and A Houze R Jr. (1995), Multicell squall-line structure as a manifestation of vertically trapped gravity waves. Mon. Wea. Rev, 123, 641–661. [Google Scholar]
- Yin Y, Carslaw KS, and Feingold G (2005), Vertical transport and processing of aerosols in a mixed-phase convective cloud and the feedback on cloud development, Q. J. Roy. Met. Soc, 131, 221–245, doi: 10.1256/qj.03.186. [DOI] [Google Scholar]
Associated Data
This section collects any data citations, data availability statements, or supplementary materials included in this article.