Abstract
PURPOSE
For patients with primary cutaneous melanoma, the risk of sentinel node (SN) metastasis varies according to several clinicopathologic parameters. Patient selection for SN biopsy can be assisted by National Comprehensive Cancer Network (NCCN) and ASCO/Society of Surgical Oncology (SSO) guidelines and the Memorial Sloan Kettering Cancer Center (MSKCC) online nomogram. We sought to develop an improved online risk calculator using alternative clinicopathologic parameters to more accurately predict SN positivity.
PATIENTS AND METHODS
Data from 3,477 patients with melanoma who underwent SN biopsy at Melanoma Institute Australia (MIA) were analyzed. A new nomogram was developed by replacing body site and Clark level from the MSKCC model with mitotic rate, melanoma subtype, and lymphovascular invasion. The predictive performance of the new nomogram was externally validated using data from The University of Texas MD Anderson Cancer Center (n = 3,496).
RESULTS
The MSKCC model receiver operating characteristic curve had a predictive accuracy of 67.7% (95% CI, 65.3% to 70.0%). The MIA model had a predictive accuracy of 73.9% (95% CI, 71.9% to 75.9%), a 9.2% increase in accuracy over the MSKCC model (P < .001). Among the 2,748 SN-negative patients, SN biopsy would not have been offered to 22.1%, 13.4%, and 12.4% based on the MIA model, the MSKCC model, and NCCN or ASCO/SSO criteria, respectively. External validation generated a C-statistic of 75.0% (95% CI, 73.2% to 76.7%).
CONCLUSION
A robust nomogram was developed that more accurately estimates the risk of SN positivity in patients with melanoma than currently available methods. The model only requires the input of 6 widely available clinicopathologic parameters. Importantly, the number of patients undergoing unnecessary SN biopsy would be significantly reduced compared with use of the MSKCC nomogram or the NCCN or ASCO/SSO guidelines, without losing sensitivity. An online calculator is available at www.melanomarisk.org.au.
INTRODUCTION
Multiple studies have established sentinel node (SN) status as the most important prognostic indicator for patients with clinically localized primary cutaneous melanomas.1-3 Data from these studies show that the rate of SN positivity in patients with melanoma with primary tumors ≥ 1 mm in Breslow thickness is typically in the range of 15% to 27%.1,2,4-6 Although postoperative SN biopsy complications are mostly minor and self-limiting, they occur in 6%-14% of patients7,8; these include infection, seroma, neuropathic pain, and lymphedema. Because of the high rate of negative SN biopsy, a predictive nomogram was developed at the Memorial Sloan Kettering Cancer Center (MSKCC) in 2005 to improve patient selection for SN biopsy and avoid the procedure when the likelihood of SN positivity was low.2 This nomogram was made publicly available through an online calculator. Multiple case series (1 from the United States and 3 from Europe) have used their own institutional data to externally assess the validity of the nomogram, with good concordance.1,2,4,5
CONTEXT
Key Objective
To develop and validate an improved risk calculator for sentinel node (SN) metastasis in patients with primary cutaneous melanomas.
Knowledge Generated
Two key prognostic factors for SN positivity that are not considered in current guidelines for recommending SN biopsy were identified; these additional parameters were patient age and tumor histologic subtype. Younger patients and those with acral and superficial spreading melanoma subtypes had a higher rate of SN positivity.
Relevance
The new Melanoma Institute Australia risk calculator for SN positivity presented here has been used to develop an online tool; this is freely available at www.melanomarisk.org.au. Its use will enable clinicians to inform patients of their personal risk of SN metastasis and then provide treatment recommendations tailored according to each patient’s comorbidities and their personal desire for accurate staging.
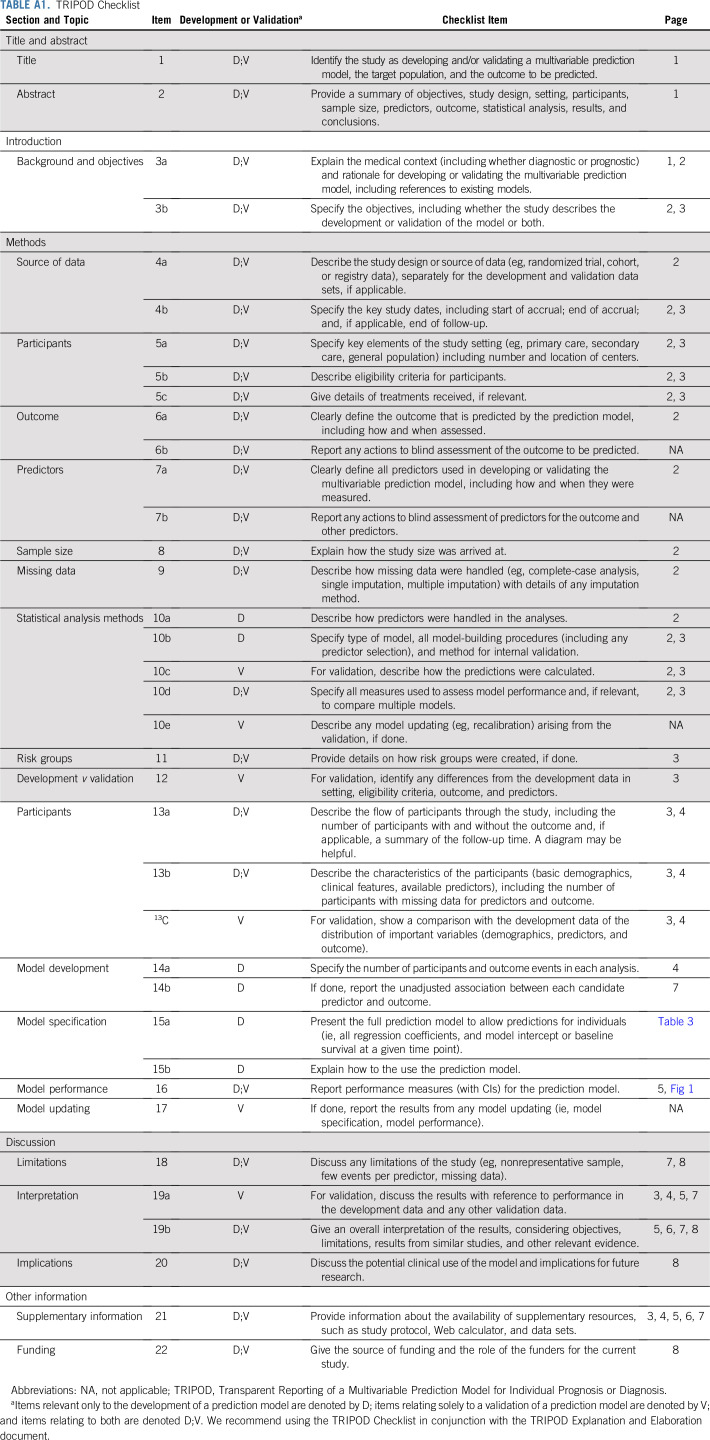
The most important attribute of a prediction tool is its accuracy.9 We postulated that the accuracy of the MSKCC nomogram could be improved by changing some of the clinicopathologic parameters used, in keeping with updates to the multivariable Cox regression model for melanoma survival developed by the American Joint Committee on Cancer (AJCC) Melanoma Expert Panel, which found that Clark level was not prognostically significant once tumor mitotic rate was included.10 The aim of the current study was to validate the MSKCC nomogram using our data, optimize it, and subsequently build an alternative nomogram by updating the model parameters and their weightings. This study was approved by the institutional review board and adhered to the Transparent Reporting of a Multivariable Prediction Model for Individual Prognosis or Diagnosis (TRIPOD) statement on reporting predictive models (Appendix Table A1, online only).11
PATIENTS AND METHODS
Deidentified data for patients with primary cutaneous melanomas who had a SN biopsy performed between January 2003 and December 2014 were extracted from the prospectively maintained research database at Melanoma Institute Australia (MIA). Information collected included age at melanoma diagnosis, site of the primary melanoma, tumor thickness, presence of ulceration, mitotic rate, Clark level, melanoma subtype, and SN status. Eligibility criteria included age ≥ 18 years and a tumor thickness ≤ 10.0 mm. Melanoma subtypes included were superficial spreading melanoma, nodular melanoma, desmoplastic melanoma (pure; ie, ≥ 90% desmoplasia), lentigo maligna melanoma, and acral melanoma. Other subtypes and unclassified melanomas were excluded. Patients with mixed desmoplastic melanoma (< 90% desmoplasia) were classified according to their predominant nondesmoplastic subtype. Only patients with all predefined variables available were selected. A total of 3,477 patients fulfilled all criteria and were included in the final analyses.
Patients were offered SN biopsy based on the Australian Melanoma Management Guidelines,12,13 which state that SN biopsy should be considered for patients with a primary melanoma > 1.0 mm thick and for patients with tumors < 1.0 mm thick but with adverse pathologic features (ie, ulceration and/or a mitotic rate ≥ 1/mm2). The MSKCC nomogram was not routinely used when making recommendations for SN biopsy.
Having applied the existing MSKCC nomogram to the MIA data set using the MSKCC online prediction tool (MSKCC model), a new nomogram was developed based on a variable selection procedure in which the same parameters as the MSKCC model and additional parameters were considered and sequentially removed (MIA model). The full set of parameters evaluated were age, tumor thickness, ulceration, Clark level, primary tumor anatomic site, sex, mitotic rate, melanoma subtype, and lymphovascular invasion (LVI). Appraisal of the validity of the nomograms was performed by evaluating the discrimination and calibration characteristics of the models.1,2,4,5 The net reclassification index (NRI) was also derived to evaluate the gains in sensitivity and specificity of the MIA model over the MSKCC model.
MSKCC Model
The MSKCC online tool was used to calculate the probability of SN positivity for each patient in the MIA data set.
MIA Model
Covariate candidates for the model selection included all parameters in the MSKCC nomogram plus new variables that were considered likely to be predictive of SN positivity, namely mitotic rate, melanoma subtype, and LVI. Multivariable logistic regression analysis was used to create the model for the nomogram using the purposeful variables selection method.14 The final model included variables with a P < .05 or if they were confounders. Variables were defined as confounding when their removal resulted in at least a 20% change in any remaining parameter coefficient.
Nomogram Validation
For each of the 2 nomograms, the receiver operating characteristic (ROC) curve was plotted, based on the estimated individual probability of the patient being SN positive. The discriminative ability of each model was evaluated by measuring the area under the ROC curve (AUC). The AUC, also known as the C-statistic, is an accurate combined measure of the sensitivity (correctly classifying SN-positive patients) and specificity (correctly classifying SN-negative patients) of a diagnostic test.15,16 The DeLong method was used to calculate the 95% CIs for the AUC values and to test differences between AUCs. In addition, the predictive performance of the MIA model was compared with the recommendations for SN biopsy in the current National Comprehensive Cancer Network (NCCN) and ASCO/Society of Surgical Oncology (SSO) guidelines.
Robustness assessment of our model was performed by internal validation using the bootstrapping technique17 and cross-validation methods (see Data Supplement). The method consisted of drawing 1,000 random resamples with replacement from the original data set and computing the C-statistic at each iteration. The mean C-statistic from the bootstrap samples was then calculated.
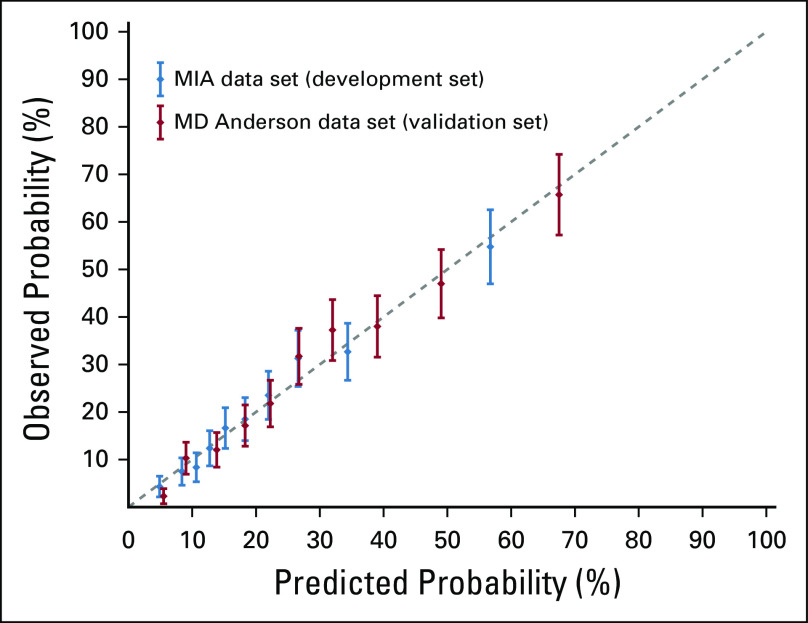
Calibration of the model was assessed by comparison of the predicted and observed risks of SN positivity. Risk groups were defined according to deciles of risk score from the prediction model. Within each group, the average predicted risk was plotted against the proportion observed to be SN positive. Linear regression was performed on this, and the R2 coefficient was taken as the quantitative calibration. The model’s goodness of fit was also tested using the Hosmer-Lemeshow test.
To assess how our model would perform when applied to an independent data set, we undertook an external validation using data from the prospectively maintained Melanoma Informatics, Tissue Resource, and Translational Pathology Core at The University of Texas MD Anderson Cancer Center (MD Anderson) research database. The validation data set used deidentified data for patients with primary cutaneous melanomas who had SN biopsy performed during the same period as the MIA data set. Only patients with all the final MIA model parameters were selected (n = 3,496). The external predictive performance of the MIA model was assessed using the MD Anderson data set.
NRI
Quantification of the degree of improvement achieved by the updated nomogram was evaluated by calculating the NRI.18 The NRI is the sum of the gain in both sensitivity and specificity for a given risk threshold. All statistical analyses were performed using R version 3.4.1 (R Core Team, Vienna, Austria).
RESULTS
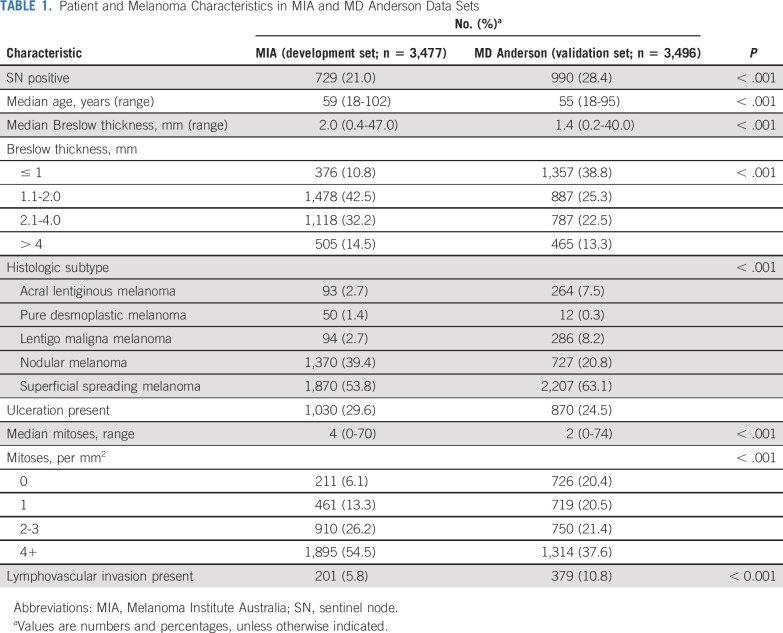
The MIA and MD Anderson clinicopathologic characteristics are listed in Table 1. The SN positivity rate was lower in the MIA data set (21.0%; n = 729) compared with the MD Anderson data set (28.44%; n = 990; P < .001). When comparing characteristics between the 2 data sets, all model parameters were statistically significantly different (P < .001). Characteristics of the MSKCC data set used to derive their nomogram and the MIA data set were also compared (Data Supplement).
TABLE 1.
Patient and Melanoma Characteristics in MIA and MD Anderson Data Sets
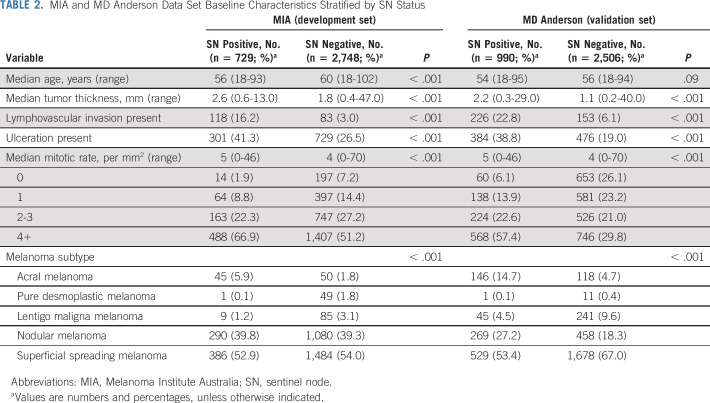
Comparison of clinicopathologic features between patients who were SN positive and SN negative yielded statistically-significant differences in both the MIA and the MD Anderson data sets. As expected, SN-positive patients had a greater tumor thickness, were more likely to have ulceration, and had a higher mitotic rate than SN-negative patients. Melanoma subtype was also statistically significantly different between SN-positive and SN-negative patients. Although SN-positive patients were younger, this difference was only statistically significant in the MIA data set. A full comparison is provided in Table 2.
TABLE 2.
MIA and MD Anderson Data Set Baseline Characteristics Stratified by SN Status
MSKCC Nomogram Replication
The ROC curve for the MSKCC model using the MIA data and the online prediction tool had a C-statistic of 67.7% (95% CI, 65.3% to 70.0%; Fig 1, teal curve).
FIG 1.
Receiver operating characteristic (ROC) curves showing performance of the Melanoma Institute Australia (MIA) model using both the development set (MIA, blue) and the validation set (MD Anderson Cancer Center, red). Other ROC curves using MIA cohort displayed are the Memorial Sloan Kettering Cancer Center (MSKCC) model (teal), National Comprehensive Cancer Network (NCCN) or ASCO/Society for Surgical Oncology (SSO) sentinel node (SN) biopsy recommendation criteria (orange), and ASCO/SSO criteria for considering SN biopsy (purple). The NCCN and ASCO/SSO ROC curves were obtained by joining the diagonal extremity points, passing through the corresponding guideline’s sensitivity and specificity values in the figure. The MIA model removed Clark level and primary tumor anatomic site and added tumor mitotic rate, melanoma subtype and lymphovascular invasion. The C-statistic improved in absolute terms by 6.2% (P < .001, DeLong) using the MIA model compared with the MSKCC model and by 20.2% compared with the NCCN or ASCO/SSO (T2+) criteria. The specificities for the NCCN or ASCO/SSO (T2+) criteria, the MSKCC model, and the MIA model were 12.4%, 13.4%, and 22.1%, respectively, for a 95% sensitivity.
MIA Nomogram Development
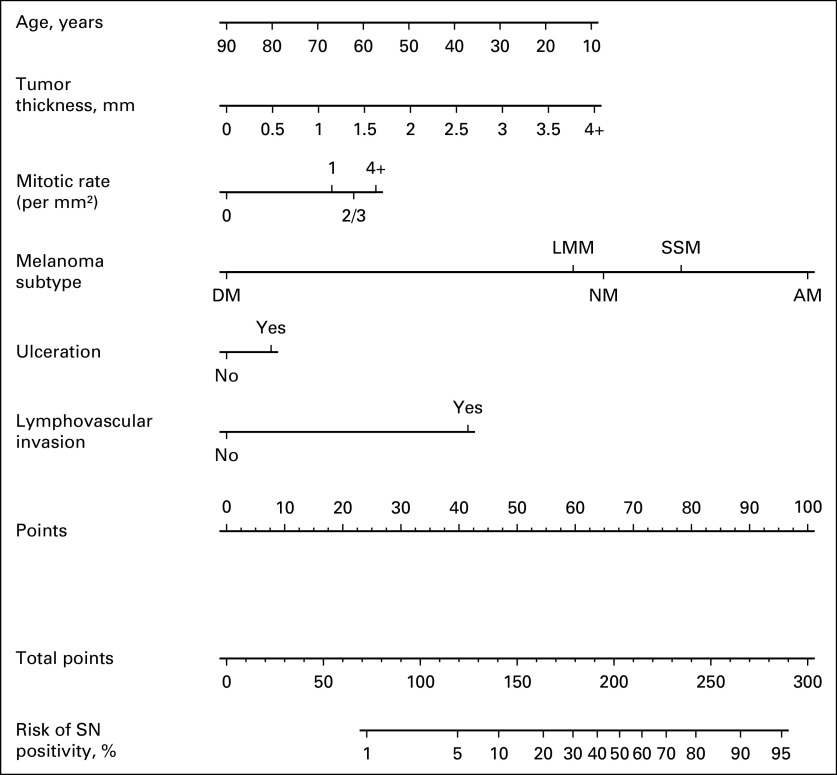
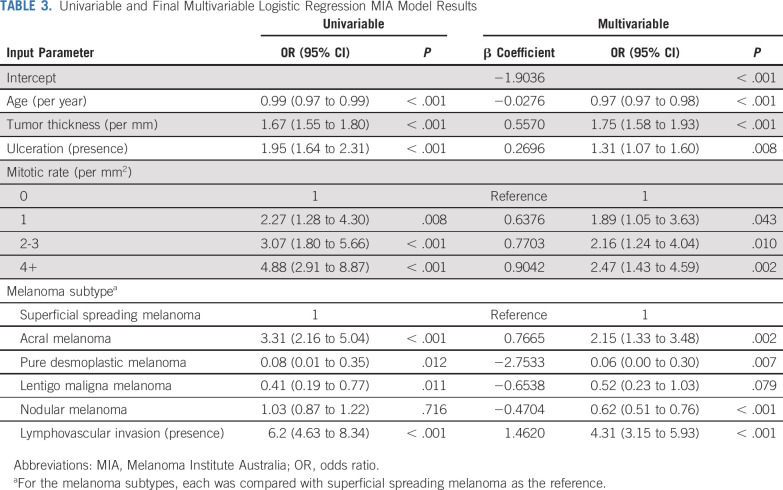
Compared with the MSKCC nomogram, the final MIA nomogram model (Fig 2, Table 3) included 3 new parameters (melanoma subtype, mitotic rate, and LVI). Clark level and body site were removed, whereas patient age, tumor thickness, and ulceration were retained. The corresponding covariance matrix of the coefficients was also provided (Data Supplement) to compute 95% CIs for the estimated risks.19 The predicted risks ranged from 0.3% to 91.7% in the MIA data set and from 0.3% to 94.9% in the MD Anderson data set. Importantly, 17.5% of patients (MIA) and 23.7% of patients (MD Anderson) had a risk between 5% and 10% (Data Supplement). An online version of the MIA nomogram is publicly available at www.melanomarisk.org.au.
FIG 2.
Melanoma Institute Australia sentinel node status prediction nomogram. To use the nomogram, the values for each prediction parameter are marked. From each mark, a vertical line is drawn downward to determine the points, and the points are added together. This value is marked on the Total-points line, and a vertical line is followed downward to the accompanying line labeled Risk of SN positivity. The figure on this line indicates the predicted risk that the patient will have a positive sentinel node (SN). Given the right skewness of tumor thickness (quantile 0.95 = 4), thickness > 4 mm was recoded as 4+. Mitotic rate (per mm2) was categorized with the following options: 0, 1, 2 or 3 (2/3), and 4 or more (4+). AM, acral melanoma; DM, desmoplastic melanoma (pure, ie ≥ 90% desmoplasia; patients with mixed desmoplastic melanoma [< 90% desmoplasia] were classified according to their predominant nondesmoplastic subtype); LMM, lentigo maligna melanoma; NM, nodular melanoma; SSM, superficial spreading melanoma.
TABLE 3.
Univariable and Final Multivariable Logistic Regression MIA Model Results
Discrimination
The C-statistic for the MIA nomogram was 73.9% (95% CI, 71.9% to 75.9%; Fig 1, blue curve), which represents a substantial and statistically significant increase compared with the MSKCC model (Fig 1, teal curve). The MIA model performed better than the MSKCC model throughout the full range of predicted risks, with both higher sensitivity and higher specificity. The NCCN20 and ASCO/SSO21 guidelines recommend performing SN biopsy on all patients with stage T2 melanoma and above (Fig 1, orange), which resulted in a C-statistic of 53.7% (95% CI, 52.7% to 54.7%) with a sensitivity of 95.0% and a specificity of 13.4%. When NCCN criteria for considering SN biopsy in T1 patients were used (ie, T1b or T1a with either mitotic rate ≥ 2/mm2 or LVI),20 the C-statistic was 50.5% (95% CI, 50.2% to 50.8%). Similarly, ASCO/SSO criteria for considering SN biopsy in T1b patients21 resulted in a C-statistic of 51.4% (95% CI, 50.9% to 51.9%; Fig 1, purple curve).
Among the 2,748 SN-negative patients, SN biopsy would not have been offered to 22.1% (n = 608), 13.4% (n = 359), and 12.4% (n = 332) based on the MIA model, the MSKCC model, and NCCN or ASCO/SSO (T2+) criteria, respectively, at a sensitivity of 95%. Internal validation of the MIA nomogram using bootstrap techniques resulted in a mean C-statistic of 74.1% (95% CI, 72.1% to 76.0%). External validation of the MIA nomogram using the MD Anderson data set achieved a C-statistic of 75.0% (95% CI, 73.2% to 76.7%; Fig 1, red curve).
Calibration
The calibration plots (Fig 3) indicated that the nomogram was well calibrated in both the MIA and the MD Anderson data sets, with a good linear correlation between predicted and observed probabilities of SN positivity (R2 = 0.98 in both the MIA and MD Anderson data sets). The P values for the Hosmer-Lemeshow test were P = .387 and P = .368 using the MIA and MD Anderson data sets, respectively, indicating good agreement between observed and predicted probabilities overall and within subgroups of participants.
FIG 3.
Calibration plot comparing estimated proportion of sentinel node (SN) positivity from the Melanoma Institute Australia (MIA) nomogram and the observed proportion of SN positivity for each of the risk groups defined according to deciles of predicted risk score. The error bars are Clopper-Pearson 95% CIs. The dashed diagonal line is the reference line, indicating the probability of an ideal nomogram. Both MIA and MD Anderson data sets were used.
NRI
An assessment of the total NRI along with the changes in sensitivity and specificity when the MIA model was compared with the MSKCC model is provided in the Data Supplement. The MIA model showed a continuous improvement for all thresholds considered.
DISCUSSION
The ability to optimally select patients for SN biopsy is important for both clinicians and the patients themselves to minimize the associated costs and minor morbidity risks, while also providing the most accurate prognostic and staging information.22 Furthermore, many patients who have a positive SN biopsy benefit from adjuvant systemic therapy that improves survival.23-26 Accordingly, we developed a new nomogram that more accurately predicted the risk of SN positivity in patients with melanoma than the existing MSKCC melanoma nomogram, using an updated and refined set of clinicopathologic parameters. This improvement was substantial, with a 9.2% increase in accuracy. Our study used an Australian population, with data for more than 3 times as many patients (n = 3,477) as the number of patients on which the MSKCC nomogram was originally based (n = 979).
Using the original MSKCC model, the C-statistic calculated using our data was 67.7%, close to the original publication’s value of 69.4% in the validation set.2 Pasquali et al1,27a also performed an external validation of the MSKCC nomogram, using a cohort of 543 Italian patients, and achieved a C-statistic of 68%, which corresponds well both with our results and those of the original study.2 Although 2 other external validation studies of the MSKCC melanoma nomogram achieved C-statistics of 86.9% and 80.5%, the sample sizes were small, with only 218 and 124 patients, respectively4,5; therefore, these figures must be interpreted with caution.
The importance of SN status for accurate staging of patients with primary melanoma is emphasized by its central role within the new (eighth edition) AJCC melanoma staging system.27 This required SN biopsy for patients with T2 through T4 primary melanomas to be included in AJCC staging.28 However, the weakness of this approach for selecting patients for SN biopsy is that it is based primarily on tumor thickness and does not take into account other significant risk factors, which can also be important, as demonstrated by their weightings in the MIA nomogram (Table 3). This results in nonspecific (12.4%) but highly sensitive (95%) criteria for SN biopsy, with a low C-statistic of 53.7%. However, at the same 95.0% sensitivity level as the NCCN or ASCO/SSO (T2+) criteria, the specificity of the MSKCC model was 13.4% (1.0% higher), whereas using the MIA model, it was almost doubled at 22.1% (9.7% higher; Fig 1). These results show the higher performance of risk prediction modeling over criteria-based selection, particularly because it is the level of risk that should be the determining factor for patients deciding whether to have an SN biopsy.
For example, a 25-year-old patient diagnosed with a 0.7-mm acral melanoma with absence of mitoses, no ulceration, and no LVI has a 19% risk of having an SN metastasis. In contrast, a 55-year-old patient with a 2.0-mm pure desmoplastic melanoma (ie, ≥ 90% desmoplasia) with absence of mitoses, no ulceration, and no LVI has only a 1% risk of SN metastasis. However, according to NCCN or ASCO/SSO guidelines, an SN biopsy would not be recommended for the first patient, but it would be for the second, despite the risk of SN positivity supporting only the first patient having an SN biopsy. Therefore, a risk-based approach using a nomogram such as ours with a threshold in the range of 5% to 10% is likely to be a more logical approach for selecting patients who should appropriately be offered SN biopsy.
Using the MSKCC online nomogram to calculate the predicted risk for the MIA population, we demonstrated its validity in our population, achieving a C-statistic of 67.7%. In the absence of the actual parameter weightings for the MSKCC model, we estimated them using our own data set and found the 68.1% C-statistic to be similar to that for the MSKCC online tool (Data Supplement). This confirms that the improvements in our updated (MIA) model were likely to be real rather than a result of overfitting of the model to our data set. Validation of the MIA nomogram was assessed through its discriminative power and calibration; the C-statistic was 73.9%. The calibration curve for our model achieved a regression coefficient of 0.98 using both the development (MIA) and the validation (MD Anderson) data sets, indicating a high degree of correlation between the nomogram-predicted risk and the actual observed rate of SN positivity. This held true throughout the full range of predicted risks. The absolute gain in the C-statistic of 6.2% is substantial.29
External validation of the MIA model using the independent MD Anderson data set showed a similar C-statistic (75.0%), confirming the accuracy of the new model. Importantly, the MD Anderson data set was significantly different in all the parameters used (Table 2), emphasizing the generalizability of the model to the wider melanoma population.30 This was also consistent with our internal validation using the bootstrap method, which had a mean C-statistic of 74.1%. The consistency of these results, with both internal and external validation, demonstrated the robustness and stability of our model’s predictive performance.
The possibility of false-negative SN biopsies in the study cohorts was not accounted for in our model.3 However, its purpose was simply to predict SN status, as assessed by histopathologic examination, and not to predict regional node spread, which can be assessed only by long-term clinical follow-up.
The distribution of predicted SN positivity risk for tumors by thickness and histologic subtype demonstrated an increasing median risk because Breslow thickness increased in both data sets (Data Supplement). However, there was a significant proportion of low-risk patients in all Breslow thickness groups; overall, 153 patients (4.4%) and 434 patients (12.4%) had predicted risks < 5% in the MIA and MD Anderson data sets, respectively. Furthermore, these figures showed that some patients with thin melanomas (≤ 0.5 mm thickness) may have a > 10% risk, particularly if the histologic subtype is acral or superficial spreading melanoma. Conversely, patients with melanoma thickness > 4 mm and a pure desmoplastic subtype may have a < 5% risk of SN positivity.
Although the accuracy of our nomogram was assessed by both internal and external validation, additional external validation studies using data sets from other populations would allow further assessment of the accuracy and applicability of this new nomogram in the broader population of patients with primary cutaneous melanomas. In the future, the NCCN, ASCO, SSO, and other groups responsible for developing melanoma management guidelines could consider recommending that patients undergo SN biopsy based on a risk prediction scoring system that takes into account all parameters with predictive power, as well as the patient’s overall clinical presentation. This would facilitate the stated desire of the NCCN to have a risk threshold of 5%-10% for considering SN biopsy20 and would be much more reliably achieved than by using the current criteria.
In conclusion, the MIA SN status prediction model replaced body site and Clark level of the primary melanoma in the MSKCC model with mitotic rate, melanoma subtype, and presence of LVI. These changes increased the C-statistic to 73.9%, a 9.2% increase in accuracy relative to the MSKCC model. The superior accuracy of SN status prediction was confirmed on both internal and external validation. Compared with the NCCN or ASCO/SSO (T2+) criteria, the use of our model would significantly reduce the number of SN-negative patients undergoing SN biopsy unnecessarily, without missing any SN-positive patients. Furthermore, using our MIA risk prediction tool allows a tailored risk threshold to be used for each patient depending on factors such as comorbidities and patient preferences. This nomogram is sim-ple to use, only increasing the number of input parameters by 1 parameter. In addition, the tool still performs well with omission of any of the 3 new prognostic factors (ulceration, mitotic rate, and LVI) if they are not available. However, this will slightly reduce the predictive performance of the model.
ACKNOWLEDGMENT
We gratefully acknowledge support from our colleagues at Melanoma Institute Australia and the Royal Prince Alfred Hospital, Sydney. Particular thanks go to Hazel Burke for her assistance with data extraction and Gayan Jayaweera for the online tool for the nomogram. S.N.L. would like to thank Angela Webster, PhD, for her advice that initiated this research. We also thank the Cameron family for their generous support of clinical research data collection at Melanoma Institute Australia.
APPENDIX
TABLE A1.
TRIPOD Checklist
SUPPORT
Supported by an Australian National Health and Medical Research Council Practitioner Fellowship (R.A.S), an Australia NHMRC program grant (to R.A.S., G.J.M., and J.F.T.), the Medical Foundation of the University of Sydney (J.F.T.), Melanoma Institute Australia (J.R.S., R.P.M.S., and S.N.L.), the Friends of the Mater Foundation (A.J.S.), an Australian Medical Research Future Fund Rapid Applied Research Translation Grant via Sydney Health Partners (A.H.R.V.), the Robert and Lynne Grossman Family Foundation (J.E.G.), the Michael and Patricia Booker Melanoma Research Endowment (J.E.G.), the National Institutes of Health Specialized Programs of Research Excellence grant in melanoma at The University of Texas MD Anderson Cancer Center (Grant No. 1P50CA221703, J.E.G.), and philanthropic contributions to the Melanoma Moon Shots Program of MD Anderson (J.E.G.).
See accompanying editorial on page 2706
AUTHOR CONTRIBUTIONS
Conception and design: Serigne N. Lo, Jiawen Ma, Richard A. Scolyer, Jonathan R. Stretch, Andrew J. Spillane, Graham J. Mann, John F. Thompson, Alexander H. R. Varey
Financial support: Richard A. Scolyer, Jeffrey E. Gershenwald, Alexander H. R. Varey
Administrative support: Richard A. Scolyer, Jeffrey E. Gershenwald
Provision of study materials or patients: Richard A. Scolyer, Lauren E. Haydu, Jonathan R. Stretch, Robyn P. M. Saw, Omgo E. Nieweg, Kerwin F. Shannon, Sydney Ch’ng, Jeffrey E. Gershenwald, John F. Thompson
Collection and assembly of data: Serigne N. Lo, Jiawen Ma, Richard A. Scolyer, Lauren E. Haydu, Jonathan R. Stretch, Robyn P. M. Saw, Omgo E. Nieweg, Kerwin F. Shannon, Sydney Ch’ng, Graham J. Mann, Jeffrey E. Gershenwald, John F. Thompson, Alexander H. R. Varey
Data analysis and interpretation: Serigne N. Lo, Jiawen Ma, Richard A. Scolyer, Lauren E. Haydu, Jonathan R. Stretch, Robyn P. M. Saw, Omgo E. Nieweg, Andrew J. Spillane, Sydney Ch’ng, Graham J. Mann, Jeffrey E. Gershenwald, John F. Thompson, Alexander H. R. Varey
Manuscript writing: All authors
Final approval of manuscript: All authors
Accountable for all aspects of the work: All authors
AUTHORS' DISCLOSURES OF POTENTIAL CONFLICTS OF INTEREST
Improved Risk Prediction Calculator for Sentinel Node Positivity in Patients With Melanoma: The Melanoma Institute Australia Nomogram
The following represents disclosure information provided by authors of this manuscript. All relationships are considered compensated unless otherwise noted. Relationships are self-held unless noted. I = Immediate Family Member, Inst = My Institution. Relationships may not relate to the subject matter of this manuscript. For more information about ASCO's conflict of interest policy, please refer to www.asco.org/rwc or ascopubs.org/jco/authors/author-center.
Open Payments is a public database containing information reported by companies about payments made to US-licensed physicians (Open Payments).
Richard A. Scolyer
Honoraria: Merck Sharp & Dohme, Novartis, Myriad Pharmaceuticals, NeraCare GmbH
Consulting or Advisory Role: Merck Sharp & Dohme, Novartis, Myriad Pharmaceuticals, NeraCare GmbH
Robyn P. M. Saw
Honoraria: Merck Sharp & Dohme, Novartis
Consulting or Advisory Role: Merck Sharp & Dohme, Novartis
Kerwin F. Shannon
Honoraria: Merck Serono
Consulting or Advisory Role: Merck Serono
Andrew J. Spillane
Honoraria: Stryker
Jeffrey E. Gershenwald
Consulting or Advisory Role: Merck, Novartis, Syndax, Bristol Myers Squibb, Novartis
Patents, Royalties, Other Intellectual Property: Mercator Therapeutics
John F. Thompson
Honoraria: GlaxoSmithKline, Bristol Myers Squibb, MSD Australia, Provectus
Consulting or Advisory Role: GlaxoSmithKline, Bristol Myers Squibb, MSD Australia, Provectus
Travel, Accommodations, Expenses: Provectus, GlaxoSmithKline
Alexander H. R. Varey
Consulting or Advisory Role: Medtronic
Travel, Accommodations, Expenses: Synthes
No other potential conflicts of interest were reported.
REFERENCES
- 1.Gershenwald JE, Thompson W, Mansfield PF, et al. Multi-institutional melanoma lymphatic mapping experience: The prognostic value of sentinel lymph node status in 612 stage I or II melanoma patients. J Clin Oncol. 1999;17:976–983. doi: 10.1200/JCO.1999.17.3.976. [DOI] [PubMed] [Google Scholar]
- 2.Wong SL, Kattan MW, McMasters KM, et al. A nomogram that predicts the presence of sentinel node metastasis in melanoma with better discrimination than the American Joint Committee on Cancer staging system. Ann Surg Oncol. 2005;12:282–288. doi: 10.1245/ASO.2005.05.016. [DOI] [PubMed] [Google Scholar]
- 3.Morton DL, Thompson JF, Cochran AJ, et al. Final trial report of sentinel-node biopsy versus nodal observation in melanoma. N Engl J Med. 2014;370:599–609. doi: 10.1056/NEJMoa1310460. [DOI] [PMC free article] [PubMed] [Google Scholar]
- 4.Woods JF, De Marchi JA, Lowery AJ, et al. Validation of a nomogram predicting sentinel lymph node status in melanoma in an Irish population. Ir J Med Sci. 2015;184:769–773. doi: 10.1007/s11845-014-1166-4. [DOI] [PubMed] [Google Scholar]
- 5.Piñero A, Canteras M, Ortiz E, et al. Validation of a nomogram to predict the presence of sentinel lymph node metastases in melanoma. Ann Surg Oncol. 2008;15:2874–2877. doi: 10.1245/s10434-008-0077-x. [DOI] [PubMed] [Google Scholar]
- 6.Morton DL, Thompson JF, Cochran AJ, et al. Sentinel-node biopsy or nodal observation in melanoma. N Engl J Med. 2006;355:1307–1317. doi: 10.1056/NEJMoa060992. [DOI] [PubMed] [Google Scholar]
- 7.Biver-Dalle C, Puzenat E, Puyraveau M, et al. Sentinel lymph node biopsy in melanoma: Our 8-year clinical experience in a single French institute (2002-2009) BMC Dermatol. 2012;12:21. doi: 10.1186/1471-5945-12-21. [DOI] [PMC free article] [PubMed] [Google Scholar]
- 8.Gyorki DE, Barbour A, Hanikeri M, et al. When is a sentinel node biopsy indicated for patients with primary melanoma? An update of the ‘Australian guidelines for the management of cutaneous melanoma.’. Australas J Dermatol. 2017;58:274–277. doi: 10.1111/ajd.12662. [DOI] [PubMed] [Google Scholar]
- 9.Zabor EC, Coit D, Gershenwald JE, et al. Variability in predictions from online tools: A demonstration using internet-based melanoma predictors. Ann Surg Oncol. 2018;25:2172–2177. doi: 10.1245/s10434-018-6370-4. [DOI] [PMC free article] [PubMed] [Google Scholar]
- 10.Balch CM, Gershenwald JE, Soong SJ, et al. Final version of 2009 AJCC melanoma staging and classification. J Clin Oncol. 2009;27:6199–6206. doi: 10.1200/JCO.2009.23.4799. [DOI] [PMC free article] [PubMed] [Google Scholar]
- 11.Collins GS, Reitsma JB, Altman DG, et al. Transparent reporting of a multivariable prediction model for Individual Prognosis or Diagnosis (TRIPOD): The TRIPOD statement. J Clin Epidemiol. 2015;68:134–143. doi: 10.1016/j.jclinepi.2014.11.010. [DOI] [PubMed] [Google Scholar]
- 12. National Health and Medical Research Council: Clinical Practice Guidelines for the Management of Melanoma. Canberra, Australia. National Health and Medical Research Council, 1999. [Google Scholar]
- 13. National Health and Medical Research Council: Clinical practice guidelines for the management of melanoma in Australia and New Zealand. https://www.health.govt.nz/system/files/documents/publications/melanoma-guideline-nov08-v2.pdf.
- 14.Bursac Z, Gauss CH, Williams DK, et al. Purposeful selection of variables in logistic regression. Source Code Biol Med. 2008;3:17. doi: 10.1186/1751-0473-3-17. [DOI] [PMC free article] [PubMed] [Google Scholar]
- 15.Mandrekar JN. Receiver operating characteristic curve in diagnostic test assessment. J Thorac Oncol. 2010;5:1315–1316. doi: 10.1097/JTO.0b013e3181ec173d. [DOI] [PubMed] [Google Scholar]
- 16.Kumar R, Indrayan A. Receiver operating characteristic (ROC) curve for medical researchers. Indian Pediatr. 2011;48:277–287. doi: 10.1007/s13312-011-0055-4. [DOI] [PubMed] [Google Scholar]
- 17.Harrell FE, Jr, Lee KL, Mark DB. Multivariable prognostic models: Issues in developing models, evaluating assumptions and adequacy, and measuring and reducing errors. Stat Med. 1996;15:361–387. doi: 10.1002/(SICI)1097-0258(19960229)15:4<361::AID-SIM168>3.0.CO;2-4. [DOI] [PubMed] [Google Scholar]
- 18.Pencina MJ, D’Agostino RB, Sr, D’Agostino RB, Jr, et al. Evaluating the added predictive ability of a new marker: From area under the ROC curve to reclassification and beyond. Stat Med. 2008;27:157–172, discussion 207-212. doi: 10.1002/sim.2929. [DOI] [PubMed] [Google Scholar]
- 19.Hosmer DW, Lemeshow S. Confidence interval estimates of an index of quality performance based on logistic regression models. Stat Med. 1995;14:2161–2172. doi: 10.1002/sim.4780141909. [DOI] [PubMed] [Google Scholar]
- 20. Coit DG, Thompson JA, Albertini MR, et al: Cutaneous Melanoma, Version 3.2019. NCCN Clinical Practice Guidelines in Oncology, Plymouth Meeting, PA, National Comprehensive Cancer Network, 2019. [DOI] [PubMed] [Google Scholar]
- 21.Wong SL, Faries MB, Kennedy EB, et al. Sentinel lymph node biopsy and management of regional lymph nodes in melanoma: American Society of Clinical Oncology and Society of Surgical Oncology clinical practice guideline update. J Clin Oncol. 2018;36:399–413. doi: 10.1200/JCO.2017.75.7724. [DOI] [PubMed] [Google Scholar]
- 22.Friedman EB, Moncrieff MD, Lo S, et al. Sentinel lymph node biopsy remains the most accurate method of obtaining staging and prognostic information for patients with primary cutaneous melanomas. Australas J Dermatol. 2019;60:75–76. doi: 10.1111/ajd.12942. [DOI] [PubMed] [Google Scholar]
- 23.Eggermont AMM, Chiarion-Sileni V, Grob JJ, et al. Adjuvant ipilimumab versus placebo after complete resection of stage III melanoma: Long-term follow-up results of the European Organisation for Research and Treatment of Cancer 18071 double-blind phase 3 randomised trial. Eur J Cancer. 2019;119:1–10. doi: 10.1016/j.ejca.2019.07.001. [DOI] [PubMed] [Google Scholar]
- 24.Long GV, Hauschild A, Santinami M, et al. Adjuvant dabrafenib plus trametinib in stage III BRAF-mutated melanoma. N Engl J Med. 2017;377:1813–1823. doi: 10.1056/NEJMoa1708539. [DOI] [PubMed] [Google Scholar]
- 25.Weber J, Mandala M, Del Vecchio M, et al. Adjuvant nivolumab versus ipilimumab in resected stage III or IV melanoma. N Engl J Med. 2017;377:1824–1835. doi: 10.1056/NEJMoa1709030. [DOI] [PubMed] [Google Scholar]
- 26.Eggermont AMM, Blank CU, Mandala M, et al. Adjuvant pembrolizumab versus placebo in resected stage III melanoma. N Engl J Med. 2018;378:1789–1801. doi: 10.1056/NEJMoa1802357. [DOI] [PubMed] [Google Scholar]
- 27. Amin MB, Edge SB, Greene FL, et al (eds): AJCC Cancer Staging Manual (ed 8). New York, NY, Springer International Publishing, 2017. [Google Scholar]
- 27a.Pasquali S, Mocellin S, Campana LG, et al. Maximizing the clinical usefulness of a nomogram to select patients candidate to sentinel node biopsy for cutaneous melanoma. Eur J Surg Oncol. 2011;37:675–680. doi: 10.1016/j.ejso.2011.05.007. [DOI] [PubMed] [Google Scholar]
- 28. Gershenwald JE, Scolyer RA, Hess KR, et al: Melanoma of the skin, in Amin MB, Edge SB, Greene FL, et al (eds): AJCC Cancer Staging Manual (ed 8). New York, NY, Springer International Publishing, 2017, pp 563-585. [Google Scholar]
- 29.Pencina MJ, D’Agostino RB, Pencina KM, et al. Interpreting incremental value of markers added to risk prediction models. Am J Epidemiol. 2012;176:473–481. doi: 10.1093/aje/kws207. [DOI] [PMC free article] [PubMed] [Google Scholar]
- 30.Moons KG, Kengne AP, Woodward M, et al. Risk prediction models: I. Development, internal validation, and assessing the incremental value of a new (bio)marker. Heart. 2012;98:683–690. doi: 10.1136/heartjnl-2011-301246. [DOI] [PubMed] [Google Scholar]


