

Abstract
The VIIRS instrument on board the S-NPP spacecraft has successfully operated for more than four years since its launch in October, 2011. Many VIIRS environmental data records (EDR) have been continuously generated from its sensor data records (SDR) with improved quality, enabling a wide range of applications in support of users in both the operational and research communities. This paper provides a brief review of sensor on-orbit calibration methodologies for both the reflective solar bands (RSB) and the thermal emissive bands (TEB) and an overall assessment of their on-orbit radiometric performance using measurements from instrument on-board calibrators (OBC) as well as regularly scheduled lunar observations. It describes and illustrates changes made and to be made for calibration and data quality improvements. Throughout the mission, all of the OBC have continued to operate and function normally, allowing critical calibration parameters used in the data production systems to be derived and updated. The temperatures of the on-board blackbody (BB) and the cold focal plane assemblies are controlled with excellent stability. Despite large optical throughput degradation discovered shortly after launch in several near and short-wave infrared spectral bands and strong wavelength dependent solar diffuser degradation, the VIIRS overall performance has continued to meet its design requirements. Also discussed in this paper are challenging issues identified and efforts to be made to further enhance the sensor calibration and characterization, thereby maintaining or improving data quality.
Keywords: S-NPP, VIIRS, on-orbit, radiometric, performance, calibration
1. Introduction
The first Visible Infrared Imaging Radiometer Suite (VIIRS) sensor on board the Suomi National Polar Orbiting Partnership (S-NPP) satellite has been successfully operated for 4 years since its launch in October, 2011. Designed with a strong MODIS heritage, VIIRS has 22 spectral bands spanning visible and infrared wavelengths from 0.4 μm to 12.5 μm. These bands are designed to support the generation of a number of environmental data records (EDR) that benefit users in the land, ocean, and atmospheric science disciplines [1–6]. The VIIRS instrument is a cross-track scanning (whiskbroom) radiometer. It uses a rotating telescope assembly (RTA) to collect data continuously from the Earth view (EV) and the calibration views every 1.78 seconds. In combination with the RTA, a half-angle mirror (HAM) rotates at half the rate of the RTA to direct light into stationary optics and onto different focal plane assemblies (FPAs). The S-NPP satellite is operated in a near sun-synchronous polar orbit with a nominal altitude of 828 km and at an inclination angle of approximately 98 degrees relative to the equator (the equatorial crossing time is 1:30 PM) [7]. With an EV scan angle range of about ±56 degrees, the VIIRS sensor is capable of making continuous global observations twice daily. The VIIRS spectral bands and detectors are located on three FPAs, the visible and near-infrared (VIS/NIR), the short- and mid-wave infrared (S/MWIR), and the long-wave infrared (LWIR). The S/MWIR and LWIR FPAs are temperature controlled at 80 K.
The fourteen reflective solar bands (RSB) are calibrated by observing solar radiance reflected off a solar diffuser (SD) and by observing a dark reference through a Space View (SV) port. A solar diffuser stability monitor (SDSM) is used to track the SD on-orbit degradation. The RSB consist of three imaging bands (I1 - I3) and eleven moderate resolution bands (M1 - M11). Of these, six bands (M1 - M5, and M7) are optimized using dual gain electronics such that the high gain stage is used over low radiance scenes (e.g. oceans) while low gain is used over mid/high radiance scenes (e.g. land and clouds). VIIRS also has a reflective solar, panchromatic Day-Night Band (DNB) on a separate FPA, used not only for imagery, but also for science studies of nighttime scenes with high radiometric quality. The seven thermal emissive bands (TEB) are calibrated using an on-board blackbody (BB) and dark offset signals from the SV. The TEB consist of two imaging bands (I4 - I5) and five moderate resolution bands (M12 - M16). M13 is the only dual gain band in the TEB, designed for measurements of high scene temperatures needed for fire products. The imaging and moderate resolution bands have nominal nadir spatial resolutions of 375 and 750 m, respectively, and the ground swath is approximately 3040 km in the cross-track direction. Some of the key characteristics of VIIRS spectral bands are shown in Table 1, including their wavelength ranges, focal plane location, typical and maximum scene spectral radiances or temperatures, and specified signal to noise ratios (SNR) or noise equivalent temperature differences (NEdT) at their corresponding typical radiances or temperatures. In this table, radiance and SNR are used for the RSB, while temperature and NEdT are used for the TEB.
Table 1.
VIIRS spectral band design specifications. VG denotes variable gain (low gain, middle gain, and high gain). Units are [Wm−2sr−1μm−1] for the RSB and [K] for the TEB; DNB radiance units are [Wm−2sr−1]. SNR are listed at Ltyp and NEdT are listed at Ttyp.
| Band | Spectral Range (μm) | Band Gain | Ltyp or Ttyp | Lmax or Tmax | SNR or NEdT | ||
|---|---|---|---|---|---|---|---|
|
Reflective Bands |
DNB | 0.500 – 0.900 | VG | 3E-05(*) | 200(*) | 6 | |
| VISNIR | M1 | 0.402 – 0.422 | High | 44.9 | 135 | 352 | |
| Low | 155 | 615 | 316 | ||||
| M2 | 0.436 – 0.454 | High | 40 | 127 | 380 | ||
| Low | 146 | 687 | 409 | ||||
| M3 | 0.478 – 0.498 | High | 32 | 107 | 416 | ||
| Low | 123 | 702 | 414 | ||||
| M4 | 0.545 – 0.565 | High | 21 | 78 | 362 | ||
| Low | 90 | 667 | 315 | ||||
| I1 | 0.600 – 0.680 | Single | 22 | 718 | 119 | ||
| M5 | 0.662 – 0.682 | High | 10 | 59 | 242 | ||
| Low | 68 | 651 | 360 | ||||
| M6 | 0.739 – 0.754 | Single | 9.6 | 41 | 199 | ||
| I2 | 0.846 – 0.885 | Single | 25 | 349 | 150 | ||
| M7 | 0.846 – 0.885 | High | 6.4 | 29 | 215 | ||
| Low | 33.4 | 349 | 340 | ||||
| S/WMIR | M8 | 1.230 – 1.250 | Single | 5.4 | 165 | 74 | |
| M9 | 1.371 – 1.386 | Single | 6 | 77.1 | 83 | ||
| I3 | 1.580 – 1.640 | Single | 7.3 | 72.5 | 6 | ||
| M10 | 1.580 – 1.640 | Single | 7.3 | 71.2 | 342 | ||
| M11 | 2.225 – 2.275 | Single | 0.12 | 31.8 | 10 | ||
|
Emissive Bands |
I4 | 3.550 – 3.930 | Single | 270 | 353 | 2.5 | |
| M12 | 3.660 – 3.840 | Single | 270 | 353 | 0.396 | ||
| M13 | 3.973 – 4.128 | High | 300 | 343 | 0.107 | ||
| Low | 380 | 634 | 0.423 | ||||
| LWIR | M14 | 8.400 – 8.700 | Single | 270 | 336 | 0.091 | |
| M15 | 10.263 – 11.263 | Single | 300 | 343 | 0.07 | ||
| I5 | 10.500 – 12.400 | Single | 210 | 340 | 1.5 | ||
| M16 | 11.538 – 12.488 | Single | 300 | 340 | 0.072 | ||
Listed in Table 2 are some of the key events for S-NPP VIIRS on-orbit operation and calibration. Prior to opening the nadir aperture door, a series of sensor and on-board calibrators (OBC) functional tests were conducted. The “first light” images on November 21, 2011 were produced by the spectral bands in the visible (VIS) and near infrared (NIR) spectral regions. Observations by S/MWIR and LWIR spectral bands were not scientifically useful before the cryo-cooler door was opened on January 18, 2012. It took about 2 days before the S/MWIR and LWIR FPAs reached their operational temperatures. Key calibration events performed during the sensor’s initial intensive calibration and validation phase included routine SDSM and BB operations as well as special calibration maneuvers. Only the first event of each routine calibration activity is listed in Table 2.
Table 2.
Key events for S-NPP VIIRS on-orbit operation and calibration.
| Date | Event Description |
|---|---|
| 10/28/2011 | Suomi-NPP launch |
| 11/08/2011 | VIIRS turned on |
| 11/08/2011 | First SDSM operation (initially every orbit) |
| 11/18/2011 | First RTA/HAM sync loss reported |
| 11/21/2011 | Nadir door open |
| 11/25/2011 | First VIIRS recommended operating procedure for DNB calibration |
| 11/25/2011 | First VIIRS safe mode due to 1394 data bus anomaly that caused Single Board Computer (SBC) lock-up |
| 01/04/2012 | First planned lunar calibration (with roll maneuver) |
| 01/18/2012 | Cryo-cooler door open |
| 01/19/2012 | SDSM calibration frequency changed to once per day |
| 02/06/2012 | First BB warm-up cool-down |
| 02/15/2012 | Yaw maneuver (fourteen orbits) |
| 02/20/2012 | Pitch maneuver |
| 03/24/2012 | Spacecraft anomaly – Sun point mode |
| 05/16/2014 | SDSM calibration frequency changed to three times a week |
The VIIRS sensor data records (SDR) generated from its EV observations include calibrated and geolocated radiance, as well as the reflectance and brightness temperature for the RSB and TEB respectively [8]. Since launch, processing of the SDR products has been under continuous enhancement either from the identification of and correction for mistakes in the operational processing algorithm, or due to better understanding of the sensor operations and generation of improved and consistent calibration look-up tables (LUTs) [9–11]. Currently, S-NPP VIIRS is normally operated with all product and intermediate product files being generated routinely and the LUTs updated on a regular basis in the operational processing system, leading to very stable and high quality instrument performance.
The list of activities performed to generate VIIRS SDR includes: new RSB calibration coefficients (in LUT form) developed every week to generate the radiance and reflectance in the SDR products [12]; the DNB detector offsets and gain ratios generated on a monthly basis [13]; and the LUTs needed for the DNB stray light correction are updated every month in the operational processing [13]. Other activities are also routinely performed to monitor the instrument calibration and data quality, which include monthly lunar views to track the quality of the SD based calibration for the RSB [14] and vicarious calibration to track the quality of the SDR data using stable and well characterized Earth view targets [15].
The SD on-orbit degradation continues to exhibit consistent wavelength dependence as reported previously [9,16], with more degradation towards the shorter wavelengths. The largest SD degradation is at 0.41 μm and is currently about 31 %. The large sensor responsivity degradation discovered shortly after S-NPP launch in some of the NIR and SWIR spectral bands is approaching its limit as predicted by the sensor degradation model [17,18]. The TEB performance in terms of detector response and noise characteristics remains extremely stable as reported in previous studies [19]. The largest change in TEB spectral band response has been less than 1.3 % (I5) since launch. The telemetry trending of the VIIRS instrument has also exhibited the high stability of various instrument temperatures, showing well-controlled cold FPAs and BB, with temperature variations being less than 6 mK and 25 mK respectively.
This paper provides the status of VIIRS instrument operations and calibration activities that are crucial to the SDR and EDR data quality. To some extent, this paper is an update to our previous study of VIIRS initial on-orbit calibration and performance [9]. In addition, it describes key changes that have been made in support of the SDR data processing system, including the offline processing and generation of calibration LUTs, to either enhance data quality or to mitigate issues affecting the sensor performance. Section 2 of this paper will provide a brief overview of VIIRS on-orbit calibration methodologies and activities, including the lunar calibration scheduling and implementation strategies. Section 3 will present the on-orbit calibration performance results based on OBC and telemetry data, including on-orbit changes in spectral band responses and sensor characterization, as well as calibration improvements. A list of lessons learned and future work to mitigate concerns identified in the operational processing will be discussed in Section 4, followed by a conclusion and summary in Section 5.
2. On-orbit Calibration Methodologies and Activities
The VIIRS solar calibration system designed for the RSB consists of an on-board SD, a permanent solar attenuation screen (SAS), and an on-board SDSM. The SDSM is a ratioing device used to track on-orbit changes in the SD bidirectional reflectance distribution function (BRDF) via alternate measurements of direct sunlight through a fixed attenuation screen and the sunlight reflected off the SD panel. The DNB low gain stage is also calibrated by the SD/SDSM system. In addition to solar calibration, regularly scheduled lunar observations made through the instrument SV port are used to support RSB on-orbit calibration. For the TEB, an on-board V-grooved BB panel is used as the calibration target. Illustrated in Figure 1 are the VIIRS instrument scan cavity and the OBC, including its extended SV port for lunar acquisitions and measurements of instrument background and offset reference.
Figure 1.
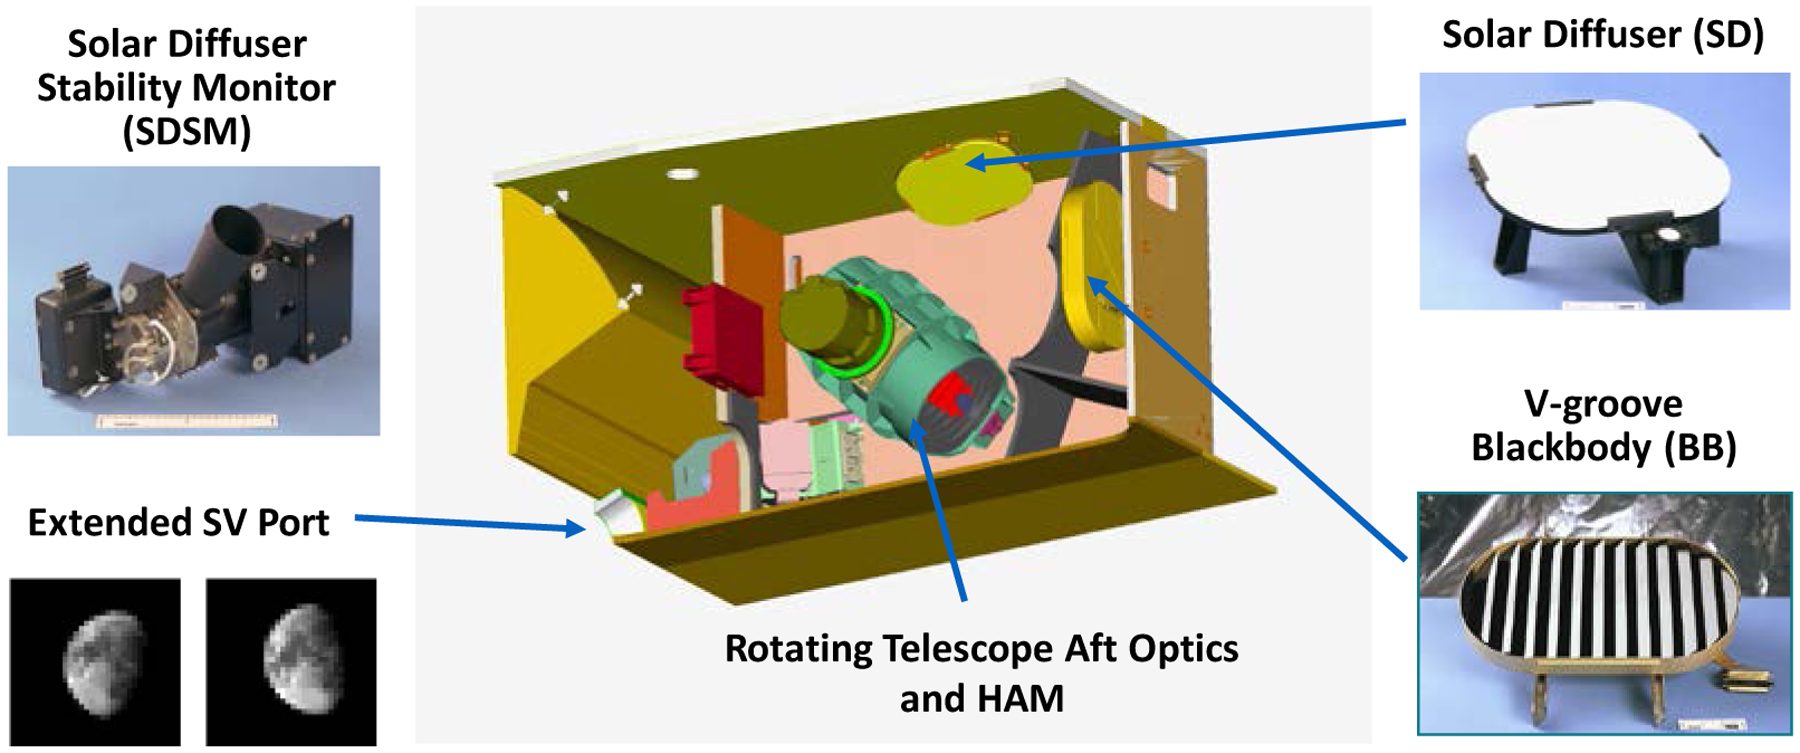
VIIRS sensor showing the positions of the SD, SDSM, BB, and SV.
Both VIIRS RSB and TEB apply a quadratic polynomial algorithm to retrieve their EV scene spectral radiance using their background subtracted detector response (dnEV),
| (1) |
where c0, c1, and c2 are the instrument temperature dependent calibration coefficients derived from pre-launch characterization, RVSEV is the detector’s response versus scan angle at the EV HAM angle of incidence (AOI), also derived from pre-launch measurements, and F is a calibration scaling factor derived from on-orbit measurements of the SD or BB, known as the F-factor [8].
Specifically, the F-factor is determined by comparing the known calibration source spectral radiance (LCS) with that retrieved by the sensor (LRET) using the pre-launch calibration coefficients,
| (2) |
where
| (3) |
Similarly to Equation (1), the dnCS and RVSCS in Equation (3) are the detector response to the known calibration source and the RVS at the calibration source view HAM AOI, respectively.
2.1. Solar Calibration for the RSB
For the RSB, the on-board SD provides a known calibration source when it is fully illuminated by the Sun. In this case, the LRET is computed using Equation (3) with the subscript CS replaced by SD. The calibration source spectral radiance can be computed from the solar spectral irradiance at the spacecraft, ESUN(λ), and the SD BRDF(λ) using the following expression,
| (4) |
where τSAS is the SAS transmission function, θSD is the SD solar zenith angle, and λ is the wavelength. The ESUN and SD BRDF in Equation (4) are weighted by the detector’s relative spectral response, RSR(λ). The RSB F-factor for each calibration event is the average of multiple scan-by-scan computations when the SD is fully illuminated by the sun, and is band, detector, and HAM side dependent [9]. The official RSR and ESUN functions used for VIIRS SDR calibration can be found at the NOAA website (https://cs.star.nesdis.noaa.gov/NCC/StandardizedCalibrationParameters). The SD BRDF is based on the pre-launch BRDF0 with corrections applied to account for its on-orbit degradation.
Algorithm details for using the SDSM to track the on-orbit SD degradation can be found in a number of references [16,20,21]. For VIIRS, an H-factor is used to represent the SD BRDF degradation. It is determined from the time series of ratios of the SDSM’s SD view response (dcSD) to its Sun view response (dcSUN),
| (5) |
where τSUN is the transmission function for the SDSM Sun view screen. The SDSM has 8 detectors (D1 - D8) with their center wavelengths located at 0.41, 0.44, 0.49, 0.56, 0.67, 0.75, 0.86, and 0.93 μm, respectively. The H-factor is separately computed using measurements made by each SDSM detector.
2.2. Lunar Calibration for the RSB
The Moon is an extremely stable radiometric calibration target in the reflective solar spectral region [22]. Like MODIS, VIIRS lunar observations have been regularly scheduled and implemented in support of its RSB on-orbit calibration. Similar to the solar calibration, a lunar calibration F-factor (FMOON) for the RSB is derived using the following expression,
| (6) |
where IMODEL and IRET are the model predicted lunar irradiance, integrated over the entire lunar disk, and sensor retrieved lunar irradiance, respectively. Currently, the USGS Robotic Lunar Observatory (ROLO) lunar model is used as VIIRS lunar calibration reference. The ROLO model provides the predicted lunar irradiance values (IMODEL) that depend on lunar viewing parameters, such as the Sun-Earth and sensor-Moon distances, the lunar phase angle, and lunar libration. The lunar irradiance retrieved by the sensor (IRET) is computed by integrating the radiances from individual detectors over the lunar disk using their pre-launch calibration coefficients. Details of VIIRS lunar calibration methodologies are found in a number of references [14,23–26].
It should be noted that FMOON is determined for each spectral band and detector at the HAM AOI of 60.2 degrees, which is nearly identical to the SD HAM AOI. As a result, temporal changes in FMOON reflect on-orbit changes in spectral band or detector response (or gain) and can be independently used to validate, and correct if necessary, the temporal changes in the SD F-factor. FMOON is currently calculated using the “center-scans” approach by integrating the radiance of all detectors for each scan with complete lunar images captured by the FPA. In addition, detector dependent FMOON factors can be derived using the “all-scans” approach by integrating the radiance of all scans with lunar images for each detector [26].
2.3. DNB Calibration
The VIIRS DNB is designed to make global observations during both day and nighttime with a large dynamic range implemented through three different gain stages: low gain stage (LGS), mid-gain stage (MGS), and high gain stage (HGS). Each gain stage is a separate CCD (HGS has two redundant CCD arrays, HGA and HGB). It has 32 aggregation modes, implemented to achieve a nearly constant footprint across the entire scan. The DNB calibration is performed separately for each gain stage and aggregation mode. The DNB on-orbit calibration requires three pieces of information: the dark offset, the LGS linear gain, and the gain ratios (MGS/LGS and HGS/MGS) [13].
The DNB dark offsets were determined early in the mission using data collected during the spacecraft pitch maneuver. Their on-orbit changes are tracked using on-board BB data collected under the darkest conditions (nighttime over the Pacific Ocean during new moon). The DNB LGS calibration coefficients are determined from on-orbit SD observations when the SD is fully illuminated by sunlight, with the exception that the DNB radiance retrieved and used in the calibration is the spectral band integrated radiance (units: Wm−2sr−1). The LGS calibration is transferred to the MGS and HGS via gain ratios determined from SD view data collected before and after the SD is fully illuminated.
2.4. BB Calibration for the TEB
The VIIRS TEB on-orbit calibration is performed with reference to the on-board BB. The calibration source spectral radiance (LCS) is modeled as the radiance difference between the BB and SV paths, or
| (7) |
where LBB, LRTA, and LHAM are the radiances of the BB, RTA, and HAM averaged over the spectral response of each band, RVSSV and RVSBB are the RVS at the SV and BB HAM AOI, respectively, and ρRTA is the reflectivity of the RTA mirrors. The TEB calibration source radiance is the sum of emitted radiance and reflected radiance (emission from thermal sources around the BB, reflected off the BB into the optical path). The emitted BB contribution is the dominant term, as the BB has an emissivity above 99.6 %. The other terms in Equation (7) account for the RTA and HAM emission that do not cancel in the path difference (due to differences in the RVS at the two view angles). Similar contributions from RTA and HAM emission must also be included in Equation (1) for the TEB EV radiance retrieval [9, 19].
Again, Equation (3) is used to determine the retrieved spectral radiance (LRET) for the BB view by replacing the subscript CS with BB. The TEB F-factors are then estimated by substituting Equations (3) and (7) into Equation (2). This is performed every other scan for all TEB because of the two HAM sides, except for M13 high gain where the F-factors are calculated every fourth scan (M13 low gain F-factors are set to one, as the BB radiance is too low for accurate trending).
2.5. On-orbit Calibration Activities
The VIIRS instrument does not have an aperture door for the SD port except for the permanently fixed SAS placed in front of the SD panel. As a result, on-orbit SD calibration is performed for each orbit. The SDSM is used to track the SD on-orbit degradation and is operated via uploaded commands. As expected, the SDSM was operated more frequently early in the mission, initially every orbit and then daily (see Table 2). Starting from May 16, 2014, the SDSM has been operated only three times per week.
Table 3 is a summary of lunar observations successfully scheduled and implemented for S-NPP VIIRS RSB calibration. It contains spacecraft roll angles and lunar phase angles. If the predicted roll angle is within ±1 degree, no spacecraft roll maneuver is needed. In order to capture lunar images for all spectral bands at the same time, a sector rotation is implemented such that the EV data sector is centered on the SV view angle. Most of the lunar phase angles are centered at −51 degrees, where the negative phase angle indicates a waxing Moon. Only a few lunar observations performed at the beginning of the mission have their phase angles centered at −55 degrees. The −55 degrees lunar phase angle was selected to match the Aqua MODIS lunar observations. The change from −55 degrees to −51 degrees was made in response to additional operational constraints on the S-NPP spacecraft and to optimize lunar observation opportunities. The lunar observations as well as SD/SDSM measurements are primarily used for RSB calibration.
Table 3.
S-NPP VIIRS lunar calibrations implemented (launch to September 2015). Angle units are [degrees]. No satellite roll maneuver was performed if the predicted roll angle is within ±1 degree (denoted with *).
| Date | H:M:S | Roll Angle | Phase Angle | Date | H:M:S | Roll Angle | Phase Angle |
|---|---|---|---|---|---|---|---|
| 1/4/2012 | 8:48:53 | −9.49 | −55.41 | 1/11/2014 | 9:59:45 | −6.727 | −51.3 |
| 2/3/2012 | 4:21:32 | −5.445 | −56.19 | 2/10/2014 | 5:34:12 | −3.714 | −51.03 |
| 2/3/2012 | 6:03:34 | −5.279 | −55.38 | 3/12/2014 | 1:11:43 | −3.944 | −51.05 |
| 4/2/2012 | 23:05:11 | −3.989 | −51.24 | 4/10/2014 | 20:53:17 | −4.977 | −50.6 |
| 5/2/2012 | 10:20:06 | −3.228 | −50.92 | 5/10/2014 | 13:13:00 | −4.177 | −50.91 |
| 5/31/2012 | 14:47:14 | −0.081* | −52.97 | 6/9/2014 | 3:48:42 | +0.301* | −51.05 |
| 10/25/2012 | 6:58:15 | −4.048 | −51.02 | 10/4/2014 | 17:29:10 | +0.696* | −50.81 |
| 11/23/2012 | 21:18:20 | −9.429 | −50.74 | 11/3/2014 | 1:07:35 | −0.609 | −50.53 |
| 12/23/2012 | 15:00:50 | −7.767 | −50.9 | 12/2/2014 | 8:41:44 | −10.841 | −50.83 |
| 1/22/2013 | 12:13:35 | −3.383 | −50.81 | 12/31/2014 | 19:38:07 | −8.981 | −50.73 |
| 2/21/2013 | 9:31:25 | −1.712 | −50.71 | 1/30/2015 | 8:22:14 | −5.674 | −51.16 |
| 3/23/2013 | 3:29:00 | −3.32 | −51.15 | 3/1/2015 | 0:34:22 | −4.048 | −50.91 |
| 4/21/2013 | 19:47:54 | −3.882 | −50.82 | 3/30/2015 | 16:49:09 | −5.236 | −51.29 |
| 5/21/2013 | 8:43:15 | −0.809* | −50.67 | 4/29/2015 | 12:29:27 | −4.701 | −50.43 |
| 10/14/2013 | 21:39:19 | −1.305 | −50.95 | 5/29/2015 | 4:47:10 | −2.304 | −51.07 |
| 11/13/2013 | 6:57:41 | −7.981 | −50.66 | 6/27/2015 | 14:17:10 | 0.314* | −54.43 |
| 12/12/2013 | 19:35:46 | −9.438 | −50.39 |
The BB is nominally controlled at about 292.7 K and its warm-up and cool-down (WUCD) operation has been performed quarterly since launch (starting from February 2012) for a total of 15 times thus far. In order to minimize thermal effects during BB WUCD that have shown a small but undesirable impact on data quality, the frequency of WUCD is set to be reduced to semi-annually starting in 2017. During the WUCD, the BB temperature cycles through a series of discrete temperatures and varies between instrument ambient of approximately 267 K and 315 K. The WUCD operation is performed regularly to characterize and track changes in TEB detector offset and nonlinear response. It also allows TEB detector noise characterization to be examined over a range of source temperatures.
On-orbit changes in VIIRS DNB offsets are determined approximately monthly via a VIIRS recommended operating procedure (VROP). This procedure is implemented at new moon over dark oceans. Additional VROPs are performed monthly near the terminator to determine the gain ratios needed to transfer the LGS gain to the MGS and HGS.
3. On-orbit Performance
3.1. RSB Performance
The H-factor is calculated using Equation (5). In this equation, τSUN was determined from both the yaw maneuver data and a small portion of regular on-orbit data [27]. The τSAS*BRDF0 was derived from the yaw maneuver data. Corrected solar vectors were used in the screen transmittance determinations and in the calculation of the H-factor. It should be noted that due to mishandling of the solar vector in different coordinate systems, an error in the solar vector occurred in the operation processing prior to November 22, 2014. The SDSM system on VIIRS has tracked the SD on-orbit degradation well. Estimated H-factor error on a per satellite orbit basis range from 0.0002 (D6) to 0.0007 (D1) (after removing a bias in the calculated τSAS*BRDF0, due to the angular dependence of the H-factor at the time of the yaw maneuvers, and using both the yaw maneuver and regular on-orbit data to calculate τSAS*BRDF0 [28]). Figure 2 displays the per-orbit H-factors measured by the eight SDSM detectors over the lifetime of the mission normalized to their respective extrapolated values at satellite launch. The H-factors are determined from data within a solar vertical angle range of ±1.0 degree in SDSM screen coordinates [9]. The bluest detector (D1) indicates that the SD has degraded by close to 31 % since launch, whereas the degradation is only slightly larger than 1 % at 926 nm (D8). There are a few undulations with magnitudes around 0.001 in the H-factor curves that are most likely due to unresolved features in the calculated transmission functions of the attenuation screens. The H-factors in the figure were calculated without considering SDSM detector RSR out-of-band (OOB) effects. The RSR OOB is spectral filter orientation dependent and the orientation is unknown for the S-NPP VIIRS SDSM. The impact on the H-factor due to the RSR OOB response is negligible for SDSM D5 to D8 [29]. Radiometric calibration through lunar observation has shown that the angular dependence of the H-factor and the OOB response effect on the H-factor almost cancel (about a 1 % residual effect remains at the central wavelength of M1; see Figure 3).
Figure 2.

H-factors for SDSM D1 through D8 determined by Equation (5). The H-factors are normalized to the satellite launch date.
Figure 3.
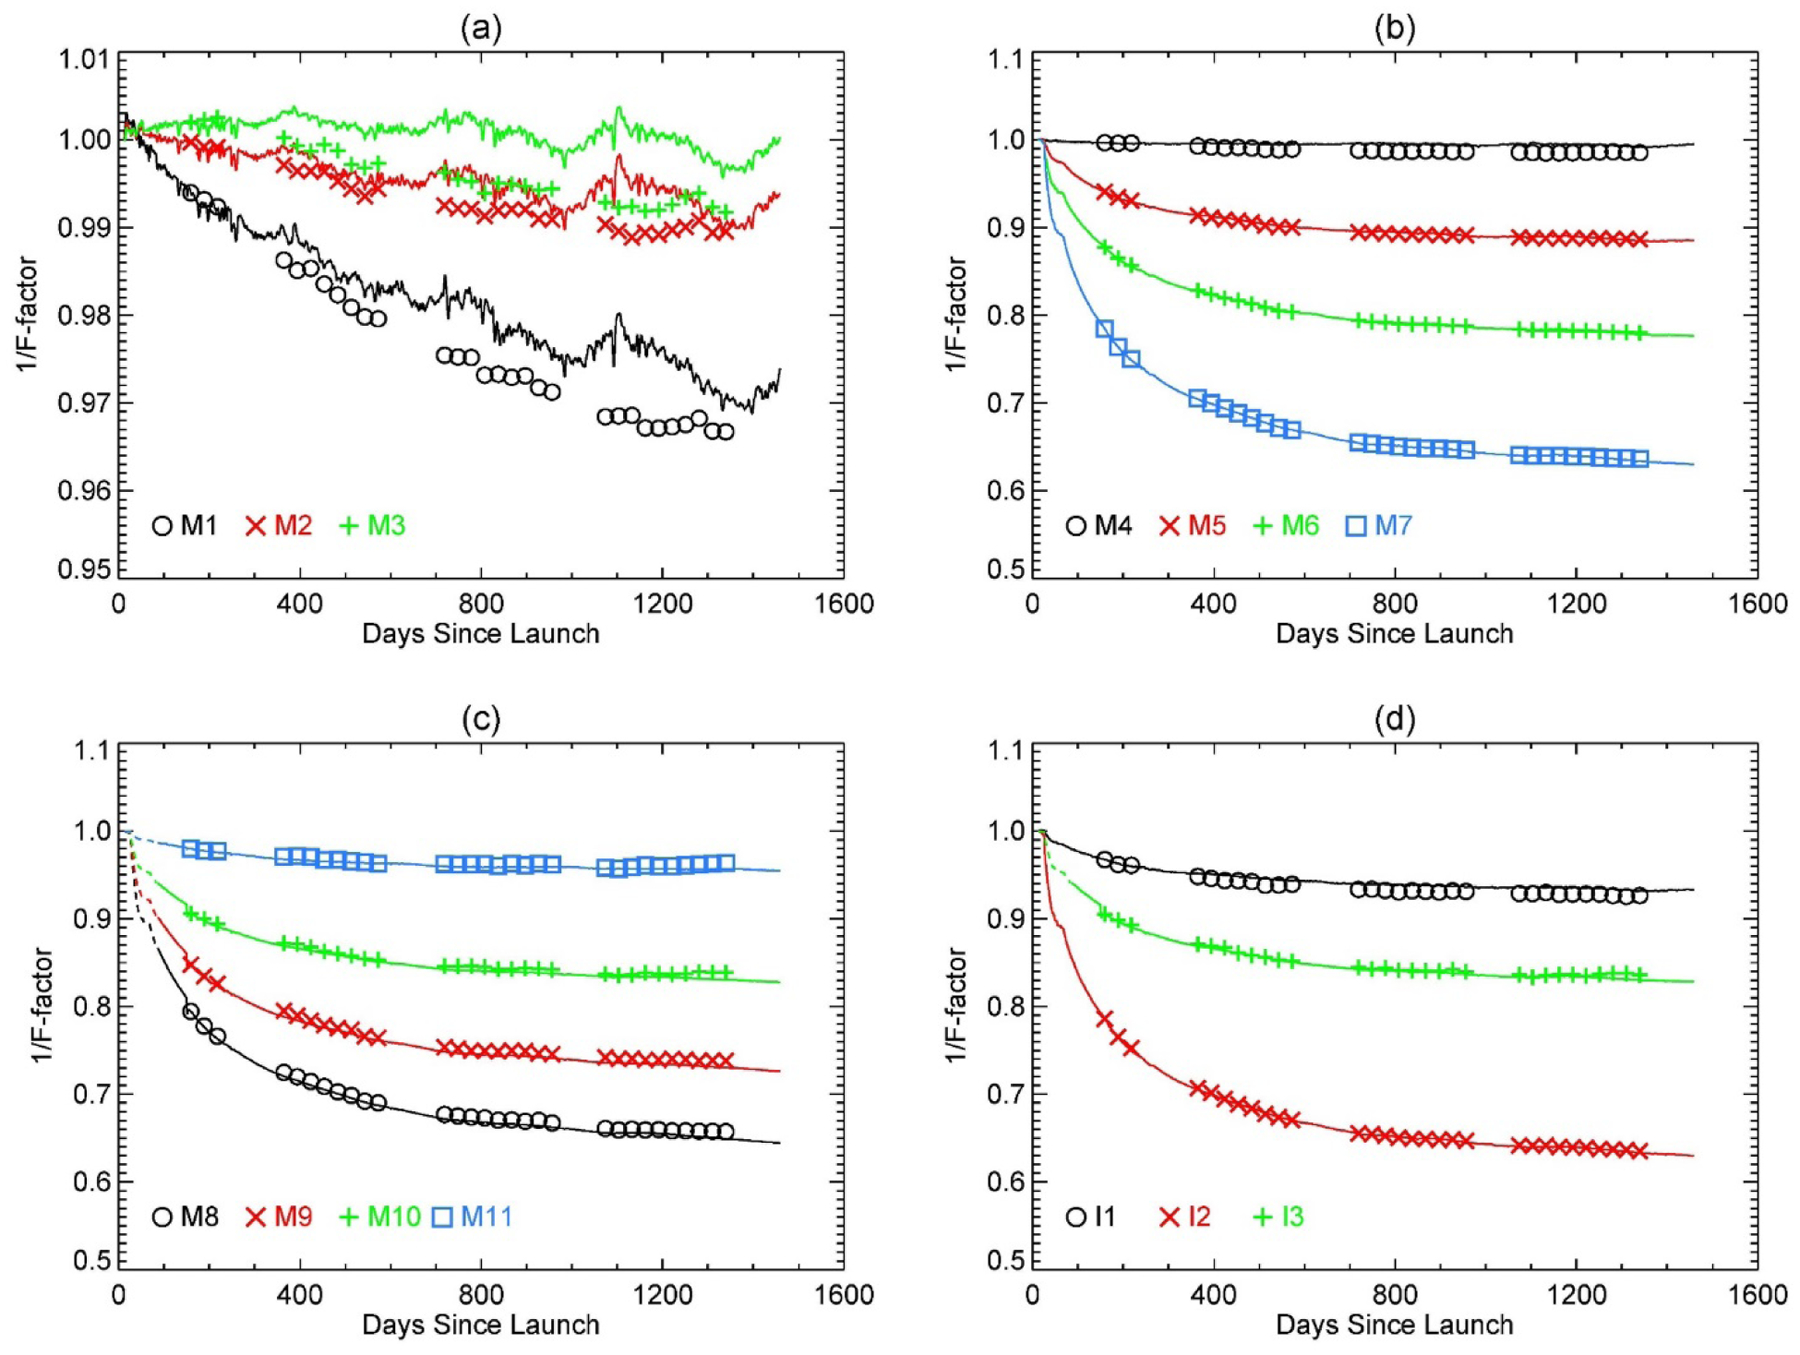
1/F-factors (gains) trends for the RSB: (a) for bands M1 to M3, (b) for bands M4 to M7, (c) for bands M8 to M11, and (d) for bands I1 to I3. The solid lines represent the SD observations and the symbols denote the lunar observations. The lunar 1/F-factors are scaled so that their values on April 2, 2012 (157 days after launch) exactly match their corresponding SD 1/F-factors.
The normalized RSB 1/F-factors (or gains) derived from the SD calibration are shown by the solid lines in Figures 3(a) – (d). The normalization is made to the first available date for the VIS/NIR bands: November 8, 2011. For the SWIR bands (M8 - M11 and I3), the normalization is made to the modeled values on November 8, 2011. The 1/F-factors shown in Figure 3 are daily averaged values over all detectors and HAM sides for each spectral band. No additional fitting or smoothing is made to the 1/F-factors. A noticeable feature is the sudden decrease in the 1/F-factors for NIR and SWIR bands.
For the bands I2 and M7, the 1/F-factors have decreased about 37 % since launch. The root cause of this sudden decrease is the contamination of the RTA mirrors by tungsten oxides that become light absorbent when exposed to UV light [17,18,30,31]. The optical throughput decrease due to this mirror contamination has slowed significantly since launch. Despite the RTA throughput degradation, the projected signal-to-noise ratio for each RSB will continue to meet the design requirements at the end of 7 years of operation. About 140 days after launch, the SWIR band 1/F-factors dipped out-of-trend. Right before the dip, the spacecraft was briefly in Sun Point mode (see Table 2), resulting in the spacecraft control computer reset likely due to over-heating. The root cause for the dip remains to be understood.
The RSB detector gains (1/F-factors) derived from VIIRS lunar calibration for the RSB are also plotted in Figure 3 as symbols. For comparison purposes, the lunar calibration results are normalized to their respective SD calibration gains on April 2, 2012; after this date, all subsequent scheduled VIIRS lunar observations have been conducted with a consistent system setup including a sector rotation and fixed high gain. There are seasonal oscillations in both the SD and lunar trending, although they are not directly related. For the lunar data, the oscillation is mainly caused by systematic effects within the ROLO model that are related to the uncompensated libration effect. Empirical fitting has been applied to the lunar F-factor to reduce the oscillation [24].
Overall, the normalized SD and lunar gains match very well in terms of their long-term trends, in line with expectations since they both reflect the detector gain change for nearly the same optical path and AOI. However, there are noticeable band-dependent temporal drifts between the two trends of up to 0.8 %. For bands M1 - M4, the gain changes derived from lunar calibration are larger than from SD calibration. For bands M8 and M9, the gain changes derived from lunar calibration are smaller than from the SD. The Moon is viewed by the instrument optics directly. Therefore, it is likely that the lunar trending better reflects the gain change than the SD calibration. The drift between the two trends reflects systematic uncertainty in the SD calibration, especially in the SD degradation monitored by the SDSM.
The on-orbit RSB SNR is estimated from partial views of the SD during a solar calibration event. The SNR at the spectral radiance level L [calculated from Equation (3)] is determined by dividing the average SD response by its standard deviation. A fit of the calculated SNR to the estimated radiance,
| (8) |
determines the coefficients k0 and k1. From Equation (8), the SNR at the specified typical radiance is calculated. The SNRs at the typical radiance divided by their respective required SNRs are shown in Table 4. The optical throughput degradation described earlier has caused the SNR of affected bands to decrease by approximately the square root of the radiance; otherwise, the RSB SNR trends have been generally stable.
Table 4.
VIIRS noise characterization results expressed using ratios between measured SNR (or NEdT) and specified SNR (or NEdT) for RSB (or TEB). The requirements are satisfied if the ratio is greater than one for the RSB and less than one for the TEB.
| Band | Band Gain | Pre-Launch | 02/06/12 | 09/10/12 | 03/18/13 | 09/16/13 | 03/15/14 | 09/18/14 | 03/20/15 | 09/19/15 |
|---|---|---|---|---|---|---|---|---|---|---|
| M1 | High | 1.75 | 1.69 | 1.66 | 1.72 | 1.67 | 1.67 | 1.69 | 1.66 | 1.66 |
| Low | 3.46 | 3.37 | 3.32 | 3.54 | 3.37 | 3.49 | 3.31 | 3.33 | 3.33 | |
| M2 | High | 1.64 | 1.54 | 1.53 | 1.56 | 1.54 | 1.53 | 1.56 | 1.53 | 1.56 |
| Low | 2.73 | 2.58 | 2.53 | 2.63 | 2.74 | 2.34 | 2.62 | 2.54 | 2.50 | |
| M3 | High | 1.66 | 1.53 | 1.54 | 1.54 | 1.57 | 1.52 | 1.54 | 1.54 | 1.57 |
| Low | 2.68 | 2.49 | 2.45 | 2.54 | 2.55 | 2.36 | 2.42 | 2.44 | 2.48 | |
| M4 | High | 1.61 | 1.50 | 1.49 | 1.50 | 1.53 | 1.47 | 1.52 | 1.49 | 1.53 |
| Low | 3.06 | 2.72 | 2.78 | 2.77 | 2.98 | 2.70 | 2.77 | 2.76 | 2.90 | |
| I1 | Single | 2.02 | 1.79 | 1.76 | 1.76 | 1.75 | 1.74 | 1.73 | 1.73 | 1.73 |
| M5 | High | 1.51 | 1.37 | 1.35 | 1.30 | 1.33 | 1.30 | 1.29 | 1.26 | 1.29 |
| Low | 2.30 | 1.74 | 1.69 | 1.65 | 1.68 | 1.62 | 1.62 | 1.66 | 1.61 | |
| M6 | Single | 2.09 | 1.82 | 1.74 | 1.69 | 1.68 | 1.69 | 1.65 | 1.68 | 1.65 |
| I2 | Single | 2.03 | 1.72 | 1.55 | 1.50 | 1.47 | 1.45 | 1.43 | 1.43 | 1.42 |
| M7 | High | 2.42 | 2.08 | 1.87 | 1.80 | 1.77 | 1.75 | 1.73 | 1.72 | 1.72 |
| Low | 2.49 | 1.83 | 1.61 | 1.53 | 1.50 | 1.50 | 1.45 | 1.48 | 1.47 | |
| M8 | Single | 3.69 | 3.10 | 2.73 | 2.60 | 2.52 | 2.49 | 2.48 | 2.45 | 2.41 |
| M9 | Single | 3.05 | 2.79 | 2.54 | 2.47 | 2.43 | 2.39 | 2.39 | 2.38 | 2.33 |
| I3 | Single | 28.67 | 25.48 | 24.12 | 23.58 | 23.53 | 23.20 | 23.27 | 23.18 | 22.95 |
| M10 | Single | 2.09 | 1.74 | 1.68 | 1.60 | 1.63 | 1.62 | 1.60 | 1.60 | 1.59 |
| M11 | Single | 2.50 | 2.21 | 2.16 | 2.14 | 2.13 | 2.15 | 2.15 | 2.14 | 2.10 |
| I4 | Single | 0.16 | 0.16 | 0.16 | 0.16 | 0.16 | 0.16 | 0.16 | 0.16 | 0.16 |
| M12 | Single | 0.33 | 0.32 | 0.31 | 0.30 | 0.29 | 0.29 | 0.30 | 0.30 | 0.30 |
| M13 | High | 0.37 | 0.39 | 0.39 | 0.37 | 0.37 | 0.37 | 0.37 | 0.37 | 0.37 |
| Low | -- | -- | -- | -- | -- | -- | -- | -- | -- | |
| M14 | Single | 0.66 | 0.58 | 0.62 | 0.60 | 0.60 | 0.60 | 0.60 | 0.60 | 0.60 |
| M15 | Single | 0.43 | 0.41 | 0.41 | 0.39 | 0.39 | 0.39 | 0.39 | 0.39 | 0.39 |
| I5 | Single | 0.27 | 0.26 | 0.26 | 0.26 | 0.26 | 0.26 | 0.26 | 0.26 | 0.26 |
| M16 | Single | 0.53 | 0.39 | 0.39 | 0.39 | 0.39 | 0.39 | 0.39 | 0.40 | 0.40 |
3.2. TEB Performance
Overall, the VIIRS TEB calibration has been very stable since launch. VIIRS telemetry, TEB F-factor, NEdT, and WUCD results have all been monitored over the mission life, as will be discussed below. Note that all TEB trends begin when the cold FPAs reached their operational temperatures (January 20, 2012).
Key telemetry points that are used in the thermal model and for monitoring the health of the instrument (such as the cold FPA temperatures) were trended both over the short term and over the entire mission. Most telemetry parameters exhibit an orbital cycle in their temperature variations. In particular the BB temperature varies with the orbital cycle with an amplitude of about 25 mK (highest during daytime and lowest at night); Figure 4(a) plots the average BB temperature over approximately two orbits. This behavior has been reported earlier in the mission [19,32], and has continued to the present. The orbital cycle of the six individual thermistors shows that thermistors 3 and 6 (the thermistors farthest from the EV port) are driving the average BB temperature variation; the likely cause of these variations is heating of one side of the BB due to Earth illumination. Note that the BB is still operating within its design requirements in terms of both stability and uniformity. Figure 4(b) shows the variation in the S/MWIR FPA temperature; the variation within an orbit is under 6 mK.
Figure 4.

VIIRS BB (a) and S/MWIR FPA (b) temperature trending over orbits 20326 – 20327 on September 30, 2015.
The long term trending of the principle telemetry is shown in Figures 5(a) – (d). In Figure 5(a), the average BB temperature is shown; the BB temperature has been stable to within ~25 mK for the entire mission, excluding WUCD events and instrument anomalies. The small discontinuities of 15 mK observed were due to the implementation of two slightly different BB settings (one uploaded after a WUCD event and the other after an instrument anomaly) [19]; the operational processing has been updated to avoid this feature. After this update the BB has been stable to within ~10 mK. The other temperatures used in the thermal model were trended in Figure 5(b). All temperatures show some slight yearly variation of less than 2 K; the local maximums correspond to the Earth at perihelion. The electronics and instrument temperatures showed in Figure 5(c) exhibit a slight increase of about 1 K over a 4 year period. Figure 5(d) graphs the cold FPA temperatures. The LWIR FPA temperature has been very steady at 79.94 K since it reached its operational temperature; the S/MWIR FPA temperature (which is tied to the LWIR FPA temperature) has drifted upward over three years from ~79.83 K to ~79.85 K.
Figure 5.

VIIRS sensor telemetry trended over the entire mission. (a) shows the trending of the BB temperature; (b) graphs the temperature trend for the inputs to the thermal model: HAM, scan cavity, and BB shield temperatures; (c) plots the temperature trends for electronics (ASP), instrument (OMM), and VIS/NIR FPA temperature; and (d) shows the S/MWIR and LWIR FPA temperature trends.
The TEB 1/F-factors were trended over on-orbit operations using two granules collected at the solar observation of every orbit. The band average results (HAM side A) are plotted in Figure 6. The MWIR bands all showed a slight decrease in the beginning of the mission, but subsequently leveled off (a recent discontinuity in band I4 was observed to cause an additional slight decrease). Band I5 has shown a steady decrease of its 1/F-factor over time, and has now changed by ~1.3 % since the spacecraft anomaly (see Table 2). The other LWIR bands have shown little long term trend, but they do show a slight annual cycle (including band I5); the days when Earth is at perihelion are visible as local minimums. These annual cycles in the 1/F-factor are related to the annual cycles in the temperatures used in the sensor thermal calibration model; however, since these temperatures are highly correlated, it is difficult to attribute the cycle to any of them. There were some discontinuities in the early mission due to instrument and spacecraft anomalies (see Table 2), which resulted in the cold FPA temperature spiking. Short term trending was also performed, and small orbital variations were observed on the order of ~0.1 % or less using a granule average; these variations are partially the result of the orbital variation in the BB temperature [19,32].
Figure 6.

VIIRS TEB band average 1/F-factor trending over the entire mission, normalized to January 20, 2012.
The trending for the NEdT at the BB operational temperature of ~292 K has been very stable over the entire mission; the I bands have shown NEdT between 0.14 K and 0.18 K while the M bands have shown NEdT between 0.03 K and 0.06 K. Detector 2 in band I5, detector 16 in band M12, and detector 9 in band M16A are higher than other detectors in their respective bands, and have been consistently over the entire mission.
The offset and nonlinear coefficients derived during each WUCD have generally been stable over the fifteen WUCDs so far; moreover, they are consistent with the LUTs values (derived during prelaunch testing) currently used by the SDR algorithm. There is some difference between the WU and CD results, where the WU generally provides larger offsets and nonlinear terms. The WUCD is also used to check the NEdT at the specified typical temperature (see Table 4) and assess the response nonlinearity; both have been very stable since the mission began and are well within the sensor design specifications.
3.3. DNB Performance
The DNB LGS gains derived from SD observations have been trended over the mission. The daily average of the LGS gain for detector 8, aggregation mode 5 has steadily increased by approximately 11 % since launch, as shown in Figure 7(a). All detectors show a similar trend for all aggregation modes. The MGS/LGS and HGA/MGS gain ratios, derived via the method described in section 2.3, are shown in Figures 7(b) and 7(c) respectively for the same detector and aggregation mode. The MGS/LGS ratio trend is stable with small seasonal variations throughout the mission, indicating that the MGS gain has increased by about the same amount as the LGS gain. Overall, the HGA/MGS ratio has more fluctuations in addition to seasonal variation; over the entire mission, this ratio decreases about 2 % on average. The behavior of the gain ratios for other detectors and aggregation modes is similar.
Figure 7.

(a) DNB LGS gain, (b) MGS/LGS gain ratio, (c) HGA/MGS gain ratio, and (d) HGA SNR trended for detector 8, aggregation mode 5, HAM side A over the entire mission. Fits of the LGS gains and gain ratios are shown by the blue curves.
The on-orbit DNB detector SNRs are computed by using BB and SV data at 32 different aggregation modes during the nighttime orbits. An example of the SNR trending is graphed in Figure 7(d). The results from daily trending show that the SNR performance of all the aggregation modes is better than the design specification.
3.4. Changes and Improvements (made since launch for online and offline processing)
An improvement on the calculated SDSM screen transmission function has been made. Both the yaw maneuver and a small portion (~ 3 months) of regular on-orbit data were used to determine the screen transmission function at a finer scale in both the vertical and horizontal solar angles. Figure 8 shows the SDSM screen transmission functions derived from the prelaunch data (left plot), the yaw maneuver data (middle plot) [33], and the combination of yaw maneuver and regular on-orbit data (right plot). The effects of the transmission functions on the calculated H-factors are shown in Figure 9. The yearly undulations in the figure are from the solar vector issue mentioned in Section 3.1.
Figure 8.
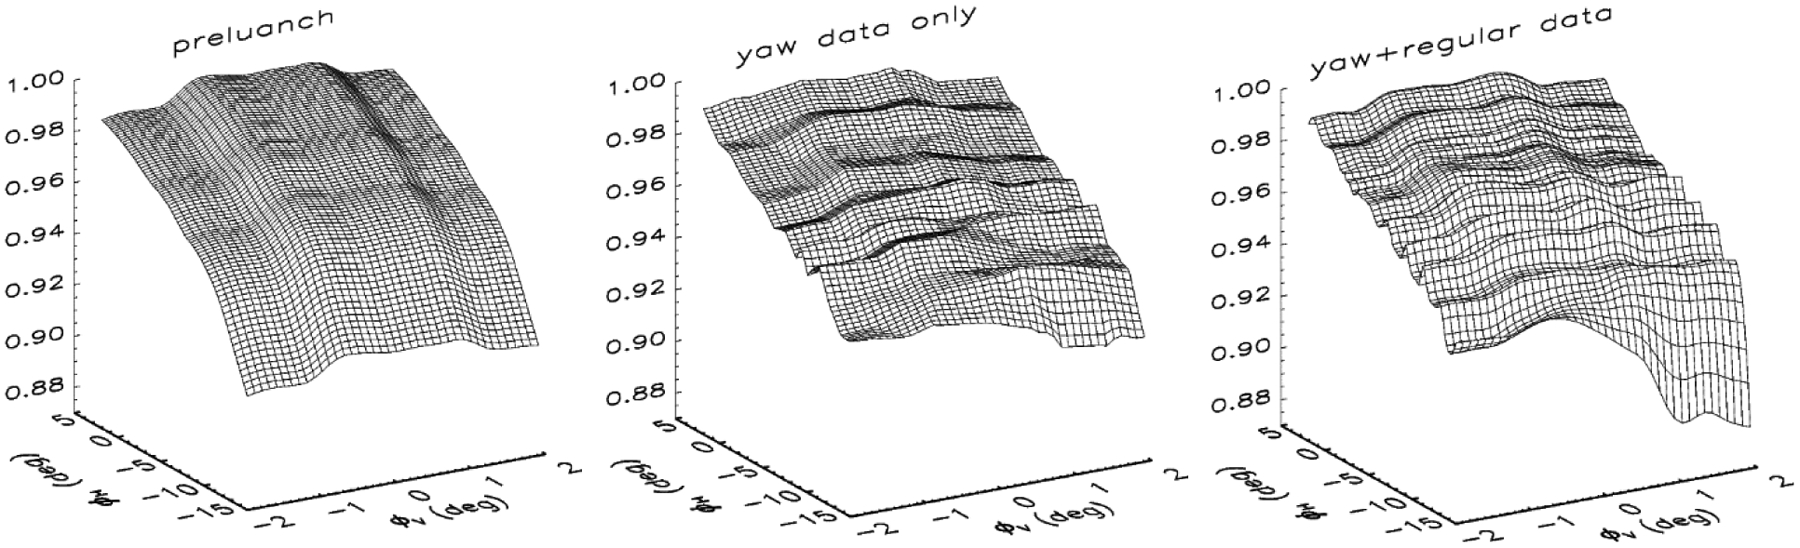
Plots of the relative transmittance of the SDSM screen for D8 using prelaunch data (left), yaw maneuver data (middle), and yaw maneuver and a small portion of regular on-orbit data (right).
Figure 9.

The difference in the H-factors using the SDSM screen transmission functions for the odd numbered detectors derived from prelaunch data (a) and from the yaw maneuver data only (b) relative to the H-factor using the SDSM screen transmission functions derived from both yaw maneuver and regular on-orbit data.
In early 2014, with the assistance of the Aerospace Corporation, NASA S-NPP VIIRS geo-calibration group found that there was an error in the solar vectors due to a mishandling of the coordinate systems. The uncorrected solar vectors resulted in as much as a 0.2 degree error in the solar angle and thus an H-factor error of as large as 0.005 [34]. Since then, corrected solar vectors have been produced and used for the screen transmission function determinations and the computations of the F- and H-factors.
Since launch, the RTA has experienced optical throughout degradation. The degradation is wavelength dependent and therefore results in modulation of the RSB detector RSRs. The modeled RTA degradation was used to compute the modulated RSRs that are used in the calculation of the F-factors [see Equation (4)]. Figures 10(a) and (b) show the prelaunch RSR and the modulated RSR at 3.7 years after launch for band M1 and the DNB, respectively.
Figure 10.

Comparison of the prelaunch RSR (black) and the modulated RSR at 3.7 years after launch (red) for band M1 (a) and the DNB (b).
Stray light contamination of DNB has been observed in nighttime images near the transitions to and from daytime [13]. Figure 11 displays two DNB nighttime image pairs, which are three years apart from 2012 and 2015, over the eastern U.S. Each pair shows the images before (left plot) and after (right plot) the stray light correction. The same algorithm used to compute the amount of stray light was used to derive the monthly correction LUTs; this has demonstrated the effectiveness of the time dependent correction applied to SDR product. In the lower right plot in Figure 11, there is still a small amount of under corrected stray light in the twilight region which is near the minimum of the detectable light by the DNB. This is the area for future improvement.
Figure 11.

DNB nighttime SDR images over the eastern U.S. on (upper left) June 19, 2012 before the stray light correction; (upper right) June 19, 2012 after the correction; (lower left) June 12, 2015 before the correction; and (lower right) June 12, 2015 after the correction.
The first on-orbit emissive band calibration BB WUCD was performed on February 6, 2012, which lasted for more than 4 days as shown in the BB temperature profile in Figure 12(a). During the WU period, two of the BB temperature set points, 297.5 K and 312.5 K, were maintained for about 16 hours each, much longer than necessary for the TEB calibration. After the first WUCD was completed, the BB WU cycle procedure was reviewed by the SDR team, which recommended that the duration of those two temperature plateaus be shortened. The second WUCD took 3 days to complete, as shown in Figure 12(b). To track the on-orbit change in the TEB detector offset and non-linear coefficients, the calibration analysis is performed separately on the WU and CD parts of the WUCD. After further review of the procedure, an updated WU cycle was introduced for the third WUCD, as shown in Figure 12(c), which further reduced the duration by another day. This new procedure only takes two days to complete the WUCD by removing a redundant part of the CD process while keeping all the temperature set points. This new procedure has been adopted and has been used for the WUCD since September 2012.
Figure 12.

Blackbody temperature profiles during WUCD calibration activities: (a) February 6, 2012 (first WUCD); (b) May 22, 2012 (second WUCD); and (c) September 10, 2012 (third WUCD).
In addition to OBC and lunar observations, a number of pseudo-invariant calibration sites and a series of simultaneous nadir overpasses (SNO) have been used as part of the effort to assess the VIIRS RSB on-orbit performance. Extensive calibration and validation efforts using either similar or different approaches have also been made by other calibration groups and the user community. Results from using the Libya-4 desert and deep convective clouds (DCC) show that the RSB temporal stability is within ±0.6 % per year based on the desert and DCC pixels collected during the first two years of the mission [35,36]. Results from inter-comparison with Aqua MODIS based on SNOs and two invariant targets (the Libya-4 desert and Dome C) indicate that the VIIRS VIS/NIR spectral bands calibration has been stable to within 1 % over the first three years of the mission [37–39]. These studies show that after correcting for the spectral response differences, the absolute calibration differences between VIIRS and MODIS are within 2 %, with the exception of the 0.865 μm band (M7), where they differ by more than 3 %.
The VIIRS TEB performance has also been under evaluation using on-orbit comparisons between VIIRS and the Cross-track Infrared Sounder (CrIS) instrument on S-NPP, as well as between VIIRS and the Infrared Atmospheric Sounding Interferometer (IASI) on MetOp-A. The VIIRS-IASI and VIIRS-CrIS findings closely agree for the spectrally matched TEB for warm scenes, but small offsets exist at cold scenes [40]. The calibration stability of VIIRS TEB was evaluated by reference to stable ground based temperature measurements at the Dome C site [41]. No significant evidence of any temporal drift was observed due to the fact that there is a large variability in the temperature difference trends and it is expected that at least 10 years of cumulative data sets are required in order to detect any calibration trends. The calibration differences between VIIRS and Aqua MODIS spectrally matched TEB were also assessed by comparing the brightness temperatures retrieved from their SNO [42]. The S-NPP CrIS data taken simultaneously with the VIIRS data is used to derive a correction for the slightly different spectral coverage of VIIRS and MODIS TEB. After the spectral correction, the agreement is well within 0.10 K over a scene temperature range of 220 K to 290 K.
4. Lessons Learned and Future Improvements
For the RSB on-orbit calibration, the calculated F-factor should use the H-factor derived from the RTA SD view, or H(RTA). Determining H(RTA) from the H-factor derived from the SDSM SD view, or H(SDSM), by comparing the F-factors from the SD and lunar observations shows that H(RTA) differs from H(SDSM) at the band M1 central wavelength by about 5 % at present, with H(SDSM) computed with an SDSM detector RSR averaged over the four possible filter orientations [43]. A mathematical formula was developed to relate H(RTA) to H(SDSM). Due to the angular dependence of the H-factor [44] and to avoid biasing the calculated H- and F-factors, the H- and the F-factors should be calculated with a fixed angle between the incident solar radiative energy and the SD surface. The bias in the computed τSAS*BRDF0 for both the RTA and SDSM views due to the angular dependence of the H-factor should be removed [44]. Additionally, to improve the precision of the computed τSAS*BRDF0 for both the RTA and SDSM views, both yaw maneuver and regular on-orbit data should be used. The SD degradation at wavelengths above 1.0 μm is very small, so in this work H-factor was set to 1.0 for the SWIR bands [45]. However, recent analysis indicates that at present, the H-factor is about 0.996 at 1.26 μm (equivalent to band M8) [21].
The uncertainty in the lunar calibration is likely introduced by the lunar irradiance model itself. Therefore, further improvement of lunar calibration results depends greatly on the improvement of the model. The lunar gain coefficients can also be calculated for each detector and HAM side, allowing an independent validation of the detector difference and HAM side difference of the gain coefficients characterized by the SD calibration. In addition to the scheduled lunar calibrations discussed above, VIIRS can view the Moon through its SV port occasionally at various lunar phase angles without a roll maneuver or sector rotation. The lunar images captured during these unscheduled observations can be used to track the detector gain change and help to investigate how the uncertainty of the lunar model changes with lunar phase angle and libration angle.
For TEB on-orbit calibration, the sea surface temperature (SST) EDR shows a bias during the WUCD cycles. When the BB temperature is away from its nominal temperature, the SST results show an upward trend (particularly when the BB temperature is lower than its nominal temperature). One approach to resolve this is to use a parametric model to determine if any biases exist using prelaunch data; prelaunch data had shown some BB temperature dependent differences between the temperature retrievals and the known external blackbody temperature. In addition, overlapping orbits have shown a slight mismatch in temperature retrievals at the beginning and end of scan. One possible cause is RVS error; for the LWIR bands, the RVS changes by between 3 % and 10 % from beginning to end of scan. Reanalysis of prelaunch data as well as pitch maneuver data may shed some light on this phenomenon.
For DNB on-orbit calibration, the current SDR stray light correction LUT consists of a large table to cover offsets in both solar zenith angle and scan angle. The correction algorithm is being revised in order to reduce the size of the stray light correction LUT. Another possible future improvement is prediction of the stray light correction. The current method for SDR forward process is to reuse the correction LUT from the same month of the previous year. The Earth-Sun-spacecraft relative geometry roughly repeats at an annual cycle, and so does the stray light pattern. However, there are other factors that impact the amount of stray light entering the VIIRS instrument that differ from year to year. Future work to improve the algorithm and accuracy of the stray light prediction are being investigated.
5. Summary
This paper has presented the status of S-NPP VIIRS on-orbit radiometric performance. All of the OBC have been consistently providing high quality calibration data needed to maintain SDR calibration for both RSB and TEB. Improved understanding and processing of the SD and SDSM data have led to better characterization of the screen transmissions and their uncertainties, and hence better calibration of the RSB SDR products. Analyses of the SD/SDSM derived F-factors have shown that the wavelength dependent optics degradation due to RTA mirror contamination has been gradually slowing down, which is consistent with the modeling results. As expected, the SD degradation is larger at shorter wavelengths and the rate of degradation has gradually decreased. The TEB calibration performance continues to be extremely stable over the mission and a minor feature observed in the SST trending (occurring only during BB WUCD) is being addressed by the SDR team. A series of planned on-orbit operations have been successfully executed to monitor and enhance the sensor performance and characterization, including the monthly spacecraft roll maneuvers to view the Moon for verification of the SD/SDSM based calibration for the RSB, and the WUCD events to characterize and calibrate the TEB. Results from ground-based vicarious calibration and validation as well as inter-comparison with other sensors have shown good performance for the VIIRS RSB and TEB in general. Currently, there are further enhancements that the SDR team is working on that will either reinforce the quality of the current calibration, or correct some of the features seen in the calibration trending. These calibration enhancements are expected to be part of the future reprocessing effort, and should lead to significantly better SDR quality needed by the science and climate research communities
Acknowledgments
The authors of this paper would like to thank the VIIRS team members from NOAA, Aerospace Corporation, NASA Science Team, University of Wisconsin and Raytheon for their valuable contributions to VIIRS testing and performance verifications. We also want to thank MODIS characterization and Support Team (MCST) as well as previous VCST members, who provided valuable support to the VIIRS program and to the pre-launch calibration and characterization effort.
References
- 1.Schueler CF; Clement JE; Ardanuy PE; Welsch C; De Luccia F; Swenson H NPOESS VIIRS sensor design overview. Proc. SPIE 2002, 4483, 11. [Google Scholar]
- 2.Lee TF; Miller SD; Schueler C; Miller S NASA MODIS Previews NPOESS VIIRS Capabilities. Weather Forecast. 2006, 21, 649. [Google Scholar]
- 3.Ardanuy PE; Schueler CF; Miller SW; Kealy PM; Cota SA; Haas M; Welsch C NPOESS VIIRS Design Process. Proc. SPIE 2002, 4483, 22. [Google Scholar]
- 4.Jackson JM; Liu H; Laszlo I; Kondragunta S; Remer LA; Huang J; Huang H -C. Suomi-NPP VIIRS aerosol algorithms and data products. J. Geophys. Res.-Atmos 2013, 118, 12673. [Google Scholar]
- 5.Justice CO; Román MO; Csiszar I; Vermote EF; Wolfe RE; Hook SJ; Friedl M; Wang Z; Schaaf CB; Miura T; Tschudi M; Riggs G; Hall DK; Lyapustin AI; Devadiga S; Davidson C; Masuoka EJ Land and cryosphere products from Suomi NPP VIIRS: Overview and status. J. Geophys. Res.-Atmos 2013, 118, 9753. [DOI] [PMC free article] [PubMed] [Google Scholar]
- 6.Wang M; Liu X; Tan L; Jiang L; Son S; Shi W; Rausch K; Voss K Impacts of VIIRS SDR performance on ocean color products. J. Geophys. Res.-Atmos 2013, 118, 10347. [Google Scholar]
- 7.Cao C; Xiong X; Wolfe R; De Luccia F; Liu Q; Blonski S; Lin G; Nishihama M; Pogorzala D; Oudrari H; Hillger D Visible Infrared Imaging Radiometer Suite (VIIRS) Sensor Data Record (SDR) user’s guide Technical Report, NOAA, 2013. Version 1.2. [Google Scholar]
- 8.Joint Polar Satellite System (JPSS) VIIRS Radiometric Calibration Algorithm Theoretical Basis Document (ATBD) Technical Report, NASA Goddard Space Flight Center, 2013. Revision C. [Google Scholar]
- 9.Xiong X; Butler J; Chiang K; Efremova B; Fulbright J; Lei N; McIntire J; Oudrari H; Sun J; Wang Z; Wu A VIIRS on-orbit calibration methodology and performance. J. Geophys. Res.-Atmos 2014, 119, 5065. [Google Scholar]
- 10.Eplee RE; Turpie KR; Meister G; Patt FS; Franz BA Updates to the on-orbit calibration of SNPP VIIRS for ocean color applications. Proc. SPIE 2015, 9607, 96071P. [DOI] [PubMed] [Google Scholar]
- 11.Wolfe RE; Lin G; Nishihama M; Tewari KP; Tilton JC; Isaacman AR Suomi NPP prelaunch and on-orbit geometric calibration and characterization. J. Geophys. Res.-Atmos 2013, 118, 11508. [Google Scholar]
- 12.Moy G; Rausch K; Haas E; Wilkinson T; Cardema J; De Luccia F Mission history of reflective solar band calibration performance of VIIRS. Proc. SPIE 2015, 9607, 96071N. [Google Scholar]
- 13.Lee S; Chiang K; Xiong X; Sun C; Anderson S The S-NPP VIIRS Day-Night Band On-Orbit Calibration/Characterization and Current State of SDR Products. Remote Sens. 2014, 6, 12427. [Google Scholar]
- 14.Xiong X; Sun J; Fulbright J; Wang Z Lunar Calibration and Performance for S-NPP VIIRS Reflective Solar Bands. IEEE Tran. Geosci. Remote Sens doi: 10.1109/TGRS.2015.2473665. [DOI] [Google Scholar]
- 15.Uprety S; Cao C; Xiong X; Blonski S; Wu A; Shao X Radiometric Intercomparison between Suomi-NPP VIIRS and Aqua MODIS Reflective Solar Bands Using Simultaneous Nadir Overpass in the Low Latitudes. J. Atmos. Ocean. Tech 2013, 30, 2720. [Google Scholar]
- 16.Xiong X; Fulbright J; Angal A; Wang Z; Geng X; Butler J Assessment of MODIS and VIIRS solar diffuser on-orbit degradation. Proc. SPIE 2015, 9607, 96071T. [Google Scholar]
- 17.De Luccia F; Moyer D; Johnson E; Rausch K; Lei N; Chiang K; Xiong X; Fulbright J; Haas E; Iona G Discovery and characterization of on-orbit degradation of the Visible Infrared Imaging Radiometer Suite (VIIRS) Rotating Telescope Assembly (RTA). Proc. SPIE 2012, 8510, 85101A. [Google Scholar]
- 18.Lei N; Xiong X; Guenther B Modeling the Detector Radiometric Gains of the Suomi NPP VIIRS Reflective Solar Bands. IEEE Trans. Geosci. Remote Sens 2015, 53, 1565. [Google Scholar]
- 19.Efremova B; McIntire J; Moyer D; Wu A; Xiong X S-NPP VIIRS thermal emissive bands on-orbit calibration and performance. J. Geophys. Res.-Atmos 2014, 119, 10859. [Google Scholar]
- 20.Fulbright J; Lei N; McIntire J; Efremova B; Chen X; Xiong X Improving the characterization and performance of the Suomi-NPP VIIRS solar diffuser stability monitor. Proc. SPIE 2013, 8866, 88661J. [Google Scholar]
- 21.Lei N; Xiong X Determination of the SNPP VIIRS solar diffuser BRDF degradation factor over wavelengths longer than 1 μm. Proc. SPIE 2015, 9607, 96071W. [Google Scholar]
- 22.Kieffer HH; Stone TC The spectral irradiance of the Moon. Astronom. J 2005, 129, 2887. [Google Scholar]
- 23.Fulbright J; Wang Z; Xiong X S-NPP VIIRS lunar observations. Proc. SPIE 2014, 9218, 921804. [Google Scholar]
- 24.Eplee RE; Turpie KR; Meister G; Patt FS; Franz BA; Bailey SW On-orbit calibration of the Suomi National Polar-Orbiting Partnership Visible Infrared Imaging Radiometer Suite for ocean color applications. Appl. Optics 2015, 54, 1984. [DOI] [PubMed] [Google Scholar]
- 25.Sun J; Xiong X; Barnes WL; Guenther B MODIS Reflective Solar Bands On-Orbit Lunar Calibration. IEEE Trans. Geosci. Remote Sens 2007, 45, 2383. [Google Scholar]
- 26.Wang Z; Fulbright J; Xiong X Update on the performance of Suomi-NPP VIIRS lunar calibration. Proc. SPIE 2015, 9607, 960720. [Google Scholar]
- 27.Lei N; Chen X; Xiong X Determination of the SNPP VIIRS SDSM Screen Relative Transmittance From Both Yaw Maneuver and Regular On-Orbit Data. IEEE Trans. Geosci. Remote Sens doi:10119/TGRS.2015.2480039. [Google Scholar]
- 28.Lei N; Xiong X Estimation of the accuracy of the SNPP VIIRS SD BRDF degradation factor determined by the solar diffuser stability monitor. Proc. SPIE 2015, 9607, 96071V. [Google Scholar]
- 29.Lei N; Wang Z; Fulbright J; Xiong X Effect of the SDSM detector relative spectral response in determining the degradation coefficient of the SNPP VIIRS solar diffuser reflectance. Proc. SPIE 2013, 8866, 88661I. [Google Scholar]
- 30.Iona G; Butler J; Guenther B; Graziani L; Johnson E; Kennedy B; Kent C; Lambeck R; Waluschka E; Xiong X VIIRS on-orbit optical anomaly: investigation, analysis, root cause determination and lessons learned. Proc. SPIE 2012, 8510, 85101C. [Google Scholar]
- 31.Barrie JD; Fuqua PD; Meshishnek MJ; Ciofalo MR; Chu CT; Chaney JA; Moision RM; Graziani L Root cause determination of on-orbit degradation of the VIIRS rotating telescope assembly. Proc. SPIE 2012, 8510, 8510IB. [Google Scholar]
- 32.Moyer D; McIntire J; De Luccia F; Efremova B; Chiang K; Xiong X VIIRS thermal emissive bands calibration algorithm and on-orbit performance. Proc. SPIE 2012, 8510, 85101D. [Google Scholar]
- 33.McIntire J; Moyer D; Efremova B; Oudrari H Xiong, X. On-orbit Characterization of S-NPP VIIRS Transmission Functions. IEEE Trans. Geosci. Remote Sens 2015, 53, 2354. [Google Scholar]
- 34.Fulbright J; Anderson S; Lei N; Efremova B; Wang Z; McIntire J; Chiang K; Xiong X The solar vector error within the SNPP Common GEO code, the correction, and the effects on the VIIRS SDR RSB calibration. Proc. SPIE 2014, 9264, 92641T. [Google Scholar]
- 35.Bhatt R; Doelling DR; Wu A; Xiong X; Scarino BR; Haney CO; Gopalan A Initial Stability Assessment of S-NPP VIIRS Reflective Solar Band Calibration Using Invariant Desert and Deep Convective Cloud Targets. Remote Sens. 2014, 6, 2809. [Google Scholar]
- 36.Wang W; Cao C Assessing the VIIRS RSB calibration stability using deep convective clouds. Proc. SPIE 2014, 9264, 926410. [Google Scholar]
- 37.Uprety S; Cao C Suomi NPP VIIRS reflective solar band on-orbit radiometric stability and accuracy assessment using desert and Antarctica Dome C sites. Remote Sens. Environ 2015, 166, 106. [Google Scholar]
- 38.Wu A; Xiong X; Cao C; Sun C Monitoring NPP VIIRS on-orbit radiometric performance from TOA reflectance time series. Proc. SPIE 2013, 8866, 88660Q. [Google Scholar]
- 39.Wu A; Xiong X; Cao C; Chiang K Assessment of SNPP VIIRS VIS/NIR radiometric calibration stability using Aqua MODIS and invariant surface targets. IEEE Trans. Geosci. Remote Sens In Press. [Google Scholar]
- 40.Moeller C; Tobin D; Quinn G S-NPP VIIRS thermal band spectral radiance performance through 18 months of operation on-orbit. Proc. SPIE 2013, 8866, 88661N. [Google Scholar]
- 41.Madhavan S; Wu A; Brinkmann J; Wenny B; Xiong X Evaluation of VIIRS and MODIS thermal emissive band calibration consistency using Dome C. Proc. SPIE 2015, 9639, 963913. [Google Scholar]
- 42.Efremova B; Wu A; Xiong X Relative spectral response corrected calibration inter-comparison of S-NPP VIIRS and Aqua MODIS thermal emissive bands. Proc. SPIE 2014, 9218, 92180G. [Google Scholar]
- 43.Lei N; Xiong X Impact of the angular dependence of the SNPP VIIRS solar diffuser BRDF degradation factor on the radiometric calibration of the reflective solar bands. Proc. SPIE 2015, 9607, 96071Y. [Google Scholar]
- 44.Lei N; Xiong X Examination of the angular dependence of the SNPP VIIRS Solar Diffuser bidirectional reflectance distribution function degradation factor. Proc. SPIE 2014, 9218, 92181N. [Google Scholar]
- 45.Fulbright J; Lei N; Efremova B; Xiong X Suomi-NPP VIIRS Solar Diffuser Stability Monitor Performance. IEEE Trans. Geosci. Remote Sens doi: 10.1109/TGRS.2015.2441558. [DOI] [Google Scholar]