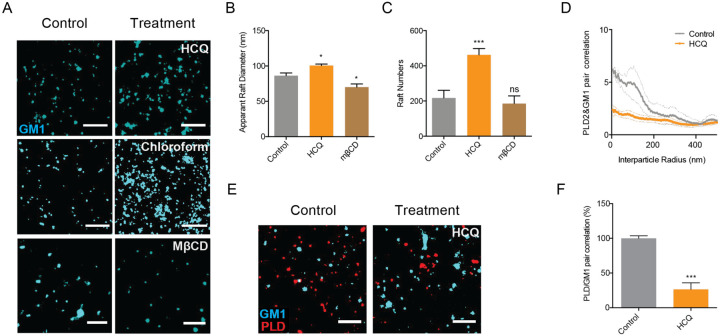
Fig. 2. Anesthetic-like disruption of GM1 rafts by Hydroxychloroquine.
(A) Representative dSTORM images showing the GM1 raft perturbation by HCQ (50 μM) and MβCD (100 μM) in HEK293T cells (Scale bars = 1 μm). Similar disruption from 1 mM chloroform treatment, an anesthetic, is shown from Pavel et. al. PNAS 2020; 117:13757–66, with permission, for comparison. (B-C) Bar graph of the apparent raft diameter analyzed by DBSCAN cluster analysis. HCQ increases both raft diameter (B) and number (C) of GM1 rafts. Data are expressed as mean ± s.e.m., *P ≤ 0.05, ***P ≤ 0.001, one-way ANOVA, n=7. (D-E) Pair correlation analysis (D) of two color dSTORM imaging (E). HCQ treatment decreased association of phospholipase D2 (PLD2, red shading), an anesthetic sensitive enzyme, with GM1 rafts (cyan shading) (scale bars = 1 μm). (F) Quantification of pair correlation in (D) at short distances (0–5 nm). Data are expressed as mean ± s.e.m., ***P ≤ 0.001, unpaired t-test, n=4–7.

