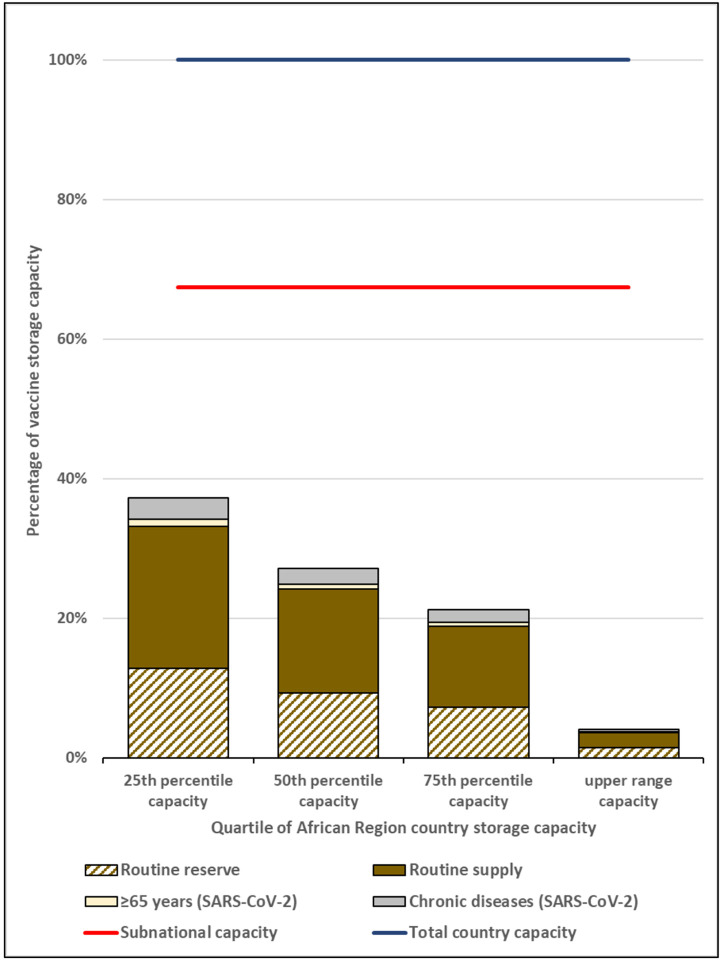
Figure 4.
Maximum subnational level monthly routine and SARS-CoV-2 vaccine volumes as a proportion of total country capacity, by quartile of African Region country storage capacity
Notes:
1. Based on the maximum monthly subnational vaccine storage volume (month 11) of the vaccine flow-down schematic (Figure 1).
2. HCWs target group removed because volume contribution was too small to depict in the figure.

