

Abstract
Mass spectrometry (MS) plays an important role in seeking biomarkers for disease detection. High-quality quantitative data is needed for accurate analysis of metabolic perturbations in patients. This article describes recent developments in MS-based non-targeted metabolomics research with applications to the detection of several major common human diseases, focusing on study cohorts, MS platforms utilized, statistical analyses and discriminant metabolite identification. Potential disease biomarkers recently discovered for type 2 diabetes, cardiovascular disease, hepatocellular carcinoma, breast cancer and prostate cancer through metabolomics are summarized, and limitations are discussed.
Keywords: Disease biomarkers, non-targeted metabolomics, mass spectrometry, data analysis
Introduction
Based on the National Institutes of Health Biomarkers Definitions Working Group, a biomarker is a characteristic that is objectively measured and evaluated as an indicator of normal biological processes, pathogenic processes, or pharmacologic responses to a therapeutic intervention.[1] The parameters that characterize the performance of a biomarker-based test include sensitivity, specificity, positive predictive value, and negative predictive value. In practice, no biomarker-based test has perfect clinical and analytical sensitivity and specificity. For example, the current blood screening test for hepatocellular carcinoma (HCC) diagnosis, based on α-fetoprotein (AFP) detection, has limited specificity and sensitivity since AFP is also a fetal antigen and other liver diseases such as hepatic cirrhosis can also lead to high AFP blood levels.[2] For prostate cancer (PCa) diagnosis, the current blood test based on prostate specific antigen (PSA) measurement has low specificity because elevated PSA levels can also result from inflammatory processes or benign prostatic hyperplasia (BPH).[3] Based on the multiple processes that can lead to disease, a biomarker panel consisting of multiple compounds may provide more accurate correlations to disease states with enhanced sensitivity and selectivity than a single biomarker for detection.[4–6] In this scenario, the comprehensive analysis of small molecule metabolites in a biological system through metabolomics technology has opened a new window for biomarker discovery. Groups of metabolites can result in a disease signature that may change as a process evolves and reflect the health state of a patient through a close representation of the phenotype.
Over the last decade, mass spectrometry (MS) has witnessed a very rapid growth in clinical metabolomics with targeted and non-targeted approaches. Targeted metabolomics aims to quantify the concentration of a predefined set of chemically characterized metabolites, while non-targeted metabolomics comprehensively analyzes all measurable analytes in a sample including chemical unknowns.[7] In this review, we provide an overview of MS-based non-targeted metabolomics studies for human disease biomarker discovery, mostly reported in the past three years. We also discuss the general procedures for non-targeted metabolomics workflow and provide guidelines on how to conduct this type of studies.
At present, there are difficulties in replication of the identified disease biomarkers. Several factors may contribute to this issue: first, it is difficult to obtain cohorts with sufficient large size and diversity in ethnicity, gender and geographical region for both training and validation tests; secondly, differences in techniques affect metabolite detection and different data-processing methods such as normalization method may also affect analysis results. Significant efforts are needed in constructing large biobanking systems and standardizing of metabolomics workflow.
Recent MS-based Non-targeted Metabolomics Studies in Disease Biomarker Discovery
Type 2 diabetes
In the past three years, diabetes has been one of the most frequently studied diseases using MS-based metabolomics. Different studies providing metabolite panels that outperformed models based on clinical risk factors for type 2 diabetes risk prediction are summarized in Table 1. Peddinti et al. implemented both non-targeted and targeted metabolic profiling of fasting serum samples from a Finnish cohort used for training classification models, and plasma samples from a French cohort used for validation (Table 1).[8] Non-targeted metabolic profiling was performed using ultraperformance liquid chromatography mass spectrometry (UPLC-MS) and gas chromatography (GC)-MS-based methods and targeted metabolomics was used for absolute metabolite quantification using isotope-dilution liquid chromatography tandem mass spectrometry (LC-MS/MS).[8] A set of 34 differential metabolites was associated with type 2 diabetes progression, and a 7-metabolite panel comprised of glucose, mannose, α-hydroxybutyrate (α-HB), α-tocopherol, bradykinin hydroxyproline ([Hyp3]-BK) and two unknown compounds, was found to predict type 2 diabetes risk.[8] Also, increased levels of BCAAs (valine and isoleucine) and decreased levels of histidine, glutamine and glycine were found associated with progression to type 2 diabetes.[8] ROC curves were generated by repeated nested cross-validation and AUC was 0.75 for the 7-metabolite model and 0.78 for a combined model including clinical risk factors, which were significantly better than the clinical-only model (AUC = 0.68). This marker panel was further tested in the validation cohort using 4 out of 7 metabolites (glucose, mannose, α-HB and α-tocopherol) with an AUC = 0.84 for the combined model.[8] A strength of this work relies on the robust models developed, but limitations are associated with the biological interpretation of the potential biomarkers obtained based on the identification confidence level provided for these compounds.
Table 1.
Studies on biomarkers of Type 2 diabetes risk.
| Reference | [8] | [9] | [10] |
|---|---|---|---|
| Follow-up period | 10 year (BPS) and 9 years (DESIR) | 10 year | 6 year |
| Metabolomics approach | Non-targeted and targeted | Non-targeted, integrated with genetics data | Non-targeted |
| Training cohort / sample type | BPS (543 nondiabetic individuals including 146 events of type 2 diabetes) / serum | ULSAM (n = 1138 with 78 incident events / plasma), PIVUS (n = 970 with 70 incident events / serum) and TwinGene (n = 1630 with 122 incident events / serum) | |
| Validation cohort / sample type | DESIR (1044 individuals including 231 events of type 2 diabetes) / plasma | KORA S4 (n = 855 with 88 incident events / serum) | 197 cases and 197 HCs / serum |
| Analytical Platform | GC-MS and LC-MS(±ve) | LC-MS (+ve) (ULSAM, PIVUS and TwinGene), and GC-MS and LC-MS (±ve) (KORA S4) | LC-MS±ve and GC-MS |
| Univariate analysis | Fisher’s exact test and Welch’s two-sample t test | Paired t test | |
| Multivariate analysis | Logistic regression and RLS regression and Greedy RLS regression used to determine model size. | Logistic regression, and LASSO penalised Cox regression model adjusted for age and gender | Multivariable-adjusted logistic regression and oPLS-DA |
| Normalization method | ANOVA-type normalization | Normalized in MZmine 2 | |
| Feature selection criteria and methods | FDR p < 0.05 using logistic regression | FDR p < 0.05 (using Cox proportional hazard models adjusted for age and gender) | FDR p < 0.05 in paired t test; and VIP > 1.0 in oPLS-DA |
| Size of differential metabolite pool | 34 (adjusted for age, sex, BMI, family history and fasting insulin) | 36 | 35 |
| Additional feature selection criteria and methods | GreedyRLS for feature selection | FDR p < 0.05 (additionally adjusted for BMI, waist circumference and fasting glucose) and LASSO predictor selection | AUC > 0.80 |
| Signature or unimetabolite pattern / model | 7-metabolite (training) and 4-metabolite (validation) signatures / RLS regression | Unimetabolite pattern / Cox regression | 6-metabolite / Logistic regression |
| Biomarker panel (OR or HR) | Glucose (OR: 2.18), mannose (2.05), a-HB (1.57), a-tocopherol (0.62), [Hyp3-BK] (0.55), X-12063 (1.86), and X-13435 (0.82) / glucose, mannose, α-HB and α-tocopherol | Cortisol (HR: 0.83), γ-glutamyl-leucine (1.33), LysoPC/PC(O-16:1/0:0) (0.81), 2-methylbutyroylcarnitine (1.21), barogenin (1.21), L-tyrosine (1.18), SM(33:1) (0.87), LysoPC(20:2) (0.85), MAG(18:2) (1.23), CerPE(38:2) (0.87), missing@tg43 (1.21), SM(d18:2/18:1) (0.88), SM(34:2) (0.89), deoxycholic acid (1.18) and PC(42:7) (0.87) | Proline (OR: 0.44), glycerol (0.48), aminomalonic acid (2.03), LPI(16:1) (2.0), CMPF (0.76), and urea (1.97), added to the basic model with BMI, smoking status and history of hypertension |
| Identification | Automated spectral comparison with a standard library | Spectral matching against an in-house spectral library of authentic standards and public libraries | For GC-MS, NIST 11 library was used to identify metabolites based on retention index and mass-spectral similarity; for LC-MS, metabolites were identified based on accurate mass, MS/MS pattern, and retention time by matching features to HMDB, METLIN, and Lipid MAPS databases, with some further confirmed by commercial standards. |
| AUC | Training: metabolic model (0.75), clinical-only model (0.68) and combined model (0.78) Validation: clinical-only model (0.76), and combined model (0.84) | Combined model: 0.935; Basic model: 0.769 |
α-HB: α-hydroxybutyrate, [Hyp3]-BK: bradykinin hydroxyproline, PC: phosphatidylcholine, SM: sphingomyelin, MAG: monoacylglycerol, CerPE: ceramide phosphoethanolamine, LPI: lysophosphatidylinositol, CMPF: 3-carboxy-4-methyl-5-propyl-2-furanpropionic acid, X-12063, X-13435 and missing@tg43: 3 unknown compounds, BPS: a Finnish cohort, DESIR: a French cohort, ULSAM, PIVUS and TwinGene: Swedish cohorts, and KORA S4: a Germany cohort.
A different LC-MS based non-targeted metabolomics study coupled with genetic analyses identified bile acid synthesis and phospholipid metabolism as being associated with type 2 diabetes incidence.[9] Data from three Swedish cohorts were involved in this study, and a German cohort was utilized for further replication.[9] Fifteen metabolites were significantly altered in models adjusted for age, gender, waist circumference, body mass index (BMI) and fasting glucose (p < 0.05), however, only five compounds (cortisol, γ-glutamyl-leucine, 2-methylbutyroylcarnitine, L-tyrosine and deoxycholic acid) could be analyzed in the validation cohort,[9] revealing the difficulty in replicating in an independent cohort from a different geographical region biomarkers discovered in a non-targeted fashion and with different analytical methods. In addition, different metabolite panels were found by authors from Refs. [8] and [9] due to the implementation of different analytical methods (LC-MS and GC-MS vs. LC-MS) and different normalization methods. Identification of monosaccharides and polar amino acids was limited by using only reverse-phase LC in which polar metabolites are not well retained, and considering that all metabolic features with a retention time < 35 s were excluded. [9].
Another non-targeted metabolomics study on metabolic signatures of type 2 diabetes risk applied both LC-MS and GC-MS to obtain serum metabolic profiles from a Singapore Chinese cohort (Table 1).[10] Thirty-five differential metabolites were found associated with increased type 2 diabetes risk, including increased levels of BCAAs and non-esterified fatty acids (palmitic acid, linoleic acid, oleic acid, and stearic acid), and decreased levels of proline, serine and medium-chain acylcarnitines. The positive association of BCAAs (valine and isoleucine [8]) and valine, leucine and isoleucine [10] with progression to type 2 diabetes is consistent with a recent meta-analysis.[11] However, palmitic acid and stearic acid may also be background or contaminant ions, and their origins need further verification since no blank samples were analyzed, this lack being a limitation of this study. From the pool of 35 differential metabolites, a group of six metabolites (proline, glycerol, aminomalonic acid, lysophosphatidylinositol (LPI) (16:1), 3-carboxy-4-methyl-5-propyl-2-furanpropionic acid (CMPF), and urea) with AUC >0.80 were added to a multivariate-adjusted logistic regression model together with established diabetes risk factors, improving the AUC of type 2 diabetes risk prediction from 0.769 to 0.935.[10]
Cardiovascular disease (CVD)
Coronary heart disease is the leading cause of mortality in most developed countries. Different potential plasma biomarker panels associated to CVD risk were discovered by means of metabolomics and lipidomics strategies (Table 2). Hazen and coworkers conducted non-targeted and targeted metabolic profiling studies using training and validation cohorts of different sizes (Table 2). [12, 13] In a first study [13], 18 plasma analytes, selected by stringent feature selection approaches, were identified to be associated with cardiac risk, including choline, trimethylamine N-oxide (TMAO), betaine, and also a compound with m/z = 189.1, which was subsequently confirmed to be N6,N6,N6-trimethyl-L-lysine (TML). [12] The latter, which is a nutrient precursor for gut microbiota-dependent generation of trimethylamine (TMA), and the atherogenic metabolite TMAO, were suggested in a second study as independent prognostic biomarkers for CVD risk.[12]
Table 2.
Studies on cardiovascular disease (CVD) metabolite biomarkers.
| Reference | [12] | [13] | [14] | [15] |
|---|---|---|---|---|
| Research question | Incident CVD and mortality risks | Incident (3-year) CVD risks including stroke, MI or death | CVD risk over a 10-year period | CVD risk over a 10-year period |
| Follow-up period | 3 years for CVD and 5 years for mortality | |||
| Metabolomics approach | Non-targeted and targeted | Non-targeted and targeted | Shotgun lipidomics | Proteomics and lipidomics |
| Training cohort / sample type | Discovery cohort 1: 49 cases and 50 controls / plasma Discovery cohort 2: n = 1,162 / plasma Both from GeneBank |
50 cases vs. 50 controls / plasma | n = 685 with 90 CVD events / plasma (from Bruneck Study) | n = 688 with 91 CVD events / plasma (from Bruneck Study) |
| Validation cohort / sample type | Validation cohort: n = 2,140 / plasma From GeneBank | 25 cases vs. 25 controls (from GeneBank) Third independent cohort: n = 1,876 (from GeneBank and BioBank) |
n = 1453 with 45 CVD cases (from TwinsUK) | |
| Analytical Platform | LC-MS (+ve) | NMR, LC-MS (+ve) and GC-MS | Bruneck Study: LC-MS (+ve) and TwinsUK: LC-MS (−ve) | LC and MRM-MS |
| Univariate analysis | Student’s t test or Wilcoxon’s rank-sum test and χ2 test | Student’s t test and Wilcoxon rank sum test, χ2 test and Cochran-Armitage trend test | Student’s t test and Mann-Whitney-Wilcoxon test | |
| Multivariate analysis | Logistic regression | Logistic regression including traditional cardiac risk factors | Cox regression | Cox regression adjusted for age, sex and statin therapy, etc. |
| Normalization method | Using d9(trimethyl)TML as internal standard for targeted analysis of TML | Using internal standards TMAO-trimethyl-d9 and choline-trimethyl-d9 for targeted quantification of TMAO and choline | Normalized to internal standards | Normalized to internal standards |
| Feature selection criteria and method | (1) Bonferroni-adjusted p < 0.05 in the t test, (2) significant dose-response relationship between analyte and clinical phenotype using trend test (p for trend < 0.05), and (3) signal-to-noise ratio ≥ 5.0 | FDR p < 0.05 in the Cox regression adjusted for age, sex and statin medication. | Apolipopproteins: p < 0.001 by Cox regression adjusted for age, sex and statin therapy, etc. Lipids: correlated with apoC-II, apoC-III and apoE |
|
| Size of differential marker pool | Based on Ref. [13] | 18 metabolites | 25 lipids | 3 VLDL-associated apolipopproteins and related lipids |
| Additional feature selection criteria and method | Significantly associated with CVD beyond TmAo | Significantly correlated among one another (p < 0.001) | LASSO | |
| Signature or unimetabolite pattern / model | Unimetabolite pattern / Logistic regression | Unimetabolite pattern / Logistic regression | Unimetabolite and signature models / Cox regression | Unimetabolite pattern / Cox regression |
| Biomarker panel | TML | Choline, TMAO and betaine | Unimetabolite: TAGs and CEs, complemented by PE/PCs, SMs and LPCs Signature: TAG(54:2), CE(16:1) and PE(36:5) plus conventional risk factors |
Apolipoproteins: apoC-II, apoC-III, and apoE Lipids: TAGs, CEs, PCs and PEs |
| Identification | MS/MS matching to authentic standard | Identification using a combination of LC/MS/MS, LC-MSn, multinuclear NMR, GC/MS | Shotgun lipidomics |
MI: myocardial infarction, TML: N6,N6,N6-trimethyl-L-lysine, TMAO: trimethylamine N-oxide, VLDL: very-low-density lipoprotein, TAG: triacylglycerol, CE: cholesterol ester, PC: phosphatidylcholine, PE: phosphatidylethanolamine, and SA: Stable angina.
Both genetic and environmental factors are related to CVD pathogenesis, with a known environmental factor being a lipid-rich diet.[13] Stegemann etal. performed a shotgun lipidomics ancillary study within the Bruneck study, finding that triacylglycerols (TAGs) and cholesterol esters (CEs) showed the strongest associations with CVD risk, followed by phosphatidylethanolamines (PEs)/phosphatidylcholines (PCs), sphingomyelins (SMs) and lysophosphatidylcholines (LPCs).[14] These results were consistent with their follow-up targeted proteomics and lipidomics study using multiple reaction monitoring MS (MRM-MS) in which three apolipoproteins (apoC-II, apoC-III and apoE) were most significantly associated with incident CVD, from the total of 13 apolipoproteins quantified. Lipid species including TAGs, CEs, PCs and PEs were also found to be strongly correlated with apoC-II, apoC-III and apoE.[15]
Hepatocellular carcinoma (HCC)
Recently, non-targeted metabolomics studies in serum, plasma and tissue have been undertaken to discover new biomarkers of HCC.[16–19] Gong et al. analyzed serum samples of HCC and hepatitis B virus cirrhosis (HBV-CIRR) patients, which were compared to healthy controls (HCs) using both GC-MS and LC-MS-based methods (Table 3). [16] These authors performed non-targeted metabolomics experiments and targeted analysis of 22 eicosanoids, deriving 14 differential metabolites that were progressively altered in HBV-CIRR and HCC, including increased levels of malate, citrate, succinate, lysine, carnitine, proline, ornithine, serine, phenylalanine, tyrosine, and arachidonic acid, and decreased levels of arabinose, galactose and uric acid.[16] The AUC, sensitivity and specificity values of the two signatures of selected eicosanoids and other metabolites (Table 3) showed better discrimination results than AFP.[16] Besides, Wang et al. reported candidate biomarkers for HCC clinical staging (between stage I and non-stage I HCC and between stages I and II) including dihydrocortisol, taurine, uric acid, LPC, LPE, and estrone, among others (Table 3). [18] Di Poto et al. conducted GC-MS-based non-targeted metabolomics analysis on plasma samples from HCC patients and liver CIRR controls (Table 3).[19] Notably, this was followed by a targeted evaluation of 46 metabolites selected based on those exhibiting significant changes in non-targeted analysis, metabolites selected from their previous study on an Egyptian cohort, and from literature search by text mining.[19] Least absolute shrinkage and selection operator (LASSO) regression further provided a 11-metabolite signature containing amino acids and their derivatives (valine, serine, glycine, isoleucine, creatinine, and pyroglutamic acid/glutamic acid), sugars, and alcohols (alpha-D-glucosamine 1-phosphate and tagatose), fatty acids (linoleic acid and lauric acid) and the inorganic acid phosphoric acid, which combined with clinical factors, discriminated HCC from CIRR controls (AUC = 0.857 using SVM), much better than AFP (AUC = 0.712).[19] However, some metabolite identities such as phosphoric acid, lauric acid, and tagatose might also be originated from exogenous sources such as food or contamination and their true origin needs to be further examined.
Table 3.
Studies on hepatocellular carcinoma (HCC) metabolite biomarkers.
| Reference | [16] | [17] | [18] | [19] |
|---|---|---|---|---|
| Research target | HCC, HBV-CIRR and HC | HCC vs. CIRR | Stage I vs. non-stage I HCC and stage I vs. stage II | HCC vs. CIRR |
| Metabolomics | Non-targeted metabolomics and targeted eicosanoid analysis | Non-targeted | Non-targeted | Non-targeted |
| Cohort / sample type | 51 HCC patients, 49 HBV patients and 39 HCs / serum | 30 HCC, 30 CIRR and 30 HC / serum 30 pairs of samples from HCC / tissue | TNM stage patients: 39 in stage I and 21 in non-stage I HCC / serum Chinese stage patients: 33 in stage I, 25 in stage II, and 30 HCs / serum |
63 HCC patients and 65 CIRR controls / plasma |
| Analytical Platform | GC-MS and LC-MS (±ve) | LC-MS (±ve) | LC-MS (±ve) | GC-MS |
| Univariate analysis | Wilcoxon Mann-Whitney test | Univariate test | Mann-Whitney U test | Univariate logistic regression |
| Multivariate analysis | Logistic regression and oPLS-DA | Logistic regression and oPLS-DA | PLS-DA | LASSO regression, logistic regression and SVM |
| Normalization methods | Normalized to internal standards | Normalized in Metaboanalyst | ||
| Feature selection criteria and method | Eicosanoids: consistently detected in samples Metabolites: VIP > 1,p < 0.05 in Wilcoxon Mann-Whitney test, and stepwise altered in HBV-CISS and HCC |
VIP > 1.0 andp < 0.05 | VIP > 1.9 andp < 0.05 in Mann-Whitney U test | (1) with statistical significant changes, (2) from previous GC-MS study, and (3) from literature |
| Size of differential marker pool | 22 Eicosanoids 14 metabolites |
Tissue: 30 metabolites Serum: 19 metabolites |
14 metabolites | 46 metabolites |
| Additional feature selection criteria and method | Highest VIP and lowest p values | Both present in tissue and serum samples and most significant predictors | LASSO regression | |
| Signature or unimetabolite pattern / model | 4-eicosanoid signature and 4-metabolite signature / Logistic regression | 4-metabolite signature / Logistic regression | Unimetabolite pattern | 11-metabolite signature / SVM |
| Biomarker panel | Eicosanoids: PGF2a, thromboxane 2 (TXB2), 5-hydroxyeicosatetraenoic acid (5-HETE), and 15-HETE Other metabolites: lysine, citrate, phenylalanine and serine |
CDCA, LPC20:5, succinyladenosine and uridine | Stage I vs. non-stage I: dihydrocortisol, LPC(18:0), LPE(16:0), taurine, uric acid, adipic acid, tetracosatetraenoic acid and L-octanoylcarnitine Stage I vs. stage II: LPC(22:6), a-linolenylcarnitine, estrone, LPE(16:0), LPE(18:2) and taurine |
Valine, serine, glycine, isoleucine, creatinine, and pyroglutamic acid/glutamic acid, alpha-D-glucosamine 1-phosphate, tagatose, linoleic acid, lauric acid and phosphoric acid |
| Identification | m/z and MS/MS search in HMDB, METLIN and LipidMaps; available standards were used for identification. | Spectra matching to those of authentic standards or confirmed spectra in HMDB, METLIN or Lipidmaps | Some were matched in HMDB and confirmed by chemical standards | Identification by AMDIS, confirmation of majority of metabolites selected by LASSO by matching to spectra of the authentic standards |
| AUC | HCC vs. HC: Eicosanoids (0.843) Other metabolites (0.886) AFP (0.832) HCC vs. HBV-CIRR: Eicosanoids (0.784) Other metabolites (0.833) AFP (0.657) |
Logistic regression HCC vs. non-HCC: Metabolites (0.962) and AFP (0.703) HCC vs. CIRR: Metabolites (0.938) and AFP (0.656) |
Stage I vs. non-stage I: dihydrocortisol (0.72) Stage I vs. stage II: LPC (22:6) (0.70) and estrone (0.70) |
Metabolites (0.805) Metabolites + clinical covariates (0.857) Clinical covariates (0.786) AFP (0.712) |
| Sensitivity / specificity | HCC vs. HC, Eicosanoids (71% / 81%) Other metabolites (75% / 79%) HCC vs. HBV-CIRR: Eicosanoids (67% / 77%) Other metabolites (70% / 74%) |
Logistic regression HCC vs. non HCC: Metabolites (96.7% / 88.3%) and AFP (53.3% / 83.3%) HCC vs. CIRR: Metabolites (96.7% / 86.7%) and AFP (53.3% / 76.7%) |
HBV: hepatitis B virus, CIRR: cirrhosis, CDCA: chenodeoxycholic acid, LPC: lysophosphatidylcholine, LPE: lysophosphatidylethanolamine, and AMDIS: Automated Mass Spectral Deconvolution and Identification System.
Breast cancer (BC)
BC is among the most curable cancers when diagnosed at early stages. Several studies using serum, plasma, urine and tissue samples from BC patients were recently reported on the discovery of new biomarker candidates for BC diagnosis and improved prognosis.[20–23] Asiago etal. studied BC recurrence using a combination of NMR and two-dimensional GC×GC-MS (Table 4). [20] In this study, serum samples were collected more than 3 months before recurrence diagnosis (“Pre”), within 3 months before/after diagnosis (“Within”), and 3 months after recurrence diagnosis (“Post”), as well as from patients with no evidence of disease (NED). Initial logistic regression analysis was used to rank metabolites to maximize diagnostic accuracy, then a partial least squares-discriminant analysis (PLS-DA) model with 11 metabolite markers (Table 4) was built yielding 86% sensitivity and 84% specificity for “Post” and “Within” vs. “NED” with leave-one-out cross-validation. Overall, sensitivity was much improved than the current BC-monitoring assay - cancer antigen (CA) 27.29 (Table 4).[20]
Table 4.
Studies on breast cancer (BC) metabolite biomarkers.
| Reference | [20] | [21] | [22] | [23] |
|---|---|---|---|---|
| Research objective | BC recurrences vs. NED | BC patients vs. HCs | Incident BC patients vs. cancer-free controls | BC patients vs. HCs |
| Follow-up period | ~ 6 years | 7 years | ||
| Metabolomics | Non-targeted | Pathway-related | Non-targeted | Non-targeted |
| Cohort / sample type | 67 samples (20 patients), Within 18 (18), Post 31 (20) and NED 141 (36) / serum | 102 BC patients vs. 99 HCs / plasma | 84 incident BC patients and 88 controls / serum | 31 BC patients and 29 HCs / urine |
| Analytical Platform | NMR and GCxGC-MS | LC-MS (±ve) | LC-MS (±ve) | GC-MS, LC-MS (±ve) |
| Univariate analysis | Student’s t test | General linear model | t test | Unpaired t test or Mann-Whitney U test; |
| Multivariate analysis | Initial logistic regression analysis for ranked set of markers and PLS-DA | PLS-DA | Logistic regression and oPLS-DA | PLS-DA |
| Normalization method | Normalized by quality control averaged values | Normalized by total useful signals | ||
| Feature selection criteria and method | (1)p < 0.05 in t test or (2) related to NMR biomarkers or (3) high similarity to the NIST database and other biomarkers | FDR p < 0.05, adjusted for age, and also not significant between two control cohorts | VIP > 1, and FDR p < 0.05 in t test | FDR p < 0.05 and FDR VIP > 1.0 |
| Size of differential marker pool | 22 NMR detected metabolites and 18 GCxGC-MS metabolites | 30 metabolites | 42 metabolites | 29 (GC-MS) and 8 (LC-MS (±ve)) metabolites, and 6 (LC-MS (+ve)) lipids |
| Additional feature selection criteria and method | Low p value or highly ranked to maximize diagnostic accuracy by logistic regression | VIP > 1 in PLS-DA | p < 0.05 using logistic regression adjusted for age and body weight | Best classification |
| Signature or unimetabolite pattern / method | 11-metabolite signature / PLS-DA | 6-metabolite signature / PLS-DA | Unimetabolite pattern | 2-metabolite signature |
| Biomarker panel | Formate, histidine, proline, choline, tyrosine, 3-hydroxybutyrate, lactate, glutamic acid, N-acetyl-glycine, 3-hydroxy-2-methyl-butanoic acid and nonanedioic acid | Proline, myoinositol, 2-hydroxybenzoic acid, gentisic acid, hypoxanthine and 2,3-dihydroxybenzoic acid | Leucine, AA, PGJ2, PGE2 and GLA | Dimethylheptanoylcarnitine and succinic acid |
| Identification | For, GCxGC-MS, metabolite identification is performed by matching to spectrum from standard NIST library | Metabolite identities confirmed by spiking mixtures of standard compounds into prepared plasma samples | Putative identification via HMDB, KEGG, ChemSpider, and Massbank; experimental MS/MS was matched to MS/MS spectra in HMDB, Lipid MAPS, mzCloud, and MassBank databases or the Mass Frontier software database | For GC-MS, metabolite identification was performed by comparison of the mass spectrum and/or retention time with the compounds in Fiehn 2008 and NIST 14 libraries; for LC-MS, putative identification is performed by matching accurate mass to online databases METLIN, KEGG, lipid MAPS and HMDB. And MS/MS is performed for selected features |
| AUC | Post and within vs. NED: metabolites: 0.88 | 0.89 | 0.915 | |
| Sensitivity/specificity | Post and within vs. NED: metabolites: 86% / 84% CA 27.29: 35% / 96% |
80%/75% | 93%/86% |
NED: no evidence of disease, CA: cancer antigen, AA: arachidonic acid, PGJ2: prostaglandin (PG)J2, PGE2: prostaglandin E2, and GLA: γ -linolenic acid.
A plasma LC-MS-based metabolomics study of BC patients and HCs combined with a pathway-based approach was recently reported (Table 4), in which 105 metabolites related to more than 35 metabolic pathways were detected and analyzed.[21] Results from univariate and multivariate analysis showed effective all-stage as well as early-stage BC diagnosis. Significant disturbances in arginine/proline and tryptophan metabolism as well as fatty acid biosynthesis were revealed.[21] It is worth noting that proline was also found to be discriminant for BC in agreement with the serum study reported in Ref [20].
In a GC-MS-based serum metabolic profiling study of 152 BC patients and 155 HCs,[24] 7 compounds were significantly altered between BC patients and HCs including dimethyldodecane, galactose, a-glyceryl stearate, methyl stearate, 1-(1-methoxycarbonylethyl)-4-(2-methyl-2-hydroxypropyl)benzene, tetradecane and glucopyranoside. [24] Despite the possibility of some of these species having an exogenous origin, another study looking at volatile biomarkers of BC in breath has also shown the presence of alkanes (e.g. tridecane, dodecane and tetradecane),[25] which may have possibly resulted from oxidative stress on polyunsaturated fatty acids.[26] However, tetradecane, dimethyldodecane, and 1-(1-methoxycarbonylethyl)-4-(2-methyl-2-hydroxypropyl)benzene and glucopyranoside, to our knowledge, have not been reported in blood samples, and thus their origin is unclear and should be further verified to ensure correct identification and eliminate the possibility of contamination.
Prostate Cancer (PCa)
Recently, studies on PCa metabolic biomarker discovery were performed using plasma, serum, tissue, and urinary extracellular vesicle (EV) samples.[27–29]. The prostate serum antigen (PSA) is currently the most common marker used for screening PCa despite its limited specificity.[30] One of the most debated urine potential biomarkers for PCa in the literature is sarcosine, however its use in the clinic remains controversial. [31] These limitations continue to drive efforts in discovering new diagnostic markers for PCa with better specificity and sensitivity.
Recently, Fernandez and collaborators performed a rapid analysis of PCa and HC serum samples using flow injection-traveling wave-ion mobility mass spectrometry (FI-TWIM-MS), resulting in a PCa signature with uric acid, phe-phe, tryptophan, phenylacetyl glutamine, indole, p-cresol sulfate, lysophosphatidyl ethanolamine (LPE) (18:2), lysine, LPC(18:2), and leucine/isoleucine/allo-isoleucine that was used to differentiate PCa patients from controls with good sensitivity and specificity (Table 5). [27] The positive association between uric acid and PCa detection in this study was consistent with the finding by Kolonel et al. [32] Also interestingly, the performance of this method was comparable to an assay that outperformed the PSA test using the more comprehensive, but more time consuming UPLC-MS approach, suggesting that higher throughput tools can perform as well as more conventional, “gold standard” approaches.[27]
Table 5.
Studies on prostate cancer (PCa) metabolite biomarkers.
| Reference | [27] | [28] | [29] |
|---|---|---|---|
| Research target | PCa patients vs. controls | PCa patients vs. HCs | PCa vs. BPH |
| Metabolomics | Non-targeted | EV metabolomics | EV metabolomics |
| Training cohort / sample type | 61 PCa vs. 42 controls / serum | 3 PCa/pre (pre-prostatectomy), 3 PCa/post, and 3 HCs / urinary and platelet EVs. |
16 PCa stage 2 vs. 15 PCa stage 3 vs. 14 BPH / urinary EVs. |
| Validation cohort / sample type | |||
| Analytical Platform | FI-TWIM-MS | LC-MS (±ve) | LC-MS (±ve) |
| Univariate analysis | Wilcoxon rank-sum test | Student’s t test or Wilcoxon rank test | Student’s t test or Wilcoxon signed-rank test |
| Multivariate analysis | oPLS-DA | PCA and PLS-DA | |
| Normalization method | Normalized by total useful signals | Metabolite quantities normalized based on EV volume, EV number, CD9 optical density or other metabolites yield optimal results | Normalized to the sum of the peak intensities within each sample |
| Feature selection criteria and method | Identified endogenous metabolites | Above the quantification limit in uEVs. | Bonferroni adjustedp < 0.05 in the t test |
| Size of differential marker pool | 28 metabolites | 41 urinary metabolites | 76 metabolites |
| Additional feature selection criteria and method | iPLS-DA | Most significant changes (p < 0.05) in uEVs. in PCa | |
| Signature or unimetabolite pattern / model | 10-metabolite of model B | Unimetabolite pattern | Unimetabolite pattern |
| Biomarker panel | Uric acid, phe-phe, tryptophan, phenylacetyl glutamine, indole, p-cresol sulfate, LPE(18:2), lysine, LPC(18:2) and leucine/isoleucine | Pre vs. HC plus Post: Glucuronate, D-ribose 5-phosphate, isobutyryl-L-carnitine and adenosine |
PCs, fatty acid esters (acyl carnitines) and sterols, etc. |
| Identification | Putative identification based on accurate mass search in HMDB; experimental MS/MS was compared to MS/MS spectrum in Metlin database, and/or authentic standards | Spiking isotopically labeled internal standards to samples and UPLC-MS/MS analysis | |
| Sensitivity / specificity | 88.5% / 88.1% |
BPH: prostate hyperplasia, EV: extracellular vesicle, uEV: urinary EV, MMA: methylmalonic acid, PC: phosphatidylcholines, LPC: lysophosphatidylcholine, LPE: lysophosphatidyl ethanolamine, tChoCre/Spm: (total-choline+creatine)/spermine, tChoCre/Cit: (total-choline+creatine)/citrate, and LMM: linear mixed modelling.
Two recent studies have followed an uncommon, yet promising approach for PCa biomarker discovery, primarily focusing on the analysis of urine EVs (Table 5).[28, 29] Puhka et al. analyzed samples from 3 PCa patients, collected before prostatectomy (pre) and after prostatectomy (post), and from 3 HCs (Table 5).[28] Results indicated that the levels of glucuronate, D-ribose 5-phosphate and isobutyryl-L-carnitine were 2–26-fold lower in “pre” samples than HC and “post” samples, and that the changes were only detected in urinary EVs, but not in the urine samples themselves.[28] In a different study focused on discriminating patients with PCa from those with prostate hyperplasia (BPH) through the analysis of urinary EVs in a small cohort, (Table 5) increased levels of PCs, acyl carnitines, sterols, and ceramides with small carbon number in their acyl chains were detected in BPH samples. [29] Overall, further comprehensive validation of the different metabolite panels reported for PCa should be accomplished with larger cohorts to translate these findings into clinically-useful markers. Lack of such validation will limit the applicability of reported findings, and unnecessarily delay the availability of better diagnostic tools that could save patient’s lives.
Procedures in Non-targeted Metabolomics Studies
A summary of methodological details and statistical performance for the select studies discussed above are provided in Tables 1–5. Examination of these tables indicates that, by far, LC-MS has been (and continues to be) the most widely used technique for metabolic profiling and targeted analysis, with some more complex studies integrating it with GC-MS, and to a lesser extent NMR, with the aim of improving metabolite coverage and biomarker quality. Most studies leveraged both univariate and multivariate analysis methods in screening for significantly altered metabolites between case and control subjects. The most commonly used univariate analysis methods included the Student’s t test for normally-distributed data, analysis of variance (ANOVA) for comparing several groups, Welch’s t test for unequal variances, the Mann-Whitney U test (also called Wilcoxon rank-sum test), the Wilcoxon signed-rank test with respect to unpaired and paired comparison of non-normal distributed data, and the χ2 test to compare expected and observed values. Multivariate methods included logistic regression, Cox regression, principal component analysis (PCA), and partial least-squares discriminant analysis (PLS-DA). Also, clinical covariates can be included in logic regression or Cox regression to assess whether the significance in disease association is independent of other risk factors.[8–10]
It is worth mentioning that for most of the diseases described above, the main panels of discriminant metabolites identified in each study are generally not replicated across other studies. This lack of biomarker replication is one of the biggest hurdles in the field, and can likely be ascribed to differences in experimental and data analysis methods, and also to the small size of the cohorts typically examined. We strongly suggest that future studies should adopt a hybrid metabolomics approach where previously-described biomarkers are followed in a targeted fashion, while simultaneously collecting non-targeted data for discovery and pathway mapping purposes. Modern instrumentation can easily collect such LC-MS data by combining parallel reaction monitoring and survey scan functions.[33] This type of more focused exercise would be very helpful to enable more robust comparisons of biomarker abundances in the studied cohorts against literature reports, propelling the field forward in a more constructive fashion. Other aspects of the metabolomics workflows that require further standardization across laboratories include curation steps used in data pre-processing, normalization methods used in data processing, and standard practices in cohort selection including age-, gender- and BMI-matching to reduce the impact of confounders in study design. Finally, if possible, large cohorts with diversity in ethnicity, gender and geographical region for both training and validation testing are critically needed to improve longevity and impact of metabolomics efforts. However, for individual researchers, to build up a large cohort is too time consuming and expensive. More efforts should be devoted to building large biobanking systems to improve such situation.
A typical workflow used for non-targeted metabolomics studies is shown in Fig. 1, with each of the main steps critically discussed below. Although not depicted explicitly in the Figure, it should be mentioned that stringent quality assurance procedures should be followed throughout this workflow to reduce unwanted experimental variance that may obscure more interesting biological effects, as reviewed by Dudzik et al.[34] Similarly, the analysis of quality control samples must be included in this type of studies for guarantying high quality data, as recommended by the metabolomics quality assurance and quality control consortium.[35]
Figure 1.
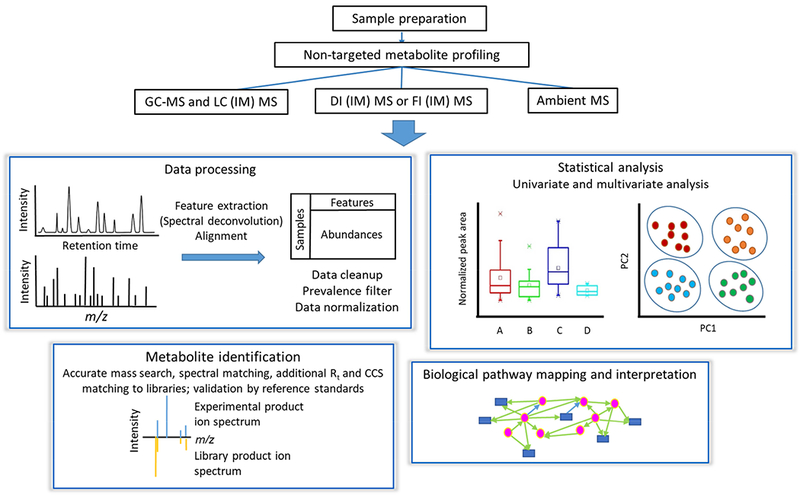
Typical non-targeted metabolomics workflow.
1. Sample Preparation
Sample preparation for non-targeted metabolomics studies should be geared towards preserving and preparing a large number of metabolites for downstream analysis while also being rapid, and highly reproducible. The importance of this step should not be underestimated, as the sensitive tools used for metabolic profiling can easily reveal differences in sample handling and preparation, becoming the largest source of unwanted variance. Blood plasma or serum and urine have typically been the most frequently investigated biofluids so far. Pretreatment of blood-derived samples (e.g. serum or plasma) typically starts with a deproteinization step followed by centrifugation to collect the metabolite-containing supernatant, which can be either directly analyzed or lyophilized and stored for further analysis after reconstitution or chemically-derivatized to increase metabolite thermal stability and volatility for GC-MS experiments.[34] Urine sample preparation is simpler due to its low protein content.[36] In this case, centrifugation is commonly used to remove solid debris, and the supernatant is then analyzed with or without dilution, depending on urine concentration. In some studies, one or several internal standards (ISs) are spiked in for post-acquisition normalization of the dataset (see Tables 1–5).
2. MS-based Metabolic Profiling Platforms
The strengths and weaknesses of various MS-based platforms used for non-targeted metabolomics are compared in Table 6. LC-MS is the most widely used metabolomics technique due to the versatile components including the ionization technique, stationary and mobile phases. Reversed-phase UPLC coupled to high resolution MS has been increasingly favored in metabolomics studies due to the robustness of these stationary phases, and the ability to resolve non-polar metabolites, including lipids, with excellent resolution and mass accuracy. However, this technique still suffers from some fluctuation in retention times and mass spectral drift, and a lack of comprehensive spectral libraries for metabolite identification. In contrast, GC-MS, the oldest hyphenated technique coupled to MS, yields more reproducible retention times and mass spectra, and more accurate and efficient metabolite identification by matching to spectral libraries. However, GC-MS can only analyze compounds that are either volatile or can be made volatile through thermally-stable derivatives. Therefore, this technique is many times viewed as a complement to LC-MS in terms of metabolite coverage.
Table 6.
Comparison of MS-based techniques applied to non-targeted metabolomics.
| Property | LC-MS | GC-MS | FI MS/DI MS | FI-IM-MS | Ambient MS |
|---|---|---|---|---|---|
| Novelty in metabolomics | Gold-standard | Most established | Relatively new | Largely unexplored | Relatively new |
| Analysis time per sample | 10-30 min | 10-30 min | <5 min | <5 min | <5 min with realtime in situ sample analysis |
| Instrument setup | Relatively simple | Relatively simple | Simplest | Simpler | Simple |
| CCS information | No | No | No | Yes | No |
| Data dimensionality (including abundance) | 3 | 3 | 2 | 3 | 2 |
| Ion suppression | Reduced | More reduced | Yes | Yes | Yes |
| Signal to noise | Good | Good | Ok | Good | Ok |
| Spectral database | Inadequate | Adequate | Similar to LC-MS | ||
| MS/MS reproducibility | Good | Excellent | Good | ||
| Retention time reproducibility | Ok | Excellent | N/A | ||
| Metabolite annotation confidence | Better | Excellent | Low | Good | Low |
| Separation of compounds by class | Separation of lipid classes by hydrophilic interaction chromatography) | No | No | Yes (on drift time vs. m/z plot) | No |
| Grouping of compounds by charge state | No | No | No | Yes (on drift time vs. m/z plot) | No |
| Separation of isobars | High | High | No | Medium | No |
| Discrimination of in-source fragments from precursor ions | Yes | N/A | No | No | No |
Large scale metabolic profiling studies involving thousands of samples call for high-throughput analytical platforms, faster than LC-MS, prompting the use of DI MS and FI MS. Without chromatographic separation, however, high resolution analyzers such as QTOF, Orbitrap and to a lesser extent due to its high cost, Fourier-transform ion cyclotron resonance (FTICR), are essential to improve metabolite annotation confidence and peak capacity.[37, 38] Ion mobility spectrometry (IMS) has been increasingly applied in combination with MS to provide an additional separation dimension, while maintaining the analysis speed of DI or FI MS, and providing collision cross section (CCS) values as an additional parameter to enhance compound identification confidence. [27]
The development of ambient MS in the last decade has further decreased sample preparation and handling requirements in metabolomics, with techniques such as rapid evaporative ionization MS (REIMS), the “MasSpec Pen”, and desorption electrospray ionization (DESI) MS imaging applied to tissue sample analysis for rapid diagnosis of human cancers and tumor excision guidance during surgery.[39–41]
3. Data Analysis
The major steps in raw data pre-processing in non-targeted metabolomics are summarized in Fig. 1. The most widely used free software tools for hyphenated MS-based metabolomics processing have been recently reviewed by Spicer et al. [42] and include XCMS [43] and MZmine 2 [44]. The steps involved in data processing include peak picking, retention time correction, and alignment. These can be optimized by using design of experiments to remove unreliable peaks and improve data quality. [45] Along these lines, the mass spectral feature list optimizer (MS-FLO) [46] was developed to post-process data and automatically identify potential false positive features such as duplicate peaks, isotopic peaks, and adducts not properly removed by XCMS and MZmine 2.
To reduce the effect of missing values on correlation between spectral features and subsequent multivariate analysis, a prevalence filter may be applied to the dataset. In this filter, a feature is retained if it has a non-zero value in at least a certain percentage (e.g. 50% or 80%) of samples of any class. Data normalization is also important to reduce unwanted variations in sample preparation, matrix effects and instrument stability, with MS total useful signal normalization and internal standard (IS) normalization being the two mainly used methods. [47] Total useful signal normalization, however, can be notably affected by metabolites with high signal intensity and IS normalization may result in unwanted signal suppression leading to incomplete removal of unwanted variation for all metabolites.[34] Quality control (QC) samples that represent both the qualitative and quantitative composition of the studied samples must be used to assess the accuracy and precision of the analytical methods, and help correct both intra- and inter-batch signal variations.[34, 35, 48] For correction of inter-batch effects, a quality control sample-based robust LOESS signal correction (QC-RLSC) method was developed by Dunn et al. In this approach, a LOESS function is applied to QC samples with the purpose of correcting the temporal fluctuation of each feature during the run sequence.[49] In addition to QCs, blanks are also essential to remove artifacts and contaminants from dataset, however, they are sometimes overlooked by metabolomic studies.[34, 48]
Extracting disease relevant information from high dimensional metabolomics datasets is not a simple task. Multivariate analysis such as PCA, PLS-DA or oPLS-DA are used to reduce the high dimensional data by transforming the original variables to fewer new variables such as principle components and latent variables.[50] However, the transformed variables in the lower dimension space can be difficult to interpret biologically, and contain interfering variables that can confound classification, therefore necessitating variable selection methods to reduce the number of original variables to improve prediction accuracy.[50] Univariate analysis methods such as the t test and the Mann-Whitney U test (Wilcoxon rank-sum test) or logistic/Cox regression analyses are the most common approaches for feature selection, however, they fail to capture correlations within the features and subtle abundance differences at the single compound level,[51] which can be better obtained by multivariate analysis. Nonetheless, multivariate analysis often suffers from overfitting and non-unique solution problems. Therefore, univariate or logistic/Cox regression analyses of the significance of individual metabolite abundances are implemented controlling the FDR to account for multiple comparisons, and are often combined with multivariate analysis metrics such as the variable importance in progression (VIP) from PLS-DA or LASSO for selecting significant metabolites (Tables 1–5, Fig. 2). In addition, it is critical to establish the identities of the selected metabolites with confidence to avoid false positives such as artifacts, contaminants and exogenous compounds from food or drugs that could easily confound disease status.[52] Finally, the most promising biomarkers must undergo rigorous validation in external cohort(s), which is performed only in a relatively small number of studies (Tables 1–5).
Figure 2.
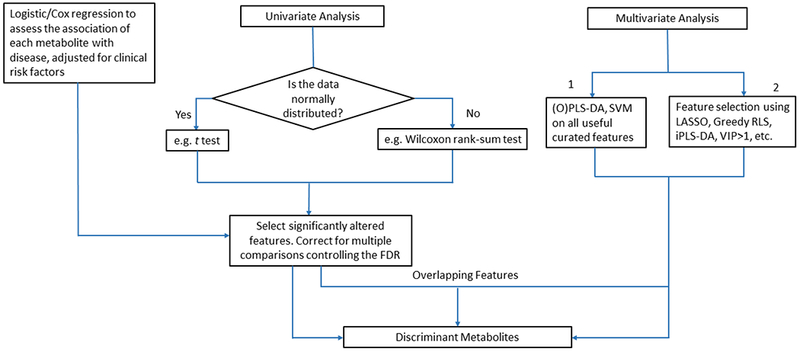
Workflow for discriminant feature selection using univariate and multivariate methods.
4. Metabolite Identification
The most widely used method to identify statistically significant metabolites is accurate mass search in databases together with targeted MS/MS for structural elucidation, followed by searches in public and commercials libraries for similar fragment spectra. In-house libraries with both spectral and retention information have been developed by individual laboratories as alternatives to open libraries, with improved instrument-specific annotation. Their availability, however, is restricted. Compound identification in GC-MS is more straightforward and accurate compared to other MS-based methods due to the reproducibility of electron ionization (EI) mass spectra and GC retention indexes. In contrast, LC-MS/MS databases are generally smaller in size with mostly instrument-dependent collisional-induced dissociation (CID) spectra and higher energy collision dissociation (HCD) spectra, but lack retention time data. A detailed review on MS/MS spectral databases and software tools for MS/MS identification of metabolites has been presented by Kind et al.[53] Further confirmation of metabolite identity by comparing to spectra of authentic standards, should always be attempted if at all possible. More recently, a Metabolic In silico Network Expansions Database (MINE-DB) was created, [54] containing metabolic products of known compounds predicted using common enzymatic transformation reactions, thereby increasing the chance of identification of unknown metabolites not included in current databases.
With the increasing popularity of IM-MS technology in metabolomics research, compound identification accuracy has been improved by the use of CCS as an additional physiochemical descriptor.[27] CCS databases have been constructed to support metabolite identification by measurement of a large number of standards or by CCS prediction using machine learning algorithms.[55, 56]
5. Pathway Analysis
Metaboanalyst [57] and the KEGG database [58] have been widely used to visualize and interpret the underlying pathway linkages mapping onto the identified metabolites. In 2018, MetaboAnalyst was updated to version 4.0 with a new feature to integrate metabolomics, metagenomics, and transcriptomics data for network analysis.[57] Also worth mentioning is WikiPathways, an open website that serves as a collaborative platform for the research community to edit and curate pathway information.[59] Most of the available pathway analysis tools require that the LC or GC-MS raw data is processed a priori by other software packages unnecessarily increasing the complexity and time required for the whole metabolomics pipeline. Recently, Huan et al. provided an online XCMS workflow encompassing all steps needed for LC-MS-based global metabolomics data analysis, including raw data preprocessing, differential analysis, dysregulated pathway analysis, and fusion of proteomic and transcriptomic data to provide a deeper insight into metabolic mechanisms on a system-wide scale, significantly increasing analysis efficiency. [60]
Limitations and Outlook
Rapid developments in MS-based non-targeted metabolic profiling strategies in the last decade have greatly promoted disease biomarker discovery in clinical metabolomics. However, replication of biomarkers still remains a significant problem and significant efforts have yet to be made towards standardization of non-targeted metabolomics workflows and biomarker validation approaches with external cohorts and targeted assays. Since the majority of metabolomics studies apply a single analytical technique, which can bias the sub-metabolome being sampled, it is suggested that future studies should combine multiple techniques such as GC-MS, LC-MS and NMR with various extraction procedures to improve metabolite coverage and the quality of biomarker panels proposed. Large discrepancies currently exist in the literature in terms of the best metabolite panels useful in diagnosing disease, largely due to a lack of harmonization and small size cohorts. Furthermore, more interdisciplinary efforts have to be undertaken to standardize protocols for integrating genomics and proteomics studies with metabolomics. At present, non-targeted metabolomics is still at the discovery level and much work is needed to make the translation to the clinic successful. We are hopeful, however, that with continuous and collaborative efforts from the metabolomics community, we will see a brighter future for this rapidly evolving field.
Highlights:
Metabolomics is the growing field studying the alterations of the metabolome.
The metabolome is the collection of small molecules in biological systems.
Ample development of new analytical approaches is needed in metabolomics.
A growing number of disease biomarkers are being discovered by metabolomics.
Acknowledgments
FMF thanks support from NIH award number 1R01CA218664, NIH 1U2CES030167-01, a CF Foundation RDP grant, and the NIH MoTrPAC Consortium (1U24DK112341-01). MEM is a research staff member from the CONICET (Consejo Nacional de Investigaciones Científicas y Técnicas, Argentina). MEM acknowledges support from the National Agency of Scientific and Technological Promotion (PRH-PICT-2015-0022 project), and from CONICET (PUE 055).
Abbreviations
- ANOVA
analysis of variance
- AUC
area under the curve
- BCAA
branched-chain amino acids
- BMI
body mass index
- DI MS
direct infusion mass spectrometry
- FDR
false discovery rate
- FI-MS
flow injection mass spectrometry
- FI-TWIM-MS
flow injection-traveling-wave ion mobility-mass spectrometry GC-MS: gas chromatography-mass spectrometry GreedyRLS: Greedy feature selection for regularized least squares
- HR
hazard ratio
- HR-MAS-MRS
High-resolution magic angle spinning magnetic resonance spectroscopy
- iPLS-DA
interval partial least squares-discriminant analysis
- LASSO
least absolute shrinkage and selection operator
- LC-MS
liquid chromatography-mass spectrometry
- LMM
linear mixed modelling
- LOESS
locally estimated scatterplot smoothing
- MRM
multiple reaction monitoring
- MS
mass spectrometry
- NMR
nuclear magnetic resonance
- oPLS-DA
orthogonal PLS-DA
- OR
odds ratio
- PLS-DA
partial least squares-discriminant analysis
- PCA
principal component analysis
- QTOF
quadrupole time-of-flight
- RLS
regularised least-squares
- ROC
receiver operating characteristic
- SVM
support vector machines
- UPLC-MS
ultraperformance LC-MS
- VIP
variable importance in the projection
Footnotes
Publisher's Disclaimer: This is a PDF file of an unedited manuscript that has been accepted for publication. As a service to our customers we are providing this early version of the manuscript. The manuscript will undergo copyediting, typesetting, and review of the resulting proof before it is published in its final citable form. Please note that during the production process errors may be discovered which could affect the content, and all legal disclaimers that apply to the journal pertain.
References
- [1].G. Biomarkers Definitions Working, Clin. Pharmacol. Ther. 69 (2001) 89. [DOI] [PubMed] [Google Scholar]
- [2].Shangguan D, Meng L, Cao ZC, Xiao Z, Fang X, Li Y, Cardona D, Witek RP, Liu C, Tan W, Anal. Chem. 80 (2008) 721. [DOI] [PubMed] [Google Scholar]
- [3].Bickers B, Aukim-Hastie C, Anticancer Research 29 (2009) 3289. [PubMed] [Google Scholar]
- [4].Nagana Gowda GA, Raftery D, Curr. Metabolomics 1 (2013) 227. [DOI] [PMC free article] [PubMed] [Google Scholar]
- [5].Marchand CR, Farshidfar F, Rattner J, Bathe OF, Metabolites 8 (2018). [DOI] [PMC free article] [PubMed] [Google Scholar]
- [6].Holmes E, Wilson ID, Nicholson JK, Cell 134 (2008) 714. [DOI] [PubMed] [Google Scholar]
- [7].Roberts LD, Souza AL, Gerszten RE, Clish CB, Curr Protoc Mol Biol Chapter 30 (2012) Unit 30 2 1. [DOI] [PMC free article] [PubMed] [Google Scholar]
- [8].Peddinti G, Cobb J, Yengo L, Froguel P, Kravic J, Balkau B, Tuomi T, Aittokallio T, Groop L, Diabetologia 60 (2017) 1740. [DOI] [PMC free article] [PubMed] [Google Scholar]
- [9].Fall T, Salihovic S, Brandmaier S, Nowak C, Ganna A, Gustafsson S, Broeckling CD, Prenni JE, Kastenmuller G, Peters A, Magnusson PK, Wang-Sattler R, Giedraitis V, Berne C, Gieger C, Pedersen NL, Ingelsson E, Lind L, Diabetologia 59 (2016) 2114. [DOI] [PMC free article] [PubMed] [Google Scholar]
- [10].Lu YH, Wang YL, Ong CN, Subramaniam T, Choi HW, Yuan JM, Koh WP, Pan A, Diabetologia 59 (2016) 2349. [DOI] [PubMed] [Google Scholar]
- [11].Guasch-Ferre M, Hruby A, Toledo E, Clish CB, Martinez-Gonzalez MA, Salas-Salvado J, Hu FB, Diabetes Care 39 (2016) 833. [DOI] [PMC free article] [PubMed] [Google Scholar]
- [12].Li XS, Wang Z, Cajka T, Buffa JA, Nemet I, Hurd AG, Gu X, Skye SM, Roberts AB, Wu Y, Li L, Shahen CJ, Wagner MA, Hartiala JA, Kerby RL, Romano KA, Han Y, Obeid S, Luscher TF, Allayee H, Rey FE, DiDonato JA, Fiehn O, Tang WHW, Hazen SL, JCI Insight 3 (2018) e99096. [DOI] [PMC free article] [PubMed] [Google Scholar]
- [13].Wang Z, Klipfell E, Bennett BJ, Koeth R, Levison BS, Dugar B, Feldstein AE, Britt EB, Fu X, Chung YM, Wu Y, Schauer P, Smith JD, Allayee H, Tang WH, DiDonato JA, Lusis AJ, Hazen SL, Nature 472 (2011) 57. [DOI] [PMC free article] [PubMed] [Google Scholar]
- [14].Stegemann C, Pechlaner R, Willeit P, Langley SR, Mangino M, Mayr U, Menni C, Moayyeri A, Santer P, Rungger G, Spector TD, Willeit J, Kiechl S, Mayr M, Circulation 129 (2014) 1821. [DOI] [PubMed] [Google Scholar]
- [15].Pechlaner R, Tsimikas S, Yin X, Willeit P, Baig F, Santer P, Oberhollenzer F, Egger G, Witztum JL, Alexander VJ, Willeit J, Kiechl S, Mayr M, J Am Coll Cardiol 69 (2017) 789. [DOI] [PMC free article] [PubMed] [Google Scholar]
- [16].Gong ZG, Zhao W, Zhang J, Wu X, Hu J, Yin GC, Xu YJ, Oncotarget 8 (2017) 63890. [DOI] [PMC free article] [PubMed] [Google Scholar]
- [17].Han J, Qin WX, Li ZL, Xu AJ, Xing H, Wu H, Zhang H, Wang MD, Li C, Liang L, Quan B, Yan WT, Shen F, Wu MC, Yang T, Clin Chim Acta 488 (2019) 68. [DOI] [PubMed] [Google Scholar]
- [18].Wang W, Lv J, Chen N, Lou B, Mao W, Wang P, Chen Y, Clin Biochem 61 (2018) 7. [DOI] [PubMed] [Google Scholar]
- [19].Di Poto C, Ferrarini A, Zhao Y, Varghese RS, Tu C, Zuo Y, Wang M, Nezami Ranjbar MR, Luo Y, Zhang C, Desai CS, Shetty K, Tadesse MG, Ressom HW, Cancer Epidemiol Biomarkers Prev 26 (2017) 675. [DOI] [PMC free article] [PubMed] [Google Scholar]
- [20].Asiago VM, Alvarado LZ, Shanaiah N, Gowda GA, Owusu-Sarfo K, Ballas RA, Raftery D, Cancer Res 70 (2010) 8309. [DOI] [PMC free article] [PubMed] [Google Scholar]
- [21].Jasbi P, Wang D, Cheng SL, Fei Q, Cui JY, Liu L, Wei Y, Raftery D, Gu H, J Chromatogr B Analyt Technol Biomed Life Sci 1105 (2019) 26. [DOI] [PubMed] [Google Scholar]
- [22].Hye Jin Yoo MK, Kim Minkyung, Kang Minsik, Jung Keum Ji, Hwang Se-mi, Jee Sun Ha, Lee Jong Ho, Metabolomics 14 (2018) 85. [DOI] [PubMed] [Google Scholar]
- [23].Cala M, Aldana J, Sanchez J, Guio J, Meesters RJW, J Pharm Biomed Anal 152 (2018) 234. [DOI] [PubMed] [Google Scholar]
- [24].Hadi NI, Jamal Q, Iqbal A, Shaikh F, Somroo S, Musharraf SG, Sci Rep 7 (2017) 1715. [DOI] [PMC free article] [PubMed] [Google Scholar]
- [25].Phillips M, Cataneo RN, Saunders C, Hope P, Schmitt P, Wai J, Breath Res J. 4 (2010) 026003. [DOI] [PubMed] [Google Scholar]
- [26].Phillips M, Cataneo RN, Greenberg J, Gunawardena R, Naidu A, Rahbari-Oskoui F, J. Lab. Clin. Med. 136 (2000) 243. [DOI] [PubMed] [Google Scholar]
- [27].Zang X, Monge ME, Gaul DA, Fernandez FM, Anal Chem 90 (2018) 13767. [DOI] [PubMed] [Google Scholar]
- [28].Puhka M, Takatalo M, Nordberg ME, Valkonen S, Nandania J, Aatonen M, Yliperttula M, Laitinen S, Velagapudi V, Mirtti T, Kallioniemi O, Rannikko A, Siljander PR, Af Hallstrom TM, Theranostics 7 (2017) 3824. [DOI] [PMC free article] [PubMed] [Google Scholar]
- [29].Clos-Garcia M, Loizaga-Iriarte A, Zuniga-Garcia P, Sanchez-Mosquera P, Rosa Cortazar A, Gonzalez E, Torrano V, Alonso C, Perez-Cormenzana M, Ugalde-Olano A, Lacasa-Viscasillas I, Castro A, Royo F, Unda M, Carracedo A, Falcon-Perez JM, Extracell J. Vesicles 7 (2018) 1470442. [DOI] [PMC free article] [PubMed] [Google Scholar]
- [30].Trock BJ, Urol Oncol 29 (2011) 572. [DOI] [PMC free article] [PubMed] [Google Scholar]
- [31].Lima AR, Bastos Mde L, Carvalho M, Guedes de Pinho P, Transl Oncol 9 (2016) 357. [DOI] [PMC free article] [PubMed] [Google Scholar]
- [32].Kolonel LN, Yoshizawa C, Nomura AM, Stemmermann GN, Cancer Epidemiol Biomarkers Prev 3 (1994) 225. [PubMed] [Google Scholar]
- [33].Schilling B, MacLean B, Held JM, Sahu AK, Rardin MJ, Sorensen DJ, Peters T, Wolfe AJ, Hunter CL, MacCoss MJ, Gibson BW, Analytical Chemistry 87 (2015) 10222. [DOI] [PMC free article] [PubMed] [Google Scholar]
- [34].Dudzik D, Barbas-Bernardos C, Garcia A, Barbas C, Journal of Pharmaceutical and Biomedical Analysis 147 (2018) 149. [DOI] [PubMed] [Google Scholar]
- [35].Beger RD, Dunn WB, Bandukwala A, Bethan B, Broadhurst D, Clish CB, Dasari S, Derr L, Evans A, Fischer S, Flynn T, Hartung T, Herrington D, Higashi R, Hsu P-C, Jones C, Kachman M, Karuso H, Kruppa G, Lippa K, Maruvada P, Mosley J, Ntai I, O’Donovan C, Playdon M, Raftery D, Shaughnessy D, Souza A, Spaeder T, Spalholz B, Tayyari F, Ubhi B, Verma M, Walk T, Wilson I, Witkin K, Bearden DW, Zanetti KA, Metabolomics 15 (2019) 4. [DOI] [PMC free article] [PubMed] [Google Scholar]
- [36].Khamis MM, Adamko DJ, El-Aneed A, Mass Spectrom Rev 36 (2017) 115. [DOI] [PubMed] [Google Scholar]
- [37].Habchi B, Alves S, Jouan-Rimbaud Bouveresse D, Appenzeller B, Paris A, Rutledge DN, Rathahao-Paris E, Anal Bioanal Chem 410 (2018) 483. [DOI] [PubMed] [Google Scholar]
- [38].Southam AD, Weber RJM, Engel J, Jones MR, Viant MR, Nature Protocols 12 (2017) 310. [DOI] [PubMed] [Google Scholar]
- [39].Phelps DL, Balog J, Gildea LF, Bodai Z, Savage A, El-Bahrawy MA, Speller AV, Rosini F, Kudo H, McKenzie JS, Brown R, Takats Z, Ghaem-Maghami S, Br J Cancer 118 (2018) 1349. [DOI] [PMC free article] [PubMed] [Google Scholar]
- [40].Zhang J, Rector J, Lin JQ, Young JH, Sans M, Katta N, Giese N, Yu W, Nagi C, Suliburk J, Liu J, Bensussan A, DeHoog RJ, Garza KY, Ludolph B, Sorace AG, Syed A, Zahedivash A, Milner TE, Eberlin LS, Sci Transl Med 9 (2017)eaan3968. [DOI] [PMC free article] [PubMed] [Google Scholar]
- [41].Banerjee S, Zare RN, Tibshirani RJ, Kunder CA, Nolley R, Fan R, Brooks JD, Sonn GA, Proceedings of the National Academy of Sciences of the United States of America 114 (2017) 3334. [DOI] [PMC free article] [PubMed] [Google Scholar]
- [42].Spicer R, Salek RM, Moreno P, Canueto D, Steinbeck C, Metabolomics 13 (2017) 106. [DOI] [PMC free article] [PubMed] [Google Scholar]
- [43].Smith CA, Want EJ, O’Maille G, Abagyan R, Siuzdak G, Analytical Chemistry 78 (2006) 779. [DOI] [PubMed] [Google Scholar]
- [44].Pluskal T, Castillo S, Villar-Briones A, Oresic M, BMC Bioinformatics 11 (2010) 395. [DOI] [PMC free article] [PubMed] [Google Scholar]
- [45].Eliasson M, Rannar S, Madsen R, Donten MA, Marsden-Edwards E, Moritz T, Shockcor JP, Johansson E, Trygg J, Anal Chem 84 (2012) 6869. [DOI] [PubMed] [Google Scholar]
- [46].DeFelice BC, Mehta SS, Samra S, Cajka T, Wancewicz B, Fahrmann JF, Fiehn O, Analytical Chemistry 89 (2017) 3250. [DOI] [PMC free article] [PubMed] [Google Scholar]
- [47].Mizuno H, Ueda K, Kobayashi Y, Tsuyama N, Todoroki K, Min JZ, Toyo’oka T, Biomedical Chromatography 31 (2017) e3864. [DOI] [PubMed] [Google Scholar]
- [48].Broadhurst D, Goodacre R, Reinke SN, Kuligowski J, Wilson ID, Lewis MR, Dunn WB, Metabolomics 14 (2018) 72. [DOI] [PMC free article] [PubMed] [Google Scholar]
- [49].Dunn WB, Broadhurst D, Begley P, Zelena E, Francis-McIntyre S, Anderson N, Brown M, Knowles JD, Halsall A, Haselden JN, Nicholls AW, Wilson ID, Kell DB, Goodacre R, C HSMH, Nature Protocols 6 (2011) 1060. [DOI] [PubMed] [Google Scholar]
- [50].Yong-Huan Yun H-DL, Bai-Chuan Deng, Dong-Sheng Cao, Trends in Analytical Chemistry 113 (2019) 102. [Google Scholar]
- [51].Vinaixa M, Samino S, Saez I, Duran J, Guinovart JJ, Yanes O, Metabolites 2 (2012) 775. [DOI] [PMC free article] [PubMed] [Google Scholar]
- [52].Zhang Z, Rev Obstet Gynecol 5 (2012) 35. [PMC free article] [PubMed] [Google Scholar]
- [53].Kind T, Tsugawa H, Cajka T, Ma Y, Lai Z, Mehta SS, Wohlgemuth G, Barupal DK, Showalter MR, Arita M, Fiehn O, Mass Spectrom Rev 37 (2018) 513. [DOI] [PMC free article] [PubMed] [Google Scholar]
- [54].Lai ZJ, Tsugawa H, Wohlgemuth G, Mehta S, Mueller M, Zheng YX, Ogiwara A, Meissen J, Showalter M, Takeuchi K, Kind T, Beal P, Arita M, Fiehn O, Nature Methods 15 (2018) 53. [DOI] [PMC free article] [PubMed] [Google Scholar]
- [55].Zhou Z, Tu J, Zhu ZJ, Curr Opin Chem Biol 42 (2018) 34. [DOI] [PubMed] [Google Scholar]
- [56].Zheng X, Aly NA, Zhou Y, Dupuis KT, Bilbao A, Paurus VL, Orton DJ, Wilson R, Payne SH, Smith RD, Baker ES, Chem Sci 8 (2017) 7724. [DOI] [PMC free article] [PubMed] [Google Scholar]
- [57].Chong J, Soufan O, Li C, Caraus I, Li S, Bourque G, Wishart DS, Xia J, Nucleic Acids Res (2018) W486. [DOI] [PMC free article] [PubMed] [Google Scholar]
- [58].Kanehisa M, Goto S, Nucleic Acids Res 28 (2000) 27. [DOI] [PMC free article] [PubMed] [Google Scholar]
- [59].Slenter DN, Kutmon M, Hanspers K, Riutta A, Windsor J, Nunes N, Melius J, Cirillo E, Coort SL, Digles D, Ehrhart F, Giesbertz P, Kalafati M, Martens M, Miller R, Nishida K, Rieswijk L, Waagmeester A, Eijssen LMT, Evelo CT, Pico AR, Willighagen EL, Nucleic Acids Res 46 (2018) D661. [DOI] [PMC free article] [PubMed] [Google Scholar]
- [60].Forsberg EM, Huan T, Rinehart D, Benton HP, Warth B, Hilmers B, Siuzdak G, Nat Protoc 13 (2018) 633. [DOI] [PMC free article] [PubMed] [Google Scholar]