Abstract
Cancer genomics has illuminated a wide spectrum of genes and core molecular processes contributing to human malignancy. Still, the genetic and molecular basis of many cancers remains only partially explained. Genetic predisposition accounts for 5-10% of cancer diagnoses1,2 and genetic events cooperating with known somatic driver events are poorly understood. Analyzing established cancer predisposition genes in medulloblastoma (MB), a malignant childhood brain tumor, we recently identified pathogenic germline variants that account for 5% of all MB patients3. Here, by extending our previous analysis to include all protein-coding genes, we discovered and replicated rare germline loss-of-function (LoF) variants across Elongator Complex Protein 1 (ELP1) on 9q31.3 in 15% of pediatric MBSHH cases, thus implicating ELP1 as the most common MB predisposition gene and increasing genetic predisposition to 40% for pediatric MBSHH. Inheritance was verified based on parent-offspring and pedigree analysis, which identified two families with a history of pediatric MB. ELP1-associated MBs were restricted to the molecular SHHα subtype4 and were characterized by universal biallelic inactivation of ELP1 due to somatic loss of chromosome 9q. The majority of ELP1-associated MBs exhibited co-occurring somatic PTCH1 (9q22.32) alterations, suggesting that ELP1-deficiency predisposes to tumor development in combination with constitutive activation of SHH signaling. ELP1 is an essential subunit of the evolutionary conserved Elongator complex, whose primary function is to enable efficient translational elongation through tRNA modifications at the wobble (U34) position5,6. Biochemical, transcriptional, and proteomic analyses revealed that ELP1-associated MBSHH are characterized by a destabilized core Elongator complex, loss of Elongator-dependent tRNA wobble modifications, codon-dependent translational reprogramming, and induction of the unfolded protein response (UPR), consistent with deregulation of protein homeostasis due to Elongator-deficiency in model systems7–9. Our findings suggest that genetic predisposition to proteome instability is a previously underappreciated determinant in the pathogenesis of pediatric brain cancer. These results provide a strong rationale for further investigating the role of protein homeostasis in other cancer types and potential opportunities for novel therapeutic interference.
To investigate genetic predisposition to MB beyond established cancer predisposition genes10, we investigated germline LoF variation across all autosomal protein-coding genes in a cohort of 712 pediatric MB cases with available molecular MB subgroup information (56 MBWNT, 171 MBSHH, 195 MBGroup3, 291 MBGroup4), 288 cancer-free children from the CEFALO study11, and 118,479 cancer-free adults from the gnomAD project12 (Methods, Supplementary Table 1). Case-control burden analysis revealed significant associations between known cancer predisposition genes and pediatric MBSHH (Fig. 1a, Extended Data Fig. 1), which is consistent with our prior findings3. We also identified a significant association between pediatric MBSHH and germline LoF variants in ELP1 (also known as IKBKAP) based on comparison against pediatric (P=6e-7) (Fig. 1a) and adult control cohorts (P=3e-29) (Extended Data Fig. 1f). Germline ELP1 LoF variants in MBSHH patients were heterozygous, distributed across the full gene sequence, and very rare in the general population (Fig. 1b, Supplementary Table 2). In our discovery cohort, germline ELP1 variants accounted for 13% (22/171) of MBSHH cases and 0.18% (1/542) of MBWNT, MBGroup3, and MBGroup4 cases (Fig. 1c). The latter frequency is consistent with the burden of germline ELP1 LoF variants in a cancer-free adult cohort (0.10%, 114/118479) and thus further suggests that ELP1 is a MBSHH-specific predisposition gene. Further analysis of two large series1,13 of pediatric (n=514) and adult (n=2,255) cancer cohorts further confirmed that germline ELP1 LoF variants are strongly associated with MBSHH (Fig. 1f). Moreover, we replicated the association between germline ELP1 LoF variation and pediatric MBSHH based on 31 patients from two prospective patient series (Fig. 1d). Overall, germline ELP1 LoF variants accounted for 14.4% (29/202) of all pediatric MBSHH patients, considerably exceeding the burden of pathogenic germline variants in known MBSHH predisposition genes (Fig. 1e). The median age at diagnosis for germline ELP1 LoF variant carriers was 6.3 years (IQR 4.2-8.7), which is significantly older than MBSHH patients with germline SUFU and PTCH1 LoF variants, respectively, yet slightly younger than MBSHH patients with germline TP53 mutations (Fig. 1g). Notably, germline ELP1 LoF variants were absent among 51 adult MBSHH patients1 (>20 years), which further confirms the distinct association with pediatric MBSHH (Fig. 1f). Inheritance of pathogenic germline ELP1 variation was confirmed in three parent-offspring trios based on whole-exome sequencing (Supplementary Table 3) and an assessment for family history of cancer was pursued for two patients (Fig. 2). The first family revealed a remarkable familial history of cancer on the affected paternal side with MB in the father and the paternal aunt, as well as, unspecified brain cancers in more distant paternal relatives (Fig. 2a). Notably, this MB index patient exhibited also congenital radioulnar synostosis in both arms (Extended Data Fig. 2). In the second family, a distant cousin with MB was identified on the affected maternal side (Fig. 2b). Together, these data provide strong evidence that ELP1 is a novel brain tumor predisposition gene and specifically associated with pediatric MBSHH.
Figure 1. ELP1-associated medulloblastoma.
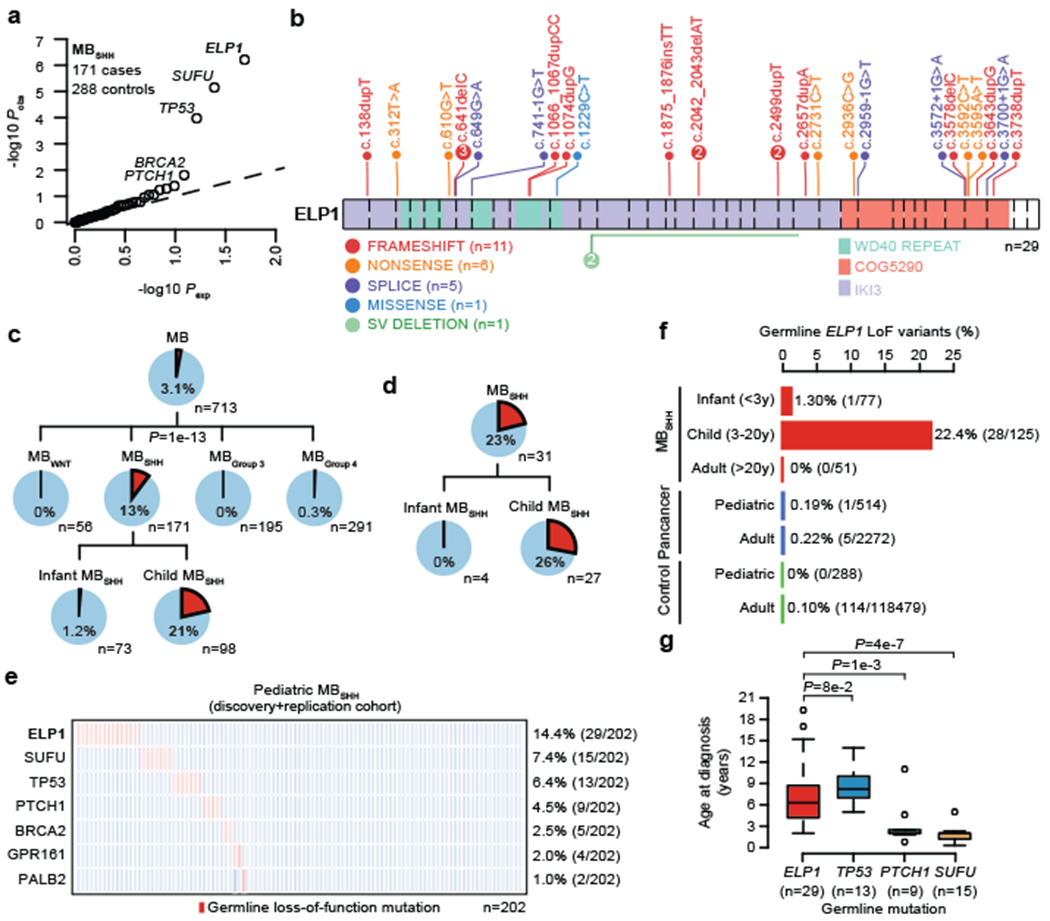
a. QQ plot for LoF burden testing based on 171 pediatric MBSHH cases and 288 pediatric controls. P values were adjusted for multiple testing based on Bonferroni correction.
b. Germline ELP1 mutation profile in MBSHH patients.
c. Frequency of germline ELP1 LoF variants in the MB discovery cohort.
d. Frequency of germline ELP1 LoF variants in a prospective pediatric MBSHH cohort.
e. Frequency of known and recurrent genetic disorders in pediatric MBSHH.
f. Frequency of germline ELP1 LoF variants in MBSHH, pediatric/adult pan-cancer, and control cohorts.
g. Age at diagnosis for MBSHH patients stratified by known genetic disorders. P values were calculated using a two-sided Mann–Whitney U-test. Boxes show median, first and third quartile, and whiskers extend to 1.5× the interquartile range.
Figure 2. Familial transmission of ELP1-associated medulloblastoma.
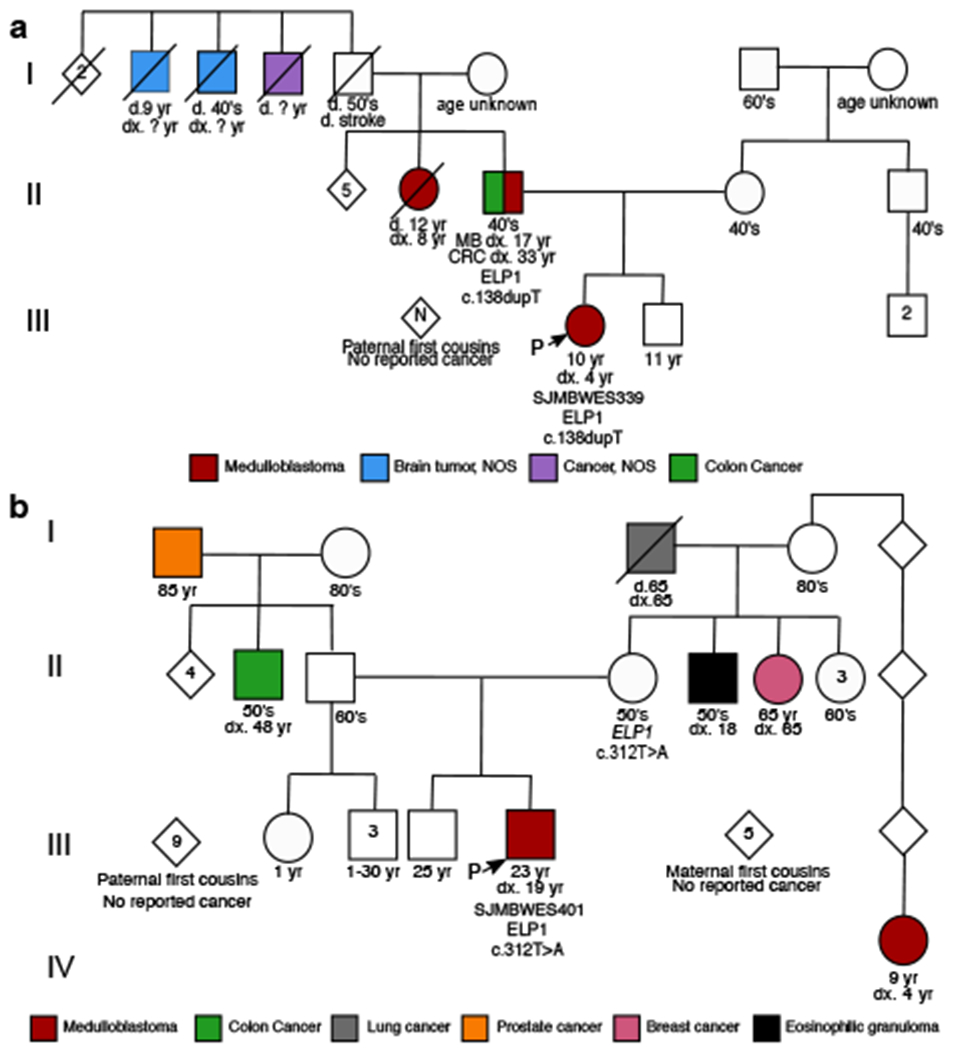
Pedigrees and family history for two ELP1-associated MBSHH patients. Circles, females; squares, males; diamond, sex unspecified; slash, deceased. Index patients are marked with an arrow.
a. SJMBWES339.
b. SJMBWES401.
Analysis of patient-matched MB genomes and exomes revealed loss of heterozygosity (LOH) affecting the ELP1 wild-type allele in all ELP1-associated MBSHH (nLOH=29, nROH=0, P=3.7e-9) (Fig. 3a). Somatic copy-number analysis demonstrated that all ELP1-associated MBSHH showed loss of chromosome 9q as the hallmark somatic event underlying inactivation of the ELP1 wildtype allele. The molecular landscape of MBSHH has been recently informed via larger and more comprehensive genomic studies14,15. Consequently, molecularly, demographically, and clinically distinct MBSHH subtypes have been defined4,14,16,17. Since germline ELP1 LoF variant carriers tended to develop MBSHH as older children in our cohort, we investigated whether ELP1-associated MBSHH might belong to a specific molecular MBSHH subtype. Classification of our MBSHH cohort (n=238) into published DNA methylation subtypes (SHHα, β, γ, and δ)4 (Extended Data Fig. 3a) and overlaying germline ELP1 mutation status revealed that >95% (27/28) of the ELP1-associated MBSHH belonged to the SHHα subtype (Fig. 3b). This subtype has been previously reported to be associated with TP53 mutations and an inferior clinical outcome4. We observed that germline ELP1 mutations defined a genetic subtype within SHHα (31%, 27/86) and were mutually exclusive with germline and somatic TP53 mutations (Fig. 3c,d, Extended Data Fig. 3c). In contrast, ELP1-associated MBSHH were significantly enriched for somatic PTCEU alterations and depleted for MYCN and GLI2 amplifications (Fig. 3c,d, Extended Data Fig. 3c). Of note, a significant subset of ELP1-associated MBSHH contained somatic alterations that converged on the p53 pathway and included PPM1D (31%, 9/29) andMDM4 (10%, 3/29) amplifications, respectively. Somatic PTCE[1 (9q22.32) alterations were found in 81% (22/27) of ELP1-associated SHHα and were universally present on the retained chromosome arm 9q that harbors the germline ELP1 LoF variant, ELP1-associated MBSHH further exhibited recurrent loss and gain of chromosome 9q and 9p, respectively, a pattern consistent with isochromosome 9p (i9p) formation during MB development (Fig. 3c,e, Extended Data Fig. 3c,d,e). Overall, the patterns of somatic mutational events suggest that ELP1-associated MBSHH commonly undergo three consecutive mutational steps during tumor development: (i) monoallelic germline ELP1 LoF mutation; (ii) somatic biallelic inactivation of ELP1 with concurrent monoallelic inactivation of PTCH1 via loss of chromosome arm 9q; and (iii) biallelic inactivation of the remaining PTCH1 allele via a somatic mutation or focal deletion (Fig. 3f). Bayesian network modelling supported that this three-step model (out of seven possible models) is the most likely explanation for the underlying chain of somatic events during cancer evolution (posterior probability=0.86, n=230, Extended Data Fig. 4). Finally, we assessed clinical characteristics within the molecular SHHα subtype and stratified patients by ELP1 and TP53 mutation status. Patients with germline ELP1 LoF variants were primarily diagnosed with desmoplastic/nodular MB (76%, n=17) and demonstrated a favourable clinical outcome (5-year overall survival 92%, P=1,3c-6) (Fig. 3g,h).
Figure 3. Somatic mutation landscape of ELP1-associated medulloblastoma.
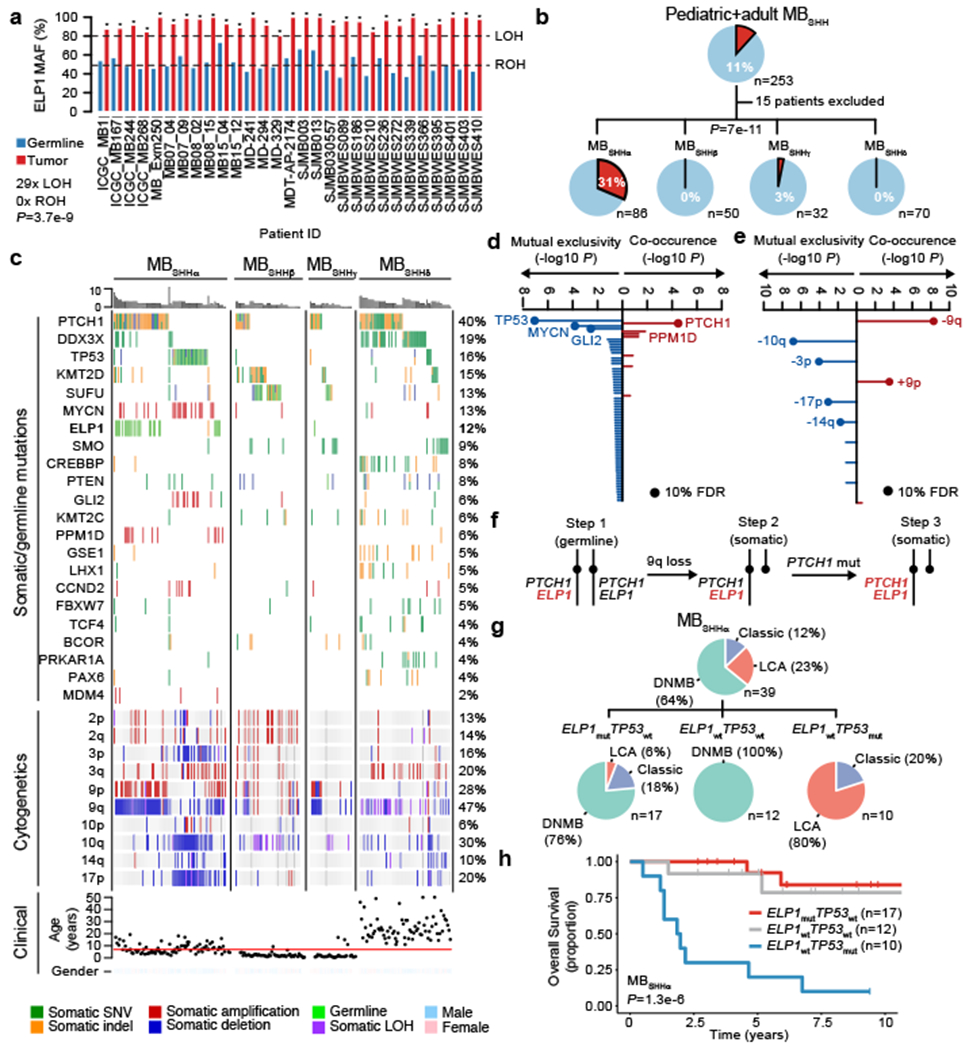
a. Loss-of-heterozygosity (LOH) at the ELP1 locus for patients with germline ELP1 LoF variants (n=29 germline and n=29 MB samples). P values for LOH in MBs were calculated using a two-sided binomial test; *P<0.05. P value for the proportion of ELP1 LOH events was calculated using a two-sided binomial test.
b. Germline ELP1 mutation status stratified by molecular MBSHH subtypes.
c. Somatic mutation landscape of MBSHH subtypes.
d. Association between germline ELP1 LoF variants and somatic gene alterations (n=238 MBSHH). P values were calculated using Bayesian logistic regression analysis, likelihood ratio tests, and adjusted for multiple testing based on FDR correction.
e. Association between germline ELP1 LoF variants and somatic chromosomal alterations (n=238 MBSHH). P values were calculated using Bayesian logistic regression analysis, likelihood ratio tests, and adjusted for multiple testing based on FDR correction. Proposed three-step model of somatic evolution in ELP1-associated MBSHH.
f. Histological classification within molecular SHHα subtypes.
g. Overall survival within molecular SHHα subtypes based on Kaplan-Meier estimator and log-rank test.
ELP1 is a highly conserved scaffolding component of a six-subunit protein complex (ELP1-6) known as the Elongator complex18,19. Although pleiotropic functions have been reported, recent studies indicate that the primary function of Elongator is to chemically modify uridines in the wobble base position (U34) of tRNAs with 5-carboxymethyl derivatives (xcm5) required for efficient translational elongation5,6. Familial Dysautonomia (FD), a rare autosomal-recessive genetic disorder, affects primarily the autonomic nervous system and is largely exclusive to the Ashkenazi Jewish population. It is caused by a non-canonical ELP1 splice site mutation that disrupts tissue-specific splicing of ELP1 in 99% of FD patients20 and is associated with reduced tRNA modifications at the wobble (U34) position21. Individuals with FD have been proposed to be at an increased risk of developing cancer due to the inherited ELP1-deficiency; yet supporting evidence in the literature remains limited22,23. In our series, all MBSHH patients were wildtype for the previously reported FD-associated germline ELP1 splice site mutation. To assess consequences associated with ELP1 LoF mutations in MBSHH and further substantiate its potential mechanistic role in pediatric MBSHH predisposition, we examined transcriptome-level data generated for 208 MBs in our series. ELP1 mRNA levels were significantly reduced in MBSHH compared with other MB subgroups (LRT P<0.001) and lowest in SHHα amongst MBSHH subtypes (LRT P=0.008; Extended Data Fig. 5a,b). ELP1 expression levels were significantly reduced in ELP1mut (n=10) compared to ELP1wt MBSHH tumors (n=80), consistent with nonsense mediated decay of ELP1mut transcripts, despite confirmation of low ELP1mut allele expression in all queried tumors (n=10/10 ELP1mut MBs, LRT P<0.0011; Extended Data Fig. 5c). Transcriptome comparison of ELP1mut versus ELPP1mut MBSHH identified 976 differentially expressed genes (FDR<10%, Fig. 4a, Extended Data Fig. 5d), including significant up-regulation of gene sets involved in RNA splicing, amino acid activation, and the UPR, suggestive of a potential association between ELP1-deficiency and loss of protein homeostasis (Fig. 4b; Extended Data Fig. 5e). In further support of this, the key UPR sensors and mediators24, ATF6 and XBP1, were significantly up-regulated inELP1-deficient MBSHH (Supplementary Table 4a). Gene sets associated with neurogenesis were significantly down-regulated in ELP1-deficient MBSHH (Fig. 4b).
Figure 4. Molecular features of ELP1-associated medulloblastoma.
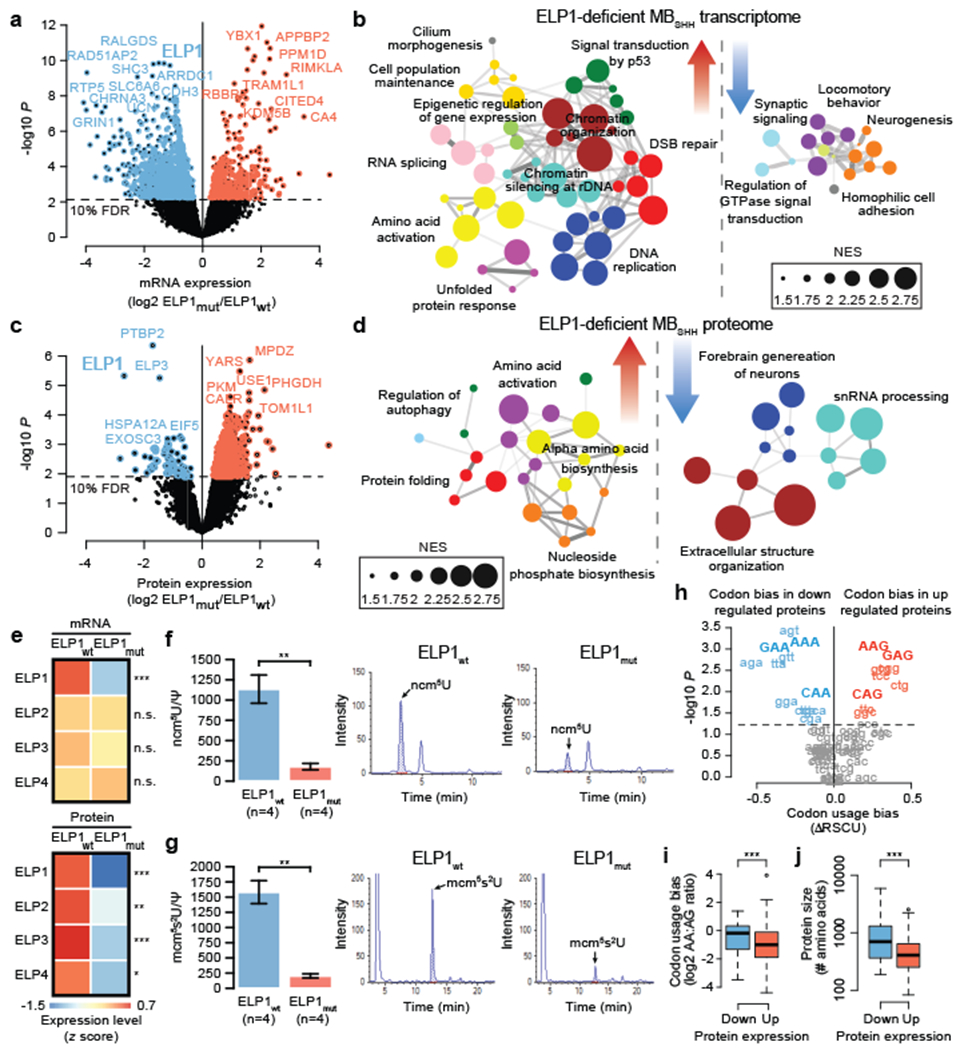
a. Differential gene expression between ELP1mut MBSHH (n=10) and ELP1wt, MBSHH (n=90). P values were derived from models that use negative binomal test statistics and were adjusted for multiple testing based on FDR correction.
b. Functional gene enrichment in ELP1mut MBSHH.
c. Differential protein expression between ELP1mut MBSHH (n=6) and ELP1wt, MBSHH (n=9). P values were derived from linear models that use empirical Bayes statistics and were adjusted for multiple testing based on FDR correction.
d. Functional protein enrichment in ELP1mut MBSHH.
e. Gene expression of Elongator subunits in ELP1mut MBSHH (n=10) and ELP1mut MBSHH (n=80) and protein expression of Elongator subunits in ELP1mut MBSHH (n=6) and ELP1mut MBSHH (n=9). P values were derived from models that use negative binomal test statistics and empirical Bayes statistics. *P<0.05, **P<0.01, ***P<0.001, n.s. P>0.10.
f. Quantification of ncm5U nucleosides in ELP1mut MBSHH (n=4 biologically independent samples) and ELP1wt MBSHH (n=4 biologically independent samples). P values were calculated using two-sided Welch t-tests. Mean values and standard errors are shown. **P<0.01.
g. Quantification of mcm5s2U nucleosides in ELP1mut MBSHH (n=4 biologically independent samples) and ELP1wt MBSHH (n=4 biologically independent samples). P values were calculated using two-sided Welch t-tests. Mean values and standard errors are shown. **P<0.01.
h. Codon usage bias (ARSCU) in ELP1mut MBSHH (n=6) vs ELP1wt MBSHH (n=9). P values were calculated using two-sided Mann–Whitney U-tests and adjusted for multiple testing using FDR correction.
i. Codon usage bias (AA- vs AG-ending codons) in ELP1mut MBSHH (n=6) vs ELP1wt MBSHH (n=9). P value was calculated using a two-sided Mann–Whitney U-test. ***P<0.001. Boxes show median, first and third quartile, and whiskers extend to 1.5× the interquartile range.
j. Protein size distribution in ELP1mut MBSHH (n=6) vs ELP1wt MBSHH (n=9). P values were calculated using a two-sided Mann–Whitney U-test. ***P<0.001. Boxes show median, first and third quartile, and whiskers extend to 1.5× the interquartile range.
To complement these transcriptome results, we analyzed proteome profiles25 for 15 MBSHH included in our series. Differential proteomic analysis of ELP1mut (n=6) versus ELP1wt tumors (n=9) revealed a notable bias towards up-regulated proteins inELP1-mutant MBSHH (342 proteins up vs 64 proteins down) (Fig. 4c, Supplementary Table 4b). Proteins associated with protein folding, amino acid activation, and ATF6-mediated UPR were significantly up-regulated in ELP1mut MBSHH, consistent with our transcriptome analyses (Fig. 4d, Extended Data Fig. 5f). Integrative multi-omic analysis26 of DNA, RNA, and protein alterations further highlighted germlne ELP1 LoF variants as the primary genetic factor linked to translational deregulation in these tumors (Extended Data Fig. 6). ELP1 and ELP3 ranked amongst the most significantly down-regulated proteins in ELP1-mutant tumors, as well as PTBP2, a brain-specific RNA binding protein required for neuronal differentiation (Fig. 4c). Examination of transcriptome and proteome data for the quantified Elongator subunits ELP1-4 revealed concordant down-regulation of ELP1 at both the RNA and protein level, whereas the ELP2, ELP3, and ELP4 subunits were down-regulated solely at the protein-level (Fig. 4e, Extended Data Fig. 5g). These results are consistent with previous reports in model systems whereby loss of one Elongator subunit leads to destabilization of the Elongator complex8,27. The prominent role of the Elongator complex is the modification of wobble uridines (U34) in the anticodon loop of tRNAs. It is required for the formation of 5-carbamoylmethyluridine (ncm5U), 5-methoxycarbonylmethyluridine (mcm5U), and 5-methoxycarbonylmethyl-2-thiouridine (mcm5s2U) at U34 in tRNAs28. Specifically, the mcm5s2U34 modification is required to offset the translational inefficiency of AA-ending codons29 and absence of these modifications leads to protein misfolding and aggregation7–9. We hence assessed whether Elongator-deficiency leads to impaired synthesis of ncm5U, mcm5U, and mcm5U modifications in tRNAs that were extracted from ELP1mut (n=4) and ELP1wt (n=4) MBSHH patient-derived xenografts (PDXs). Remarkably, we found that ELP1-deficiency was associated with a significant reduction of all three Elongator-dependent tRNA modifications (Fig. 4f,g and Extended Data Fig. 7a), whereas Elongator-independent tRNA modifications (m1A and m7G) remained unaffected (Extended Data Fig. 7b,c). Therefore, the function of the Elongator complex as a translational regulator is severely impaired in ELP1-associated MBSHH. Further assessment of differentially expressed proteins in ELP1 vs ELP1wt MBSHH revealed a significant codon usage bias (Fig. 4h,i). Proteins that were down-regulated in ELP1mut MBSHH were enriched in the translational inefficient AA-ending codons for lysine, glutamine, and glutamic acid. In contrast, up-regulated proteins were enriched in the synonymous and translational efficient AG-ending codons for lysine, glutamine, and glutamic acid (Fig. 4h,i). Likewise, and consistent with previous studies in model systems7, the proteome of Elongator-deficient MBSHH was biased towards expression of small proteins (Fig. 4j). Finally, transcriptome analysis of normal human tissues30,31 revealed cerebellum as the primary site of ELP1 expression during brain development and among 54 adult tissues (Extended Data Fig. 8a–c). Moreover, during murine cerebellar development32, Elp1 expression was highest amongst undifferentiated progenitor populations (Extended Data Fig. 8d). Collectively, our findings suggest that germline ELP1 LoF variants in MBSHH lead to destabilization of the core Elongator complex, loss of Elongator-dependent tRNA wobble (U34) modifications, codon-specific translational reprogramming, and activation of UPR pathways.
Prior genomic analyses have implicated transcriptional deregulation and genomic instability as key drivers of malignancy in MB and many other cancers. Recent MB proteomic studies25 have illuminated thematic associations related to mRNA translation and proteasome function driven by somatic factors, especially in MBGroup3 and MBGroup4. The findings presented here suggest that 15% of pediatric MBSHH are driven by translational deregulation due to Elongator deficiency and implicate disruption of protein homeostasis as a previously underappreciated pathogenic mechanism in MBSHH. Our findings further substantiate a high prevalence of genetic predisposition among pediatric MBSHH patients (now up to 40% of pediatric cases3,33) and further advocate for implementation of genetic testing and surveillance programs for affected patients and families. Broadly, we provide strong rationale for expanding genetic studies beyond known cancer predisposition genes and motivate continued investigations into the contribution of translational deregulation in cancer and its potential utility as a target for molecularly guided intervention.
Methods
Study design and participants
This series was based on 795 published and unpublished patients with MB3 and 288 unpublished healthy pediatric controls9 (<20 years of age). Whole-genome and whole-exome sequencing for the entire set of donor samples were available from the International Cancer Genome Consortium (ICGC)15, the Medulloblastoma Advanced Genomics International Consortium (MAGIC)4, the CEFALO series11, a series from France25, and from four prospective clinical studies (SJMB03, SJMB12, SJYC07, and I-HIT-MED). All patient material was collected after receiving written informed consent, in accordance with institutional review board guidelines.
Processing of DNA sequencing data
All NGS data were collected from primary sources to ensure standardization of genomic data processing by uniform computational analysis workflows. Hence, all samples were aligned with the same set of algorithms and the same human reference genome build (GRCh37) utilizing data-processing standards defined by the Pan-Cancer Analysis of Whole Genome (PCAWG) project. Samples provided in genomic alignment format (BAM) were reverted back to unaligned format (FASTQ) before processing. Patient-level quality control was performed to exclude related donors (monozygotic twins, 1st degree, 2nd degree), duplicated donors, and low-quality germline samples. The latter accounted for excess of singletons (>10%) after accouting for continental population and contamination with other germline samples (>5%).
Germline and somatic variant calling
Somatic variant identification was performed on matched tumour/normal pairs using the German Cancer Research Center and European Molecular Biology Laboratory (DKFZ and EMBL) cancer genome analysis pipelines in accordance with ICGC PCAWG (https://dcc.icgc.org/pcawg). Information from dbSNP and the 1000 Genomes Project were used to stringently filter out potential germline contamination. Germline variant discovery was pursued using freebayes (v1.1.0) as described before3 in both single-sample and paired germline/tumor calling modes. Quality scores, strand bias, and read position biases were used to filter out potential artifacts from raw variant predictions. Germline variants were normalized for consistent representation across samples using vt normalize34 and functionally annotated using VEP35. Loss-of-function germline variants from single-sample calling mode were re-genotyped across all germline samples based on freebayes and further filtered for potential artifacts using population filters (eg, deviation from Hardy-Weinberg equilibrium and high rates of missing genotypes). Germline CNVs were predicted using DELLY236 with default settings for whole genomes and using a population-based read-depth CNV caller for whole exomes3.
Case-control burden analysis
Case-control association testing was performed with burden tests37 and allelic association tests3. Burden tests using germline LoF variants (nonsense, frameshift, splice site, known pathogenic missense) were performed using SKAT (R package, v. 1.3.2.1; r.corr= 1) in R and adjusted for principal components (n=3) to account for population structure in cases and controls. The latter structure was estimated via principal component analysis in PLINK (v1.9) and 10,000 common (MAF>5%), synonymous, and independent (r2<0.2) SNPs. Allelic association tests were performed in R using two-sided Fisher’s exact tests. The total number of rare damaging (a) and wild-type (A) alleles were counted for each gene in cases and controls, recorded in a 2x2 contingency table, and evaluated for statistical independence of rows (case and control) and columns (allele a and allele A). We assumed equal effect sizes for all germline LoF variants and across all positions along a gene. Germline variants that were annotated in ClinVar (releases benign or likely benign, variants that are common in any human population (MAF>0.001), germline variants outside of exome-capture target regions, germline variants that failed quality control in gnomAD (v2.1.1), and variants that were located in low mappability, low complexity, and known artifact regions38 were excluded from allelic association analysis. Only autosomal and protein-coding genes with at least five germline LoF variants in cases and controls were considered for burden tests and allelic association tests. Burden tests were performed using the pediatric CEFALO control cohort and allelic association tests using the adult non-cancer gnomAD control cohort (v2.1.1; exomes-only).
Somatic-germline association analysis
Association between genetic variation and somatic mutational events was performed using Bayesian logistic regression analysis (arm R package, v. 1.1.0) and likelihood ratio tests (lmtest R package, v0.9). Statistical models accounted for the following potential confounders: genetic sex (male, female), age (infant, child, adult), and molecular MBSHH subtype (SHHα, SHHβ, SHHγ, and SHHδ). P values were adjusted for multiple testing using the Benjamini-Hochberg implementation in R (function p.adjust). Bayesian network analysis was performed to infer causal relationships between genetic variation and somatic mutational events (bnlearn R package, v4.4.1). Network scores were calculated using the bnlearn score function (BIC score) and posterior probabilities39 were calculated for seven possible causal models40 and uniform priors.
Collection and processing of DNA methylation data
All patient samples were analyzed using either Illumina Infinimn Methylation EPIC or HumanMethylation450 BeadChip arrays in accordance with manufacturer’s instructions. Data was generated from both freshly frozen and fonnalin-fixed paraffin-embedded (FFPE) tissue samples. MB subgroup predictions were obtained from a DNA methylation-based classification web-platfonn for central nervous system tumors (www.moleculameuropathology.org, version 11b4)41. CNV analysis from methylation array data was performed with the conumee Bioconductor R package. Resulting SHH subgroup assigmnents were farther subclassified into subtypes using a bootstrapping A-nearest neighbor classifier (using 1,000 bootstraps). The training dataset was composed of Illumina Infinimn HumanMethylation450 BeadChip array data downloaded for 223 MBSHH samples previously subgroup and subtype classified4. For the classification we restricted the datasets to the 500 most important probes based on ExtraTreesClassifier importance scores predicted fonn the training cohort. The resulting assigmnents of samples to the molecular SHHα, SHHβ, SHHγ, and SHHδ subtypes was used for all downstream analyses.
Proteomics and Mass Spectrometry Analysis
Sample preparation
Primary medulloblastoma samples were lysed in 8M urea before reduction and alkylation. After trypsin/LysC digestion at 37°C overnight, peptides were desalted using C18 columns. For building a comprehensive spectral library, peptide pre-fractionation was carried out for a mix of eight primary MB samples (two of each consensus MB subgroup). The peptide mix of this reference was resolved on a XBridge BEH130 C18 4.6x250mm Column (Waters, #186003581) into 96 fractions and concatenated into 24 final fractions. Peptide samples from isogenic uveal melanoma cells Mel202 and Human hepatocellular carcinoma cells HepG2 were also added to complete the spectral library. This 8M urea cell lysate were diluted with 25 mM NH4HC03 to a concentration of 1 M urea and reduced by incubating with 5 mM dithiothreitol (DTT) at 57°C for one horn before alkylation with 9 mM iodoacetamide for 30 min at room temperature in the dark. Trypsin/LysC (Promega) was added at 1:100 (wt:wt) enzyme:substrate. Digestion was proceeded overnight at 37 °C. Samples were then loaded onto a homemade C18 StageTips for desalting. Peptides were eluted from beads by incubation with 40/60 MeCN/H20 + 0.1% fonnic acid. The peptides were dried in a Speedvac and reconstituted in 2/98 MeCN/H20 + 0.3% trifluoroacetic acid (TFA) prior to liquid chromatography-tandem mass spectrometry (LC-MS/MS) analysis.
DDA analysis and database search
For generation of spectral library, DDA analysis was performed on an Q Exactive HF-X mass spectrometer equipped with a Nanospay Flex ion source (Thermo Scientific) coupled online to anRSLCnano system (Ultimate 3000, Thermo Scientific). Peptides were first trapped on a C18 column (75-μm inner diameter × 2 cm; nano Viper Acclaim PepMap™ 100, Thermo Scientific), with buffer A (2/98 McCN/H2O + 0.1% fonnic acid) at a flow rate of 2.5 ul/min over 4 min. Separation was then perfonned on a C18 column (75-μm inner diameter × 50 cm; nano Viper C18, 2 μm, 100 Å, Acclaim PepMap™ RSLC, Thenno Scientific) regulated to a temperature of 50 °C with a linear gradient of 2% to 35% buffer B (100% MeCN and 0.1% fonnic acid) at a flow rate of 300 nl/min over 211 min. The mass spectrometer was operated in data dependent TOP20 mode. MS full scans were perfonned in the ultrahigh-field Orbitrap mass analyzer at range m/z 375-1500 with a resolution of 120 000 at m/z 200, maximum injection time (MIT) at 50 ms and automatic gain control (AGC) at 3 × 10⁶. MS/MS scan was perfonned at a resolution of 15 000 with an isolation window of 1.6 Da, intensity threshold kept at 3.2 × 10⁵ and higher energy collisional dissociation (HCD) fragmentation with nonnalized collision energy (NCE) of 27. For each scan, selected ions with charge state from 2+ to 6+, AGC was set at 1 × 10⁵, the MIT was 25 ms and the dynamic exclusion of 40s. The raw data were searched against the UniProt human canonical database (20211 entries, downloaded on June 21, 2016), appended with the concatenated iRT peptide sequences, using Mascot (Matrix Science, v2.5.0) and XTandem! included in the Trans-Proteomic Pipeline software (TPP v4.8.0)42. Enzyme specificity was set to trypsin and a maximum of two missed cleavage sites were allowed. Oxidized methionine, N-tenuinal acetylation, and carbamidomethyl cysteine were set as variable modifications. Maximum allowed mass deviation was set to 10 ppm for monoisotopic precursor ions and 0.02 Da for MS/MS peaks.
Spectral library generation
Spectral library from DDA analysis was generated with TPP included in myProMS (v3.6.0)43. The consensus library used for DIA analysis was built by SpectraST, with the following filter criteria applied: 3 to 6 fragments per peptide and fragment m/z range of 350-2,000 m/z. The combined library contained 465287 precursors (397333 peptides) from 29334 unique proteins.
DIA sample acquisition and analysis
DIA analysis was performed with the same mass spectrometer and LC system as DDA. The same analytical column, flow rate, buffers and gradient were used. DIA method was set as follow: a full scan from m/z 375–1500 at a resolution of 120 000 at m/z 200; MIT: 100 ms; AGC: 3 × 10⁶; 40 DIA scan of 15 Da isolation window with resolution 30 000; NCE: 27%; AGC target: 5e5 and MIT: auto. The DIA .raw files were converted in mzXML using MSConvert. Using mProMS. the resulting DIA mzXML files were treated by OpenSWATH44 with default settings (v2.2.0). The data was processed as described in Shao et al.45, except from the following TRIC parameters: “method: best_overall, realign method: dIRT, dscore cutoff: 1, target fdr: 0.01”. For quantification purposes, eight MB samples acquired independently and representing the four main MB subgroups were used as a reference to generate tumor-to-reference ratios. The label free quantification was performed by MSstat in myProMS46. Proteotypic peptides were used, with missed cleavages and carbamidomethyl cysteine allowed. A median-based normalization was applied on the total signal to correct XICs between each tumor and the reference. Proteins with at least three measured peptide ratios and with no more than 25% missing values across the cohort were considered. Differential protein abundance analysis was performed using limma (R package, v3.32.10), fitting linear models (lmFit function), and computing moderated t-statistics with empirical Bayes statistics (eBayes function). P values were adjusted for multiple testing using qvalue (R package, v2.12). Enrichment scores for Reactome UPR pathways and the Elongator protein complex (ELP1-6) were calculated for samples based on gene set enrichment analysis (fgsea v 1.2.1 R package). The relative synonymous codon usage (RSCU) index for all protein-coding genes was calculated using the uco function in seqinr (R package, v3.4). Differences in codon usage bias between two gene sets were calculated using Mann-Whitney U tests (wilcox.test function in R). The strength of codon usage bias (ARSCU) was calculated as median difference in RSCU values between two gene sets. The ARSCU value is in the absence of any codon usage bias between two gene sets zero. The log2 AA:AG codon usage ratio was calculated by dividing the proportion of AA-ending to AG-ending codons. A pseudocount of one was added to AA and AG codon counts to avoid infinite values.
RNA sequencing analysis and variant calling
Paired-end strand-specific RNA-sequencing data was aligned to the human genome (GRCh38) with gene annotations from Ensemb1 (v93) using STAR (v2.6.1a)47,48. Genes were filtered by requiring at least 10 read counts in 75% of the samples and then processed using DESeq2 (R package, vl.22.2) for differential expression analysis, adding sequencing cohort as a model covariate49. Gene set enrichment analysis (GSEA) was done using FGSEA (R package, vl.8.0) based on the biological processes gene ontology (GO) definitions from MSigDB50,51. To visualize GSEA results, GO terms were filtered for significance (adjusted p-value<0.01; |Normalized Enrichment Score|>1.5) and used to create a symmetric GO adjacency matrix based on the Jaccard distance between GO terms respective gene lists. GO clusters were then identified using dynamicTreeCut (R package, vl.63) and the GO network was then visualized in Cytoscope (v3.6.1)52. Multi-Omics Factor Analysis (MOFA) was performed as described26 based on a subset of the series with matched RNA-seq and proteomic measurements. Analysis Inputs included the top 6,000 most variable genes and proteins, in addition to a binary matrix of gene mutations based on both somatic and germline events which occurred in at least 2 samples. GSEA of genes or proteins ranked by latent factor scores was performed as previously described. Variants were identified in the RNA-seq data using the Genome Analysis Toolkit (GATK v3.8), following the best practices workflow. ELP1 variants were annotated for pathogenicity using ANNOVAR (v2017Jul16) and filtered for exonic variants with ExAC allele frequency (AF<0.001)53–55.
ELP1 tissue specificity
We examined the tissue specificity and temporal dynamics of ELP1 expression using previous expression-based datasets from the following studies: BrainSpan31, GTEx30, Evo-Devo56 and the mouse cerebellar atlas32. GTEx tissues were first sorted in descending order of ELP1 expression and then visualized using the interactive GTEx portal, showing the top 17 (out of 54) ELP1-expressing tissue types. BrainSpan samples were first grouped by tissue type and then developmental period, groups were then filtered to have at least three samples and ELP1 expression was plotted as boxplots. Evo-devo samples were sorted by developmental time and then grouped by organ type and ELP1 expression was then subsequently fit with a locally weighted scatterplot smoothing function with an 80% confidence interval shown as a semi-transparent boundary of the trend line. The mouse cerebellar atlas contains single-cell RNA sequencing data from the developing mouse cerebellum spanning 13 distinct developmental timepoints, which was utilized to query ELP1 expression during murine development. ELP1 presence was represented as a dotplot showing normalized expression of each cerebellar cell type across developmental timepoints. Size of the dot depicts the proportion of cells present per timepoint for each cell type.
tRNA modification analyses
All experiments were conducted in accordance with the National Institute of Health’s Guide for the Care and Use of Laboratory Animals and are encompassed in a St. Jude IACUC-approved, ongoing animal protocol #589-100536-04/18. St. Jude is registered as a research facility with the USDA and maintains an assurance statement with the Office of Laboratory Animal Welfare of the NIH (Animal Assurance Number: A3077-01). NOD.Cg-Prkdcscid I12rgtmlWjl/SzJ mice (NSG/JAX stock# 005557) were used as hosts for patient-derived xenograft (PDX) studies. Female NSG mice 8+ weeks of age were anesthetized in a surgical suite and cerebellar implanted with dissociated MBSHH PDX cells to amplify tumor material for downstream analyses. Mice were observed daily and euthanized at the onset of signs of sickness including lethargy and neurological abnormalities. Approximately 20 mg of tumor cell lysate obtained from MBSHH PDX models (ELP1mut: RCMB24, Med1712FH; ELP1wt: RCMB18, Med113FH) was homogenized with ceramic beads (Sapphire Bioscience) using TRIzol reagent (Life Technologies) in tissue homogenizer (Bertin Technologies). Total RNA was isolated with water-saturated phenol followed by repetitive chloroform extraction and precipitation by ammonium acetate and ethanol. Total tRNA was isolated from polyacrylamide gel (20 % PAGE (19:1), 8 M urea, Tris-borate-EDTA (TBE) in 8 M urea, TBE buffer) following PAGE electrophoresis. Gel was homogenised and tRNA extracted by using gel-extraction buffer (0.1 M sodium acetate, 0.25 M EDTA) and precipitated by ammonium acetate and ethanol; 10–17 ng of tRNA was recovered for each sample. tRNA purity and quality was confirmed by 8% urea PAGE electrophoresis in 8 M urea, TBE buffer. Hydrolysis of tRNA to ribonucleosides was performed as previously described57. Prominence ultra-high-performance liquid chromatography (HPLC) system (Shimadzu, Australia) was used to perform reversed phase separation of the samples using a Luna Omega 1.6 μm, Polar-C18 100A column (150 mm × 2.1 mm, Phenomenex, Australia) at a temperature of 35 °C. A 10-μl aliquot of the samples in 0.1% formic acid (aq) was injected onto the HPLC column. The mobile phase consisted of solvent A (0.1% formic acid (aq)) and solvent B (acetonitrile/0.1% formic acid). Chromatographic separation was achieved using a gradient elution program of 0% buffer B for 4 min, 0-20% for 21 min, 20-40% for 2 min, 40-80% buffer B for 1 min, followed by washing with 80% buffer for 2 min and returning to 0% for equilibration of the column before the next sample injection. The flow rate was 200 μl/min. The RP-HPLC column was directly connected to the TurboIonSpray source of the mass spectrometer. Selected reaction ion monitoring (SRM) mass spectrometry experiments were performed on a hybrid quadrupole/linear ion trap 4000 QTRAP MS/MS system (SCIEX, California, USA). All analyses were performed using SRM positive ion acquisition mode. Mass spectrometer parameters were optimized for targeted ribonucleosides using multiple injections of 0.1–1 ng of commercially obtained 7-methylguanosine (MetaGene) and purified ncm5U, mcm5U and mcm5s2U nucleosides (a generous gift from Sebastian Glatt, Jagiellonian University, Poland). The obtained retention times were superimposed with the previously published results57. Mass Spectrometer Source conditions used were: Declustering Potential, DP: 60, Curtain Gas: 40, Collision Gas (CAD): Medium, Ion Spray Voltage: 5300, Temperature GS2: 500, Ion Source Gas 1: 70, Ion Source Gas 2: 80. SRM Transitions: Resolution set to Unit, Unit for both Q1 and Q3 respectively; Dwell Time 130 ms was used for data analysis and quantification. An analytical method was developed for the simultaneous analysis of modified ribonucleosides of which six compounds of interest were targeted for quantification (Supplementary Table 5). Pseudouridine (Ψ) served as an internal normalization standard. To confirm the correct retention time, the standard was added to control sample aliquots at 0.01 or 0.1 ng. Analyst 1.6.2 software was used for peak assignment, area calculation and normalization. Corresponding structures and molecular masses were obtained from the Modomics database58.
Survival analysis
MBSHHα subtype patients with available molecular and outcome data were stratified by ELP1 and TP53 mutation status (ELP1mutTP53wt, ELP1wtTP53wt, ELP1wtTP53mut). Survival analysis was based on the Kaplan-Meier estimator and log-rank tests using the R package survival (v2.38).
Pedigree analysis
Three generation pedigrees were collected by a certified genetic counselor and drawn using Inkscape, an open-source vector graphics editor.
Extended Data
Extended Data Figure 1. Case-control germline loss-of-function (LoF) variant burden analysis.
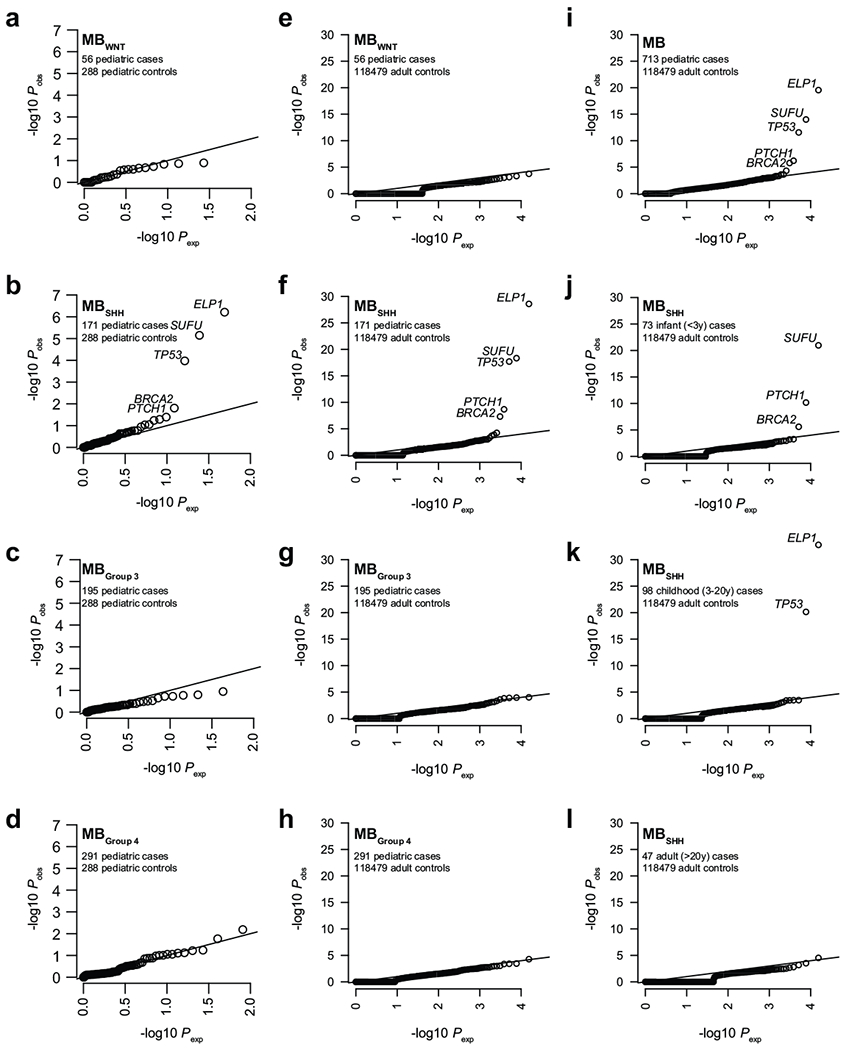
a-d. Case-control germline rare LoF variant association analysis in pediatric MB subgroups vs pediatric controls (CEFALO) using burden tests (implemented in SKAT). P values were corrected for multiple testing using Bonferroni correction.
e-h. Case-control germline rare LoF variant association analysis in pediatric MB subgroups vs adult controls (gnomAD) using burden tests (two-sided Fisher’s Exact tests). P values were corrected for multiple testing using Bonferroni correction.
i. Case-control germline LoF burden analysis in pediatric MB vs adult controls (gnomAD).
j-l. Case-control germline LoF burden analysis in infant (j), childhood (k), and adult (1) MBSHH vs adult controls (gnomAD).
Extended Data Figure 2. Congenital radioulnar synostosis.
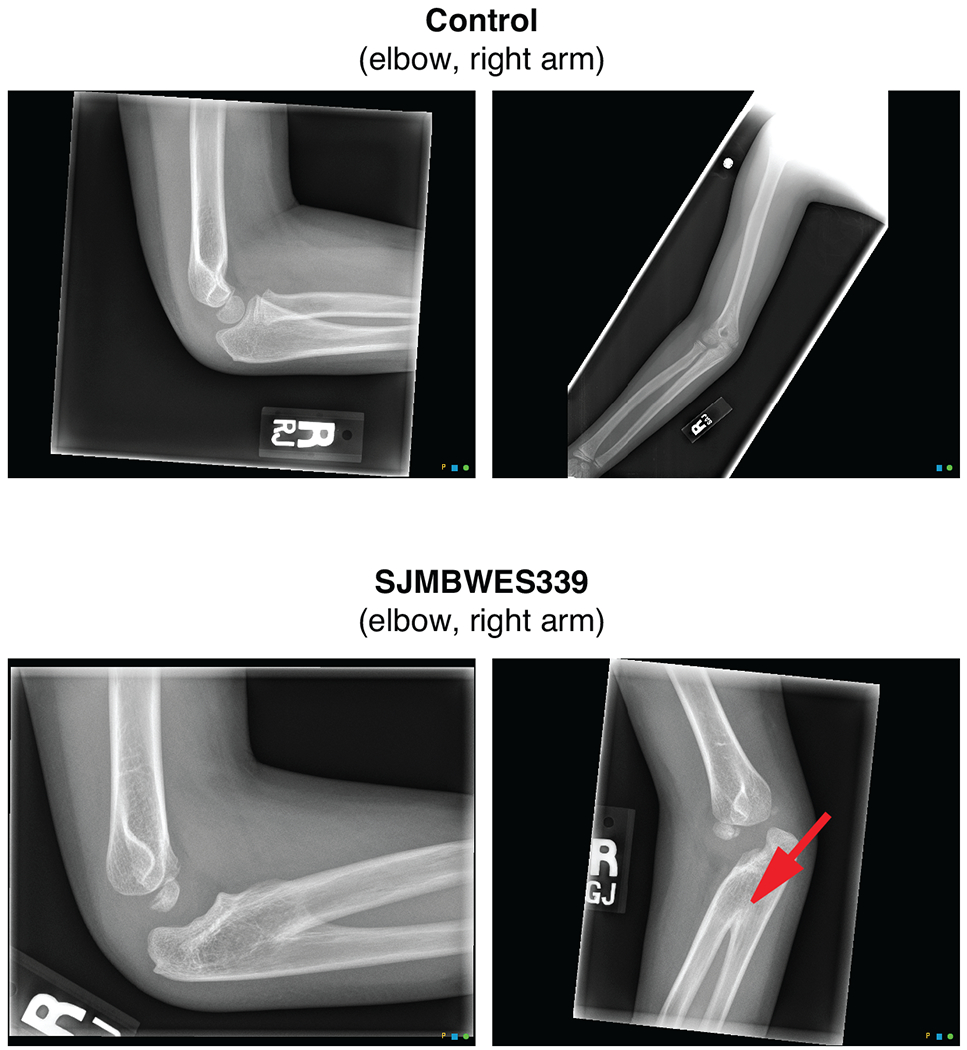
Right arm X-rays of (a) an unaffected child and (b) the ELP1-associated MBSHH patient SJMBWES339.
Extended Data Figure 3. Molecular MBSHH subtypes.
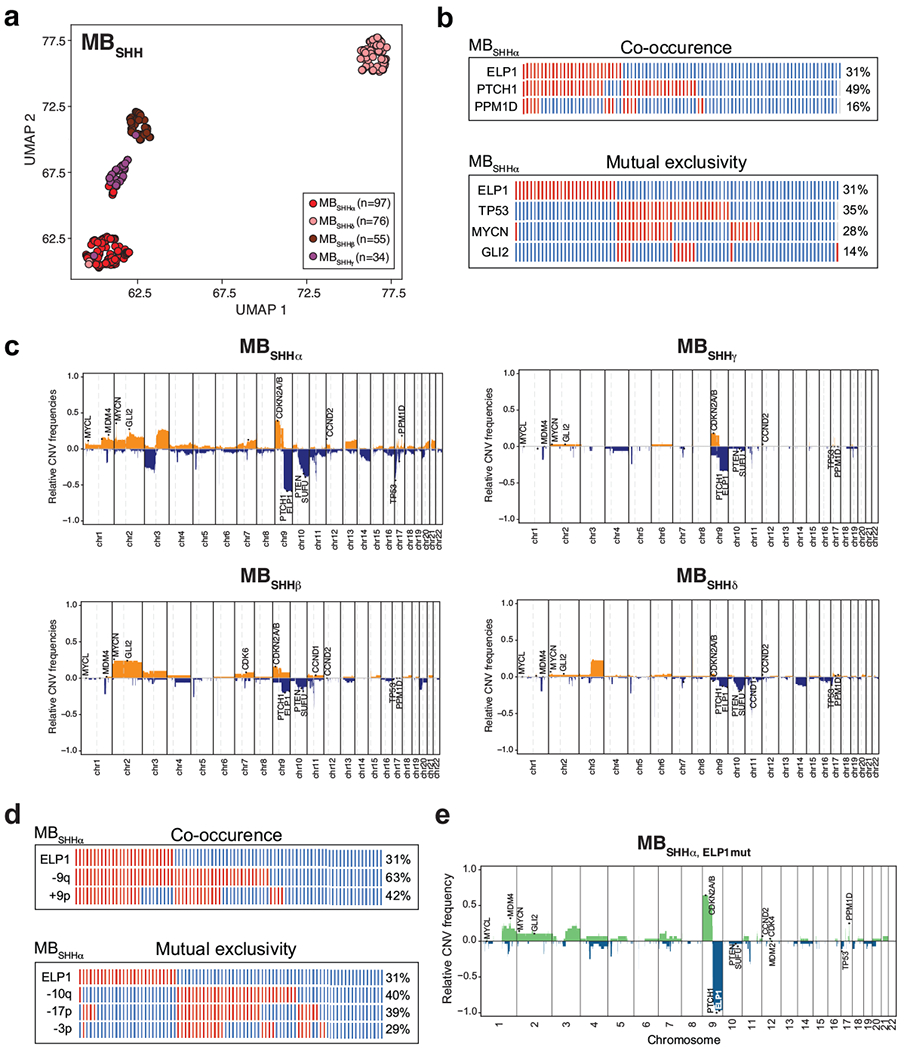
a. DNA methylation-based UMAP plot of MBSHH with inference of MBSHH subtypes (n = 262).
b. Co-occurring and mutually exclusive somatic gene alterations in ELP1-associated medulloblastoma subtype SHHα.
c. Co-occurring and mutually exclusive somatic chromosomal aberrations in ELP1-associated medulloblastoma subtype SHHα.
d. Recurrent somatic copy-number alterations in ELP1-associated medulloblastoma subtype SHHα.
e. Recurrent somatic copy-number alterations in ELP1-associated SHHα.
Extended Data Figure 4. Inference of somatic evolution in ELP1-associated MBSHH.
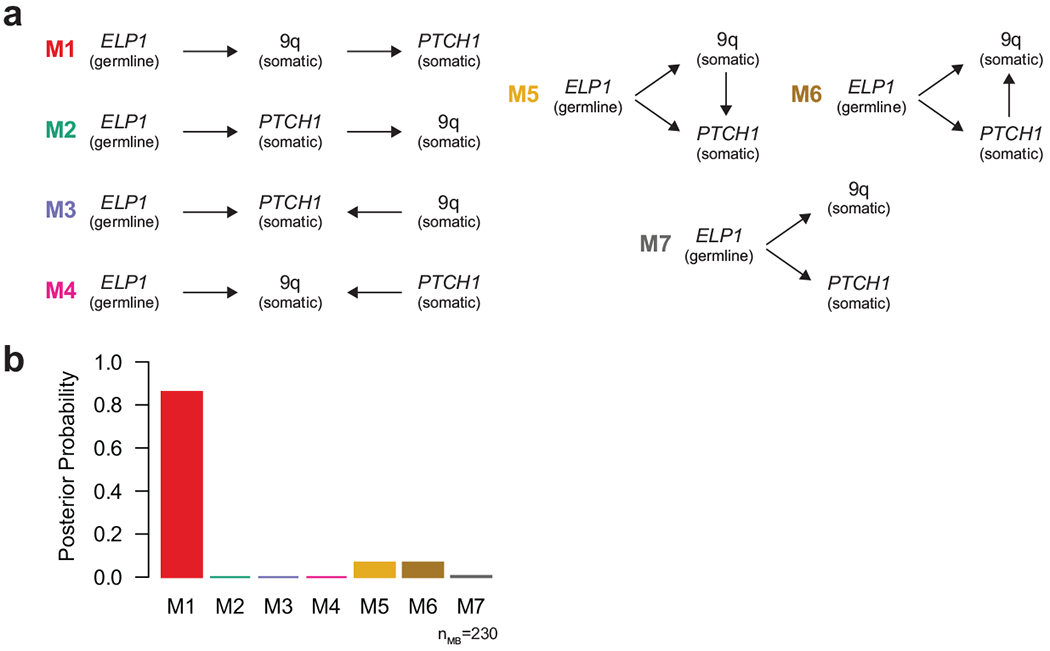
a. Possible genetic models explaining the relationship between germline ELP1 mutation status and two somatic mutational events (PTCH1mut, and loss of chromosome 9q) in MBSHH.
b. Posterior probabilities derived from Bayesian network analysis of all possible genetic models shown in a and data for 230 MBSHH patients.
Extended Data Figure 5. Molecular features of ELP1-associated medulloblastoma.
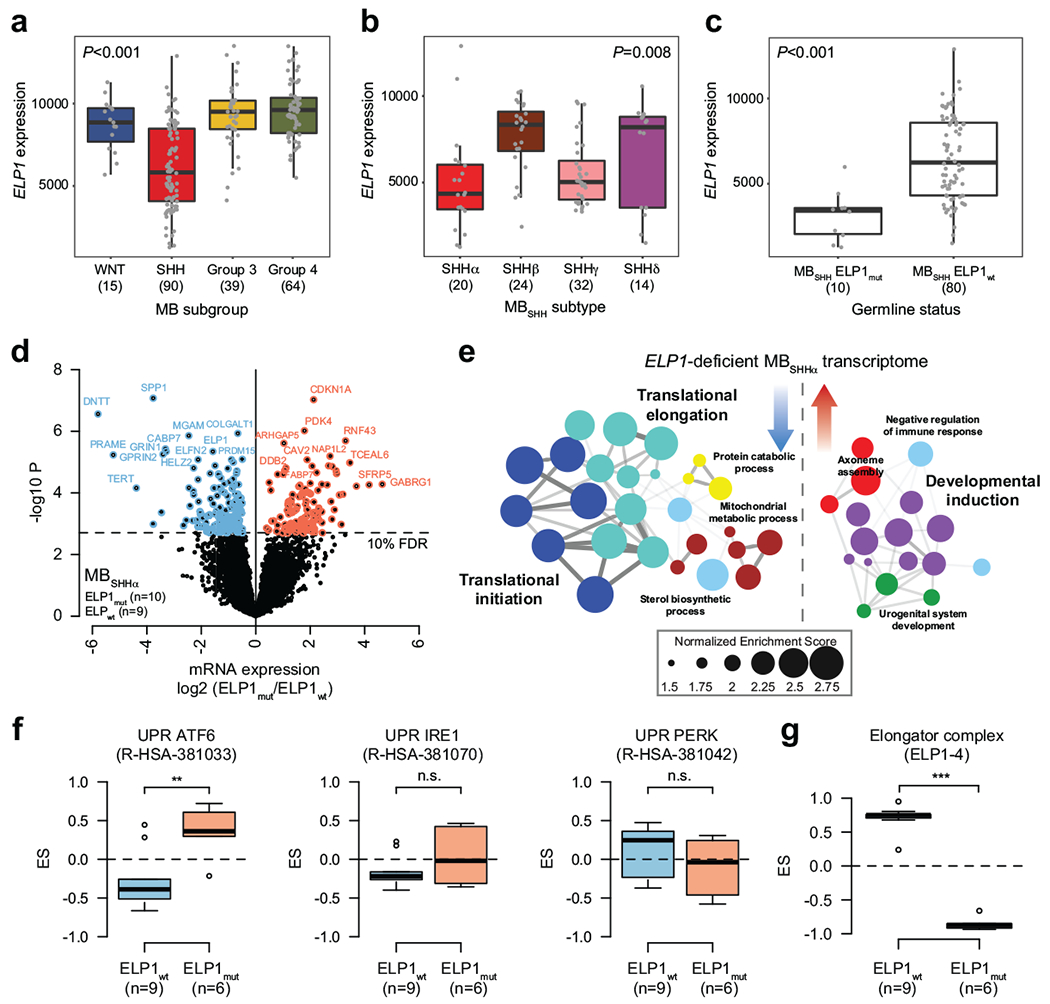
a. ELP1 expression stratified by consensus MB subgroup (n=208 patients). P value was calculated using likelihood ratio tests. Boxes show median, first and third quartile, and whiskers extend to 1.5× the interquartile range.
b. ELP1 expression stratified by molecular MBSHH subtype (n=90 patients). P value was calculated using likelihood ratio tests. Boxes show median, first and third quartile, and whiskers extend to 1.5× the interquartile range.
c. ELP1 expression stratified by germline ELP1 mutation status (n=90 patients). P value was calculated using likelihood ratio tests. Boxes show median, first and third quartile, and whiskers extend to 1.5× the interquartile range.
d. Differential gene expression in ELP1mut (n=10) and ELP1wt SHHα (n=9). P values were derived from models that use negative binomal test statistics and were adjusted for multiple testing based on FDR correction.
e. Functional gene enrichment in ELP1-associated SHHα.
f. GSEA-based enrichment of UPR pathways in MBSHH proteomes. P values were calculated using a two-sided Mann-Whitney U-test. **P<0.01; ns P>0.05. Boxes show median, first and third quartile, and whiskers extend to 1.5× the interquartile range.
g. GSEA-based enrichment of the Elongator complex in MBSHH proteomes. P value was calculated using a two-sided Mann-Whitney U-test. ***P<0.001; Boxes show median, first and third quartile, and whiskers extend to 1.5× the interquartile range.
Extended Data Figure 6. Unsupervised multi-omics factor integration analysis of MBSHH.
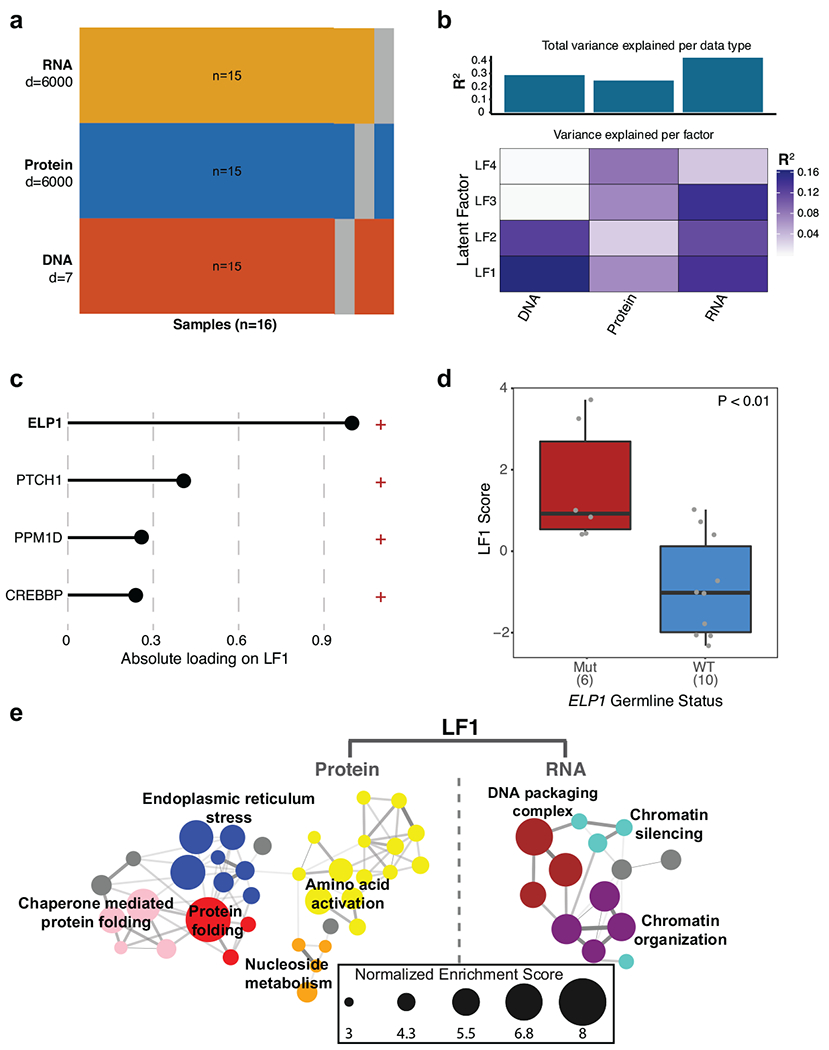
a. Overview of input samples and data types.
b. Latent factors variance summary across data types.
c. Somatic/germline gene alterations contributing to latent factor 1 (LF1).
d. Association between germline ELP1 mutation status and LF1 score (n=16 patients). P value was calculated using a two-sided Mann-Whitney U-test. Boxes show median, first and third quartile, and whiskers extend to 1.5× the interquartile range.
e. Functional enrichment of LF1-ranked proteins and mRNAs.
Extended Data Figure 7. Quantification of tRNA modifications in ELP1-associated MBSHH.

a. Quantification of mcm5U nucleosides in ELP1mut MBSHH PDX (n=4 biologically independent samples) and ELP1wt MBSHH PDX (n=4 biologically independent samples). Mean and standard errors are shown. P value was calculated using a two-sided Welch t-test. *P<0.05.
b. Quantification of m1A nucleosides in ELP1mut MBSHH PDX (n=4 biologically independent samples) and ELP1wt MBSHH PDX (n=4 biologically independent samples). Mean and standard errors are shown. P value was calculated using a two-sided Welch i-test. *ns>0.05.
c. Quantification of m7G nucleosides in ELP1mut MBSHH PDX (n=4 biologically independent samples) and ELP1wt MBSHH PDX (n=4 biologically independent samples). Mean and standard errors are shown. P value was calculated using a two-sided Welch t-test. ns P>0.05.
Extended Data Figure 8. Spatio-temporal ELP1 expression in human and mouse.
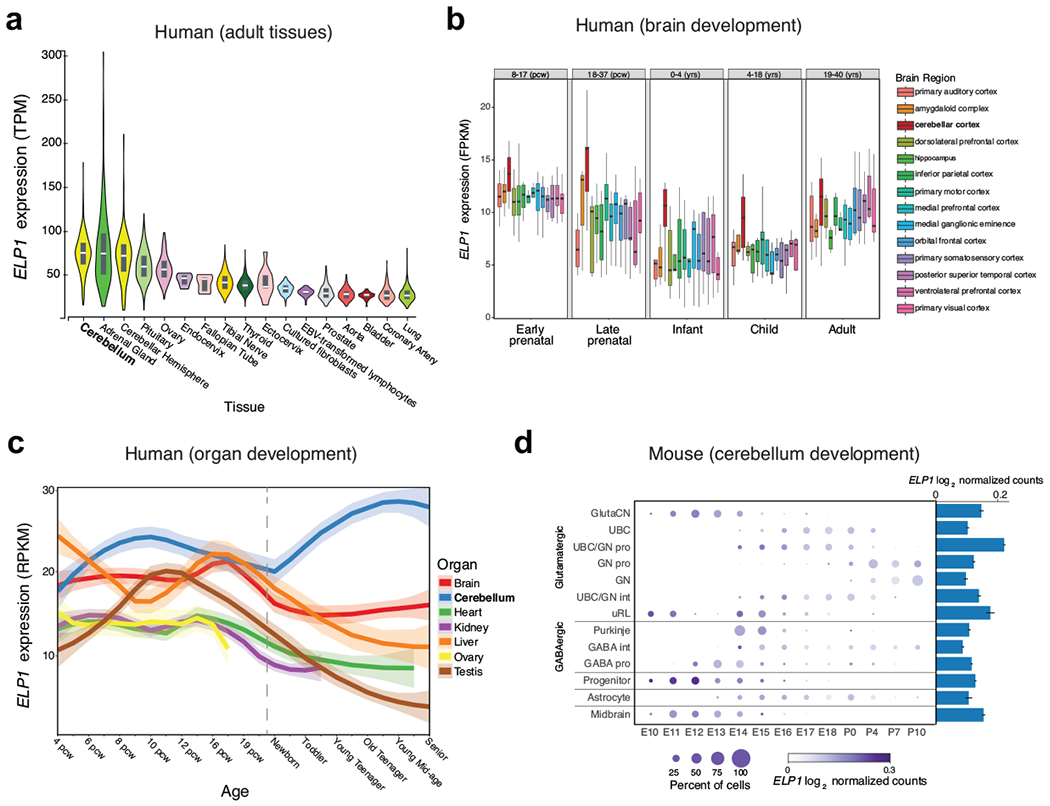
a. ELP1 expression in adult human tissues (n=9-653 donors per tissue). Violin plots depict kernel density estimates and represent the density distribution
b. ELP1 expression during human brain development (n=3-12 donors per tissue and time point). Boxes show median, first and third quartile, and whiskers extend to 1.5× the interquartile range.
c. ELP1 expression during human organ development. Shaded areas define 90% confidence intervals (n=18-58 donors per tissue).
d. Elp1 expression during mouse cerebellum development (n=27 animals). Center values and error bars define the mean expression of cells with non-zero ELP1 expression and standard error of the mean.
Supplementary Material
Supplementary Table 1. Sample overview.
Supplementary Table 2. Germline ELP1 loss-of-function mutations in MBSHH patients.
Supplementary Table 3. Familial transmission of germline ELP1 LoF variants in parent-offspring trios.
Supplementary Table 4. ELP1-associated transcriptome (nmut=10 and nwt=80) and proteome (nmut=6 and nwt=9). P values were calculated using negative binomial tests and empirical Bayes statistics and adjusted for multiple testing using FDR correction.
Supplementary Table 5. Dynamic mass spectrometer parameters for ribonucleotides.
Acknowledgements
This project was supported by the PedBrain Tumor Project contributing to the International Cancer Genome Consortium (ICGC), funded by the German Cancer Aid (109252), the German Federal Ministry of Education and Research (BMBF) (01KU1201A, 01KU1201C), and additionally through BMBF grants BioTop (01EK1502A, 01EK1502B), ICGC-DE-Mining (01KU1505F), MedSys (0315416C) and NGFNplus (01GS0883). JOK was additionally supported by a European Research Council Starting Grant (336045) and acknowledges EurocanPlatform (260791) funding from the European Commission. SMW was additionally supported by a Swiss National Science Foundation Early Postdoc Mobility Fellowship (P2ELP3_155365) and an EMBO Long-Term Fellowship (ALTF 755-2014). A.K. is supported by the Helmholtz Association Research Grant (Germany). M.R. is supported by the RSF Research Grant No. 18-45-06012. We acknowledge the EMBL IT facilities for supporting the genomic analyses. P.A.N. is a Pew-Stewart Scholar for Cancer Research (Margaret and Alexander Stewart Trust) and recipient of The Sontag Foundation Distinguished Scientist Award. P.A.N. was also supported by the National Cancer Institute (R01CA232143-01), American Association for Cancer Research (NextGen Grant for Transformative Cancer Research), The Brain Tumour Charity (Quest for Cures and Clinical Biomarkers), the American Lebanese Syrian Associated Charities (ALSAC), and St. Jude. From St. Jude, we explicitly acknowledge the Hartwell Center, the Biorepository, members of the Department of Computational Biology, Clinical Genomics, the Diagnostic Biomarkers Shared Resource in the Department of Pathology, and the Center for In Vivo Imaging and Therapeutics.
Footnotes
Competing Interests
The authors declare no competing interests.
Data Availability
Germline and tumor DNA sequencing, RNA sequencing, and DNA methylation array datasets have been deposited to EGA with accession number EGAS00001004126. Proteomic datasets have been deposited to PRIDE with accession number PXD016832. Molecular datasets can be freely explored using the St. Jude PeCan Data Portal (https://pecan.stiude.cloud/proteinpaint/studv/MB-ELP1). All other data are available from the corresponding authors upon reasonable request.
Code Availability
All custom code used to generate the data in this study is available upon reasonable request.
References
- 1.Grobner SN, Worst BC, Weischenfeldt J, Buchhalter I, Kleinheinz K, Rudneva VA, Johann PD , Balasubramanian GP, Segura-Wang M, Brabetz S, Bender S, Hutter B, Sturm D, Pfaff E, Hubschmann D, Zipprich G, Heinold M, Eils J, Lawerenz C, Erkek S, Lambo S, Waszak S, Blattmann C, Borkhardt A, Kuhlen M, Eggert A, Fulda S, Gessler M, Wegert J, Kappler R, Baumhoer D, Burdach S, Kirschner-Schwabe R, Kontny U, Kulozik AE, Lohmann D, Hettmer S, Eckert C, Bielack S, Nathrath M, Niemeyer C, Richter GH, Schulte J, Siebert R, Westermann F, Molenaar JJ, Vassal G, Witt H, Project IP-S, Project IM-S, Burkhardt B, Kratz CP, Witt O, van Tilburg CM, Kramm CM, Fleischhack G, Dirksen U, Rutkowski S, Fruhwald M, von Hoff K, Wolf S, Klingebiel T, Koscielniak E, Landgraf P, Koster J, Resnick AC, Zhang J, Liu Y, Zhou X, Waanders AJ, Zwijnenburg DA, Raman P, Brors B, Weber UD, Northcott PA, Pajtler KW, Kool M, Piro RM, Korbel JO, Schlesner M, Eils R, Jones DTW, Lichter P, Chavez L, Zapatka M & Pfister SM The landscape of genomic alterations across childhood cancers. Nature 555, 321–327, doi: 10.1038/nature25480 (2018). [DOI] [PubMed] [Google Scholar]
- 2.Zhang J, Walsh MF, Wu G, Edmonson MN, Gruber TA, Easton J, Hedges D, Ma X, Zhou X, Yergeau DA, Wilkinson MR, Vadodaria B, Chen X, McGee RB, Hines-Dowell S, Nuccio R, Quinn E, Shurtleff SA, Rusch M, Patel A, Becksfort JB, Wang S, Weaver MS, Ding L, Mardis ER, Wilson RK, Gajjar A, Ellison DW, Pappo AS, Pui CH, Nichols KE & Downing JR Germline Mutations in Predisposition Genes in Pediatric Cancer. N Engl J Med 373, 2336–2346, doi: 10.1056/NEJMoa1508054 (2015). [DOI] [PMC free article] [PubMed] [Google Scholar]
- 3.Waszak SM, Northcott PA, Buchhalter I, Robinson GW, Sutter C, Groebner S, Grand KB, Brugieres L, Jones DTW, Pajtler KW, Morrissy AS, Kool M, Sturm D, Chavez L, Ernst A, Brabetz S, Hain M, Zichner T, Segura-Wang M, Weischenfeldt J, Rausch T, Mardin BR, Zhou X, Baciu C, Lawerenz C, Chan JA, Varlet P, Guerrini-Rousseau L, Fults DW, Grajkowska W, Hauser P, Jabado N, Ra YS, Zitterbart K, Shringarpure SS, De La Vega FM, Bustamante CD, Ng HK, Perry A, MacDonald TJ, Hernaiz Driever P, Bendel AE, Bowers DC, McCowage G, Chintagumpala MM, Cohn R, Hassall T, Fleischhack G, Eggen T, Wesenberg F, Feychting M, Lannering B, Schuz J, Johansen C, Andersen TV, Roosli M, Kuehni CE, Grotzer M, Kjaerheim K , Monoranu CM, Archer TC, Duke E, Pomeroy SL, Shelagh R, Frank S, Sumerauer D, Scheurlen W, Ryzhova MV, Milde T, Kratz CP, Samuel D, Zhang J, Solomon DA, Marra M, Eils R, Bartram CR, von Hoff K, Rutkowski S, Ramaswamy V, Gilbertson RJ, Korshunov A, Taylor MD, Lichter P, Malkin D, Gajjar A, Korbel JO & Pfister SM Spectrum and prevalence of genetic predisposition in medulloblastoma: a retrospective genetic study and prospective validation in a clinical trial cohort. Lancet Oncol 19, 785–798, doi: 10.1016/S1470-2045(18)30242-0 (2018). [DOI] [PMC free article] [PubMed] [Google Scholar]
- 4.Cavalli FMG, Remke M, Rampasek L, Peacock J, Shih DJH, Luu B, Garzia L, Torchia J, Nor C, Morrissy AS, Agnihotri S, Thompson YY, Kuzan-Fischer CM, Farooq H, Isaev K, Daniels C , Cho BK, Kim SK, Wang KC, Lee JY, Grajkowska WA, Perek-Polnik M, Vasiljevic A, Faure-Conter C, Jouvet A, Giannini C, Nageswara Rao AA, Li KKW, Ng HK, Eberhart CG, Pollack IF, Hamilton RL, Gillespie GY, Olson JM, Leary S, Weiss WA, Lach B, Chambless LB, Thompson RC, Cooper MK, Vibhakar R, Hauser P, van Veelen MC, Kros JM, French PJ , Ra YS, Kumabe T, Lopez-Aguilar E, Zitterbart K, Sterba J, Finocchiaro G, Massimino M, Van Meir EG, Osuka S, Shofuda T, Klekner A, Zollo M, Leonard JR, Rubin JB, Jabado N, Albrecht S, Mora J, Van Meter TE, Jung S, Moore AS, Hallahan AR, Chan JA, Tirapelli DPC, Carlotti CG, Fouladi M, Pimentel J, Faria CC, Saad AG, Massimi L, Liau LM, Wheeler H, Nakamura H, Elbabaa SK, Perezpena-Diazconti M, Chico Ponce de Leon F, Robinson S, Zapotocky M , Lassaletta A, Huang A, Hawkins CE, Tabori U, Bouffet E, Bartels U, Dirks PB., Rutka JT., Bader GD., Reimand J, Goldenberg A, Ramaswamy V & Taylor MD. Intertumoral Heterogeneity within Medulloblastoma Subgroups. Cancer Cell 31, 737–754 e736, doi: 10.1016/j.ccell.2017.05.005 (2017). [DOI] [PMC free article] [PubMed] [Google Scholar]
- 5.Hawer H, Hammermeister A, Ravichandran KE, Glatt S, Schaffrath R & Klassen R Roles of Elongator Dependent tRNA Modification Pathways in Neurodegeneration and Cancer. Genes (Basel) 10, doi: 10.3390/genes10010019 (2018). [DOI] [PMC free article] [PubMed] [Google Scholar]
- 6.Johansson MJO, Xu F & Bystrom AS Elongator-a tRNA modifying complex that promotes efficient translational decoding. Biochim Biophys Acta Gene Regul Mech 1861, 401–408, doi: 10.1016/j.bbagrm.2017.11.006 (2018). [DOI] [PubMed] [Google Scholar]
- 7.Goffena J, Lefcort F, Zhang Y, Lehrmann E, Chaverra M, Felig J, Walters J, Buksch R, Becker KG & George L Elongator and codon bias regulate protein levels in mammalian peripheral neurons. Nat Commun 9, 889, doi: 10.1038/s41467-018-03221-z (2018). [DOI] [PMC free article] [PubMed] [Google Scholar]
- 8.Laguesse S, Creppe C, Nedialkova DD, Prevot PP, Borgs L, Huysseune S, Franco B, Duysens G , Krusy N, Lee G, Thelen N, Thiry M, Close P, Chariot A, Malgrange B, Leidel SA, Godin JD & Nguyen L A Dynamic Unfolded Protein Response Contributes to the Control of Cortical Neurogenesis. Dev Cell 35, 553–567, doi: 10.1016/j.devcel.2015.11.005 (2015). [DOI] [PubMed] [Google Scholar]
- 9.Nedialkova DD & Leidel SA Optimization of Codon Translation Rates via tRNA Modifications Maintains Proteome Integrity. Cell 161, 1606–1618, doi: 10.1016/j.cell.2015.05.022 (2015). [DOI] [PMC free article] [PubMed] [Google Scholar]
- 10.Rahman N Realizing the promise of cancer predisposition genes. Nature 505, 302–308, doi: 10.1038/nature12981 (2014). [DOI] [PMC free article] [PubMed] [Google Scholar]
- 11.Aydin D, Feychting M, Schuz J, Tynes T, Andersen TV, Schmidt LS, Poulsen AH, Johansen C, Prochazka M, Lannering B, Klaeboe L, Eggen T, Jenni D, Grotzer M, Von der Weid N, Kuehni CE & Roosli M Mobile phone use and brain tumors in children and adolescents: a multicenter case-control study. J Natl Cancer Inst 103, 1264–1276, doi: 10.1093/jnci/djr244 (2011). [DOI] [PubMed] [Google Scholar]
- 12.Karczewski KJ, Francioli LC, Tiao G, Cummings BB, Alfoldi J, Wang Q, Collins RL, Laricchia KM, Ganna A, Birnbaum DP, Gauthier LD, Brand H, Solomonson M, Watts NA, Rhodes D, Singer-Berk M, England EM, Seaby EG, Kosmicki JA, Walters RK, Tashman K, Farjoun Y, Banks E, Poterba T, Wang A, Seed C, Whiffin N, Chong JX, Samocha KE, Pierce-Hoffman E, Zappala Z, O’Donnell-Luria AH, Minikel EV, Weisburd B, Lek M, Ware JS, Vittal C, Armean IM, Bergelson L, Cibulskis K, Connolly KM, Covarrubias M, Donnelly S, Ferriera S, Gabriel S, Gentry J, Gupta N, Jeandet T, Kaplan D, Llanwarne C, Munshi R, Novod S, Petrillo N , Roazen D, Ruano-Rubio V, Saltzman A, Schleicher M, Soto J, Tibbetts K, Tolonen C, Wade G, Talkowski ME, Neale BM, Daly MJ & MacArthur DG Variation across 141,456 human exomes and genomes reveals the spectrum of loss-of-function intolerance across human protein-coding genes. bioRxiv, doi: 10.1101/531210 (2019). [DOI] [Google Scholar]
- 13.Waszak SM, Tiao G, Zhu B, Rausch T, Muyas F, Rodriguez-Martin B, Rabionet R, Yakneen S, Escaramis G & Li Y Germline determinants of the somatic mutation landscape in 2,642 cancer genomes. bioRxiv (2017). [Google Scholar]
- 14.Kool M, Jones DT, Jager N, Northcott PA, Pugh TJ, Hovestadt V, Piro RM, Esparza LA, Markant SL, Remke M, Milde T, Bourdeaut F, Ryzhova M, Sturm D, Pfaff E, Stark S, Hutter S, Seker-Cin H, Johann P, Bender S, Schmidt C, Rausch T, Shih D, Reimand J, Sieber L, Wittmann A , Linke L, Witt H, Weber UD, Zapatka M, Konig R, Beroukhim R, Bergthold G, van Sluis P, Volckmann R, Koster J, Versteeg R, Schmidt S, Wolf S, Lawerenz C, Bartholomae CC, von Kalle C, Unterberg A, Herold-Mende C, Hofer S, Kulozik AE, von Deimling A, Scheurlen W, Felsberg J, Reifenberger G, Hasselblatt M, Crawford JR, Grant GA, Jabado N, Perry A, Cowdrey C, Croul S, Zadeh G, Korbel JO, Doz F, Delattre O, Bader GD, McCabe MG, Collins VP, Kieran MW, Cho YJ, Pomeroy SL, Witt O, Brors B, Taylor MD, Schuller U, Korshunov A, Eils R, Wechsler-Reya RJ, Lichter P, Pfister SM & Project IPT Genome sequencing of SHH medulloblastoma predicts genotype-related response to smoothened inhibition. Cancer Cell 25, 393–405, doi: 10.1016/j.ccr.2014.02.004 (2014). [DOI] [PMC free article] [PubMed] [Google Scholar]
- 15.Northcott PA, Buchhalter I, Morrissy AS, Hovestadt V, Weischenfeldt J, Ehrenberger T, Grobner S , Segura-Wang M, Zichner T, Rudneva VA, Warnatz HJ, Sidiropoulos N, Phillips AH, Schumacher S, Kleinheinz K, Waszak SM, Erkek S, Jones DTW, Worst BC, Kool M, Zapatka M, Jager N, Chavez L, Hutter B, Bieg M, Paramasivam N, Heinold M, Gu Z, Ishaque N, Jager-Schmidt C, Imbusch CD, Jugold A, Hubschmann D, Risch T, Amstislavskiy V, Gonzalez FGR, Weber UD, Wolf S, Robinson GW, Zhou X, Wu G, Finkelstein D, Liu Y, Cavalli FMG, Luu B , Ramaswamy V, Wu X, Koster J, Ryzhova M, Cho YJ, Pomeroy SL, Herold-Mende C, Schuhmann M, Ebinger M, Liau LM, Mora J, McLendon RE, Jabado N, Kumabe T, Chuah E, Ma Y, Moore RA, Mungall AJ, Mungall KL, Thiessen N, Tse K, Wong T, Jones SJM, Witt O , Milde T, Von Deimling A, Capper D, Korshunov A, Yaspo ML, Kriwacki R, Gajjar A, Zhang J, Beroukhim R, Fraenkel E, Korbel JO, Brors B, Schlesner M, Eils R, Marra MA, Pfister SM, Taylor MD & Lichter P The whole-genome landscape of medulloblastoma subtypes. Nature 547, 311–317, doi: 10.1038/nature22973 (2017). [DOI] [PMC free article] [PubMed] [Google Scholar]
- 16.Schwalbe EC, Lindsey JC, Nakjang S, Crosier S, Smith AJ, Hicks D, Rafiee G, Hill RM, Iliasova A, Stone T, Pizer B, Michalski A, Joshi A, Wharton SB, Jacques TS, Bailey S, Williamson D & Clifford SC Novel molecular subgroups for clinical classification and outcome prediction in childhood medulloblastoma: a cohort study. Lancet Oncol 18, 958–971, doi: 10.1016/S1470-2045(17)30243-7 (2017). [DOI] [PMC free article] [PubMed] [Google Scholar]
- 17.Robinson GW, Rudneva VA, Buchhalter I, Billups CA, Waszak SM, Smith KS, Bowers DC , Bendel A, Fisher PG, Partap S, Crawford JR, Hassall T, Indelicato DJ, Boop F, Klimo P, Sabin ND, Patay Z, Merchant TE, Stewart CF, Orr BA, Korbel JO, Jones DTW, Sharma T , Lichter P, Kool M, Korshunov A, Pfister SM, Gilbertson RJ, Sanders RP, Onar-Thomas A, Ellison DW, Gajjar A & Northcott PA Risk-adapted therapy for young children with medulloblastoma (SJYC07): therapeutic and molecular outcomes from a multicentre, phase 2 trial. Lancet Oncol 19, 768–784, doi: 10.1016/S1470-2045(18)30204-3 (2018). [DOI] [PMC free article] [PubMed] [Google Scholar]
- 18.Dauden MI, Kosinski J, Kolaj-Robin O, Desfosses A, Ori A, Faux C, Hoffmann NA, Onuma OF , Breunig KD, Beck M, Sachse C, Seraphin B, Glatt S & Muller CW Architecture of the yeast Elongator complex. EMBO Rep 18, 264–279, doi: 10.15252/embr.201643353 (2017). [DOI] [PMC free article] [PubMed] [Google Scholar]
- 19.Setiaputra DT, Cheng DT, Lu S, Hansen JM, Dalwadi U, Lam CH, To JL, Dong MQ & Yip CK Molecular architecture of the yeast Elongator complex reveals an unexpected asymmetric subunit arrangement. EMBO Rep 18, 280–291, doi: 10.15252/embr.201642548 (2017). [DOI] [PMC free article] [PubMed] [Google Scholar]
- 20.Rubin BY & Anderson SL IKBKAP/ELP1 gene mutations: mechanisms of familial dysautonomia and gene-targeting therapies. Appl Clin Genet 10, 95–103, doi: 10.2147/TACG.S129638 (2017). [DOI] [PMC free article] [PubMed] [Google Scholar]
- 21.Yoshida M, Kataoka N, Miyauchi K, Ohe K, Iida K, Yoshida S, Nojima T, Okuno Y, Onogi H, Usui T, Takeuchi A, Hosoya T, Suzuki T & Hagiwara M Rectifier of aberrant mRNA splicing recovers tRNA modification in familial dysautonomia. Proc Natl Acad Sci U S A 112, 2764–2769, doi: 10.1073/pnas.1415525112 (2015). [DOI] [PMC free article] [PubMed] [Google Scholar]
- 22.Gold-von Simson G, Romanos-Sirakis E, Maayan C & Axelrod FB Neoplasia in familial dysautonomia: a 20-year review in a young patient population. J Pediatr 155, 934–936, doi: 10.1016/j.jpeds.2009.04.055 (2009). [DOI] [PubMed] [Google Scholar]
- 23.Shvartsbeyn M, Rapkiewicz A, Axelrod F & Kaufmann H Increased Incidence of Tumors With the IKBKAP Gene Mutation? A Case Report and Review of the Literature. World J Oncol 2, 41–44, doi: 10.4021/wjon278w (2011). [DOI] [PMC free article] [PubMed] [Google Scholar]
- 24.Hetz C & Saxena S ER stress and the unfolded protein response in neurodegeneration. Nat Rev Neurol 13, 477–491, doi: 10.1038/nrneurol.2017.99 (2017). [DOI] [PubMed] [Google Scholar]
- 25.Forget A, Martignetti L, Puget S, Calzone L, Brabetz S, Picard D, Montagud A, Liva S, Sta A, Dingli F, Arras G, Rivera J, Loew D, Besnard A, Lacombe J, Pages M, Varlet P, Dufour C, Yu H , Mercier AL, Indersie E, Chivet A, Leboucher S, Sieber L, Beccaria K, Gombert M, Meyer FD , Qin N, Bartl J, Chavez L, Okonechnikov K, Sharma T, Thatikonda V, Bourdeaut F, Pouponnot C , Ramaswamy V, Korshunov A, Borkhardt A, Reifenberger G, Poullet P, Taylor MD, Kool M, Pfister SM, Kawauchi D, Barillot E, Remke M & Ayrault O Aberrant ERBB4-SRC Signaling as a Hallmark of Group 4 Medulloblastoma Revealed by Integrative Phosphoproteomic Profiling. Cancer Cell 34, 379–395 e377, doi: 10.1016/j.ccell.2018.08.002 (2018). [DOI] [PubMed] [Google Scholar]
- 26.Argelaguet R, Velten B, Arnol D, Dietrich S, Zenz T, Marioni JC, Buettner F, Huber W & Stegle O Multi-Omics Factor Analysis-a framework for unsupervised integration of multi-omics data sets. Mol Syst Biol 14, e8124, doi: 10.15252/msb.20178124 (2018). [DOI] [PMC free article] [PubMed] [Google Scholar]
- 27.Creppe C, Malinouskaya L, Volvert ML, Gillard M, Close P, Malaise O, Laguesse S, Cornez I, Rahmouni S, Ormenese S, Belachew S, Malgrange B, Chapelle JP, Siebenlist U, Moonen G, Chariot A & Nguyen L Elongator controls the migration and differentiation of cortical neurons through acetylation of alpha-tubulin. Cell 136, 551–564, doi: 10.1016/j.cell.2008.11.043 (2009). [DOI] [PubMed] [Google Scholar]
- 28.Huang B, Johansson MJ & Bystrom AS An early step in wobble uridine tRNA modification requires the Elongator complex. RNA 11, 424–436, doi: 10.1261/rna.7247705 (2005). [DOI] [PMC free article] [PubMed] [Google Scholar]
- 29.Murphy F. V. t., Ramakrishnan V, Malkiewicz A & Agris PF The role of modifications in codon discrimination by tRNA(Lys)UUU. Nat Struct Mol Biol 11, 1186–1191, doi: 10.1038/nsmb861 (2004). [DOI] [PubMed] [Google Scholar]
- 30.Consortium GT The Genotype-Tissue Expression (GTEx) project. Nat Genet 45, 580–585, doi: 10.1038/ng.2653 (2013). [DOI] [PMC free article] [PubMed] [Google Scholar]
- 31.Miller JA, Ding SL, Sunkin SM, Smith KA, Ng L, Szafer A, Ebbert A, Riley ZL, Royall JJ, Aiona K, Arnold JM, Bennet C, Bertagnolli D, Brouner K, Butler S, Caldejon S, Carey A, Cuhaciyan C, Dalley RA, Dee N, Dolbeare TA, Facer BA, Feng D, Fliss TP, Gee G, Goldy J, Gourley L, Gregor BW, Gu G, Howard RE, Jochim JM, Kuan CL, Lau C, Lee CK, Lee F, Lemon TA, Lesnar P, McMurray B, Mastan N, Mosqueda N, Naluai-Cecchini T, Ngo NK, Nyhus J, Oldre A, Olson E, Parente J, Parker PD, Parry SE, Stevens A, Pletikos M, Reding M, Roll K, Sandman D, Sarreal M, Shapouri S, Shapovalova NV, Shen EH, Sjoquist N, Slaughterbeck CR, Smith M, Sodt AJ, Williams D, Zollei L, Fischl B, Gerstein MB, Geschwind DH, Glass IA, Hawrylycz MJ, Hevner RF, Huang H, Jones AR, Knowles JA, Levitt P, Phillips JW, Sestan N, Wohnoutka P, Dang C, Bernard A, Hohmann JG & Lein ES Transcriptional landscape of the prenatal human brain. Nature 508, 199–206, doi: 10.1038/nature13185 (2014). [DOI] [PMC free article] [PubMed] [Google Scholar]
- 32.Carter RA, Bihannic L, Rosencrance C, Hadley JL, Tong Y, Phoenix TN, Natarajan S, Easton J, Northcott PA & Gawad C A Single-Cell Transcriptional Atlas of the Developing Murine Cerebellum. Curr Biol 28, 2910–2920 e2912, doi: 10.1016/j.cub.2018.07.062 (2018). [DOI] [PubMed] [Google Scholar]
- 33.Begemann M, Waszak SM, Robinson GW, Jager N, Sharma T, Knopp C, Kraft F, Moser O, Mynarek M, Guerrini-Rousseau L, Brugieres L, Varlet P, Pietsch T, Bowers DC, Chintagumpala M, Sahm F, Korbel JO, Rutkowski S, Eggermann T, Gajjar A, Northcott P, Elbracht M, Pfister SM, Kontny U & Kurth I Germline GPR161 Mutations Predispose to Pediatric Medulloblastoma. J Clin Oncol, JCO1900577, doi: 10.1200/JCO.19.00577 (2019). [DOI] [PMC free article] [PubMed] [Google Scholar]
Associated Data
This section collects any data citations, data availability statements, or supplementary materials included in this article.
Supplementary Materials
Supplementary Table 1. Sample overview.
Supplementary Table 2. Germline ELP1 loss-of-function mutations in MBSHH patients.
Supplementary Table 3. Familial transmission of germline ELP1 LoF variants in parent-offspring trios.
Supplementary Table 4. ELP1-associated transcriptome (nmut=10 and nwt=80) and proteome (nmut=6 and nwt=9). P values were calculated using negative binomial tests and empirical Bayes statistics and adjusted for multiple testing using FDR correction.
Supplementary Table 5. Dynamic mass spectrometer parameters for ribonucleotides.


