Supplemental Digital Content is available in the text.
Keywords: Ambient temperature, Epidemiology, Latitude, Multiple sclerosis, Prospective cohort, Ultraviolet radiation, Women
Background:
Differences in multiple sclerosis (MS) risk by latitude have been observed worldwide; however, the exposures driving these associations are unknown. Ultraviolet radiation (UV) has been explored as a risk factor, and ambient temperature has been correlated with disease progression. However, no study has examined the impact of all three exposures. We examined the association between these exposures and incidence of MS within two nationwide prospective cohorts of women, the Nurses’ Health Study (NHS) and Nurses’ Health Study II (NHSII).
Methods:
Both cohorts were followed with biennial questionnaires to ascertain new diagnoses and risk factors. Time-varying exposures to latitude, cumulative average July temperature (°C), and cumulative average July erythemal UV (mW/m2) were predicted at each participant’s biennially updated residential addresses. Using Cox proportional hazards models adjusted for MS risk factors, we calculated hazard ratios (HR) and 95% confidence intervals (CIs) within each cohort and pooled via meta-analyses.
Results:
In multivariable models, there were suggestions that decreasing latitude (meta-analysis multivariable-adjusted HR = 0.72; 95% CI 0.55, 0.94 for women living <35.73° compared with those ≥42.15°, P-for-trend = 0.007) and increasing cumulative average July temperature (meta-analysis multivariable-adjusted HR = 0.81; 95% CI 0.72, 0.91 for each interquartile range increase [3.91°]) were associated with decreasing risk of MS. There was no evidence of heterogeneity between cohorts. We did not observe consistent associations with cumulative average UV.
Conclusion:
Our results suggest that adult exposures to decreasing latitude and increasing temperature, but not UV, were associated with reduced MS risk in these two cohorts of women. Studies of MS incidence may want to consider temperature as a risk factor.
What this study adds:
Our analyses present the first to our knowledge examination of temperature as a potential environmental risk factor for the incidence of multiple sclerosis. We observed the expected gradients in risk in latitude, but these patterns were not explained by differences in exposure to ambient ultraviolet radiation.
Introduction
Multiple sclerosis (MS) is a systemic autoimmune disease targeting the central nervous system’s white matter, causing progressive neurodegeneration.1 MS has been shown in some, but not all studies, to have a distinct latitudinal pattern with the lowest incidence/prevalence rates and higher ages of onset at lower latitudes around the equator and increased incidence/prevalence and lower ages of onset towards the poles.2–8 These gradients have been hypothesized to be related to differences in geographic patterns of racial/ethnic groups, genetic susceptibility, viral infections (e.g. Epstein Barr virus), or environmental exposures such as ultraviolet radiation (UV) (either independently or due to its role in vitamin D metabolism).9–12 Studies examining the association between UV and incidence of MS have generally shown an inverse association with increasing sun exposure during childhood and adolescence, though associations with UV exposure during adulthood have been less clear.11,13–20 Ambient temperature, which is also highly correlated with latitude, has not been studied as a risk factor for MS. Clinical studies have shown heat intolerance in some patients with MS,21 while suggesting therapy in a warm climate for others,22 or reported no impact of ambient temperature on disease prognosis.23,24 The objective of our study was to examine the impacts of latitude, ambient temperature, and UV on the risk of MS incidence in two large cohorts of US women.
Methods
Study population
The Nurses’ Health Study (NHS) and Nurses’ Health Study II (NHSII) are US nationwide prospective cohort studies of factors related to chronic, non-communicable illnesses among women.25 NHS began in 1976 with 121,700 nurses aged 30–55 years and NHSII began in 1989 with 116,430 nurses aged 25–42 years.26,27 Currently, each cohort has at least 10 nurses in each of the 50 states and District of Columbia. Every two years, questionnaires are mailed to each nurse ascertaining information on medical history, disease incidence, and lifestyle factors such as diet, work patterns, and health behaviors. Response rates are maintained at around 90% each cycle.25,26 Women were excluded from the current analysis if they had been diagnosed with MS or died before 1984 for NHS or 1989 for NHSII, moved outside of the conterminous US (where exposure predictions were available), were missing exposure information, or were lost to follow-up. This protocol was approved by the Institutional Review Board of Brigham and Women’s Hospital and the Human Subjects Committee at the Harvard TH Chan School of Public Health, and return of the questionnaires was inferred as implied consent.
Case ascertainment
Details of case ascertainment for incident MS in both cohorts have been published elsewhere.28,29 In brief, before 2002, MS cases were identified by self-report followed by consent to obtain medical records and confirmation from treating neurologists who were asked by questionnaire whether the MS diagnosis was definite, probable, possible, or not MS based on Poser criteria.30 For the analyses, we only included definite and probable cases. After 2002, treating neurologists have been asked to additionally provide medical records and relevant MRI reports for further ascertainment. All available medical records were reviewed by a study neurologist blinded to exposure status to determine whether each case met the McDonald criteria for MS diagnosis.31,32 Treating neurologists were also asked to provide an approximation of date of symptom onset.
Exposure assessment
The residential addresses of each participant were updated at the time of each biennial questionnaire mailing. Therefore, we are able to account for residential address changes throughout adulthood for each participant. All residential addresses throughout follow-up have been geocoded to obtain latitude and longitude. The geographic distributions of participants throughout follow-up are shown in Figure 1.
Figure 1.
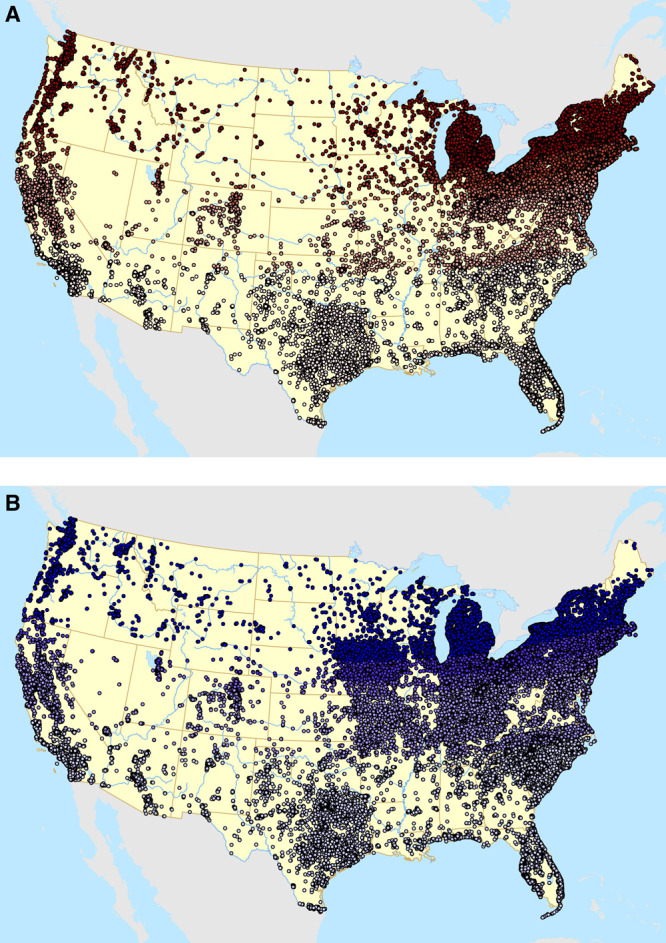
Geographic distribution of participants in the Nurses’ Health Study (A, top) and Nurses’ Health Study II (B, bottom) throughout follow-up shaded by quintiles of latitude.
Latitude
Latitude at each address throughout follow-up was determined for every two years and was categorized into quintiles using the pooled distribution of latitude across the two cohorts.
Ambient temperature
Gridded monthly ambient temperature data for the full follow-up period (1984–2004 for NHS and 1989–2011 for NHSII) were obtained from the Parameter-elevation Regressions on Independent Slopes Model (PRISM) Climate Group time-series datasets from the Northwest Alliance for Computational Science and Engineering.33 These datasets have been produced from climatologically-aided interpolation, and have recently been determined to be highly useful for environmental epidemiology studies.34 Briefly, temperature data from all weather stations available across the conterminous US were compiled as input into a weighted regression model, accounting for elevation and other climatological factors, to produce grid-level daily and monthly temperature and precipitation variables from 1895 onwards. Such spatially-resolved meteorological data are increasingly used instead of point-based single station estimates because they reduce exposure measurement error and estimate weather in places without weather stations. For this study, time-varying annual average and July temperature data with a 30-arcsec resolution, equivalent to an 800-m grid, were linked to the residential address histories of each participant using ArcGIS Desktop software release 10 (Esri 2011, Redlands, CA, USA). Averaged data for 1980-2010 are shown for both measures in Figure 2.
Figure 2.
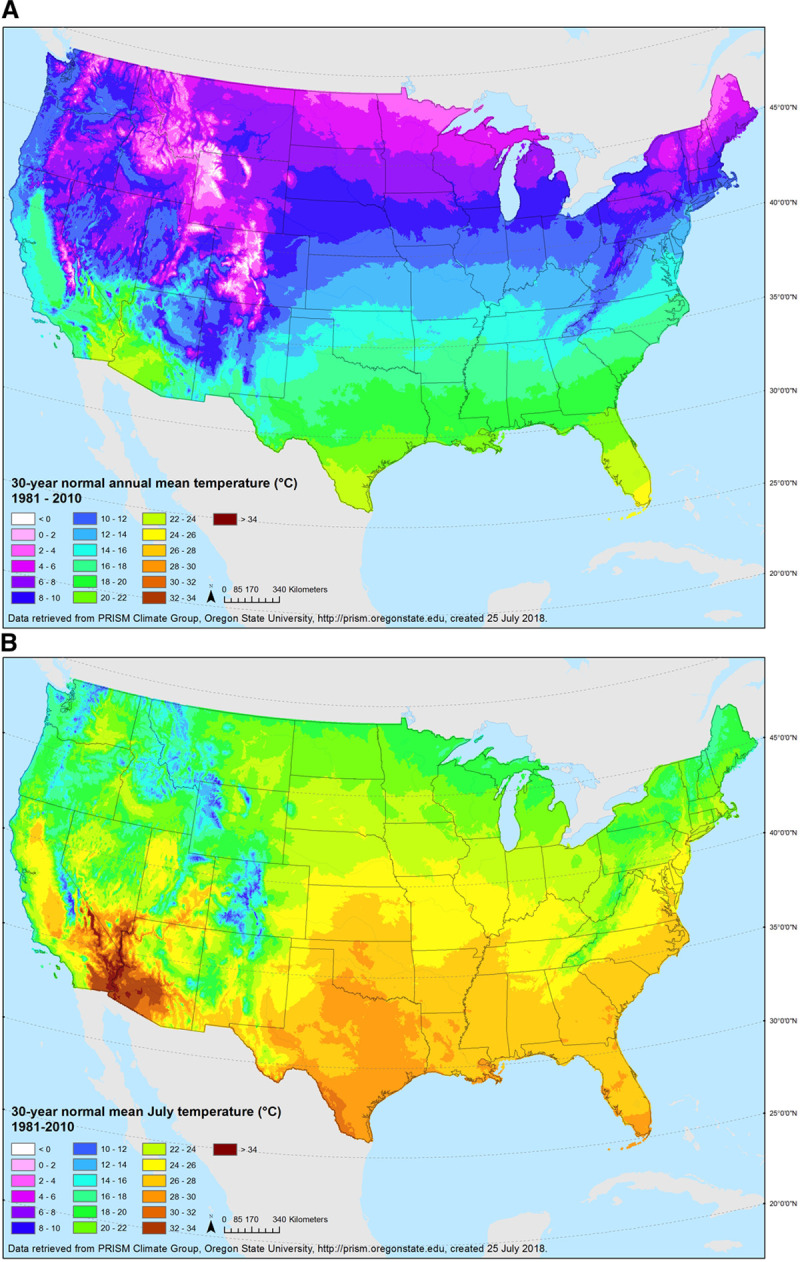
Annual (A, top) and July (B, bottom) average temperature (°C), 1981–2010.
Ultraviolet radiation
Erythemal ultraviolet radiation (eUV) is an integrated measurement, incorporating both UVA and UVB wavelengths as a measure of UV capable of inducing erythema on Caucasian skin. We used time-varying predictions eUV developed using a stratified area-to-point residual kriging approach.35 The model uses a two-step modeling approach that predicts surface eUV using National Aeronautics and Space Administration (NASA) satellite eUV data. The first step incorporates known predictive factors (such as surface albedo, aerosol optical depth, cloud cover, dew point, elevation, ozone, surface incoming shortwave flux, sulfur dioxide, and latitude) into a mixed-effects linear regression model to predict average noon-time July surface eUV levels. The second step uses residuals from the regression model in a predictive kriging model to downscale the modeled eUV values to 1-km grid spatial resolution for the period of 1980–2015. This final UV model (Figure 3) was matched to geocoded residential address history of participants over the respective follow-up periods.
Figure 3.
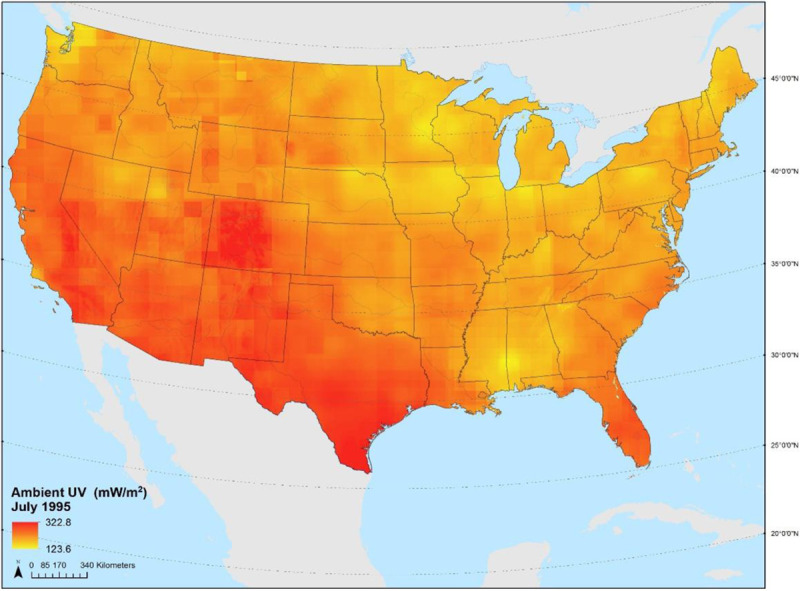
Average July erythemal ultraviolet radiation (mW/m2), 1980–2015.
Covariates
We assessed known risk factors of MS or predictors of exposure as potential confounders.7,36,37 Time-invariant covariates included body mass index (BMI) at age 18 (categorized as <18.5, 18.5–25, 25–30 and >30 kg/m2), supplemental vitamin D intake at baseline (1984 for NHS and 1991 for NHSII, categorized as 0, <400 International Units (IU)/day or ≥400 IU/day where 400 IU/day was the median value among those who took a supplement), ancestry (categorized as Scandinavian, South European, other Caucasians, and other ancestries), and latitude for the state of residence at age 15 (asked on the NHS 1992 and NHSII 1993 questionnaires, categorized as North (>41°), Middle (37°–41°) or South (<37°) to remain consistent with previous analyses).7
Time-varying covariates were updated every 2 or 4 years and included pack-years of cigarette smoking (0, <10, 10–25, and >25), individual-level information on socioeconomic status (SES) (marital status, living alone), area-level SES (Census tract median home value and median income), and Census tract population density.
Statistical analysis
Person-time of follow-up was computed from the baseline questionnaire return date until the date of diagnosis (event), death (censored), loss to follow-up (censored), moving outside of the conterminous US (censored), or end-of-follow-up (censored) in June 2004 (NHS) or June 2011 (NHSII); whichever came first. Time-varying Cox proportional hazards models stratified by current age and calendar period were used to estimate hazard ratios (HRs) and 95% confidence intervals (CIs) in SAS version 9 (SAS Institute Inc., Cary, NC, USA). Deviations from linearity in the continuous dose-response were determined using penalized splines using the survival package in RStudio Version 1.1.442 (RStudio, Inc., Boston, MA, USA). Each of the exposures was considered as continuous or as quintiles of the pooled distribution as appropriate. For continuous measures, we present HRs per interquartile range (IQR) increase in the pooled exposure distribution. For quintiles, we present P-values-for-trend based on the median values of each quintile. We present basic models (adjusted for current age, calendar period and ancestry), multivariable models additionally adjusted for smoking, BMI at age 18, vitamin D at baseline, cumulative average July UV and/or cumulative average annual temperature as appropriate, population density, and individual- and area-level SES, and fully adjusted models additionally adjusted for latitude of residence at age 15. We modeled associations in each cohort separately and computed a pooled HR via meta-analysis, using Cochran’s Q to examine heterogeneity.38 The missing indicator method was used to account for any missing covariates. To assess the potential for reverse causation from changing behaviors due to symptom onset, we conducted sensitivity analyses in the subset of women with physician-reported date of first symptoms where person-time was calculated up through date of reported symptom onset.
Results
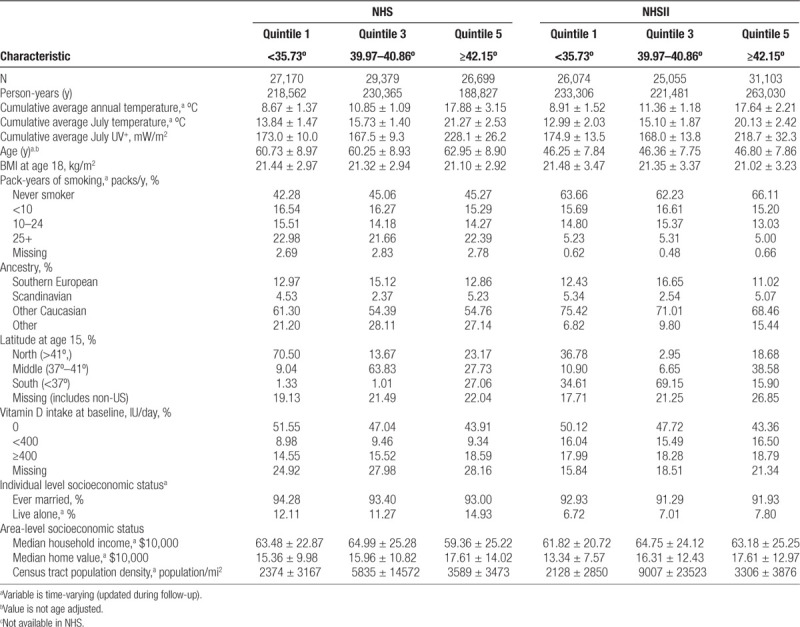
Characteristics of the participants from NHS and NHSII throughout follow-up by pooled quintile of time-varying latitude are presented in Table 1. As expected, women living at lower latitudes had higher July and annual ambient temperatures and have higher ambient erythemal UV exposures. The distributions of age, smoking, BMI at age 18, ancestry, and individual- and area-level SES were similar across pooled quintiles of latitude, although different between the two cohorts. Population density differed across latitude, but without a clear pattern. The distribution of latitude at age 15 differed across the quintiles, with most women living in similar latitudes at age 15 and throughout follow-up, although this pattern was more apparent in NHS than in NHSII.
Table 1.
Age-standardized characteristics of Nurses’ Health Study and Nurses’ Health Study II participants throughout follow-up (1984–2004 for NHS and 1989–2011 for NHSII) by pooled quintile of time-varying latitude
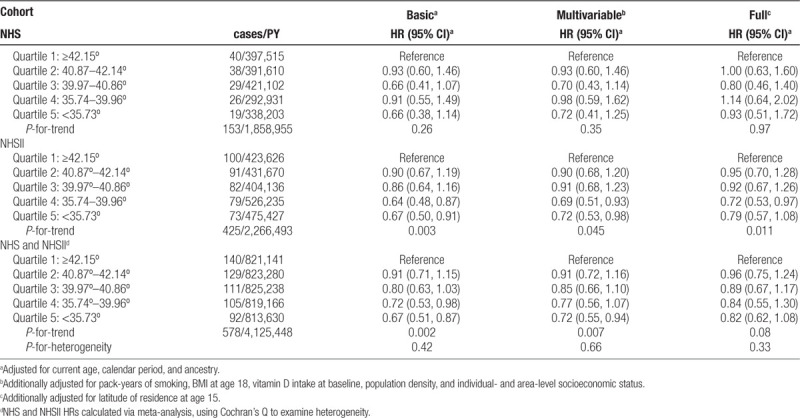
During follow-up, there were 153 cases of MS diagnosed in NHS and 425 in NHSII. The exposure-response curves for latitude displayed deviations from linearity, therefore pooled quintiles are presented. In basic models in both cohorts, decreasing time-varying latitude was associated with a decreased risk of MS, with a P-for-trend across quartiles of 0.26 in NHS, 0.003 in NHSII, and 0.002 in the meta-analysis of the cohorts combined (Table 2). These trends were robust to additional levels of potential confounder adjustment in NHSII, but not in NHS, although there was little evidence of heterogeneity. For example, in the meta-analysis of the cohorts combined, the HR for quintile 5 (<35.73°) compared with quintile 1 (≥42.15°) was 0.72 (95% CI 0.55, 0.94) in multivariable-adjusted models, but increased to 0.82 (95% CI 0.62, 1.08) when additionally adjusted for latitude at age 15.
Table 2.
Hazard ratios (95% CI) for the association of multiple sclerosis with pooled quintiles of time-varying latitude of residence among women in the Nurses’ Health Study (NHS,1984–2004) and Nurses’ Health Study II (1989–2011)
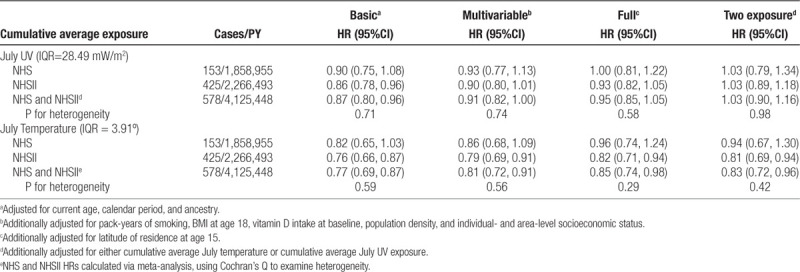
The exposure-response curves for temperature and UV did not display deviations from linearity, therefore we present continuous HRs per IQR of the pooled distribution. Increases in cumulative average July UV were not associated with MS risk in either cohort or in meta-analyses (Table 3). Each IQR increase (3.91°) in cumulative average July temperature was associated with decreased risks of MS, although the multivariable and fully-adjusted models did not reach statistical significance in either cohort, they did in the meta-analysis pooling the HRs (meta-analysis multivariate-adjusted HR: 0.81; 95% CI 0.72, 0.91 and meta-analysis fully adjusted HR: 0.85; 95% CI 0.74, 0.98), Table 3). Results were similar for both exposures in two-exposure models.
Table 3.
Hazard ratios (95% CI) for the association of multiple sclerosis with continuous cumulative average July temperature and cumulative average July UV among women in the NHS (1984–2004) and NHS II (1989–2011)
Results were similar in models examining cumulative annual average temperature (Supplemental Table S1; http://links.lww.com/EE/A96). All findings for UV and temperature were similar in sensitivity analyses restricted to only women with a physician-estimated date of symptom onset (Supplemental Table S2; http://links.lww.com/EE/A96 including 64 cases in NHS, 275 cases in NHSII), although there was a suggestion of a beneficial effect of UV (meta-analysis fully adjusted HR = 0.84; 95% CI 0.64, 1.11).
Discussion
In these analyses in two large prospective cohorts of women with decades of follow-up, our results suggest that time-varying current latitude and cumulative average ambient July temperature, but not cumulative average July UV, exposures during adulthood were associated with incidence of MS. These results complement results from an earlier study of the association between earlier life exposures to latitude and MS incidence among NHS and NHSII participants,7 where cases were ascertained through 1994 for NHS and 1995 for NHSII; higher latitude at age 15 was positively associated with MS diagnosis for NHS, but not NHSII and latitude at age 30 was not associated with MS risk in either cohort. These results with latitude during adulthood are consistent with other studies conducted in other US cohorts. Wallin et al.16 showed that in a mixed-gender case-control study, Vietnam War veterans who resided in the South at entry into service had an MS risk ratio (RR) of 0.49 compared with those in the North; for WWII and Korean war veterans, this RR was 0.41. The RRs comparing latitudes at birth were 0.44 and 0.40, respectively. Furthermore, our study confirmed the attenuation of North-South differences observed in more recent time periods, in some, but not all, studies or regions of the world.5,39 This attenuation may be due to increased time spent indoors, changes in sun behaviors, or increased use of sunscreens.40 However, in a recent meta-analysis of 415 (321 studies from a previous meta-analysis and 94 new studies) studies examining the association of latitude and MS prevalence, a comparison of slopes derived from 2008 to those in 2018 demonstrated statistically significant increases in risk from more recent studies, suggesting these attenuations may not be true across the literature.5
To the best of our knowledge, this was the first study to investigate both ambient temperature and UV simultaneously as potential environmental factors that may drive the observed latitudinal pattern in MS incidence and prevalence observed worldwide. We found increased cumulative average July (and annual) temperature to be inversely associated with risk of MS but did not observe any consistent associations between eUV in adulthood and MS risk. Sensitivity analyses using the physician-recorded date of first symptoms showed similar results, suggesting that our results are not likely influenced by participants moving due to early symptoms of disease. The UV results are consistent with an early nested case-control study in NHS and NHSII, where early life and adolescence (age 5–15 years) exposures to UV were associated with a lower risk of MS; these inverse associations were attenuated in models examining UV at age 30.41 Additionally, we found that July temperature, which was less correlated to latitude compared with annual mean temperature (Supplemental Table S3; http://links.lww.com/EE/A96), was more strongly associated with MS risk. Given the complex relationship between temperature, UV, and latitude, studies with larger sample sizes to examine potential mediating effects and to model all three exposures simultaneously are warranted.
There is biologic plausibility for the association between temperature and MS risk. Sun et al. suggested long-term heat acclimatization as one of the potential factors for lower risk of MS in warmer regions as opposed to acute heat-related risks such as heatwaves, which might increase MS-related mortality.42 The same study also found temperature, rather than sun hours or solar radiation, to be more explanatory of the three-fold increase in MS-related mortality from south to north; which supports our findings. Other epidemiologic studies suggest that the effect of temperature on autoimmunity could be explained by the gut microbiome, where higher temperature is associated with a more diverse microbiome, which in turn has a protective effect against autoimmune attacks (hygiene hypothesis).43 Further studies elucidating potential mechanisms by which the human microbiome may impact MS are needed.44
Although this study was novel, it has several limitations to consider. Given the high correlation between latitude and the measures of temperature and eUV, we were unable to simultaneously model all three exposures to ascertain the effects of temperature or eUV or temperature separate from latitude. In models adjusting for UV exposure during adolescence, results were attenuated, suggesting that findings from models not adjusted for time-varying latitude may be confounded. Additionally, due to the availability of eUV data, we were only able to examine the impacts of annual and peak eUV on MS incidence. This does not allow us to determine the impact of winter UV, and related biologic mechanisms, on MS incidence. Only a subset of participants from both cohorts (n = 93) was enrolled in a nested case-control study which showed that previous Epstein-Barr virus (EBV) infections as an MS risk factor. Information about EBV infection, which might have a geographic pattern, is unknown for the remaining participants.36 These unknown geographic patterns may confound our associations in either direction, although it is unlikely that the confounding patterns would be different for temperature and eUV. Infectious mononucleosis, a marker of late infection with EBV, was asked only on the NHSII questionnaire in 2001. Other potential confounders that may have impacted exposures include time-activity patterns or behavioral adaptations such as air conditioning usage or sun exposure behaviors were unmeasured. Our use of missing indicator variables, instead of imputation or complete case methods, may have induced some bias,45,46 especially for supplement use, where there was a high proportion of missing information. Lastly, our study only looked at environmental exposures later in life, whereas early-life exposures might play critical roles in triggering or protecting against autoimmune attacks, as in the case for UV discussed above.
Strengths of our study include high temporal and spatial resolution of the exposure models, which should minimize exposure measurement error. Our 1-km eUV model is updated annually, and the PRISM climate model accounts for altitude and multiple surrounding weather stations instead of only using the nearest station and is updated monthly at an 800-m spatial scale. Importantly, even though UV and temperature are highly correlated, we were able to examine models including both, providing evidence to suggest that temperature may be a novel risk factor independent of UV. Lastly, the wealth of time-varying information in the NHS and NHSII cohorts (including latitude at age 15) allowed us to control for many known risk factors for MS.
Ambient temperature might be one of the missing pieces in the overall picture of latitude and autoimmunity, as evidenced in our study. Further investigations should attempt to elucidate this statistical association on a more mechanistic level; whereas epidemiologists should continue to explore associations between temperature and other autoimmune conditions, especially in cohorts with the ability to explore latitude, temperature, and UV simultaneously.
Acknowledgments
The NHS cohort is supported by NIH/NCI UM1 CA186107. NHSII is supported by NIH/NCI U01 CA176726 and NIH/NHLBI U01 HL145386. Dr. Hart and Dr. Laden were supported by P30 ES000002, and Dr. VoPham was supported by T32 CA009001.
The authors declare that they have no conflicts of interest with regard to the content of this report.
Process to obtain data and code: Code can be obtained from the corresponding author, the process to access NHS and NHSII data are available at https://www.nurseshealthstudy.org/researchers
Supplementary Material
Footnotes
Published online 6 July 2020
SDC Supplemental digital content is available through direct URL citations in the HTML and PDF versions of this article (www.environepidem.com).
References
- 1.Hernandez AL, O’Connor KC, Hafler DA. Rose NR, Mackay IR. Multiple sclerosis. The Autoimmune Diseases. 2014, Amsterdam, The Netherlands: Elseview [Google Scholar]
- 2.Berg-Hansen P, Moen SM, Harbo HF, Celius EG. High prevalence and no latitude gradient of multiple sclerosis in Norway. Mult Scler. 2014; 20:1780–1782 [DOI] [PubMed] [Google Scholar]
- 3.Islam T, Gauderman WJ, Cozen W, Hamilton AS, Burnett ME, Mack TM. Differential twin concordance for multiple sclerosis by latitude of birthplace. Ann Neurol. 2006; 60:56–64 [DOI] [PubMed] [Google Scholar]
- 4.Tao C, Simpson S, Jr, van der Mei I, et al. ; MSBase Study Group. Higher latitude is significantly associated with an earlier age of disease onset in multiple sclerosis. J Neurol Neurosurg Psychiatry. 2016; 87:1343–1349 [DOI] [PubMed] [Google Scholar]
- 5.Simpson S, Jr, Wang W, Otahal P, Blizzard L, van der Mei IAF, Taylor BV. Latitude continues to be significantly associated with the prevalence of multiple sclerosis: an updated meta-analysis. J Neurol Neurosurg Psychiatry. 2019; 90:1193–1200 [DOI] [PubMed] [Google Scholar]
- 6.Alonso A, Hernán MA. Temporal trends in the incidence of multiple sclerosis: a systematic review. Neurology. 2008; 71:129–135 [DOI] [PMC free article] [PubMed] [Google Scholar]
- 7.Hernán MA, Olek MJ, Ascherio A. Geographic variation of MS incidence in two prospective studies of US women. Neurology. 1999; 53:1711–1718 [DOI] [PubMed] [Google Scholar]
- 8.Dalla Costa G, Giordano A, Romeo M, Sangalli F, Comi G, Martinelli V. Digital epidemiology confirms a latitude gradient of MS in France. Mult Scler Relat Disord. 2018; 20:129–131 [DOI] [PubMed] [Google Scholar]
- 9.Dobson R, Giovannoni G, Ramagopalan S. The month of birth effect in multiple sclerosis: systematic review, meta-analysis and effect of latitude. J Neurol Neurosurg Psychiatry. 2013; 84:427–432 [DOI] [PubMed] [Google Scholar]
- 10.Fitzgerald KC, Munger KL, Köchert K, et al. Association of Vitamin D levels with multiple sclerosis activity and progression in patients receiving interferon Beta-1b. JAMA Neurol. 2015; 72:1458–1465 [DOI] [PubMed] [Google Scholar]
- 11.Lucas RM, Byrne SN, Correale J, Ilschner S, Hart PH. Ultraviolet radiation, vitamin D and multiple sclerosis. Neurodegener Dis Manag. 2015; 5:413–424 [DOI] [PubMed] [Google Scholar]
- 12.Pierrot-Deseilligny C, Souberbielle JC. Vitamin D and multiple sclerosis: An update. Mult Scler Relat Disord. 2017; 14:35–45 [DOI] [PubMed] [Google Scholar]
- 13.Belbasis L, Bellou V, Evangelou E, Ioannidis JP, Tzoulaki I. Environmental risk factors and multiple sclerosis: an umbrella review of systematic reviews and meta-analyses. Lancet Neurol. 2015; 14:263–273 [DOI] [PubMed] [Google Scholar]
- 14.Bjørnevik K, Riise T, Casetta I, et al. Sun exposure and multiple sclerosis risk in Norway and Italy: The EnvIMS study. Mult Scler. 2014; 20:1042–1049 [DOI] [PubMed] [Google Scholar]
- 15.McDowell TY, Amr S, Langenberg P, et al. Time of birth, residential solar radiation and age at onset of multiple sclerosis. Neuroepidemiology. 2010; 34:238–244 [DOI] [PMC free article] [PubMed] [Google Scholar]
- 16.Wallin MT, Page WF, Kurtzke JF. Multiple sclerosis in US veterans of the Vietnam era and later military service: race, sex, and geography. Ann Neurol. 2004; 55:65–7114705113 [Google Scholar]
- 17.Ascherio A. Environmental factors in multiple sclerosis. Expert Rev Neurother. 2013; 1312 suppl3–9 [DOI] [PubMed] [Google Scholar]
- 18.Olsson T, Barcellos LF, Alfredsson L. Interactions between genetic, lifestyle and environmental risk factors for multiple sclerosis. Nat Rev Neurol. 2017; 13:25–36 [DOI] [PubMed] [Google Scholar]
- 19.Tarlinton RE, Khaibullin T, Granatov E, Martynova E, Rizvanov A, Khaiboullina S. The interaction between viral and environmental risk factors in the pathogenesis of multiple sclerosis. Int J Mol Sci. 2019; 20:303. [DOI] [PMC free article] [PubMed] [Google Scholar]
- 20.Disanto G, Pakpoor J, Morahan JM, et al. Epstein-Barr virus, latitude and multiple sclerosis. Mult Scler. 2013; 19:362–365 [DOI] [PubMed] [Google Scholar]
- 21.Marino FE. Heat reactions in multiple sclerosis: an overlooked paradigm in the study of comparative fatigue. Int J Hyperthermia. 2009; 25:34–40 [DOI] [PubMed] [Google Scholar]
- 22.Smedal T, Myhr KM, Aarseth JH, et al. The influence of warm versus cold climate on the effect of physiotherapy in multiple sclerosis. Acta Neurol Scand. 2011; 124:45–52 [DOI] [PubMed] [Google Scholar]
- 23.Roberg BL, Bruce JM. Reconsidering outdoor temperature and cognition in multiple sclerosis. Mult Scler. 2016; 22:694–697 [DOI] [PubMed] [Google Scholar]
- 24.Stellmann JP, Young KL, Vettorazzi E, Pöttgen J, Heesen C. No relevant impact of ambient temperature on disability measurements in a large cohort of patients with multiple sclerosis. Eur J Neurol. 2017; 24:851–857 [DOI] [PubMed] [Google Scholar]
- 25.Bao Y, Bertoia ML, Lenart EB, et al. Origin, methods, and evolution of the three nurses’ health studies. Am J Public Health. 2016; 106:1573–1581 [DOI] [PMC free article] [PubMed] [Google Scholar]
- 26.Colditz GA, Manson JE, Hankinson SE. The Nurses’ Health Study: 20-year contribution to the understanding of health among women. J Womens Health. 1997; 6:49–62 [DOI] [PubMed] [Google Scholar]
- 27.Morabia A. 120 000 nurses who shook public health. Am J Public Health. 2016; 106:1528–1529 [DOI] [PMC free article] [PubMed] [Google Scholar]
- 28.Ascherio A, Munger KL, Lennette ET, et al. Epstein-Barr virus antibodies and risk of multiple sclerosis: a prospective study. JAMA. 2001; 286:3083–3088 [DOI] [PubMed] [Google Scholar]
- 29.Palacios N, Munger KL, Fitzgerald KC, et al. Exposure to particulate matter air pollution and risk of multiple sclerosis in two large cohorts of US nurses. Environ Int. 2017; 109:64–72 [DOI] [PMC free article] [PubMed] [Google Scholar]
- 30.Poser CM, Paty DW, Scheinberg L, et al. New diagnostic criteria for multiple sclerosis: guidelines for research protocols. Ann Neurol. 1983; 13:227–231 [DOI] [PubMed] [Google Scholar]
- 31.McDonald WI, Compston A, Edan G, et al. Recommended diagnostic criteria for multiple sclerosis: guidelines from the International Panel on the diagnosis of multiple sclerosis. Ann Neurol. 2001; 50:121–127 [DOI] [PubMed] [Google Scholar]
- 32.Polman CH, Reingold SC, Edan G, et al. Diagnostic criteria for multiple sclerosis: 2005 revisions to the “McDonald criteria”. Ann Neurol. 2005; 58:840–846 [DOI] [PubMed] [Google Scholar]
- 33.PRISM Climate Group
- 34.Spangler KR, Weinberger KR, Wellenius GA. Suitability of gridded climate datasets for use in environmental epidemiology. J Expo Sci Environ Epidemiol. 2019; 29:777–789 [DOI] [PMC free article] [PubMed] [Google Scholar]
- 35.VoPham T, Hart JE, Bertrand KA, Sun Z, Tamimi RM, Laden F. Spatiotemporal exposure modeling of ambient erythemal ultraviolet radiation. Environ Health. 2016; 15:111. [DOI] [PMC free article] [PubMed] [Google Scholar]
- 36.Ascherio A, Munger KL. Epidemiology of multiple sclerosis: from risk factors to prevention-an update. Semin Neurol. 2016; 36:103–114 [DOI] [PubMed] [Google Scholar]
- 37.Hernán MA, Olek MJ, Ascherio A. Cigarette smoking and incidence of multiple sclerosis. Am J Epidemiol. 2001; 154:69–74 [DOI] [PubMed] [Google Scholar]
- 38.Cochran WG. The comparison of percentages in matched samples. Biometrika. 1950; 37:256–266 [PubMed] [Google Scholar]
- 39.Ha-Vinh P, Nauleau S, Clementz M, Régnard P, Sauze L, Clavaud H. Geographic variations of multiple sclerosis prevalence in France: the latitude gradient is not uniform depending on the socioeconomic status of the studied population. Mult Scler J Exp Transl Clin. 2016; 2:2055217316631762. [DOI] [PMC free article] [PubMed] [Google Scholar]
- 40.Simpson S, Jr, van der Mei I, Lucas RM, et al. ; Ausimmune/AusLong Investigators Group. Sun exposure across the life course significantly modulates early multiple sclerosis clinical course. Front Neurol. 2018; 9:16. [DOI] [PMC free article] [PubMed] [Google Scholar]
- 41.Tremlett H, Zhu F, Ascherio A, Munger KL. Sun exposure over the life course and associations with multiple sclerosis. Neurology. 2018; 90:e1191–e1199 [DOI] [PMC free article] [PubMed] [Google Scholar]
- 42.Sun H. Temperature dependence of multiple sclerosis mortality rates in the United States. Mult Scler. 2017; 23:1839–1846 [DOI] [PubMed] [Google Scholar]
- 43.Aamodt G, Bengtson MB, Vatn MH. Can temperature explain the latitudinal gradient of ulcerative colitis? Cohort of Norway. BMC Public Health. 2013; 13:530. [DOI] [PMC free article] [PubMed] [Google Scholar]
- 44.Chu F, Shi M, Lang Y, et al. Gut microbiota in multiple sclerosis and experimental autoimmune encephalomyelitis: current applications and future perspectives. Mediators Inflamm. 2018; 2018:8168717. [DOI] [PMC free article] [PubMed] [Google Scholar]
- 45.Groenwold RH, Donders AR, Roes KC, Harrell FE, Jr, Moons KG. Dealing with missing outcome data in randomized trials and observational studies. Am J Epidemiol. 2012; 175:210–217 [DOI] [PubMed] [Google Scholar]
- 46.Knol MJ, Janssen KJ, Donders AR, et al. Unpredictable bias when using the missing indicator method or complete case analysis for missing confounder values: an empirical example. J Clin Epidemiol. 2010; 63:728–736 [DOI] [PubMed] [Google Scholar]
Associated Data
This section collects any data citations, data availability statements, or supplementary materials included in this article.


