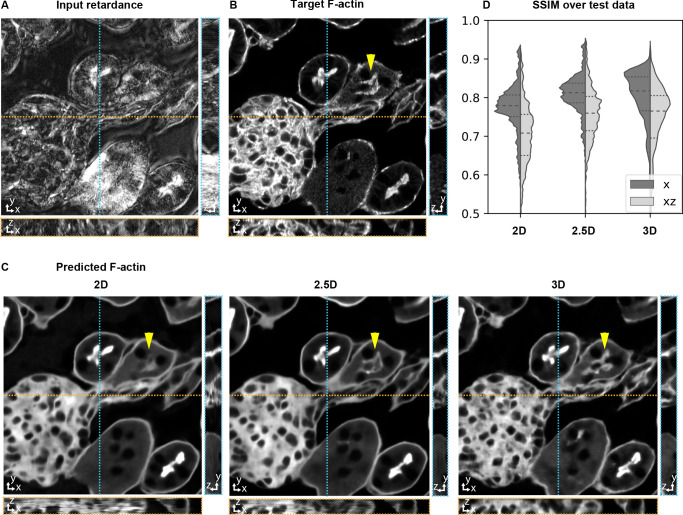
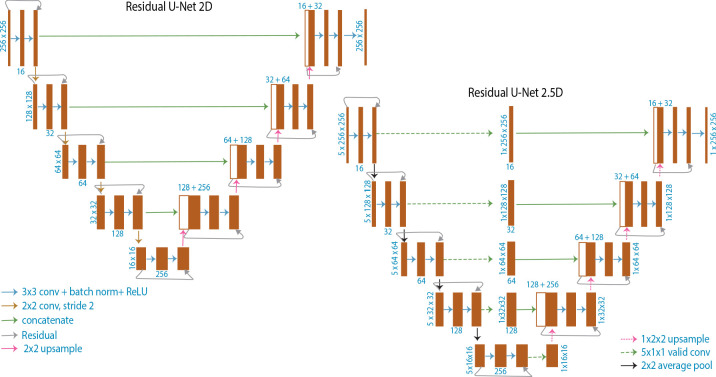
Figure 3. Accuracy of 3D prediction with 2D, 2.5D, and 3D U-Nets.
Orthogonal sections (XY - top, XZ - bottom, YZ - right) of a glomerulus and its surrounding tissue from the test set are shown depicting (A) retardance (input image), (B) experimental fluorescence of F-actin stain (target image), and (C) Predictions of F-actin (output images) using the retardance image as input with different U-Net architectures. (D) Violin plots of structral-similarty metric (SSIM) between images of predicted and target stain in XY and XZ planes. The horizontal dashed lines in the violin plots indicate 25th quartile, median, and 75th quartile of SSIM. The yellow triangle in C highlights a tubule structure, whose prediction can be seen to improve as the model has access to more information along Z. The same field of view is shown in Figure 3—video 1, Figure 3—video 2, and Figure 4—video 1.


