

Abstract
Background
The SF-36 is widely used to evaluate the health-related quality of life of patients with musculoskeletal tumors. The minimum clinically important difference (MCID) is useful for interpreting changes in functional scores because it defines the smallest change each patient may perceive. Since the MCID is influenced by the population characteristics, MCIDs of the SF-36 should be defined to reflect the specific conditions of orthopaedic oncology patients.
Questions/purposes
(1) What is the MCID of SF-36 physical component summary (PCS) and mental component summary (MCS) scores in patients with orthopaedic oncologic conditions when calculated with distribution-based methods? (2) What is the MCID of SF-36 PCS and MCS scores in patients with orthopaedic oncologic conditions when calculated by anchor-based methods?
Methods
Of all 960 patients who underwent surgery from 1999 to 2005, 32% (310) of patients who underwent musculoskeletal oncologic surgery and completed two surveys during postoperative follow-up were reviewed. We evaluated a dataset that ended in 2005, completing follow-up of data accrued as part of the cooperative effort between the American Academy of Orthopaedic Surgeons and the Council of Musculoskeletal Specialty Societies to create patient reported quality of life instruments for lower extremity conditions. This effort, started in 1994 was validated and widely accepted by its publication in 2004. We believe the findings from this period are still relevant today because (1) this critical information has never been available for clinicians and researchers to distinguish real differences in outcome among orthopaedic oncology patients, (2) the SF-36 continues to be the best validated and widely used instrument to assess health-related quality of life, and unfortunately (3) there has been no significant change in outcome for oncology patients over the intervening years. SF-36 PCS and MCS are aggregates of the eight scale scores specific to physical and mental dimension (scores range from 0 to 100, with higher scores representing better health). Their responsiveness has been shown postoperatively for several surgical procedures (such as, colorectal surgery). Two different methods were used to calculate the MCID: the distribution-based method, which was based on half the SD of the change in score and standard error of the measurement at baseline, and anchor-based, in which a receiver operating characteristic (ROC) curve analysis was performed. The anchor-based method uses a plain-language question to ask patients how their individual conditions changed when compared with the previous survey. Answer choices were “much better,” “somewhat better,” “about the same,” “somewhat worse,” or “much worse.” The ROC curve-derived MCIDs were defined as the change in scores from baseline, with sensitivity and specificity to detect differences in patients who stated their outcome was, about the same and those who stated their status was somewhat better or somewhat worse. This approach is based on each patient’s perception. It considers that the definition of MCID is the minimal difference each patient can perceive as meaningful.
Results
Using the distribution-based method, we found that the MCIDs of the PCS and MCS were 5 and 5 by half the SD, and 6 and 5 by standard error of the measurement. In the anchor-based method, the MCIDs of the PCS and MCS for improvement/deterioration were 4 (area under the curve, 0.82)/-2 (area under the curve, 0.79) and 4 (area under the curve, 0.72)/ (area under the curve, 0.68), respectively.
Conclusions
Since both anchor-based and distribution-based MCID estimates of the SF-36 in patients with musculoskeletal tumors were so similar, we have confidence in the estimates we made, which were about 5 points for both the PCS and the MCS subscales of the SF-36. This suggests that interventions improving SF-36 by less than that amount are unlikely to be perceived by patients as clinically important. Therefore, those interventions may not justify exposing patients to risk, cost, or inconvenience. When applying new interventions to orthopaedic oncology patients going forward, it will be important to consider these MCIDs for evaluation purposes.
Level of Evidence
Level III, diagnostic study.
Introduction
Because patients with sarcomas have improved survival postoperatively, there has been increased attention on functional outcomes and health-related quality of life (HRQoL) after treatment of this disease. Accordingly, the number of publications on HRQoL after surgery for bone and soft-tissue sarcoma has increased [11, 20, 21, 32]. Several measures have been used to evaluate patients with sarcomas, including disease-specific measures such as the Musculoskeletal Tumor Society score [17, 22, 38] and the Toronto Extremity Salvage Score [1, 16, 31]. These patients have also been evaluated using more generic instruments such as the SF-36 [8] and Patient-reported Outcomes Measurement Information System [10, 18, 34].
The SF-36 is the most widely used generic questionnaire to evaluate comprehensively HRQoL, and understanding the clinical importance of the change in scores is essential in the assessment of HRQoL [27, 28]. However, to the best of our knowledge, the minimum clinically important difference (MCID), defined as the smallest change that a patient can perceive as being meaningful, has not been determined in patients with orthopaedic oncologic conditions.
We therefore asked: (1) What is the MCID of the SF-36 physical component summary (PCS) and mental component summary (MCS) scores in patients with orthopaedic oncologic conditions when calculated with distribution-based methods? (2) What is the MCID of SF-36 PCS and MCS scores in patients with orthopaedic oncologic conditions when calculated by anchor-based methods?
Patients and Methods
Study Design and Setting
The study was performed at a single institution. We implemented the Musculoskeletal Outcomes Data Evaluation and Management System (MODEMS) instrument, which combines multiple outcomes instruments, including the SF-36, as part of our institutional clinical assessment of all patients. This was in accordance with the developed and validated instrument from the American Academy of Orthopaedic Surgeons that was endorsed by the Musculoskeletal Tumor Society (MSTS) [23]. The non-tumor data was assembled and culminated in the 2004 publication by Johanson et al. [23]. The tumor data, plus 1-year follow-up visit data collection was completed in 2005 and form the basis of this report.
The analysis reported in this study was approved by our institutional review board (protocol number 16-913).
Participants
All patients who underwent surgery and were evaluated for HRQoL using the MODEMS instrument at 3 months and then every 6 months after surgery from 1999 to 2005 (n = 960) (Fig. 1). We believe the findings from this period are still relevant today because (1) this critical information has never been available for clinicians and researchers to distinguish real differences in outcome among orthopaedic oncology patients, (2) the SF-36 continues to be the best validated and widely used instrument to assess health related quality of life, and (3) there has been no significant change in outcome for oncology patients over the intervening years.
Fig. 1.
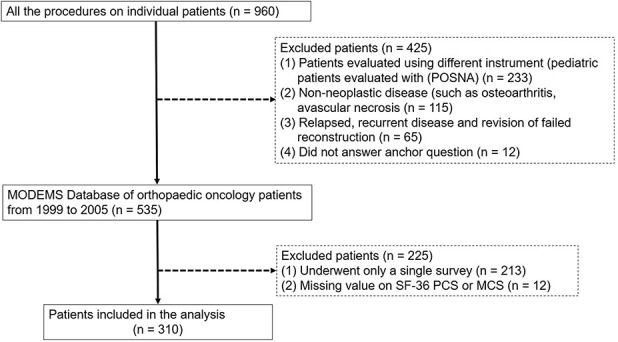
This STROBE flow diagram shows how patients were identified to be eligible for analysis.
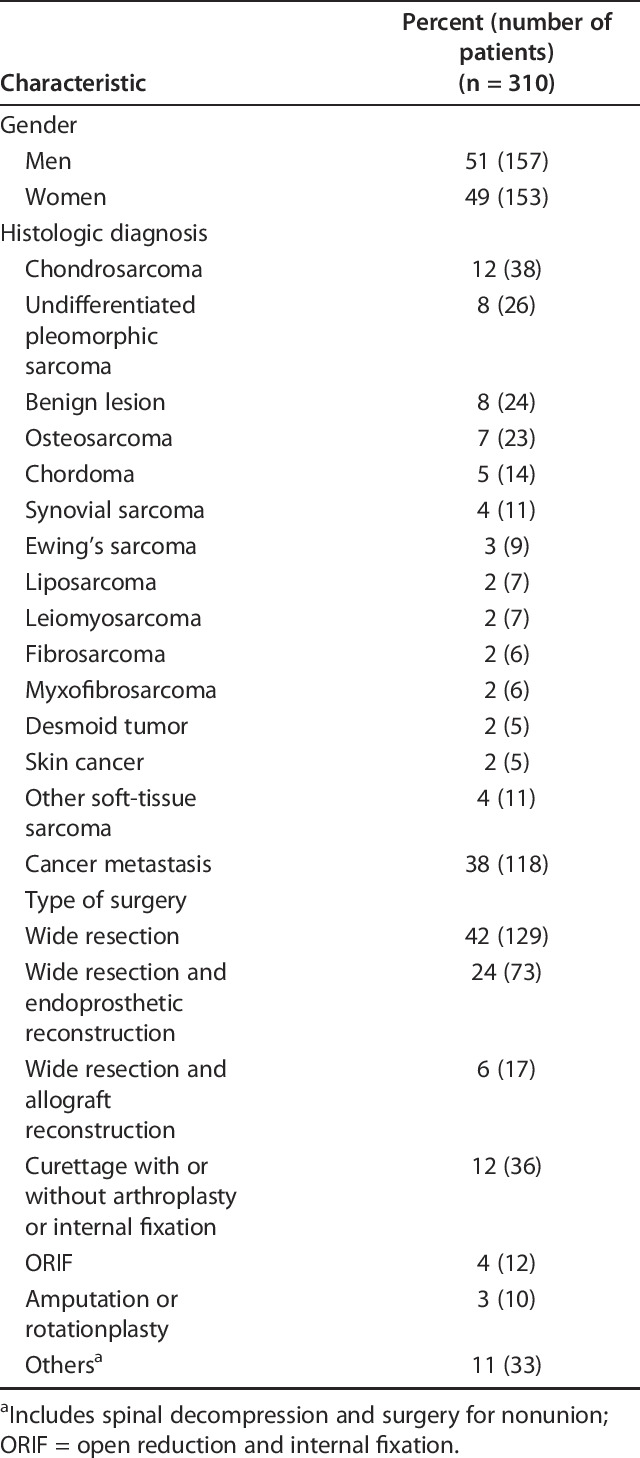
All patients who underwent surgery and were evaluated for HRQoL using the MODEMS instrument at 3 months and then every 6 months after surgery from 1999 to 2005 (n = 960). Of the original 960 patients, we excluded patients evaluated using different instrument (pediatric patients evaluated with the Pediatric Orthopaedic Society of North America [POSNA] Pediatric Musculoskeletal Functional Health Questionnaire, n = 233) [14], patients with non-neoplastic disease (such as, osteoarthritis, avascular necrosis, n = 115), patients with relapsed, recurrent disease and revision of failed reconstruction (n = 65), and patients who did not answer the anchor question (n = 12). Then, we created a MODEMS Database of orthopaedic oncology patients from 1999 to 2005 (n = 535). Of these, we excluded patients with no follow-up data (patients completed only a single survey, n = 213; these were overwhelmingly pathologic fracture patients), or those with insufficient HRQoL data (missing value on SF-36 PCS or MCS or anchor question, n = 12). During this time, only two patients refused to participate, and there was a 95% completion rate for answering the questions. This was in large part due to one author (ZN) personally delivering the questionnaires to patients who had ample time to complete the questionnaire. After accounting for these exclusions, 310 patients were included in the analysis. The mean (range) age of the patients was 54 years (14 to 87). At each follow-up survey, information was provided to the participants regarding the purposes and methods of the MODEMS instrument. Of the participants, 157 were men and histologic diagnosis varied (Table 1).
Table 1.
Patient demographics
For the required sample size to calculate MCIDs, we confirmed the validity of the number of patients included in our retrospective database. We followed the COnsensus-based Standards for the selection of health status Measurement INstruments (COSMIN) checklist, which is the standard to study the psychometric property of HRQoL measures. COSMIN considers a sample size of 50 patients as good and 100 as excellent [37]. If differences between changes in subgroups are evaluated as evidence for responsiveness or MCID, subgroups of at least 30 patients are recommended [37]. Although our cohort meets the COSMIN requirement, to reinforce our statistical strategy, we performed power analysis to determine the required sample size in the following conditions using R version 3.6.2 (R Foundation for Statistical Computing, Vienna, Austria): Type I error (α, significance) = 0.05, Type II error (β, 1-power) = 0.10, area under receiver operating characteristic (ROC) curve = 0.80, ratio of sample sized in negative/positive groups = 2, one-sided test. The required number of patients was computed as 31 patients (number of positive and negative patient, 10 and 21, respectively), suggesting our sample size was sufficient for calculating MCID.
Description of Experiment, Treatment, or Surgery
All patients who underwent surgery were evaluated for HRQoL using the MODEMS instrument every 6 months after surgery. Although some patients responded to surveys at multiple time points, we used the only first two surveys for calculating the MCIDs. Using multiple surveys in the same patient will bias the MCIDs by the specific patient characteristics. Also it is not common to use data from multiple surveys in the same patients for calculating MCID, as indicated in previous studies. At each follow-up evaluation, we gave patients an anchor question scored on a 5-point scale asking about changes in general health associated with each patient’s disease compared with the previous questionnaire: “Compared to when you last completed this questionnaire, is your musculoskeletal condition, ‘much better,’ ‘somewhat better,’ ‘about the same,’ ‘somewhat worse,’ or ‘much worse’.” The response to this question was based on each patient’s perception and was useful for calculating the receiver operating characteristic (ROC) curve-derived MCIDs, which were defined as the change in scores from baseline, with sensitivity and specificity to detect differences in patients who stated their outcome was about the same and those who stated their status was somewhat better/worse, which we believe has adequate face validity for the purpose.
As this study is retrospective in nature, the follow-up surveys were not received or examined at consistent timepoints. The first point was within the early follow-up period (< 6 months), while the second time point was after completion of therapy (such as, chemotherapy) and stabilization of their recovery. Typically, this was from 1 to 2 years after surgery for patients in our study.
We used the first and second survey for calculating the MCIDs. Although some patients responded to surveys at multiple points, we used the only first two surveys. Using multiple surveys in the same patient will bias the MCIDs by the specific patient characteristics. Also, it is not common to use data from multiple surveys in the same patients for calculating MCIDs, as indicated in previous studies [5, 7, 25, 36, 39, 41].
Variables, Outcome Measures, Data Sources, and Bias
We used the MODEMS instrument, which incorporates components from the SF-36 (v1, 4-week recall) and other postoperative functional and HRQoL parameters. The SF-36 measures health on eight multi-item dimensions covering functional status, wellbeing, and overall evaluation of health (physical functioning, role-physical, bodily pain, general health, vitality, social functioning, role-emotional, and mental health) [8]. Component analyses showed that there are two distinct concepts measured by the SF-36: a physical dimension, represented by the PCS, and a mental dimension, represented by the MCS [2]. The advantages of using the PCS and MCS scores rather than the eight scale scores include smaller confidence intervals and smaller floor and ceiling effects. Patients were asked to rate their responses on a 2-, 3-, 5-, or 6-point Likert scale. For each dimension, item scores were calculated, summed, and transformed to a scale ranging from 9 (worst health) to 100 (best health). The PCS and MCS are aggregates of the eight scale scores that account for more than 80% of the reliable variance in the scales. The PCS and MCS range from 0 to 100, with higher scores representing better health. The SF-36 has shown good responsiveness in the postoperative course after several operative procedures, including THA, abdominal aortic aneurysm repair and thoracotomy. Mangione et al. [3, 29] reported that patients scored worse SF-36 scores 1 month after elective surgery. Most patients experienced gains in most dimensions of health in their early postoperative phase (by 6 months), and these gains were sustained at 12 months after surgery. These results suggested the times adopted in our study were appropriate (early follow-up period, 3 to 6 months after surgery, and after completion of therapy and stabilization of each patient’s recovery, 1 to 2 years after surgery).
Calculation of the MCID
The MCID is used in clinical trials to help readers and patients interpret whether the effect size associated with treatment is a sample large enough to justify the risk, pain, cost, or inconvenience of the treatment [27, 28]. In general, the MCID can be calculated using either a distribution-based or an anchor-based method. The distribution-based approach uses the distributional characteristics of the sample and determines observed variation using a standardized metric, such as the SD, effect size, or standard error of measurement (SEM). Calculating the MCID using half the SD and SEM is widely used; they have been shown to correspond to the MCID across studies [9, 30]. The reason for using this strategy is that it determines the degree that change from baseline to different timepoints exceeds what would be expected from chance alone. However, the disadvantages of using the distribution-based approach are that (1) it does not provide any reasonable indication of why the observed change is important, (2) the statistical approach does not consider the core concept of the MCID’s clinical importance, and (3) these methods are sample-specific; findings will vary based on sample size and distribution.
The anchor-based approach uses an external criterion, or anchor, to determine an important improvement or decline in condition, as considered by patients and clinicians. Anchor-based methods examine which changes in each measurement instrument correspond with a minimal important change defined by the anchor. The minimal importance is clearly defined and used. The major detriment of this method, however, is that a global assessment scale may not necessarily be valid. It may be prone to recall bias. Also, it may not be appropriate for all categories of multidimensional HRQoL scores, such as physical and mental dimensions. Because the MCID is a construct that is only approximated by a variety of current methods, such as distribution-n or anchor-based methods, improvement and standardization of using the MCID for oncology patients is needed. Crosby et al. [13] suggested combining the anchor-based and distribution-based methods to examine an external criterion and a measure of variability and to compensate for the disadvantages of each method. In this study, we combined distribution-based and anchor-based methods to determine the MCIDs of the SF-36 PCS and MCS scores after surgical treatment of musculoskeletal tumors. With the heterogeneity of orthopaedic conditions in mind, we reported MCIDs of SF-36 specific to orthopaedic oncology patients according to the severity of the HRQoL and diagnosis (primary tumor versus metastatic tumor) to form more homogeneous groups and try to determine MCID for each group separately, as well as those for our overall patient population. The cutoff values of severity of PCS and MCS was based on the median scores, defined as 40 and 50, respectively.
Distribution-based Methods
We calculated MCIDs using two different statistical characteristics of the distribution of the scores at baseline. First, we determined MCIDs by the half-SD method, in which the minimum change is considered as half the SD of change in scores [30]. Second, we estimated the minimum amount of change potentially detectable using the SEM. The SEM was calculated using the following formula, in which SD stands for the SD of baseline scores and R stands for the reliability coefficient:
SEM = SD x SQRT (1-R)
For the reliability coefficient, 0.90 was used for both the SF-36 PCS and MCS scores in accordance with previous reports [5, 40].
Anchor-based Method
The anchor-based method was used to determine cutoff values for MCIDs based on the answer to each anchor question, which is the gold standard for assessing the change in a patient’s condition. An ROC curve analysis for the change in SF-36 PCS and MCS scores between the two surveys was performed to determine a discrete value for the MCID by evaluating a threshold (Δ) of the SF-36 PCS and MCS scores that showed the smallest difference between sensitivity and specificity. The ROC curve-derived MCIDs were defined as the change in scores from baseline, with sensitivity and specificity to detect differences in patients who stated their outcome was about the same and those who stated their status was somewhat better. The discriminative ability of the model was assessed using the area under the ROC curve.
Statistical Analysis
Statistical analyses were conducted using IBM SPSS version 18.0 (IBM Corp, Armonk, NY, USA). Scores were reported as the mean ± SD. The area under the curve provides a measure of accuracy and was interpreted as defined previously: 0.9 to 1.0, excellent; 0.8 to 0.9, good; 0.6 to 0.8, fair; and 0.5 to 0.6, poor [19].
The baseline SF-36 scores, distribution of answers to each anchor question, and change in SF-36 scores (follow-up score minus the baseline score) varied. The mean changes in the PCS and MCS scores were 10 and 11, respectively. Based on the anchor question, most patients answered either about the same (40%, 123 of 310) or improved (41%, 126 of 310), which included much better or somewhat better. The relationship between the change in SF-36 scores and answers to the anchor question demonstrates a positive correlation between the change in PCS and MCS scores and patient-reported change in their disease (Fig. 2A-B).
Fig. 2 A-B.
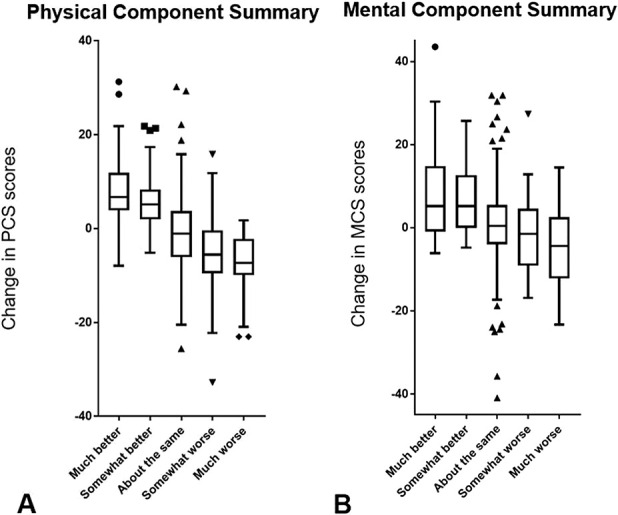
These box-and-whisker plots demonstrate the relationship between change in the SF-36 (A) PCS and (B) MCS scores and answers to the anchor question.
Results
Distribution-based MCIDs in Patients with Orthopaedic Oncologic Conditions
Using distribution-based methods, we found that the MCIDs of the PCS and MCS were 5 and 5, respectively, based on the half SD, and 6 and 5, respectively, based on the SEM (Table 2). According to the distribution-based methods, impacts of severity and diagnosis on MCIDs were minimal both for PCS and MCS with the values being similar (Table 3).
Table 2.
MCID of SF-36 PCS and MCS scores for overall patients

Table 3.
MCID of SF-36 PCS and MCS scores according to severity and diagnosis

Anchor-based MCIDs in Patients with Orthopaedic Oncologic Conditions
Using the anchor-based method, we found the discrete MCID values of the PCS and MCS for improvement and deterioration that yielded the smallest difference between sensitivity and specificity were 4/4 and -2/-6, respectively. The areas under the curve in the ROC analysis for improvement were 0.82 (95% CI 0.77 to 0.87; p < 0.001) for PCS, and 0.72 (95% CI 0.66 to 0.77; p < 0.001) for MCS. The areas under the curve for deterioration were 0.79 (95% CI 0.75 to 0.86; p < 0.001) for PCS and 0.68 (95% CI 0.63 to 0.73; p < 0.001) for MCS (Fig. 3A-B). This suggested the model had good discriminative ability. For PCS, 74% of better, 26% of about the same, and 6.6% of worse groups were above MCID value. For MCS, 62% of better, 29% of about the same, and 25% of worse groups were above MCID value.
Fig. 3 A-B.

These receiver operating characteristic curve plots the true-positive rate (sensitivity) against the false-positive rate (1: specificity) for the SF-36 PCS (blue line) and MCS (red line) (A) for improvement and (B) deterioration.
When comparing primary tumor and metastatic tumor groups, patients with primary tumor required more change of score to perceive improvement of physical function (MCIDs of PCS, 4 versus 2) while patients with metastatic tumor required less change of score to perceive deterioration of physical function (MCIDs of PCS, -2 versus -6). In addition, as expected, patients with high baseline PCS score required more change of score to perceive improvement of physical function compared with those with low baseline score (MCIDs of PCS, 4 versus 2). Patients with metastatic tumor required more change of score to perceive improvement/deterioration of mental status when compared with primary tumor (MCIDs of MCS, 4 versus 2 for improvement and -3 versus -2 for deterioration). In addition, as expected, patients with high baseline MCS score required more change of score to perceive improvement of mental status compared with those with low baseline score (MCIDs of MCS, 4 versus 3).
Discussion
There has been growing interest in functional outcomes and HRQoL after surgery for orthopaedic oncologic conditions. The SF-36 is a widely-used generic measure for globally assessing HRQoL [6, 35], commonly used clinically for patient-centered outcome assessments [15, 26, 33]. It is difficult to interpret the clinical importance of changes in scores without the perspective given by guiding metrics such as the MCID. Psychometric evaluation (reliability, validity, responsiveness, or MCID) of patient-reported outcome measures (PROMs) should be tailored to the specific patient population in question, such as patients with different backgrounds or disease conditions. Although the SF-36 is the most widely used and validated HRQoL, it still needs to have its disease-specific MCID established. The HRQoL profile of orthopaedic oncology patients differs from that of patients with benign orthopaedic diseases. It is widely known that HRQoL domains exhibit differences based on the cancer type and organs involved, yet musculoskeletal oncology patients have not been analyzed [27, 28]. We found that MCID estimates of the SF-36 in patients with musculoskeletal tumors were about 5 points for both the PCS and the MCS subscales of the SF-36 and were applicable to patients with primary and metastatic disease. Interventions that improve the SF-36 by less than that amount are unlikely to be perceived by patients as clinically important.
Limitations
Our study has several limitations. First, our patients were surveyed from 1999 to 2005, raising the possibility of non-contemporaneous bias and results that are out of date. However, this is unlikely to be the case since there has been little or no substantial change in the standard of care or outcomes for sarcoma patients since the study period began. Therefore, we believe the results remain applicable to todays’ patients as it does to this population [24].
Second, our patients may not encompass the whole spectrum of oncology patients due to the heterogeneity of diagnoses and the diverse range of treatments. This is a common problem in studies of patients treated for bone and soft-tissue sarcoma. Patients with different levels of function at presentation were included in the analysis, and our findings may not be generalized to patients who had tumor surgery in other centers around the world. Notably, children were excluded from this analysis, so the findings may not be applied to them. By analyzing the data based on the severity of disease (primary versus secondary disease) and HRQoL, we separated the patients into the two major, more homogeneous groups. This enabled us to determine MCID for each group separately.
Third, we used several methods to determine the MCID of the SF-36; there is no agreement regarding the best way to determine the MCID. Although the half-SD method is used in approximately 90% of reports on the MCID, it is affected by sample size and distribution [30]. The SEM-based approach is more robust; however, it requires knowledge of the measure’s reliability, which we quoted from previous reports [5, 40].
Fourth, the global rating of the change scale, which we used as an anchor question, may not be equally valid in both physical and mental conditions [27, 28]. The use of multiple anchor questions would be ideal, considering that the SF-36 contains multiple dimension of HRQoL. However, no previous studies to our knowledge have validated the MCID of SF-36 using such a sophisticated method. In addition, we think the anchor question we used was valid because it correlated well both with PCS and MCS (Fig. 2A-B).
Fifth, MCID values determined from the global rating of change scale using the anchor-based method may display intrinsic weakness, such as subjective, retrospective judgment of change (for example, recall bias or their patient’s ability to comprehend their improvements).
Finally, because of the heterogeneity of diagnoses and the diverse range of treatments, a common problem in studies of bone and soft-tissue sarcoma surgery, patients with different levels of function were included in the analysis. This variability reinforces the need for a further study of the MCID in a more homogenous patient population.
Distribution-based and Anchor-based MCIDs in Patients with Orthopaedic Oncologic Conditions
We found the MCIDs of SF-36 PCS and MCS were about 5 points. Despite different calculation methods, all MCID values for the PCS and MCS were similar. In our sub-analysis, we also found baseline score (severity) and diagnosis affected MCID values of PCS and MCS (Table 3). There is no agreement as to the best approach for calculating the MCID. Crosby et al. [13 ] advised using both distribution-based and anchor-based approaches. Of the several types of distribution-based calculations, we used the half SD and SEM-based methods, as they are the most universally used distribution-based approaches. Our results are similar to MCID values in previous reports on other conditions, ranging from 2 to 7 (Appendix 1; supplemental materials are available with the online version of CORR®) [4, 5, 7, 12, 25, 36, 39, 41, 42], which allows us to conclude that the MCID of the SF-36 PCS and MCS scores should be approximately 5 in patients with orthopaedic oncologic conditions. However, the MCID values determined in this study using different methods can be within a certain range of values. Caution must be exercised when interpreting MCID values on the individual level. Furthermore, certain clinically important questions could warrant a different anchor question, as noted above. Improvement and standardization of the MCID method is needed to address these concerns. When applying novel interventions to orthopaedic oncology patients in the future, considering these MCIDs is important to evaluate if it is clinically important rather than statistically significant. Also, the MCID-based approach will be helpful to identify subgroups of patients who could benefit from a specific intervention, even if the overall population may not benefit.
Conclusions
Since both anchor-based and distribution-based MCID estimates of the SF-36 in patients with musculoskeletal tumors were so similar, we have confidence in the estimates we made, which were about 5 points both for the PCS and the MCS subscales of the SF-36. This suggests that interventions improving SF-36 by less than that amount are unlikely to be perceived by patients as clinically important. Therefore, those interventions may not justify exposing patients to risk, cost, or inconvenience. When applying novel interventions for orthopaedic oncology patients, be they operations, implants, drugs, or rehabilitation regimens, considering MCIDs will be vital to evaluate the clinical and potential statistical significance of the change. Also, the MCID-based approach will help identify subgroups of patients who could benefit from a specific intervention, even if the overall population may not benefit.
Acknowledgments
We thank Jessica Massler MSW, for her editorial assistance.
Footnotes
The institution of all of the authors (KO, MAY, ABC, TF, ZN, PJB, JHH) has received, during the study, funding from the NIH/NCI Cancer Center Support Grant, P30 CA008748, The Limb Preservation Fund, The Perlman Research Fund, and the Major Family Research Fund.
Each author certifies that neither he, nor any member of his immediate family, has funding or commercial associations (consultancies, stock ownership, equity interest, patent/licensing arrangements, etc) that might pose a conflict of interest in connection with the submitted article.
All ICMJE Conflict of Interest Forms for authors and Clinical Orthopaedics and Related Research® editors and board members are on file with the publication and can be viewed on request.
Each author certifies that his institution approved the human protocol of this investigation and that all investigations were conducted in conformity with ethical principles of research.
This work was performed at the Memorial Sloan Kettering Cancer Center, New York, NY, USA.
References
- 1.Akiyama T, Uehara K, Ogura K, Shinoda Y, Iwata S, Saita K, Tanzawa Y, Nakatani F, Yonemoto T, Kawano H, Davis AM, Kawai A. Cross-cultural adaptation and validation of the Japanese version of the Toronto Extremity Salvage Score (TESS) for patients with malignant musculoskeletal tumors in the upper extremities. J Orthop Sci. 2017;22:127-132. [DOI] [PubMed] [Google Scholar]
- 2.Anagnostopoulos F, Niakas D, Pappa E. Construct validation of the Greek SF-36 Health Survey. Qual Life Res. 2005;14:1959-1965. [DOI] [PubMed] [Google Scholar]
- 3.Antonescu I, Carli F, Mayo NE, Feldman LS. Validation of the SF-36 as a measure of postoperative recovery after colorectal surgery. Surg Endosc. 2014;28:3168-3178. [DOI] [PubMed] [Google Scholar]
- 4.Auffinger BM, Lall RR, Dahdaleh NS, Wong AP, Lam SK, Koski T, Fessler RG, Smith ZA. Measuring surgical outcomes in cervical spondylotic myelopathy patients undergoing anterior cervical discectomy and fusion: assessment of minimum clinically important difference. PLoS One. 2013;8:e67408. [DOI] [PMC free article] [PubMed] [Google Scholar]
- 5.Badhiwala JH, Witiw CD, Nassiri F, Akbar MA, Jaja B, Wilson JR, Fehlings MG. Minimum Clinically Important Difference in SF-36 Scores for Use in Degenerative Cervical Myelopathy. Spine (Phila Pa 1976). 2018;43:E1260-e1266. [DOI] [PubMed] [Google Scholar]
- 6.Bekkering WP, van Egmond-van Dam JC, Bramer JAM, Beishuizen A, Fiocco M, Dijkstra PDS. Quality of life after bone sarcoma surgery around the knee: A long-term follow-up study. Eur J Cancer Care (Engl). 2017;26. [DOI] [PubMed] [Google Scholar]
- 7.Berliner JL, Brodke DJ, Chan V, SooHoo NF, Bozic KJ. Can Preoperative Patient-reported Outcome Measures Be Used to Predict Meaningful Improvement in Function After TKA? Clin Orthop Relat Res. 2017;475:149-157. [DOI] [PMC free article] [PubMed] [Google Scholar]
- 8.Brazier JE, Harper R, Jones NM, O'Cathain A, Thomas KJ, Usherwood T, Westlake L. Validating the SF-36 health survey questionnaire: new outcome measure for primary care. BMJ. 1992;305:160-164. [DOI] [PMC free article] [PubMed] [Google Scholar]
- 9.Brigden A, Parslow RM, Gaunt D, Collin SM, Jones A, Crawley E. Defining the minimally clinically important difference of the SF-36 physical function subscale for paediatric CFS/ME: triangulation using three different methods. Health Qual Life Outcomes. 2018;16:202. [DOI] [PMC free article] [PubMed] [Google Scholar]
- 10.Cella D, Yount S, Rothrock N, Gershon R, Cook K, Reeve B, Ader D, Fries JF, Bruce B, Rose M. The Patient-Reported Outcomes Measurement Information System (PROMIS): progress of an NIH Roadmap cooperative group during its first two years. Med Care. 2007;45:S3-s11. [DOI] [PMC free article] [PubMed] [Google Scholar]
- 11.Coens C, van der Graaf WT, Blay JY, Chawla SP, Judson I, Sanfilippo R, Manson SC, Hodge RA, Marreaud S, Prins JB, Lugowska I, Litiere S, Bottomley A. Health-related quality-of-life results from PALETTE: A randomized, double-blind, phase 3 trial of pazopanib versus placebo in patients with soft tissue sarcoma whose disease has progressed during or after prior chemotherapy-a European Organization for research and treatment of cancer soft tissue and bone sarcoma group global network study (EORTC 62072). Cancer. 2015;121:2933-2941. [DOI] [PubMed] [Google Scholar]
- 12.Copay AG, Glassman SD, Subach BR, Berven S, Schuler TC, Carreon LY. Minimum clinically important difference in lumbar spine surgery patients: a choice of methods using the Oswestry Disability Index, Medical Outcomes Study questionnaire Short Form 36, and pain scales. Spine J. 2008;8:968-974. [DOI] [PubMed] [Google Scholar]
- 13.Crosby RD, Kolotkin RL, Williams GR. Defining clinically meaningful change in health-related quality of life. J Clin Epidemiol. 2003;56:395-407. [DOI] [PubMed] [Google Scholar]
- 14.Daltroy LH, Liang MH, Fossel AH, Goldberg MJ. The POSNA pediatric musculoskeletal functional health questionnaire: report on reliability, validity, and sensitivity to change. Pediatric Outcomes Instrument Development Group. Pediatric Orthopaedic Society of North America. J Pediatr Orthop. 1998;18:561-571. [DOI] [PubMed] [Google Scholar]
- 15.Davis AM, O'Sullivan B, Bell RS, Turcotte R, Catton CN, Wunder JS, Chabot P, Hammond A, Benk V, Isler M, Freeman C, Goddard K, Bezjak A, Kandel RA, Sadura A, Day A, James K, Tu D, Pater J, Zee B. Function and health status outcomes in a randomized trial comparing preoperative and postoperative radiotherapy in extremity soft tissue sarcoma. J Clin Oncol. 2002;20:4472-4477. [DOI] [PubMed] [Google Scholar]
- 16.Davis AM, Wright JG, Williams JI, Bombardier C, Griffin A, Bell RS. Development of a measure of physical function for patients with bone and soft tissue sarcoma. Qual Life Res. 1996;5:508-516. [DOI] [PubMed] [Google Scholar]
- 17.Enneking WF, Dunham W, Gebhardt MC, Malawar M, Pritchard DJ. A system for the functional evaluation of reconstructive procedures after surgical treatment of tumors of the musculoskeletal system. Clin Orthop Relat Res. 1993:241-246. [PubMed] [Google Scholar]
- 18.Garcia SF, Cella D, Clauser SB, Flynn KE, Lad T, Lai JS, Reeve BB, Smith AW, Stone AA, Weinfurt K. Standardizing patient-reported outcomes assessment in cancer clinical trials: a patient-reported outcomes measurement information system initiative. J Clin Oncol. 2007;25:5106-5112. [DOI] [PubMed] [Google Scholar]
- 19.Hanley JA, McNeil BJ. The meaning and use of the area under a receiver operating characteristic (ROC) curve. Radiology. 1982;143:29-36. [DOI] [PubMed] [Google Scholar]
- 20.Holzer LA, Huyer N, Friesenbichler J, Leithner A. Body image, self-esteem, and quality of life in patients with primary malignant bone tumors. Arch Orthop Trauma Surg. 2020;140:1-10. [DOI] [PMC free article] [PubMed] [Google Scholar]
- 21.Hudgens S, Forsythe A, Kontoudis I, D'Adamo D, Bird A, Gelderblom H. Evaluation of Quality of Life at Progression in Patients with Soft Tissue Sarcoma. Sarcoma. 2017;2017:2372135. [DOI] [PMC free article] [PubMed] [Google Scholar]
- 22.Iwata S, Uehara K, Ogura K, Akiyama T, Shinoda Y, Yonemoto T, Kawai A. Reliability and Validity of a Japanese-language and Culturally Adapted Version of the Musculoskeletal Tumor Society Scoring System for the Lower Extremity. Clin Orthop Relat Res.2016;474:2044-2052. [DOI] [PMC free article] [PubMed] [Google Scholar]
- 23.Johanson NA, Liang MH, Daltroy L, Rudicel S, Richmond J. American Academy of Orthopaedic Surgeons lower limb outcomes assessment instruments. Reliability, validity, and sensitivity to change. J Bone Joint Surg Am. 2004;86:902-909. [DOI] [PubMed] [Google Scholar]
- 24.Kager L, Tamamyan G, Bielack S. Novel insights and therapeutic interventions for pediatric osteosarcoma. Future Oncol. 2017;13:357-368. [DOI] [PubMed] [Google Scholar]
- 25.Kosinski M, Zhao SZ, Dedhiya S, Osterhaus JT, Ware JE., Jr Determining minimally important changes in generic and disease-specific health-related quality of life questionnaires in clinical trials of rheumatoid arthritis. Arthritis Rheum. 2000;43:1478-1487. [DOI] [PubMed] [Google Scholar]
- 26.Lemieux J, Brundage MD, Parulekar WR, Goss PE, Ingle JN, Pritchard KI, Celano P, Muss H, Gralow J, Strasser-Weippl K, Whelan K, Tu D, Whelan TJ. Quality of Life From Canadian Cancer Trials Group MA.17R: A Randomized Trial of Extending Adjuvant Letrozole to 10 Years. J Clin Oncol. 2018;36:563-571. [DOI] [PMC free article] [PubMed] [Google Scholar]
- 27.Leopold SS. Editorial: Importance of Validating the Scores We Use to Assess Patients with Musculoskeletal Tumors. Clin Orthop Relat Res. 2019;477:669-671. [DOI] [PMC free article] [PubMed] [Google Scholar]
- 28.Leopold SS, Porcher R. Editorial: The Minimum Clinically Important Difference-The Least We Can Do. Clin Orthop Relat Res. 2017;475:929-932. [DOI] [PMC free article] [PubMed] [Google Scholar]
- 29.Mangione CM, Goldman L, Orav EJ, Marcantonio ER, Pedan A, Ludwig LE, Donaldson MC, Sugarbaker DJ, Poss R, Lee TH. Health-related quality of life after elective surgery: measurement of longitudinal changes. J Gen Intern Med. 1997;12:686-697. [DOI] [PMC free article] [PubMed] [Google Scholar]
- 30.Norman GR, Sloan JA, Wyrwich KW. Interpretation of changes in health-related quality of life: the remarkable universality of half a standard deviation. Med Care. 2003;41:582-592. [DOI] [PubMed] [Google Scholar]
- 31.Ogura K, Uehara K, Akiyama T, Iwata S, Shinoda Y, Kobayashi E, Saita K, Yonemoto T, Kawano H, Chuman H, Davis AM, Kawai A. Cross-cultural adaptation and validation of the Japanese version of the Toronto Extremity Salvage Score (TESS) for patients with malignant musculoskeletal tumors in the lower extremities. J Orthop Sci. 2015;20:1098-1105. [DOI] [PubMed] [Google Scholar]
- 32.Postma A, Kingma A, De Ruiter JH, Schraffordt Koops H, Veth RP, Goeken LN, Kamps WA. Quality of life in bone tumor patients comparing limb salvage and amputation of the lower extremity. J Surg Oncol. 1992;51:47-51. [DOI] [PubMed] [Google Scholar]
- 33.Ranft A, Seidel C, Hoffmann C, Paulussen M, Warby AC, van den Berg H, Ladenstein R, Rossig C, Dirksen U, Rosenbaum D, Juergens H. Quality of Survivorship in a Rare Disease: Clinicofunctional Outcome and Physical Activity in an Observational Cohort Study of 618 Long-Term Survivors of Ewing Sarcoma. J Clin Oncol. 2017;35:1704-1712. [DOI] [PubMed] [Google Scholar]
- 34.Reeve BB, Hays RD, Bjorner JB, Cook KF, Crane PK, Teresi JA, Thissen D, Revicki DA, Weiss DJ, Hambleton RK, Liu H, Gershon R, Reise SP, Lai JS, Cella D. Psychometric evaluation and calibration of health-related quality of life item banks: plans for the Patient-Reported Outcomes Measurement Information System (PROMIS). Med Care. 2007;45:S22-31. [DOI] [PubMed] [Google Scholar]
- 35.Rivard JD, Puloski SS, Temple WJ, Fyfe A, Kwan M, Schachar N, Kurien E, Lanuke K, Mack LA. Quality of life, functional outcomes, and wound complications in patients with soft tissue sarcomas treated with preoperative chemoradiation: a prospective study. Ann Surg Oncol. 2015;22:2869-2875. [DOI] [PubMed] [Google Scholar]
- 36.Shikiar R, Willian MK, Okun MM, Thompson CS, Revicki DA. The validity and responsiveness of three quality of life measures in the assessment of psoriasis patients: results of a phase II study. Health Qual Life Outcomes. 2006;4:71. [DOI] [PMC free article] [PubMed] [Google Scholar]
- 37.Terwee CB, Mokkink LB, Knol DL, Ostelo RW, Bouter LM, de Vet HC. Rating the methodological quality in systematic reviews of studies on measurement properties: a scoring system for the COSMIN checklist. Qual Life Res. 2012;21:651-657. [DOI] [PMC free article] [PubMed] [Google Scholar]
- 38.Uehara K, Ogura K, Akiyama T, Shinoda Y, Iwata S, Kobayashi E, Tanzawa Y, Yonemoto T, Kawano H, Kawai A. Reliability and Validity of the Musculoskeletal Tumor Society Scoring System for the Upper Extremity in Japanese Patients. Clin Orthop Relat Res. 2017;475:2253-2259. [DOI] [PMC free article] [PubMed] [Google Scholar]
- 39.Ward MM, Guthrie LC, Alba MI. Clinically important changes in short form 36 health survey scales for use in rheumatoid arthritis clinical trials: the impact of low responsiveness. Arthritis Care Res (Hoboken). 2014;66:1783-1789. [DOI] [PMC free article] [PubMed] [Google Scholar]
- 40.Ware JE., Jr. SF-36 health survey update. Spine (Phila Pa 1976). 2000;25:3130-3139. [DOI] [PubMed] [Google Scholar]
- 41.Yuksel S, Ayhan S, Nabiyev V, Domingo-Sabat M, Vila-Casademunt A, Obeid I, Perez-Grueso FS, Acaroglu E. Minimum clinically important difference of the health-related quality of life scales in adult spinal deformity calculated by latent class analysis: is it appropriate to use the same values for surgical and nonsurgical patients? Spine J. 2019;19:71-78. [DOI] [PubMed] [Google Scholar]
- 42.Zhang Y, Zhou F, Sun Y. Assessment of health-related quality of life using the SF-36 in Chinese cervical spondylotic myelopathy patients after surgery and its consistency with neurological function assessment: a cohort study. Health Qual Life Outcomes. 2015;13:39. [DOI] [PMC free article] [PubMed] [Google Scholar]