Abstract
Objective
Disease activity indices for rheumatoid arthritis (RA) are important in clinical practice and research. Although they are closely correlated, they are not in good agreement. We derived formulae to convert values from one of the four 28-joint count indices (disease activity score using erythrocyte sedimentation rate [DAS28-ESR], disease activity score using C-reactive protein [DAS28-CRP], clinical disease activity index [CDAI], and simple disease activity index [SDAI]) to any of the others.
Methods
We obtained data from 175 patients from our RA registry with concurrent CRP and ESR and established the nature of relationships between the indices using these data. Subsequently, we developed empiric conversion formulae. Furthermore, we developed new cutoff values for classifying disease activity to minimize the disparity among indices, using an iterative method.
Results
The relationships between DAS28-ESR and DAS28-CRP and between SDAI and CDAI were approximately linear; the others were quadratic. Quadratic equations approximated the relationship between DAS, SDAI, and CDAI, whereas natural logarithms function approximated the relationship between DAS28-ESR and DAS28-CRP. Patients are frequently categorized into inconsistent disease activity states with any two indices, with the disparity ranging from 9.7% to 40.6%. The new cutoff values were developed to minimize the discrepant activity state categorization, reducing the disparity range to 6.3%–32.6%.
Conclusion
We derived empiric formulae that connect DAS28-ESR, DAS28-CRP, SDAI, and CDAI. Moreover, we developed new cutoff values to minimize the discrepant activity state categorization with different indices.
Keywords: Rheumatoid arthritis, Disease Activity Score, Clinical Disease Activity Index, Simplified Disease Activity Index
Introduction
Rheumatologists recognize that employing a composite index to monitor disease activity in rheumatoid arthritis (RA) is better than using any single parameter (1). Composite indices are regarded as reliable representations of disease activity, which are suitable for guiding the treatment. Several indices have been proposed; however, the acceptance of a small convergent number in the past 20 years has paved the way for large-scale trials of treatment strategies and innovative agents. The prototype index, disease activity score (DAS), was introduced in 1990 (2). The components of DAS (tender joint count [TJC; 44-joint Ritchie articular index], swollen joint count, erythrocyte sedimentation rate [ESR], and patient global assessment [PGA]) are mathematically operated and weighted before summation to produce a numeric score. The European League Against Rheumatism (EULAR) response criteria, incorporating DAS, were developed in 1996 (3). DAS was simplified to the reduced 28-joint count in 1995 (DAS28) (4). The formula for calculating DAS28 using C-reactive protein (CRP) instead of ESR was published in 2003, with the intention of producing an equivalent score (5). As DAS can only be scored with dedicated handheld calculators, computer algorithms, or online tools, simplified indices were developed, namely simple disease activity index (SDAI) and clinical disease activity index (CDAI). Both SDAI and CDAI, employing the 28-joint count, are scored by simple addition (6, 7).
SDAI, CDAI, and several forms of DAS have been well described individually (8). Recently, some authors have pointed out that the agreement between indices is low and advised against using them interchangeably (9–12). In practice, as activity indices may be collected in different formats, it is useful to be able to convert the disparate data to a uniform mode.
This work seeks to understand the relationships between DAS28-ESR, DAS28-CRP, SDAI, and CDAI, and subsequently develop formulae to convert values from one index to another.
Methods
Patients
Our RA disease registry is a prospective outpatient RA registry (13). In this study, we examined 175 patients who had both ESR and CRP determined at the first study visit. This project was carried out with the approval of the institutional review board of our institution. All participants provided written consent.
Rheumatoid arthritis disease activity indices
In this study, we did not assess the 44-joint count DAS because we only employed the 28-joint count version in our registry. We classified the patients into four disease states (remission, low activity, moderate activity, and high activity) using each index and using cutoff values based on published criteria (14).
We computed the indices in the following manner (14):
DAS28-ESR=(0.56 × √TJC) + (0.28 × √SJC) + (0.014 × PGA [mm]) + (0.7 × ln [ESR]),
DAS28-CRP=(0.56 × √TJC) + (0.28 × √SJC) + (0.014 × PGA [mm]) + (0.36 × ln(CRP in mg/L+1) + 0.96,
SDAI=SJC + TJC + PGA (cm) + EGA (cm) + CRP (in mg/dL), and
CDAI=SJC + TJC + PGA (cm) + EGA (cm),
where EGA=evaluator global assessment; ESR=erythrocyte sedimentation rate; PGA=patient global assessment; and SJC=swollen joint count.
Before the introduction of the highly sensitive assay for CRP, the lower limits of detection in our laboratory were 5.0 and 3.5 mg/L at different time points. In this cohort of 175 patients, 25 CRP values (14.29%) were below the detection limit. We imputed the data below the detection limit, or left-censored values, by dividing the lower limit of detection by the square root of 2 (15).
Statistical analysis
As it is not possible to derive closed-form expressions to convert indices from one to another, we used the mathematical associations behind six pairs of relationships to derive the formulae and our patients’ empirical data to determine the coefficients. We drew scatter plots to describe the relationship between each pair of indices. Furthermore, we calculated Pearson’s correlation coefficient, Spearman’s Rho, and Kendall’s Tau to assess the strength of correlation. We used the curve-fitting module in Excel 2003 to fit linear and quadratic regression curves to the scatter plots. Furthermore, we computed the Bland-Altman plots and the two-way random effect model intra-class coefficient (ICC) to determine the level of agreement between the two pairs with compatible scales: DAS28-ESR with DAS28-CRP and CDAI with SDAI (16). We used the recommended cutoff values to produce cross-tabulation tables to categorize the patients into activity states. The Kappa coefficient was used to study the discrepancy in categorization. We fitted randomly generated cutoff values to the tables with over 1000 iterations to determine those that produced the lowest discrepancy. Statistical analysis was performed with Statistical Package for the Social Sciences, version 17.0 (SPSS Inc.; Chicago, IL, USA). The level of significance was taken as 0.05.
Results
Patient characteristics
This study included 175 patients, of which 142 (81%) were female. The mean age was 48.2±13.0 years. The mean age at disease diagnosis was 47.2±13.1 years. There were 133 (76.0%) Chinese individuals, 17 (9.7%) Malays, 23 (13.1%) Indians, and 2 (1.1%) who belonged to other ethnic groups. DAS28-ESR and DAS28-CRP scores conformed to the normal distribution, whereas CDAI and SDAI scores did not (data not shown). The mean and standard deviation of DAS28-ESR and DAS28-CRP scores are 4.28±1.53 and 3.76±1.37, respectively. The median and inter-quartile range of CDAI and SDAI are 12.3 (6.9–22) and 14.65 (8.15–24.73), respectively.
Overview of relationship between the indices
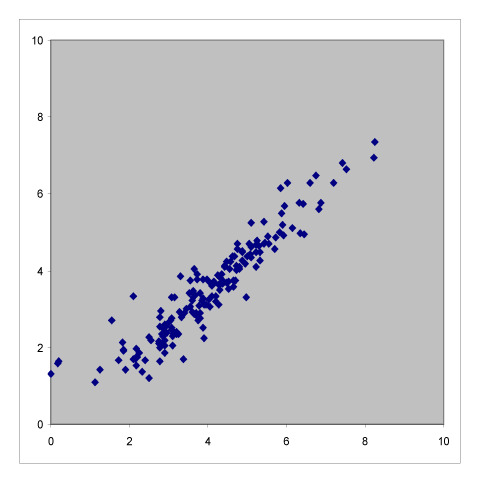
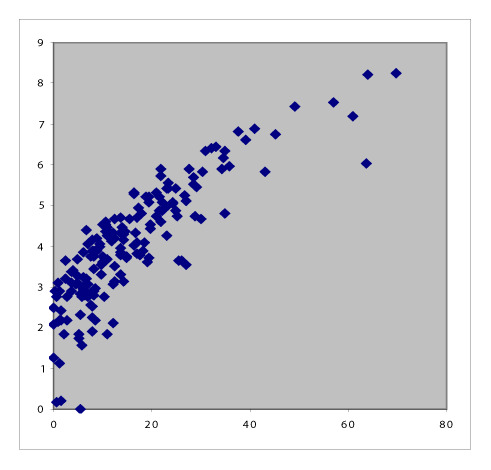
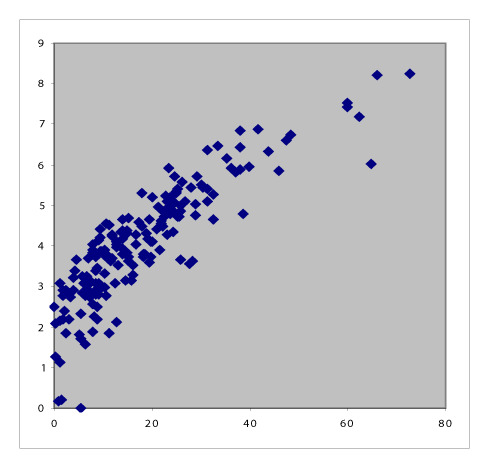
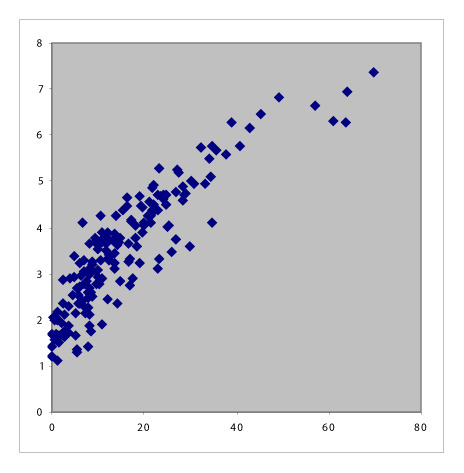
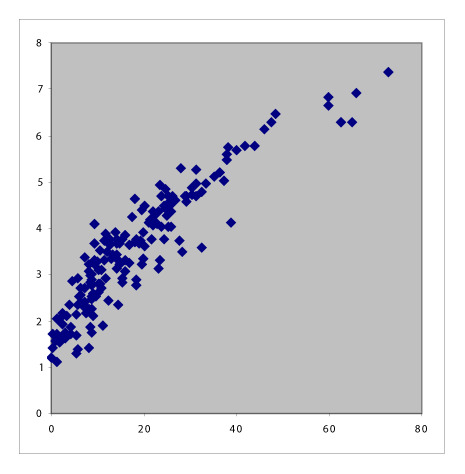
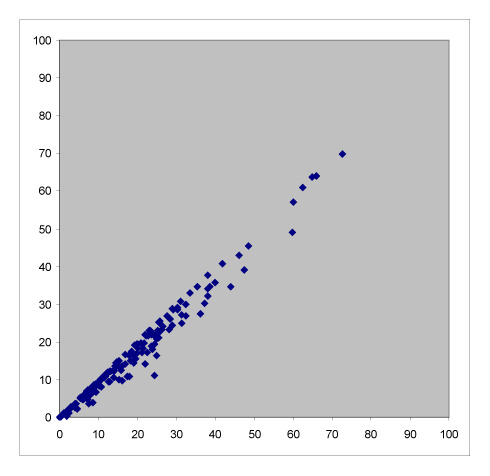
Table 1 summarizes the six pair-wise comparisons between the four indices. These correlate well as evident from the high values of Pearson’s coefficient and Spearman’s Rho; however, these showed only moderate agreement because of low Kendall’s Tau-b values. The scatter plots suggested that the relationship between DAS28-ESR and DAS28-CRP and that between CDAI and SDAI are both linear, whereas the rest are curvilinear.
Table 1.
Scatter plots with correlation coefficients showing the relationship between the four RA activity indices.
| DAS28-ESR |
|
|
|
|
| |||
| Pearson’s correlation coefficient | DAS28-CRP |
|
|
| 0.942, p<0.001 | |||
| Spearman’s Rho | |||
| 0.952, p<0.001 | |||
| Kendall’s Tau-b | |||
| 0.818, p<0.001 | |||
|
| |||
| Pearson’s correlation coefficient | Pearson’s correlation coefficient | CDAI |
|
| 0.876, p<0.001 | 0.918, p<0.001 | ||
| Spearman’s Rho | Spearman’s Rho | ||
| 0.916, p<0.001 | 0.946, p<0.001 | ||
| Kendall’s Tau-b | Kendall’s Tau-b | ||
| 0.751, p<0.001 | 0.809, p<0.001 | ||
|
| |||
| Pearson’s correlation coefficient | Pearson’s correlation coefficient | Pearson’s correlation coefficient | SDAI |
| 0.896, p<0.001 | 0.941, p<0.001 | 0.988, p<0.001 | |
| Spearman’s Rho | Spearman’s Rho | Spearman’s Rho | |
| 0.933, p<0.001 | 0.965, p<0.001 | 0.986, p<0.001 | |
| Kendall’s Tau-b | Kendall’s Tau-b | Kendall’s Tau-b | |
| 0.782, p<0.001 | 0.851, p<0.001 | 0.914, p<0.001 | |
The statistics shown are Pearson’s correlation coefficient, Spearman’s Rho, and Kendall’s Tau-b.
CDAI: clinical disease activity index; CRP: C-reactive protein; DAS: disease activity score; ESR: erythrocyte sedimentation rate; SDAI: simple disease activity index.
Conversion between SDAI and CDAI
SDAI is always larger than CDAI because SDAI is the sum of CDAI and CRP. When CDAI and SDAI have low values, we expect both CDAI and SDAI to agree well. Moreover, when SDAI increases, we expect CRP to also increase; however, other components also constitute a large proportion of the final score. Indeed, CRP constitutes a progressively small proportion of the SDAI as the latter increases in value, from 27.6% in the lowest quintile to 15.0% in the second quintile, 12.5% in the third, and 14.0% in the fourth, to 8.9% in the highest quintile. Based on this reasoning, we expect excellent agreement at the lowest and highest values of CDAI and SDAI, and poor agreement at the middle. The Bland-Altman analysis showed that the mean difference between SDAI and CDAI was 2.08, and only 5.71% of the values were outside the 95% limits of agreement (Figure 1). Because of the good agreement, SDAI and CDAI can be used interchangeably. However, as the relationship is U-shaped, and considering the slight differences between CDAI and SDAI, quadratic equations provide a reasonable way to convert between the two indices:
Figure 1. a, b.
Bland-Altman plots showing the agreement between SDAI and CDAI (a) and between DAS28-ESR and DAS28-CRP (b). Each point represents a patient, displaying the difference in indices against the mean value of indices. The dotted lines represent the boundaries of the 95% limits of agreement. Points within the boundaries are considered to agree well.
CDAI ~ 0.002 (SDAI)2 + 0.8157 SDAI + 0.0369
SDAI ~ −0.0019 (CDAI)2 + 1.1484 CDAI + 0.6242
Conversion between DAS28-ESR and DAS28-CRP
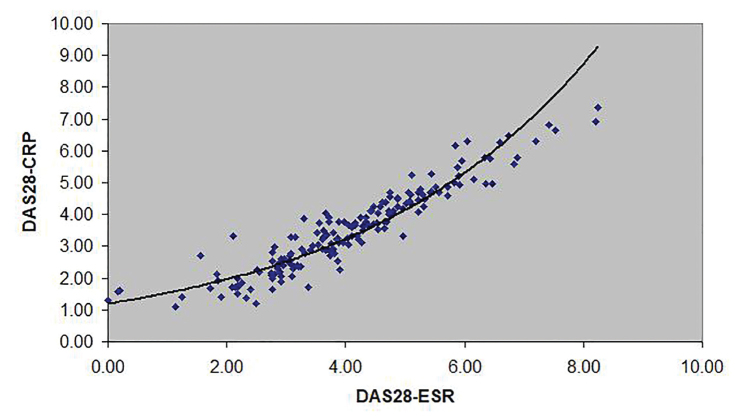
The relationship between DAS28-ESR and DAS28-CRP was also approximately linear. Nonetheless, for any given DAS28-ESR, the corresponding DAS28-CRP is generally low, except at the lowest values (14, 17–22). The Bland-Altman plot (Figure 1) shows that the mean difference was 0.51, with 5.14% lying outside the 95% limits of agreement (−0.50 to 1.52). Anemia did not explain the disparity between ESR and CRP in our cohort (data not shown). We found that these formulae provided reasonable approximations:
DAS28-CRP ~ 1.1953e0.2487(DAS28-ESR) (Figure 2);
DAS28-ESR ~ 3.3928Ln(DAS28-CRP) + 0.0254
Figure 2.
The curve described by the equation DAS28-CRP ~ 1.1953e0.2487(DAS28-ESR) approximates the association between DAS28-CRP and DAS28-ESR.
Conversion between DAS28 and CDAI and SDAI
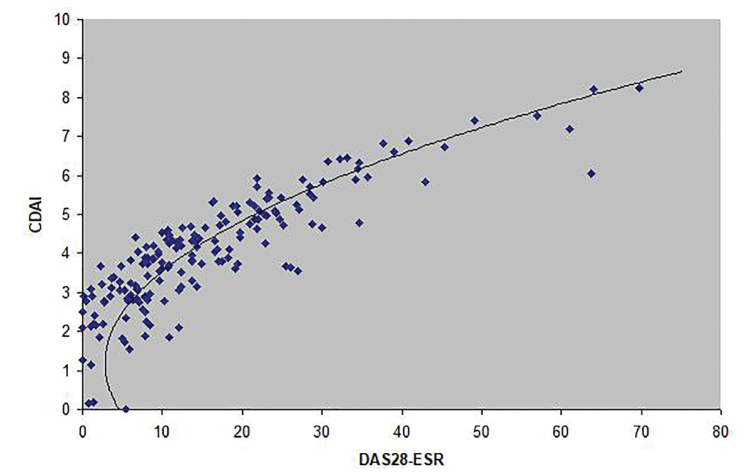
Clinical disease activity index can be expressed as 3.18878(DAS28-ESR)2 + (0.75 × SJC) − (0.0625 × PGA2) + (1.5625 × [lnESR]2) + 6.37756([0.1568 × √TJC × √SJC] + [0.0392 × √SJC × PGA] + [0.196 × √SJC × lnESR] + [0.0784 × √TJC × PGA] + [0.392 × √TJC × lnESR] + [0.098 × PGA × lnESR]) + PGA + EGA. Therefore, we fitted quadratic equations to our patients’ data and obtained these formulae to approximate the association between DAS28, CDAI, and SDAI:
CDAI ~ 1.292(DAS28-ESR)2 − 3.132(DAS28-ESR) + 4.705 (Figure 3);
CDAI ~ 1.572(DAS28-CRP)2 − 3.091(DAS28-CRP) + 4.672;
SDAI ~ 1.260(DAS28-ESR)2 − 2.150(DAS28-ESR) + 3.40; and
SDAI ~1.499(DAS28-CRP)2 − 1.661(DAS28-CRP) + 2.73.
Figure 3.
The curve described by the equation CDAI=1.292(DAS28-ESR)2 - 3.132(DAS28-ESR) + 4.705 approximates the association between DAS28-ESR and CDAI.
Disease state categorization
Patients classified to be in remission by one index may have low or even moderate activity by another index (Table 2). CDAI and SDAI had the highest level of agreement (90.9%), and the highest Kappa coefficient (0.8717) and ICC (0.975). DAS28-ESR and DAS28-CRP had the lowest level of agreement (62.3%) and the lowest Kappa coefficient (0.456), whereas the ICC remained high (0.882). Although absolute values are similar, the agreement in categorizing into the disease states can be low. All other pairs of indices had ICC values lower or equal to 0.2, indicating poor consistency.
Table 2.
Agreement in categorizing RA disease activity scores between the indices.
| R | Lo | Mo | Hi | R | Lo | Mo | Hi | R | Lo | Mo | Hi | ||
|---|---|---|---|---|---|---|---|---|---|---|---|---|---|
| DAS28-ESR | 17 | 1* | 1* | 0* | 12 | 6* | 1* | 0* | 12 | 6* | 1* | 0* | R |
| 19* | 9 | 1* | 0* | 7* | 20 | 2* | 0* | 5* | 23 | 1* | 0* | Lo | |
| 4* | 13* | 59 | 1* | 1* | 26* | 44 | 6* | 0* | 23* | 50 | 4* | Mo | |
| 0* | 0* | 26* | 24 | 0* | 0* | 13* | 37 | 0* | 0* | 19* | 31 | Hi | |
|
| |||||||||||||
| Kappa 0.456 (p<0.001) | DAS28-CRP | 20 | 20* | 0* | 0* | 17 | 23* | 0* | 0* | R | |||
| ICC 0.882 | 0* | 18 | 5* | 0* | 0* | 19 | 4* | 0* | Lo | ||||
| (0.438, 0.955) | 0* | 14* | 54 | 19* | 0* | 10* | 65 | 12* | Mo | ||||
| Agreement 62.3% | 0* | 0* | 1* | 24 | 0* | 0* | 2* | 23 | Hi | ||||
| Incompatibility 37.7% | |||||||||||||
|
| |||||||||||||
| Kappa 0.506 | Kappa 0.538 | CDAI | 17 | 3* | 0* | 0* | R | ||||||
| (p<0.001) | (p<0.001) | 0* | 48 | 4* | 0* | Lo | |||||||
| ICC 0.202 | ICC 0.190 | 0* | 1* | 59 | 0* | Mo | |||||||
| (0.055, 0.339) | (0.043, 0.329) | 0* | 0* | 8* | 35 | Hi | |||||||
| Agreement 64.6% | Agreement 66.3% | ||||||||||||
| Incompatibility 35.4% | Incompatibility 33.7% | ||||||||||||
|
| |||||||||||||
| Kappa 0.5215 | Kappa 0.5887 | Kappa 0.8717 | SDAI | ||||||||||
| (p<0.001) | (p<0.001) | (p<0.001) | |||||||||||
| ICC 0.194 | ICC 0.183 | ICC 0.975 | |||||||||||
| (0.47, 0.332) | (0.36, 0.323) | (0.854, 0.990) | |||||||||||
| Agreement 66.3% | Agreement 70.9% | Agreement 90.9% | |||||||||||
| Incompatibility 33.7% | Incompatibility 29.1% | Incompatibility 9.1% | |||||||||||
Patients categorized into incompatible categories by two indices. The Kappa coefficient, ICC with its 95% CI levels of agreement, and percentage of incompatibly classified patients are also shown. Cutoff values are based on published criteria (14).
CDAI: clinical disease activity index; CI: confidence interval; CRP: C-reactive protein; ESR: erythrocyte sedimentation rate; Hi: high activity; ICC: intra-class coefficient; R: remission; Lo: low activity; Mo: moderate activity; SDAI: simple disease activity index.
There are discrepancies in assigning DAS when different scales are used (23). We generated random values for the cutoff values, and selected the set that produced the lowest disparity using at least 1000 iterations (Table 3). For example, for the pair of indices with the most discrepant categorization, keeping the cutoff values in DAS28-ESR constant and changing those in DAS28-CRP, we reduced the discrepancy from 37.7% to 15.4% (22.3% reduction). As the new criteria are derived from empiric data from our patients, they should be used only locally. This approach may be used in other populations to generate specific sets of cutoff values.
Table 3.
The boxes in the leftmost column show the original cutoff values. Keeping each index constant in turn (bold), the cutoff values are optimized to minimize discrepancy. With each set of new cutoff values, the percentage of patients classified into discrepant disease states is also shown.
| Original criteria | Adjusted criteria | |||
|---|---|---|---|---|
|
| ||||
| DAS28-ESR | DAS28-CRP | CDAI | SDAI | |
| DAS28-ESR | ||||
| Remission: <2.6 | Remission: <2.0 | Remission: <2.7 | Remission: <3 | |
| Low activity: 2.6 to ≤3.2 | Low activity: 2.0 to ≤2.8 | Low activity: 2.7 to ≤8 | Low activity: 3 to ≤8 | |
| Moderate activity: 3.2 to ≤5.1 | Moderate activity: 2.8 to ≤4.68 | Moderate activity: 8 to ≤27 | Moderate activity: 8 to ≤30 | |
| High activity: >5.1 | High activity: >4.68 | High activity: >27 | High activity: >30 | |
| Discrepancy: 15.4% | Discrepancy: 29.1% | Discrepancy: 28.0% | ||
| DAS28-CRP | ||||
| Remission: <2.6 | Remission: <3.24 | Remission: <7.3 | Remission: <8.4 | |
| Low activity: 2.6 to ≤3.2 | Low activity: 3.24 to ≤3.5 | Low activity: 7.3 to ≤8 | Low activity: 8.4 to ≤10.9 | |
| Moderate activity: 3.2 to ≤5.1 | Moderate activity: 3.5 to ≤5.8 | Moderate activity: 8 to ≤34 | Moderate activity: 10.9 to ≤34 | |
| High activity: >5.1 | High activity: >5.8 | High activity: >34 | High activity: >34 | |
| Discrepancy: 18.9% | Discrepancy: 19.4% | Discrepancy: 20.6% | ||
| CDAI | ||||
| Remission ≤2.8 | Remission: <1.5 | Remission: <2.1 | Remission: <5 | |
| Low activity 2.8 to ≤10 | Low activity: 1.5 to ≤3.6 | Low activity: 2.1 to ≤3.2 | Low activity: 5 to ≤10.5 | |
| Moderate activity: 10 to ≤22 | Moderate activity: 3.6 to ≤5.4 | Moderate activity: 3.2 to ≤4.5 | Moderate activity: 10.5 to ≤24.5 | |
| High activity >22 | High activity: >5.4 | High activity: >4.5 | High activity: >24.5 | |
| Discrepancy: 32.6% | Discrepancy: 26.9% | Discrepancy: 8.0% | ||
| SDAI | ||||
| Remission ≤ 3.3 | Remission: <1.4 | Remission: <1.3 | Remission: <2.7 | |
| Low activity 3.3 to ≤11 | Low activity: 1.4 to ≤3.5 | Low activity: 1.3 to ≤3.1 | Low activity: 2.7 to ≤9.5 | |
| Moderate activity: 11 to ≤26 | Moderate activity: 3.5 to ≤5.42 | Moderate activity: 3.1 to ≤4.5 | Moderate activity: 9.5 to ≤23 | |
| High activity >26 | High activity: >5.42 | High activity: >4.5 | High activity: >23 | |
| Discrepancy: 26.9% | Discrepancy: 25.1% | Discrepancy: 6.3% | ||
CDAI: clinical disease activity index; CRP: C-reactive protein; DAS: disease activity score; ESR: erythrocyte sedimentation rate; SDAI: simple disease activity index.
Discussion
We examined the relationships between DAS28-CRP, DAS28-ESR, CDAI, and SDAI and derived formulae to convert values among them. While CDAI may satisfactorily replace SDAI, DAS28-CRP, and DAS28-ESR, although closely correlated, these cannot substitute for each other (24). CDAI and SDAI do not have a linear relationship with DAS28-CRP and DAS28-ESR.
Many authors appreciate the linear correlation between DAS28-CRP and DAS28ESR (10, 18, 21, 25, 26), whereas some highlight the poor agreement between them (9, 19, 20, 22, 27). There are two additional features to note, one because of the mathematical expression and the other because of the association between ESR and CRP. First, although DAS28-ESR is slightly higher than DAS28-CRP for any given patient, at low disease activity, DAS28-CRP must necessarily be higher than DAS28-ESR, because the smallest value of the expression (0.36 × log (CRP + 1) + 0.96) is 0.96, whereas that of (0.7 × logESR) is 0. Second, the unpredictable relationship between ESR and CRP introduces randomness (18, 28). Unlike CRP, ESR is affected by other factors besides inflammation, such as anemia, hypergammaglobulinemia, and aging (29). In addition, ESR and CRP are independently controlled by different genes (CR1 and CRP, respectively) (30–32). Rhodes et al. (30) proposed the following equation to link CRP and ESR, incorporating the genetic contribution and recognizing the unpredictability:
The relationship between the two forms of DAS and SDAI/CDAI is complex. The fact that Pearson’s correlation coefficient between DAS and CDAI is consistently above 0.7 does not prove linearity (23, 25–27, 33). Similarly, the relationship between DAS and SDAI is not linear (6, 7, 23, 26, 34). Shaver et al. (35) used LOESS regression to fit a curve in the scatter plot of DAS and CDAI. Consequently, SDAI and DAS do not classify disease activity states in a consistent way (10, 11). As SDAI returns a higher DAS for a given patient than DAS28 does, it means that fewer patients will be classified as being in remission with it (24).
There are a number of shortcomings in this project. The number of patients with simultaneous CRP and ESR readings was small. We did not have data on follow-up visits as ESR and CRP were not ordered simultaneously and we could not study the implications of the discrepancy on the EULAR response criteria. The formulae derived from our patients’ data may not apply to other populations; however, we suspect that the variations would be minor. For example, Fleischmann et al. (12) found that the 5.1 cutoff value for active disease with DAS28-ESR was equivalent to 4.6 with DAS28-CRP, which is relatively close to our finding of 4.68.
In conclusion, we derived formulae to convert values from one index (DAS28-ESR, DAS28-CRP, SDAI, or CDAI) to any of the others by applying the curve-fitting method to actual patient data. Using an iterative method, we modified cutoff values to minimize classification discrepancies between the activity indices. Investigators working with different populations will have to validate these formulae and values.
Main Points.
The relationship between DAS-ESR/DAS-CRP and SDAI/CDAI is curvilinear rather than linear. This relationship can be approximated by simple curves.
We derived empiric quadratic equations for converting scores in one activity index to other indices.
The composite indices frequently assign patients into incompatible disease activity states; this may be ameliorated by changing the cutoff values.
Acknowledgements
The authors thank to Professor Cheung Yin Bun of the Centre for Quantitative Medicine, Duke-NUS Graduate Medical School, Singapore, for helpful discussion. The authors are grateful to Ms Yong Yan Fang, Ms Woo Chia Mun and Mr See Wei Qiang for assistance in data collection and management.
Footnotes
Content of this journal is licensed under a Creative Commons Attribution-NonCommercial 4.0 International License.
Ethics Committee Approval: Ethics committee approval was received for this study from the National Healthcare Group’s domain-specific review board (Approval number: DSRB 2006/00011).
Informed Consent: Written informed consent was obtained from the patients who participated in this study.
Peer-review: Externally peer-reviewed.
Author Contributions: Concept - X.G., K.P.L.; Design - X.G., K.P.L.; Resources - K.P.L.; Data Collection and/or Processing - K.P.L.; Analysis and/or Interpretation - K.P.L., J.W.L.T., X.G., E.T.K.; Literature Search - K.P.L., J.W.L.T., X.G., E.T.K.; Writing Manuscript - K.P.L., J.W.L.T., X.G., E.T.K.; Critical Review - K.P.L., J.W.L.T., X.G., E.T.K.
Conflict of Interest: The authors have no conflict of interest to declare.
Financial Disclosure: The authors declared that this study is supported by the research fund of the Department of Rheumatology, Allergy and Immunology, Tan Tock Seng Hospital, and grants from the National Healthcare Group and National Medical Research Council (NMRC/CG/017/2013).
References
- 1.van der Heijde DM, van’t Hof MA, van Riel PL, van Leeuwen MA, van Rijswijk MH, van de Putte LB. Validity of single variables and composite indices for measuring disease activity in rheumatoid arthritis. Ann Rheum Dis. 1992;51:177–81. doi: 10.1136/ard.51.2.177. [DOI] [PMC free article] [PubMed] [Google Scholar]
- 2.van der Heijde DM, van’t Hof MA, van Riel PL, Theunisse LA, Lubberts EW, van Leeuwen MA, et al. Judging disease activity in clinical practice in rheumatoid arthritis: First step in the development of a disease activity score. Ann Rheum Dis. 1990;49:916–20. doi: 10.1136/ard.49.11.916. [DOI] [PMC free article] [PubMed] [Google Scholar]
- 3.van Gestel AM, Prevoo ML, van’t Hof MA, van Rijswijk MH, van de Putte LB, van Riel PL. Development and validation of the European League Against Rheumatism response criteria for rheumatoid arthritis. Comparison with the preliminary American College of Rheumatology and the World Health Organization/International League Against Rheumatism Criteria. Arthritis Rheum. 1996;39:34–40. doi: 10.1002/art.1780390105. [DOI] [PubMed] [Google Scholar]
- 4.Smolen JS, Breedveld FC, Eberl G, Jones I, Leeming M, Wylie GL, et al. Validity and reliability of the twenty-eight-joint count for the assessment of rheumatoid arthritis activity. Arthritis Rheum. 1995;38:38–43. doi: 10.1002/art.1780380106. [DOI] [PubMed] [Google Scholar]
- 5.Fransen J, Welsing PMJ, de Keijzer RHM, van Riel PCLM. Development and validation of DAS28 using CRP. Ann Rheum Dis. 2003;62(suppl 1):SP0029. [Google Scholar]
- 6.Smolen JS, Breedveld FC, Schiff MH, Kalden JR, Emery P, Eberl G, et al. A simplified disease activity index for rheumatoid arthritis for use in clinical practice. Rheumatology (Oxford) 2003;42:244–57. doi: 10.1093/rheumatology/keg072. [DOI] [PubMed] [Google Scholar]
- 7.Aletaha D, Nell VP, Stamm T, Uffmann M, Pflugbeil S, Machold K, et al. Acute phase reactants add little to composite disease activity indices for rheumatoid arthritis: Validation of a clinical activity score. Arthritis Res Ther. 2005;7:R796–806. doi: 10.1186/ar1740. [DOI] [PMC free article] [PubMed] [Google Scholar]
- 8.Gaujoux-Viala C, Mouterde G, Baillet A, Claudepierre P, Fautrel B, Le Loët X, et al. Evaluating disease activity in rheumatoid arthritis: Which composite index is best? A systematic literature analysis of studies comparing the psychometric properties of the DAS, DAS28, SDAI and CDAI. Joint Bone Spine. 2012;79:149–55. doi: 10.1016/j.jbspin.2011.04.008. [DOI] [PubMed] [Google Scholar]
- 9.Tamhane A, Redden DT, McGwin G, Jr, Brown EE, Westfall AO, Reynolds RJ, 4th, et al. Comparison of the Disease Activity Score using erythrocyte sedimentation rate and C-reactive protein in African Americans with rheumatoid arthritis. J Rheumatol. 2013;40:1812–22. doi: 10.3899/jrheum.121225. [DOI] [PMC free article] [PubMed] [Google Scholar]
- 10.Leeb BF, Andel I, Sautner J, Bogdan M, Maktari A, Nothnagl T, et al. Disease activity measurement of rheumatoid arthritis: Comparison of the simplified disease activity index (SDAI) and the disease activity score including 28 joints (DAS28) in daily routine. Arthritis Rheum. 2005;53:56–60. doi: 10.1002/art.20923. [DOI] [PubMed] [Google Scholar]
- 11.Salaffi F, Cimmino MA, Leardini G, Gasparini S, Grassi W. Disease activity assessment of rheumatoid arthritis in daily practice: Validity, internal consistency, reliability and congruency of the Disease Activity Score including 28 joints (DAS28) compared with the Clinical Disease Activity Index (CDAI) Clin Exp Rheumatol. 2009;27:552–9. [PubMed] [Google Scholar]
- 12.Fleischmann RM, van der Heijde D, Gardiner PV, Szumski A, Marshall L, Bananis E. DAS28-CRP and DAS28-ESR cut-offs for high disease activity in rheumatoid arthritis are not interchangeable. RMD Open. 2017;3:e000382. doi: 10.1136/rmdopen-2016-000382. [DOI] [PMC free article] [PubMed] [Google Scholar]
- 13.Koh ET, Tan JW, Thong BY, Teh CL, Lian TY, Law WG, et al. Major trends in the manifestations and treatment of rheumatoid arthritis in a multiethnic cohort in Singapore. Rheumatol Int. 2013;33:1693–703. doi: 10.1007/s00296-012-2602-2. [DOI] [PubMed] [Google Scholar]
- 14.Anderson JK, Zimmerman L, Caplan L, Michaud K. Measures of rheumatoid arthritis disease activity: Patient (PtGA) and Provider (PrGA) Global Assessment of Disease Activity, Disease Activity Score (DAS) and Disease Activity Score with 28-Joint Counts (DAS28), Simplified Disease Activity Index (SDAI), Clinical Disease Activity Index (CDAI), Patient Activity Score (PAS) and Patient Activity Score-II (PASII), Routine Assessment of Patient Index Data (RAPID), Rheumatoid Arthritis Disease Activity Index (RADAI) and Rheumatoid Arthritis Disease Activity Index-5 (RADAI-5), Chronic Arthritis Systemic Index (CASI), Patient-Based Disease Activity Score with ESR (PDAS1) and Patient-Based Disease Activity Score without ESR (PDAS2), and Mean Overall Index for Rheumatoid Arthritis (MOI-RA) Arthritis Care Res (Hoboken) 2011;63(Suppl 11):S14–36. doi: 10.1002/acr.20621. [DOI] [PubMed] [Google Scholar]
- 15.Hornung RW, Reed LD. Estimation of average concentration in the presence of nondetectable values. Appl Occup Envir Hyg. 1990;5:46–51. doi: 10.1080/1047322X.1990.10389587. [DOI] [Google Scholar]
- 16.Bland JM, Altman DG. Statistical methods for assessing agreement between two methods of clinical measurement. Lancet. 1986;1:307–10. doi: 10.1016/S0140-6736(86)90837-8. [DOI] [PubMed] [Google Scholar]
- 17.Chandrashekara S, Priyanka BU. Remission in rheumatoid arthritis by different criteria does not converge over the inflammatory markers. Int J Rheum Dis. 2013;16:291–6. doi: 10.1111/1756-185X.12091. [DOI] [PubMed] [Google Scholar]
- 18.Crowson CS, Rahman MU, Matteson EL. Which measure of inflammation to use? A comparison of erythrocyte sedimentation rate and C-reactive protein measurements from randomized clinical trials of golimumab in rheumatoid arthritis. J Rheumatol. 2009;36:1606–10. doi: 10.3899/jrheum.081188C1. [DOI] [PubMed] [Google Scholar]
- 19.Wells G, Becker JC, Teng J, Dougados M, Schiff M, Smolen J, et al. Validation of the 28-joint Disease Activity Score (DAS28) and European League Against Rheumatism response criteria based on C-reactive protein against disease progression in patients with rheumatoid arthritis, and comparison with the DAS28 based on erythrocyte sedimentation rate. Ann Rheum Dis. 2009;68:954–60. doi: 10.1136/ard.2007.084459. [DOI] [PMC free article] [PubMed] [Google Scholar]
- 20.Hensor EM, Emery P, Bingham SJ, Conaghan PG. Discrepancies in categorizing rheumatoid arthritis patients by DAS-28(ESR) and DAS-28(CRP): Can they be reduced? Rheumatology (Oxford) 2010;49:1521–9. doi: 10.1093/rheumatology/keq117. [DOI] [PubMed] [Google Scholar]
- 21.Inoue E, Yamanaka H, Hara M, Tomatsu T, Kamatani N. Comparison of Disease Activity Score (DAS)28- erythrocyte sedimentation rate and DAS28- C-reactive protein threshold values. Ann Rheum Dis. 2007;66:407–9. doi: 10.1136/ard.2006.054205. [DOI] [PMC free article] [PubMed] [Google Scholar]
- 22.Matsui T, Kuga Y, Kaneko A, Nishino J, Eto Y, Chiba N, et al. Disease Activity Score 28 (DAS28) using C-reactive protein underestimates disease activity and overestimates EULAR response criteria compared with DAS28 using erythrocyte sedimentation rate in a large observational cohort of rheumatoid arthritis patients in Japan. Ann Rheum Dis. 2007;66:1221–6. doi: 10.1136/ard.2006.063834. [DOI] [PMC free article] [PubMed] [Google Scholar]
- 23.Martins FM, da Silva JA, Santos MJ, Vieira-Sousa E, Duarte C, Santos H, et al. DAS28, CDAI and SDAI cut-offs do not translate the same information: Results from the Rheumatic Diseases Portuguese Register Reuma.pt. Rheumatology (Oxford) 2015;54:286–91. doi: 10.1093/rheumatology/keu313. [DOI] [PubMed] [Google Scholar]
- 24.Rintelen B, Haindl PM, Maktari A, Nothnagl T, Hartl E, Leeb BF. SDAI/CDAI levels in rheumatoid arthritis patients are highly dependent on patient’s pain perception and gender. Scand J Rheumatol. 2008;37:410–3. doi: 10.1080/03009740802241717. [DOI] [PubMed] [Google Scholar]
- 25.Silva I, Mateus M, Branco JC. [Assessment of erythrocyte sedimentation rate (ESR) and C-reactive protein (CRP) on rheumatoid arthritis activity prediction]. Acta Reumatol Port. 2010;35:456–62. [PubMed] [Google Scholar]
- 26.Park SY, Lee H, Cho SK, Choi CB, Sung YK, Bae SC. Evaluation of disease activity indices in Korean patients with rheumatoid arthritis. Rheumatol Int. 2012;32:545–9. doi: 10.1007/s00296-011-1798-x. [DOI] [PubMed] [Google Scholar]
- 27.Hamdi W, Neji O, Ghannouchi MM, Kaffel D, Kchir MM. Comparative study of indices of activity evaluation in rheumatoid arthritis. Ann Phys Rehabil Med. 2011;54:421–8. doi: 10.1016/j.rehab.2011.09.002. [DOI] [PubMed] [Google Scholar]
- 28.Walsh L, Davies P, McConkey B. Relationship between erythrocyte sedimentation rate and serum C-reactive protein in rheumatoid arthritis. Ann Rheum Dis. 1979;38:362–3. doi: 10.1136/ard.38.4.362. [DOI] [PMC free article] [PubMed] [Google Scholar]
- 29.Otterness IG. The value of C-reactive protein measurement in rheumatoid arthritis. Semin Arthritis Rheum. 1994;24:91–104. doi: 10.1016/S0049-0172(05)80003-4. [DOI] [PubMed] [Google Scholar]
- 30.Rhodes B, Merriman ME, Harrison A, Nissen MJ, Smith M, Stamp L, et al. A genetic association study of serum acute-phase C-reactive protein levels in rheumatoid arthritis: Implications for clinical interpretation. PLoS Med. 2010;7:e1000341. doi: 10.1371/journal.pmed.1000341. [DOI] [PMC free article] [PubMed] [Google Scholar]
- 31.Bluett J, Ibrahim I, Plant D, Hyrich KL, Morgan AW, Wilson AG, et al. Association of a complement receptor 1 gene variant with baseline erythrocyte sedimentation rate levels in patients starting anti-TNF therapy in a UK rheumatoid arthritis cohort: Results from the Biologics in Rheumatoid Arthritis Genetics and Genomics Study Syndicate cohort. Pharmacogenomics J. 2014;14:171–5. doi: 10.1038/tpj.2013.26. [DOI] [PMC free article] [PubMed] [Google Scholar]
- 32.Kay J, Morgacheva O, Messing SP, Kremer JM, Greenberg JD, Reed GW, et al. Clinical disease activity and acute phase reactant levels are discordant among patients with active rheumatoid arthritis: Acute phase reactant levels contribute separately to predicting outcome at one year. Arthritis Res Ther. 2014;16:R40. doi: 10.1186/ar4469. [DOI] [PMC free article] [PubMed] [Google Scholar]
- 33.Uhlig T, Kvien TK, Pincus T. Test-retest reliability of disease activity core set measures and indices in rheumatoid arthritis. Ann Rheum Dis. 2009;68:972–5. doi: 10.1136/ard.2008.097345. [DOI] [PubMed] [Google Scholar]
- 34.Sharma R, Thakare M, Thomas J, Agrawal S, Rajasekhar L, Narsimulu G. Simplified Disease Activity Index as an index of disease activity in patients with rheumatoid arthritis: A comparison with DAS28. Indian J Rheumatol. 2009;4:11–4. doi: 10.1016/S0973-3698(10)60155-0. [DOI] [Google Scholar]
- 35.Shaver TS, Anderson JD, Weidensaul DN, Shahouri SH, Busch RE, Mikuls TR, et al. The problem of rheumatoid arthritis disease activity and remission in clinical practice. J Rheumatol. 2008;35:1015–22. [PubMed] [Google Scholar]


