

Abstract
Background
The number of patients undergoing autologous haematopoietic cell transplant (HCT) is growing, but little is known about the factors that predict adverse outcomes. Low muscle mass and obesity are associated with disability and premature mortality in individuals with non‐malignant diseases and may predict outcomes after autologous HCT.
Methods
This was a retrospective cohort study of 320 patients who underwent autologous HCT for Hodgkin or non‐Hodgkin lymphoma between 2009 and 2014. Sarcopenia {skeletal muscle index male: <43 cm/m2 [body mass index (BMI) < 25 kg/m2] or < 53 cm/m2 [BMI ≥ 25 kg/m2] and female: <41 cm/m2 [regardless of BMI]) and obesity [total abdominal adiposity ≥450.0 cm2 (male), ≥396.4 cm2 (female)] were assessed from single‐slice abdominal pre‐HCT computed tomography images. Length of hospital stay, first unplanned intensive care unit admission, and 30‐day unplanned readmission were evaluated based on body composition using multivariable regression analysis, and mortality was evaluated with Kaplan–Meier analysis and Gray's test.
Results
Median age at HCT was 53.3 years (range, 18.5 to 78.1 years); 26.3% were sarcopenic and an additional 7.8% were sarcopenic obese pre‐HCT. Sarcopenic obesity was associated with increased risk of prolonged hospitalization [odds ratio (OR) = 3.6, 95% confidence interval (CI) 1.3–9.8], intensive care unit admission (OR = 4.7, 95% CI 1.5–16.1), and unplanned readmission after HCT (OR = 13.6, 95% CI 2.5–62.8). Patients who were sarcopenic obese also had the highest mortality risk at 1 year [hazard ratio (HR): 3.9, 95% CI 1.1–11.0] and 5 years (HR: 2.5, 95% CI 1.1–5.5), compared with patients with normal body composition. Sarcopenia alone, but not obesity alone, was associated with an increased risk of these outcomes, albeit with a lower magnitude of risk than in patients who were sarcopenic obese.
Conclusions
Sarcopenic obesity was an important predictor of outcomes in patients undergoing autologous HCT. These findings could inform targeted prevention strategies in patients at highest risk of complications after HCT.
Keywords: Lymphoma, Haematopoietic cell transplantation, Sarcopenia, Obesity, Mortality, complications
Introduction
Autologous haematopoietic cell transplantation (HCT) is an established treatment approach in patients with lymphoma, either as a frontline therapy or as more commonly, in the relapsed/refractory setting. 1 , 2 , 3 Advances in HCT strategy and supportive care have steadily increased the number of HCTs performed each year, and it is estimated there are >12,000 autologous HCTs performed in the USA annually. 4 , 5 In these patients, the treatment efficacy of autologous HCT must be balanced by the risk of adverse outcomes, which can diminish quality of life and increase mortality risk. 6 , 7 , 8 Therefore, it is imperative to identify patient subgroups who might be at increased risk of adverse outcomes after HCT and incorporate that information into risk‐reduction strategies that maximize the benefits of treatment.
Conventional methods for predicting adverse outcomes from HCT include the Karnofsky Performance Score (KPS) and the HCT‐comorbidity index (HCT‐CI). 9 , 10 , 11 However, the effectiveness of these measures is limited by high inter‐user variability and low predictive power for outcomes other than survival. 12 Advances in software technology have made it possible to use computed tomography (CT) images to assess body composition, 13 , 14 allowing researchers to determine the extent to which abnormalities in body composition, such as obesity and sarcopenia, might predict HCT outcomes.
Sarcopenia is the progressive loss of muscle mass and muscle function caused by aging, inactivity, and disease, and it is associated with physical disability, frailty, and premature mortality; outcomes are especially poor for patients with both sarcopenia and obesity. 15 , 16 In a retrospective analysis of CT images collected pre‐HCT from adult leukaemia patients treated with allogeneic HCT, we identified sarcopenia, which was present in 33.7% of patients, as an independent risk factor for longer hospitalization and mortality. 17 However, it was not known whether other measures of body composition, such as obesity, can influence health outcomes, especially among autologous HCT patients who represent the largest number of HCT patients. The current study builds on prior work 17 by examining the association of both obesity and sarcopenia with a broader range of health outcomes [e.g. requirement for intensive care unit (ICU), 30‐day readmission rate, prolonged length of hospitalization, and survival] among autologous HCT patients. Further, we examined the trajectory of change in muscle mass and adiposity over time, by comparing radiographic studies obtained prior to and after HCT.
Methods
Population cohort and data definitions
This was a retrospective cohort study of patients who underwent autologous HCT for non‐Hodgkin lymphoma (NHL) or Hodgkin lymphoma (HL) as adults (≥18 years old) at City of Hope (COH) between 1 January 2009 and 31 December 2014. Patients were identified from the long‐term follow‐up after HCT research programme at COH, which ensures the active and comprehensive follow‐up of all patients who have undergone HCT at COH since 1976. Patients are consented prior to HCT, and follow‐up is performed by a dedicated research team throughout the life of the survivor. A data collection form is completed by research staff, capturing demographics, cancer diagnosis, pre‐HCT treatment information (e.g. radiation and chemotherapy), and HCT‐related exposures (e.g. conditioning intensity). Importantly, this protocol uses a number of strategies (questionnaire, medical record abstraction, and national registries) to collect information on health‐related outcomes after HCT. Complications are coded using a standardized set of definitions for each outcome, with appropriate source documentation (e.g. pathology reports and imaging studies) available for confirmation of outcomes. This information is entered into an electronic database that can be queried for research studies, allowing us to accurately describe the epidemiology and risk factors {demographics, pre‐HCT, HCT‐related treatment exposures [e.g. conditioning therapy such as carmustine, etoposide, cytarabine and melphalan (BEAM)], and comorbidities at the time of HCT} for de novo health‐related complications after HCT. The COH long‐term follow‐up after HCT research programme has been approved by the COH Institutional Review Board (IRB# 00029), and data abstraction and associated procedures are performed in accordance with the Declaration of Helsinki. For the current study, medical records were abstracted for patient demographics (age at HCT, sex, and race/ethnicity), diagnosis, remission status at HCT [complete radiographic remission (CR) or not in CR], variables necessary to calculate the HCT‐CI using an established web‐based calculator (www.hctci.org), 17 , 18 KPS, conditioning therapy, body mass index (BMI) at HCT, unplanned ICU admission during HCT (first admission occurring between the start of conditioning therapy and HCT hospital discharge), hospital length of stay (LOS), and re‐hospitalization within 30 days of discharge [planned, unplanned (e.g. dehydration, fever in an immunocompromised host, organ dysfunction)]. Risk factors such as history of tobacco and alcohol use prior to HCT were not abstracted because they were not consistently documented in patient medical records. Information on vital status and cause of death was obtained from the National Death Index and COH medical records. High HCT‐CI was defined as having a pre‐HCT comorbidity index ≥3, a threshold that has been consistently associated with adverse health outcomes after HCT. 12 , 18 Good performance status was defined as KPS >80. Hospital LOS was determined from the start of conditioning therapy to discharge or death, and prolonged LOS was defined as ≥24 days (upper tertile for the cohort).
Of the 440 patients who underwent autologous HCT for HL or NHL as adults between 2009 and 2014, 109 were excluded from the current study because of a lack of available CT images for review, and an additional 11 were excluded because the abdominal CT images were >90 days before HCT (N = 5) or because the images were of poor quality (N = 6). With the exception of race/ethnicity, there were no statistically significant differences in patient and treatment‐related characteristics between those included in the study vs. those who were not (see Supporting Information, Table S1)
Computed tomography image analysis
The quantity of muscle and adipose tissue was measured on CT images, which were collected either alone or as part of positron emission tomography imaging (GE Discovery STE PET/CT; GE Healthcare; Chicago, IL) 19 in 11.2% and 88.8% of patients, respectively. Pre‐HCT scans were limited to those within 90 days of stem cell infusion [median 28 days (range, 0 to 90 days)], and post‐HCT scans were limited to those <180 days [median 57 days (range, 22 to 162 days)] after infusion. Two trained (A.I. and K.M.) researchers quantified the cross‐sectional area of muscle and adipose tissue (cm2) at the third lumbar vertebra (L3); an inter‐observer coefficient of <2% was required for 32 patients (10% of the cohort) selected at random, a threshold that is consistent with similar reports in the literature. 13 , 14 , 17 Single‐slice abdominal cross‐sectional area at L3 is highly (>0.9) correlated with whole‐body volumes of muscle and adipose tissue. 20 , 21 , 22 , 23 , 24 , 25 Tissue‐specific Hounsfield unit (HU) ranges were used to discriminate between muscle and adipose tissue, using SliceOmatic Software (Region Growing Module; Software v.5.0 TomoVision, Montreal, Quebec, Canada; Figure 1) 14 , 24 , 26 , 27 ; intra‐class coefficients between the SliceOmatic software and other software are highly similar (0.979 to 1.000, P < 0.001), 13 , 14 with excellent intra‐ observer and inter‐observer agreement for muscle and adiposity measurements (≥0.98). 13 , 14 , 17
Figure 1.
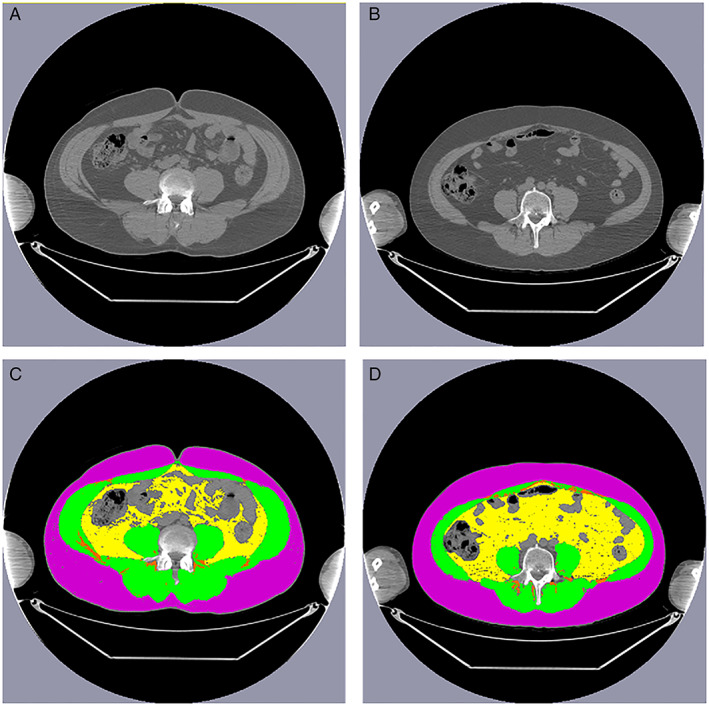
Axial computed tomography images of the third lumbar vertebra region without (top) and with (bottom) annotation showing skeletal muscle (green), subcutaneous adipose tissue (purple), visceral adipose tissue (yellow), intra‐muscular and inter‐muscular adipose tissue (orange) for patients (A) without and (B) with sarcopenic obesity. Characteristics of both patients: male, 50 years old at haematopoietic cell transplant, diagnosis: non‐Hodgkin lymphoma, BEAM conditioning, low (<3) haematopoietic cell transplant‐comorbidity index. Patient on the left (A): body mass index 29.3 kg/m2, skeletal muscle index 63.9 cm/m2, subcutaneous adipose tissue area 271.2 cm2, visceral adipose tissue area 53.0 cm2, intra‐muscular and inter‐muscular adipose tissue area 9.2 cm2; Patient on the right (B): body mass index 27.5 kg/m2, skeletal muscle index 46.7 cm/m2, subcutaneous adipose tissue area 267.9 cm2, visceral adipose tissue area 185.7 cm2, intra‐muscular and inter‐muscular adipose tissue area 7.8 cm2.
The following muscles were included in the muscle area measurements (HU range −29 to 150): psoas, paraspinal (quadratus lumborum and erector spinae), transversus abdominis, external and internal obliques, and rectus abdominis. The skeletal muscle index (SMI) was defined as the muscle area at L3 divided by height. 22 , 23 , 24 , 25 We used an a priori definition of sarcopenia, 9 , 18 categorized by sex and BMI‐specific cutoffs for abnormal SMI [male: <43 cm/m2 (BMI < 25 kg/m2) or <53 cm/m2 (BMI ≥ 25 kg/m2) and female: <41 cm/m2 (regardless of BMI)]. Measures of adiposity included the following: visceral (intra‐abdominal) adipose tissue (VAT; HU range −150 to −50), subcutaneous adipose tissue (SAT; HU range −190 to −30), intramuscular adipose tissue (IMAT, HU range −190 to −30). Total adiposity (TAT) was the sum of VAT, SAT, and IMAT. Because of a lack of well‐established definitions for these adiposity measures, we used sex‐specific upper tertiles as the cutoff for abnormal VAT [≥170.0 cm2 (male), ≥100.0 cm2 (female)], SAT [≥265.0 cm2 (male), ≥283.0 cm2 (female)], IMAT [>15.0 cm2 (male), >13.4 cm2 (female)], TAT [≥450.0 cm2 (male), ≥396.4 cm2 (female)]. Obesity was defined as abnormal TAT, and sarcopenic obesity was defined as having both an abnormal SMI and an abnormal TAT. Separate exploratory analyses were performed using the established BMI‐derived definition (≥30 kg/m2) of obesity ( Table S2).
Statistical analysis
Univariate analyses (χ2 test for categorical, t‐test or analysis of variance for parametric continuous variables, Kruskal–Wallis for non‐parametric) were performed to compare baseline demographic, clinical, treatment‐related factors, and body composition measures between male and female patients. Additionally, we compared LOS, ICU admission, 30‐day unplanned readmission rate by body composition phenotype, categorized as (i) normal body composition (not sarcopenic and not obese), (ii) obese (obese and not sarcopenic), (iii) sarcopenic (not obese and sarcopenic), (iv) sarcopenic obese (obese and sarcopenic). We used paired t‐tests to compare changes in muscle and adiposity measures between pre‐HCT and post‐HCT scans. The Kaplan–Meier method was used to examine the effect of body composition measures on overall survival; log‐rank tests were used to compare survival rates for the overall cohort and by sex (Figures S1 and S2). We also examined the cumulative incidence of cause‐specific (relapse‐related and non‐relapse‐related) mortality for the overall cohort and by sex, taking into consideration competing risk of death for right‐censored data; we used Gray's test 28 to compare the cumulative incidence curves ( Figure S3). Patients alive at last contact were right‐censored at 5 years. 28
Multivariable regression models were created to examine the impact of abnormal body composition (categorical) on select health outcomes {logistic regression [adjusted odds ratio (OR)]: prolonged LOS [≥24 days, <24 days], ICU admission [yes, no], 30‐day unplanned readmission [yes, no]; Cox‐proportional hazard models [hazard ratio (HR)]: 1‐ and 5‐year survival}, adjusting for a priori‐determined variables. These variable included: age at HCT (continuous), sex, HCT‐CI (<3, ≥3), KPS (continuous), lymphoma diagnosis (Hodgkin, diffuse large b‐cell lymphoma, mantle cell, follicular, T‐cell, other), and remission status at HCT (CR or not in CR); as a result of high collinearity between conditioning therapy and diagnosis, conditioning therapy was not included in the final models. A two‐sided P value <0.05 was considered statistically significant.
Results
Patient characteristics
The median age at HCT was 50.8 years (range 18.5 to 78.1 years), and the majority of patients were male (61.9%), non‐Hispanic white (55.6%), had a diagnosis of diffuse large b‐cell lymphoma (56.4%), received BEAM conditioning (57.1%), were in complete remission at HCT (56.3%), had a good KPS (>80, 72.2%), and had a low HCT‐CI score [(0–2) 83.8%] at HCT (Table 1). With the exception of the NHL subtype, there were no statistically significant differences in the demographic, clinical, and treatment characteristics by sex. As expected, there were significant differences in the body composition measures between male and female patients, with male patients having increased height, weight, BMI, SMI, VAT, SAT, and TAT pre‐HCT, compared with female patients. Interestingly, there was modest correlation [R range: 0.232 (weak) to 0.671 (moderate)] between imaging parameters and conventional measures such as body weight and BMI irrespective of sex ( Table S3). Overall, 84 patients (26.3% of the cohort) were sarcopenic non‐obese and an additional 25 (7.8%) were sarcopenic obese prior to HCT.
Table 1.
Demographic and clinical characteristics of haematopoietic cell transplantation patients
| Characteristics | Overall cohort (N = 320) | Male (n = 198) | Female (n = 122) | P value |
|---|---|---|---|---|
| Age at HCT (years) | ||||
| Median (range) | 53.3 (18.5–78.1) | 53.5 (18.5–78.1) | 52.5 (19.7–72.0) | |
| Mean (SD) | 50.8 (13.7) | 51.6 (13.2) | 49.5 (14.3) | 0.172 |
| Race/Ethnicity, No. (%) | ||||
| Non‐Hispanic white | 178 (55.6) | 107 (54.0) | 71 (58.2) | |
| Hispanic | 83 (25.9) | 56 (28.3) | 27 (22.1) | |
| Asian | 39 (12.2) | 12 (11.6) | 16 (13.1) | |
| Other | 20 (6.3) | 12 (6.1) | 8 (6.6) | 0.681 |
| Diagnosis, No. (%) | ||||
| Hodgkin lymphoma | 84 (26.2) | 48 (24.2) | 36 (29.5) | |
| Non‐Hodgkin lymphoma | 236 (73.8) | 150 (75.8) | 86 (70.5) | 0.298 |
| DLBCL | 133 (56.4) | 74 (49.3) | 59 (68.6) | |
| Mantle cell | 50 (21.2) | 43 (28.7) | 7 (8.1) | |
| Follicular | 24 (10.2) | 14 (9.3) | 10 (11.6) | |
| T‐cell | 21 (8.9) | 13 (8.7) | 8 (9.3) | |
| Other | 8 (3.4) | 6 (4.0) | 2 (2.3) | 0.004 a |
| Conditioning, No. (%) | ||||
| BEAM | 183 (57.1) | 114 (57.6) | 69 (56.6) | |
| CBV | 126 (39.4) | 78 (39.4) | 48 (39.3) | |
| Other | 11 (3.4) | 6 (3.0) | 5 (4.1) | 0.876 |
| Remission status at HCT, No. (%) | ||||
| Complete remission | 180 (56.3) | 109 (55.1) | 71 (58.2) | |
| Not in complete remission | 140 (43.8) | 89 (44.9) | 51 (41.8) | 0.582 |
| Karnofsky performance score, No. (%) | ||||
| >80 | 231 (72.2) | 143 (72.2) | 88 (72.1) | |
| ≤80 | 86 (26.9) | 54 (27.3) | 32 (26.2) | |
| Unknown | 3 (0.9) | 1 (0.5) | 2 (1.6) | 0.587 |
| HCT‐comorbidity index, No. (%) | ||||
| 0–2 | 268 (83.8) | 167 (84.3) | 101 (82.8) | |
| ≥3 | 52 (16.2) | 31 (15.7) | 21 (17.2) | 0.714 |
| Body mass index | ||||
| Mean, kg/m2 (SD) | 28.3 (5.7) | 29.2 (5.4) | 26.9 (6.0) | <0.001 |
| <25 kg/m2 | 92 (28.8) | 38 (19.2) | 54 (44.3) | |
| 25–29.9 kg/m2 | 125 (39.7) | 88 (44.4) | 37 (30.3) | |
| ≥30 kg/m2 | 103 (32.2) | 72 (36.4) | 31 (25.4) | <0.001 |
| Height | ||||
| Mean, cm (SD) | 170.4 (9.0) | 174.7 (6.9) | 163.3 (7.5) | <0.001 |
| Weight | ||||
| Mean, kg (SD) | 82.7 (19.7) | 89.4 (18.5) | 71.1 (16.3) | <0.001 |
| Skeletal muscle index | ||||
| Mean, cm/m2 (SD) | 50.8 (10.3) | 56.1 (7.9) | 42.2 (7.7) | <0.001 |
| Visceral adipose tissue area | ||||
| Mean, cm2 (SD) | 122.4 (81.5) | 143.7 (87.0) | 87.8 (56.9) | <0.001 |
| Subcutaneous adipose tissue area | ||||
| Mean, cm2 (SD) | 255.9 (118.1) | 250.8 (114.8) | 264.1 (123.1) | 0.329 |
| Intramuscular adipose tissue area | ||||
| Mean, cm2 (SD) | 12.0 (7.5) | 11.7 (7.1) | 12.4 (8.0) | 0.430 |
| Total abdominal tissue area | ||||
| Mean, cm2 (SD) | 390.8 (169.0) | 406.6 (173.8) | 365.2 (158.4) | 0.033 |
BEAM, carmustine (BCNU), etoposide, cytarabine (ARA‐C), melphalan; CBV, cyclophosphamide, BCNU, etoposide (VP‐16); DLBCL, diffuse large B‐cell lymphoma; HCT, haematopoietic cell transplantation; No., number; SD, standard deviation.
Subset analysis within non‐Hodgkin lymphoma.
Health outcomes by pre‐haematopoietic cell transplantation body composition measures
Length of hospitalization
Compared with patients with normal body composition, patients who were sarcopenic obese had the longest LOS (mean 28.6 days vs. 23.4 days), followed by those who were only sarcopenic (mean 24.6 days); P = 0.003; Table 2. The odds of having a prolonged LOS was 2.0‐fold (95% CI 1.2–3.5) higher among patients who were sarcopenic (reference: normal body composition), and the odds were highest for patients with sarcopenic obesity (OR: 3.6, 95% CI 1.3–9.8; Table 2).
Table 2.
Pre‐haematopoietic cell transplantation body composition measures and short‐term health outcomes. P values <0.05 are in bold font
| Mean LOS, days (SD) | P value | Prolonged LOS, a N (%) | P value | Unadjusted OR (95%CI) | Adjusted b OR (95%CI) | ICU admission N, (%) | P value | Unadjusted OR (95%CI) | Adjusted b OR (95%CI) | 30 days readmit N, (%) | P value | Unadjusted OR (95%CI) | Adjusted b OR (95%CI) | |
|---|---|---|---|---|---|---|---|---|---|---|---|---|---|---|
| Body mass index | ||||||||||||||
| <25 kg/m2 (N = 90) | 23.5 (3.5) | 0.112 | 31 (34.4) | 0.949 | 1.0 | 1.0 | 13 (14.4) | 0.933 | 1.0 | 1.0 | 4 (4.4) | 0.582 | 1.0 | 1.0 |
| 25–29.9 kg/m2 (N = 127) | 23.9 (6.3) | 43 (33.9) | 1.0 (0.6–1.7) | 0.8 (0.4–1.5) | 17 (13.4) | 0.9 (0.4–2.0) | 0.9 (0.4–2.1) | 10 (7.9) | 1.8 (0.5–6.1) | 2.0 (0.5–7.3) | ||||
| ≥30 kg/m2 (N = 103) | 25.4 (8.7) | 37 (35.9) | 1.1 (0.6–1.9) | 1.0 (0.5–2.0) | 13 (12.6) | 0.9 (0.4–2.0) | 0.7 (0.3–1.7) | 6 (5.9) | 1.4 (0.4–5.0) | 1.0 (0.2–3.9) | ||||
| Sarcopenia | ||||||||||||||
| No (N = 211) | 23.6 (6.2) | 0.013 | 58 (27.5) | <0.001 | 1.0 | 1.0 | 18 (8.5) | <0.001 | 1.0 | 1.0 | 8 (3.8) | 0.011 | 1.0 | 1.0 |
| Yes (N = 109) | 25.5 (7.2) | 53 (48.6) | 2.5 (1.5–4.0) | 2.0 (1.2–3.5) | 25 (22.9) | 3.2 (1.7–6.2) | 3.7 (1.8–7.8) | 12 (11.1) | 3.2 (1.3–8.0) | 6.4 (2.1–19.5) | ||||
| Visceral adiposity | ||||||||||||||
| No (N = 215) | 23.8 (6.7) | 0.140 | 66 (30.7) | 0.032 | 1.0 | 1.0 | 26 (12.1) | 0.313 | 1.0 | 1.0 | 17 (7.9) | 0.081 | 1.0 | 1.0 |
| Yes (N = 105) | 25.0 (6.6) | 45 (42.9) | 1.7 (1.0–2.8) | 1.1 (0.6–1.8) | 17 (16.2) | 1.4 (0.7–2.7) | 1.0 (0.5–2.1) | 3 (2.9) | 0.3 (0.1–1.2) | 0.4 (0.1–1.4) | ||||
| Subcutaneous adiposity | ||||||||||||||
| No (N = 214) | 24.1 (6.3) | 0.566 | 74 (34.6) | 0.954 | 1.0 | 1.0 | 27 (12.6) | 0.541 | 1.0 | 1.0 | 13 (6.1) | 0.847 | 1.0 | 1.0 |
| Yes (N = 106) | 24.5 (7.2) | 37 (34.9) | 1.0 (0.6–1.7) | 1.2 (0.7–2.1) | 16 (15.1) | 1.2 (0.6–2.4) | 1.0 (0.5–2.0) | 7 (6.7) | 1.1 (0.4–2.8) | 1.0 (0.3–2.6) | ||||
| Intramuscular adiposity | ||||||||||||||
| No (N = 213) | 23.7 (6.2) | 0.072 | 65 (30.5) | 0.027 | 1.0 | 1.0 | 28 (13.1) | 0.829 | 1.0 | 1.0 | 15 (7.0) | 0.213 | 1.0 | 1.0 |
| Yes (N = 107) | 25.2 (7.4) | 46 (43.0) | 1.7 (1.1–2.8) | 1.1 (0.6–1.9) | 15 (14.0) | 1.1 (0.6–2.1) | 0.8 (0.4–1.6) | 5 (4.7) | 0.5 (0.0–2.3) | 0.4 (0.1–1.5) | ||||
| Total abdominal adiposity | ||||||||||||||
| No (N = 214) | 23.9 (6.3) | 0.185 | 68 (31.8) | 0.120 | 1.0 | 1.0 | 28 (13.1) | 0.792 | 1.00 | 1.0 | 14 (6.0) | 0.767 | 1.0 | 1.0 |
| Yes (N = 106) | 24.9 (7.3) | 43 (40.6) | 1.5 (0.9–2.4) | 1.4 (0.8–2.5) | 15 (14.2) | 1.1 (0.6–2.2) | 0.9 (0.4–1.8) | 6 (5.7) | 0.9 (0.3–2.3) | 0.8 (0.3–2.4) | ||||
| Body composition | ||||||||||||||
| Not sarcopenic, Not obese (N = 130) | 23.4 (7.1) | 0.003 | 30 (23.1) | <0.001 | 1.0 | 1.00 | 11 (8.5) | 0.002 | 1.0 | 1.0 | 6 (4.7) | 0.037 | 1.0 | 1.0 |
| Not sarcopenic, obese (N = 81) | 23.8 (4.6) | 28 (34.6) | 1.8 (0.9–3.3) | 1.8 (1.0–3.6) | 7 (8.6) | 1.0 (0.4–2.8) | 0.8 (0.3–2.2) | 2 (2.5) | 0.5 (0.1–2.6) | 0.5 (0.1–2.6) | ||||
| Sarcopenic, not obese (N = 84) | 24.6 (4.7) | 38 (45.2) | 2.8 (1.5–5.0) | 2.6 (1.3–5.3) | 17 (20.2) | 2.8 (1.2–6.2) | 3.0 (1.2–7.5) | 8 (9.5) | 2.2 (0.7–6.5) | 4.0 (1.1–14.2) | ||||
| Sarcopenic obese (N = 25) | 28.6 (12.1) | 15 (60.0) | 5.0 (2.0–12.3) | 3.6 (1.3–9.8) | 8 (32.0) | 5.1 (1.8–14.5) | 4.7 (1.5–16.1) | 4 (16.7) | 4.1 (1.1–15.8) | 13.6 (2.5–62.8) | ||||
CI, confidence interval; ICU, intensive care unit; LOS, length of hospital stay for HCT; N, number; OR, odds ratio; Readmit, readmission
Defined as ≥24 days (upper tertile for the cohort).
Multivariable logistic regression; model adjusted for age at HCT, sex, HCT‐specific comorbidity index, Karnofsky performance status, diagnosis, remission status at HCT.
Intensive care unit admission
Forty‐three (13.4%) patients required ICU admission during their HCT. Compared with patients with normal body composition, patients who were sarcopenic obese had the highest rate of ICU admission (32.0% vs. 8.5%), followed by those who were only sarcopenic (20.2%); P = 0.002; Table 2. The odds of requiring ICU admission were 3.7‐fold (95% CI 1.8–7.8) higher among patients who were sarcopenic (reference: normal body composition), and the odds were highest for patients with sarcopenic obesity (OR: 4.7, 95% CI 1.5–16.1; Table 2).
Unplanned readmission
Twenty (6.25%) patients had an unplanned readmission within 30 days of hospital discharge. Compared with patients with normal body composition, patients who were sarcopenic obese had the highest rate of readmission (16.7% vs. 4.7%; Table 2), followed by those who were only sarcopenic (9.5%); P = 0.037; Table 2. The odds of unplanned readmission were 6.4‐fold (95% CI 2.1–19.5) higher among patients who were sarcopenic (reference: normal body composition), and the odds were highest for patients with sarcopenic obesity (OR: 13.6, 95% CI 2.5–62.8; Table 2).
Overall survival after haematopoietic cell transplantation
The overall survival probability of the cohort was 90.3% at 1 year and 73.9% at 5 years after HCT. The 1 and 5 year survival probabilities were significantly worse for patients who were sarcopenic compared with those who were not (1 year: 83.6% vs. 93.4%, P = 0.006; 5 years: 61.3% vs. 80.1%, P < 0.001; Table 3, Figure 2A). These group differences persisted, irrespective of cause of death (relapse‐related or non‐relapse‐related); Figure S1. Sarcopenia was associated with a 2.5‐fold risk (95% CI 1.0–5.4) of all‐cause mortality at 1 year and 1.8‐fold risk (95% CI 1.1–2.9) of all‐cause mortality at 5 years after HCT (Table 3). Notably, patients who were sarcopenic obese had the lowest survival probabilities (1 year: 76.0%; 5 years: 51.33%; Table 3, Figure 2), and had the highest 1 year (HR: 3.9, 95% CI 1.1–11.0) and 5 year (HR: 2.5, 95% CI 1.1–5.5) mortality risks (Table 3).
Table 3.
Survival probability and risk of one‐ and five‐year all‐cause mortality after haematopoietic cell transplantation
| 1‐year all‐cause mortality | 5‐year all‐cause mortality | |||||||||||
|---|---|---|---|---|---|---|---|---|---|---|---|---|
| Survival probability (%; 95% CI) | P value | Unadjusted hazard ratio (95% CI) | P value | Adjusteda hazard ratio (95% CI) | P value | Survival probability (%; 95% CI) | P value | Unadjusted hazard ratio (95% CI) | P value | Adjusteda hazard ratio (95% CI) | P value | |
| Model 1 | ||||||||||||
| Not sarcopenic | 93.4 (89.1–96.0) | 1.0 | 1.0 | 80.1 (74.0–85.0) | 1.0 | 1.0 | ||||||
| Sarcopenic | 83.6 (75.3–89.4) | 0.006 | 2.6 (1.3–5.2) | 0.007 | 2.5 (1.0–5.4) | 0.046 | 61.3 (51.5–69.8) | <0.001 | 2.2 (1.4–3.4) | <0.001 | 1.8 (1.1–2.9) | 0.022 |
| Model 2 | ||||||||||||
| Not sarcopenic, not obese | 94.0 (88.1–96.9) | 1.0 | 1.0 | 80.3 (72.2–86.3) | 1.0 | 1.0 | ||||||
| Not sarcopenic, obese | 92.6 (84.3–96.6) | 1.2 (0.4–3.4) | 0.751 | 1.0 (0.2–3.3) | 0.985 | 79.9 (69.2–87.2) | 1.0 (0.5–1.9) | 0.953 | 1.0 (0.5–1.9) | 0.976 | ||
| Sarcopenic, not obese | 85.9 (76.5–91.7) | 2.4 (0.9–5.8) | 0.061 | 2.1 (0.8–5.5) | 0.180 | 64.3 (53.0–73.5) | 2.0 (1.5–3.4) | 0.014 | 1.6 (0.9–2.9) | 0.118 | ||
| Sarcopenic, obese | 76.0 (54.2–88.4) | 0.015 | 4.4 (1.5–12.7) | 0.006 | 3.9 (1.1–11.0) | 0.042 | 51.3 (30.4–68.9) | <0.001 | 3.2 (1.6–6.3) | 0.001 | 2.5 (1.1–5.5) | 0.021 |
| P trend | 0.004 | P trend | 0.040 | P trend | <0.001 | P trend | 0.018 | |||||
Multivariable Cox regression; model adjusted for age at haematopoietic cell transplantation (HCT), sex, HCT‐specific comorbidity index, Karnofsky performance status, diagnosis, and remission status at HCT.
Figure 2.
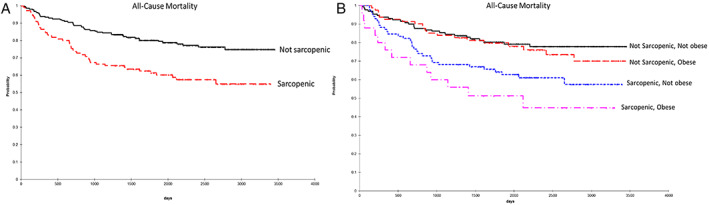
Kaplan–Meier plots of overall survival according to (A) pre‐haematopoietic cell transplant sarcopenia, and (B) the combination of sarcopenia and abdominal obesity.
Impact of changes in body composition
There were 275 patients (85.9% of the cohort) who had both a pre‐HCT and post‐HCT scan available for review; there were no statistically significant clinical or treatment‐related differences between patients with and without post‐HCT scans ( Table S4). SMI was the only body composition measure that significantly changed between the pre‐HCT and post‐HCT assessments, with a mean change of −1.5 cm2 (P < 0.001; Table S5). There were 30 (10.9%) patients who developed de novo sarcopenia after HCT (i.e. had normal SMI pre‐HCT). Of note, there were no statistically significant demographics, clinical, and treatment‐related predictors of de novo sarcopenia ( Table S6). Patients who developed de novo sarcopenia had significantly worse 1 and 5 year overall survival probabilities compared with patients with normal muscle mass (1 year: 93.3% vs. 83.3%, P < 0.005; 5 years: 79.0% vs. 52.8%, P = 0.013). De novo sarcopenia was associated with a significantly higher risk of 1 year (HR: 9.4, 95%CI 2.0–46.8) and 5 year mortality (HR: 2.6, 95%CI 1.3–6.2) compared with patients with no sarcopenia.
Discussion
In this contemporary cohort of patients undergoing autologous HCT for lymphoma, we found a significant association between pre‐HCT sarcopenia and clinically important outcomes such as LOS, ICU admission, and 30‐day hospital readmission risk after HCT. Patients who were sarcopenic obese fared especially worse across all outcomes. There were also clear differences in 1 and 5 year survival rates by pre‐HCT body composition measures, with sarcopenic obese patients having a 51% 5 year survival rate compared with 80% for patients who had normal body composition. After adjusting for well‐established modifiers of overall survival such as disease status at HCT, age, comorbidity burden, and diagnosis, there was a >2‐fold risk of all‐cause mortality in patients who were sarcopenic obese compared with those who were not. Muscle mass was the only body composition measure that significantly changed from pre‐HCT to post‐HCT. Patients who developed de novo sarcopenia after HCT had a significantly higher risk of mortality compared with patients who maintained normal muscle mass throughout. Of note, BMI, the most commonly utilized measure of body habitus, was not significantly associated with any of the adverse outcomes examined in our study. The overall findings of this study speak to the importance of careful evaluation of body composition prior to and after HCT and the need to consider innovative interventions to minimize the short‐term and long‐term adverse consequences in high‐risk patients.
Body composition measures for the current study were acquired from archived CT images obtained as part of standard of care, a strategy that has been successfully used in other oncology and non‐oncology populations. 22 , 23 , 24 , 25 To date, studies examining the impact of body composition in cancer patients have mostly focused on patients with solid cancers, 20 , 21 , 22 , 29 , 30 including those with gastrointestinal cancers, because of their close link with undernutrition and availability of abdominal scans. Our findings are in line with some of the findings reported in two previous retrospective cohort studies of patients who underwent autologous HCT for lymphoma. 31 , 32 The first 31 included a limited assessment of the psoas muscle and found an inverse correlation between psoas muscle mass and length of hospitalization and a higher risk of complications during HCT and re‐hospitalization after HCT in male but not female patients. The second 32 included a mixed cohort of allogeneic and autologous HCT patients and found a higher risk of complications among sarcopenic patients undergoing allogeneic HCT but not autologous HCT. Our study builds on the previous studies by describing the added impact of adiposity on a broader set of clinically relevant short‐term and long‐term HCT outcomes, using sex‐stratified indices to define abnormal measures of body composition. Furthermore, by using a longitudinal study design, we were able to highlight for the first time the important prognostic information that can be obtained from post‐HCT assessments.
Understanding the impact of change in body composition can allow for implementation of appropriate interventions for primary or secondary prevention. For some high‐risk patients, such as those who are sarcopenic obese, clinicians may consider alternatives to autologous HCT, such as long‐term targeted therapy or immunotherapy, taking into account the relative survival benefit offered by autologous HCT. 3 Other patients may be candidates for prehabilitation, 33 , 34 , 35 initiated in the 2 to 6 weeks prior to HCT when no systemic therapy is given and continued through the HCT hospitalization, as tolerated. 36 Optimizing conditioning regimen dose based on more novel body size indices such as fat‐free mass and conducting pharmacokinetic studies in sarcopenic obese patients may also identify simple dose adjustments that may improve relapse‐related mortality (Figure S1). 37 , 38 Finally, given our findings about the clinical relevance of post‐HCT measures, innovative approaches are needed to screen and treat patients shortly after HCT. These include strength training, dietary optimization, or better management of comorbidities (e.g. testosterone or growth hormone replacement), strategies that have been effective for patients with chronic pulmonary disease 39 , 40 , 41 and those affected by human immunodeficiency virus‐related muscle wasting. 41 , 42 , 43
There are some limitations to our study. First, the analysed images were from scans obtained at a range of pre‐HCT time points for purposes other than measurement of body composition, which may have resulted in inter‐patient variability. However, we used a well‐established protocol to perform blinded ascertainment of the body composition measures, minimized inter‐observer variability (coefficient <2%) through strict quality control, relied on standardized and validated cutoffs for abnormal SMI, and implemented sex‐based cutoffs for abnormal adiposity, an important consideration given the sex‐based differences in body composition at baseline; of note, the use of BMI‐based definitions of sarcopenic obesity resulted in similar magnitudes of risk with many of the outcomes examined, albeit with wider confidence intervals because of the smaller number of patients who were categorized as such ( Table S2). Second, the study population included patients with many lymphoma subtypes who had likely received a variety of frontline and salvage therapies prior to HCT, making it difficult to isolate the impact of the pre‐HCT clinical course on post‐HCT outcomes. However, our multivariable analyses adjusted for lymphoma subtypes as well as prognostic variables such as remission status and comorbidity burden at HCT. 44 , 45 Third, it is not possible to separate the impact of sarcopenia caused by biological aging from the sarcopenia caused by ongoing malignant disease, making mechanistic assessment challenging. Additional limitations include lack of information on pre‐HCT modifiers (e.g. tobacco and alcohol use) of health outcomes after HCT and relatively small number of events for certain outcomes such as 30‐day readmission, which may have contributed to unstable risk estimates. Studies are needed to independently validate our findings (especially as it relates to the internally derived cutoffs for abdominal adiposity), and to examine the relative contribution of other functional measures (e.g. grip strength and walking speed) and blood biomarkers (e.g. inflammatory or aging‐related biomarkers) that can be obtained as part of routine pre‐HCT assessment, as well as the diagnostic accuracy of other imaging platforms (e.g. ultrasound‐based and bioelectrical impedance) that may be available to evaluate body composition prior to HCT.
In conclusion, this is the largest study to comprehensively examine the association between pre‐HCT and post‐HCT measures of body composition and outcomes after autologous HCT. We found a one‐time pre‐HCT measure of sarcopenia, and adiposity was a significant and independent predictor of mortality at 1 and 5 years after HCT, and the association with sarcopenia persisted after HCT as well. Sarcopenic obesity not only limited the duration of survival but also decreased the quality of survival, as patients with sarcopenic obesity were more likely to experience prolonged hospital LOS, ICU admission, and unplanned re‐hospitalization. The information obtained from this study may help clinicians develop risk reduction strategies, such as evaluating alternatives to HCT in patients at highest risk, or better management of comorbid health conditions, such as dietary optimization, increasing physical activity, and strength training, during and after autologous HCT. The growing number of patients undergoing HCT worldwide makes the development of personalized approaches to transplantation imperative, to safeguard the well‐being of patients well‐beyond the immediate post‐HCT period.
Author contributions
S.H.A designed the research, collected and assembled the data, analysed and interpreted the data, and wrote the paper. C.L.S. and F.L.W. analysed and interpreted the data and contributed to the writing of the paper. A.I., J.B.T, K.M., A.H., J.M.Z., and T.J.S. collected and assembled the data and contributed to the writing of the paper. J.M.S., S.M.M., S.M., L.W.J., S.J.F., and R.N., analysed and interpreted the data and contributed to the writing of the paper.
Conflict of interest
S.H.A. declares he has no disclosures, A.I. declares he has no disclosures, J.B.T. declares she has no disclosures, K.M. declares she has no disclosures, A.H. declares he has no disclosures, J.S.M. declares she has no disclosures, J.M.Z declares she has no disclosures, S.M.‐M. declares she has no disclosures, S.M. declares she has no disclosures, T.J.S. declares he has no disclosures, J.M.S. declares she has no disclosures, L.W.J. owns stock in Pacylex Inc., C.‐L.S. declares she has no disclosures, S.J.F. declares he has no disclosures, F.L. W. declares she has no disclosures, R.N. declares he has no disclosures.
Supporting information
Table S1. Patients who underwent a first autologous HCT for lymphoma as adults between 2009 and 2014, including those who were ineligible for the current study.
Table S2. Exploratory analyses using BMI‐derived definition (≥30 Kg/m2) of obesity.
Figure S1 Kaplan‐Meier plots of overall survival in males according to (A) pre‐HCT sarcopenia, and (B) the combination of sarcopenia and abdominal obesity.
Figure S2 Kaplan‐Meier plots of overall survival in females according to (A) pre‐HCT sarcopenia, and (B) the combination of sarcopenia and abdominal obesity.
Figure S3. Cumulative incidence of non‐relapse mortality and relapse‐related mortality according to pre‐HCT sarcopenia status for the overall cohort (A), males (B), females (C)
Table S3. Correlation between imaging parameters and conventional measures such as body weight and body mass index for the overall cohort and by sex
Table S4. Patient characteristics: individuals with and without post‐HCT scans
Table S5. Pairwise t‐test comparison of pre‐ and post‐HCT measures
Table S6. Multivariable regression analysis, predictors of de novo sarcopenia after HCT
Acknowledgements
This study was supported, in part, by grants from the Lymphoma/Leukemia Society Scholar Award for Clinical Research (Armenian) and National Institutes of Health/National Cancer Institute (CA196854 [Armenian]). Editorial assistance was provided by Nancy Linford, PhD. The authors maintained final editorial control of all content in the manuscript. The authors of this manuscript certify that they comply with the ethical guidelines for authorship and publishing in the Journal of Cachexia, Sarcopenia and Muscle. 46
Armenian S. H., Iukuridze A., Teh J. B., Mascarenhas K., Herrera A., McCune J. S., Zain J. M., Mostoufi‐Moab S., McCormack S., Slavin T. P., Scott J. M., Jones L. W., Sun C.‐L., Forman S. J., Wong F. L., and Nakamura R. (2020) Abnormal body composition is a predictor of adverse outcomes after autologous haematopoietic cell transplantation, Journal of Cachexia, Sarcopenia and Muscle, 11, 962–972. 10.1002/jcsm.12570.
References
- 1. Philip T, Guglielmi C, Hagenbeek A, Somers R, Van der Lelie H, Bron D, et al. Autologous bone marrow transplantation as compared with salvage chemotherapy in relapses of chemotherapy‐sensitive non‐Hodgkin's lymphoma. N Engl J Med 1995;333:1540–1545. [DOI] [PubMed] [Google Scholar]
- 2. Schouten HC, Qian W, Kvaloy S, Porcellini A, Hagberg H, Johnsen HE, et al. High‐dose therapy improves progression‐free survival and survival in relapsed follicular non‐Hodgkin's lymphoma: results from the randomized European CUP trial. J Clin Oncol 2003;21:3918–3927. [DOI] [PubMed] [Google Scholar]
- 3. Dahi PB, Lazarus HM, Sauter CS, Giralt SA. Strategies to improve outcomes of autologous hematopoietic cell transplant in lymphoma. Bone Marrow Transplant 2019;54:943–960. [DOI] [PMC free article] [PubMed] [Google Scholar]
- 4. McCarthy PL Jr, Hahn T, Hassebroek A, Bredeson C, Gajewski J, Hale G, et al. Trends in use of and survival after autologous hematopoietic cell transplantation in North America, 1995‐2005: significant improvement in survival for lymphoma and myeloma during a period of increasing recipient age. Biol Blood Marrow Transplant 2013;19:1116–1123. [DOI] [PMC free article] [PubMed] [Google Scholar]
- 5. Majhail NS, Tao L, Bredeson C, Davies S, Dehn J, Gajewski JL, et al. Prevalence of hematopoietic cell transplant survivors in the United States. Biol Blood Marrow Transplant 2013;19:1498–1501. [DOI] [PMC free article] [PubMed] [Google Scholar]
- 6. Belete H, Burns LJ, Shanley R, Nayar M, McClune B, Lazaryan A, et al. Transplantation related toxicity and mortality in older autologous hematopoietic cell transplantation recipients. Am J Hematol 2017;92:E529–E533. [DOI] [PMC free article] [PubMed] [Google Scholar]
- 7. Myers RM, Hill BT, Shaw BE, Kim S, Millard HR, Battiwalla M, et al. Long‐term outcomes among 2‐year survivors of autologous hematopoietic cell transplantation for Hodgkin and diffuse large b‐cell lymphoma. Cancer 2018;124:816–825. [DOI] [PMC free article] [PubMed] [Google Scholar]
- 8. Vanderwalde AM, Sun CL, Laddaran L, Francisco L, Armenian S, Berano‐Teh J, et al. Conditional survival and cause‐specific mortality after autologous hematopoietic cell transplantation for hematological malignancies. Leukemia 2013;27:1139–1145. [DOI] [PMC free article] [PubMed] [Google Scholar]
- 9. Berro M, Arbelbide JA, Rivas MM, Basquiera AL, Ferini G, Vitriu A, et al. Hematopoietic cell transplantation‐specific comorbidity index predicts morbidity and mortality in autologous stem cell transplantation. Biol Blood Marrow Transplant 2017;23:1646–1650. [DOI] [PubMed] [Google Scholar]
- 10. Jaglowski SM, Ruppert AS, Hofmeister CC, Elder P, Blum W, Klisovic R, et al. The hematopoietic stem cell transplant comorbidity index can predict for 30‐day readmission following autologous stem cell transplant for lymphoma and multiple myeloma. Bone Marrow Transplant 2014;49:1323–1329. [DOI] [PMC free article] [PubMed] [Google Scholar]
- 11. Saad A, Mahindra A, Zhang MJ, Zhong X, Costa LJ, Dispenzieri A, et al. Hematopoietic cell transplant comorbidity index is predictive of survival after autologous hematopoietic cell transplantation in multiple myeloma. Biol Blood Marrow Transplant 2014;20:402–408 e1. [DOI] [PMC free article] [PubMed] [Google Scholar]
- 12. Elsawy M, Sorror ML. Up‐to‐date tools for risk assessment before allogeneic hematopoietic cell transplantation. Bone Marrow Transplant 2016;51:1283–1300. [DOI] [PubMed] [Google Scholar]
- 13. van Vugt JL, Levolger S, Gharbharan A, Koek M, Niessen WJ, Burger JW, et al. A comparative study of software programmes for cross‐sectional skeletal muscle and adipose tissue measurements on abdominal computed tomography scans of rectal cancer patients. J Cachexia Sarcopenia Muscle 2017;8:285–297. [DOI] [PMC free article] [PubMed] [Google Scholar]
- 14. Prado CM, Birdsell LA, Baracos VE. The emerging role of computerized tomography in assessing cancer cachexia. Curr Opin Support Palliat Care 2009;3:269–275. [DOI] [PubMed] [Google Scholar]
- 15. Cruz‐Jentoft AJ, Sayer AA. Sarcopenia. Lancet 2019;393:2636–2646. [DOI] [PubMed] [Google Scholar]
- 16. Pratesi A, Tarantini F, Di Bari M. Skeletal muscle: an endocrine organ. Clin Cases Miner Bone Metab 2013;10:11–14. [DOI] [PMC free article] [PubMed] [Google Scholar]
- 17. Armenian SH, Xiao M, Berano Teh J, Lee B, Chang HA, Mascarenhas K, et al. Impact of sarcopenia on adverse outcomes after allogeneic hematopoietic cell transplantation. J Natl Cancer Inst 2019. [DOI] [PMC free article] [PubMed] [Google Scholar]
- 18. Sorror ML, Storb RF, Sandmaier BM, Maziarz RT, Pulsipher MA, Maris MB, et al. Comorbidity‐age index: a clinical measure of biologic age before allogeneic hematopoietic cell transplantation. J Clin Oncol 2014;32:3249–3256. [DOI] [PMC free article] [PubMed] [Google Scholar]
- 19. Reynes‐Llompart G, Gamez‐Cenzano C, Romero‐Zayas I, Rodríguez‐Bel L, Vercher‐Conejero JL, Martí‐Climent JM et al. Performance characteristics of the whole‐body discovery IQ PET/CT system. J Nucl Med 2017;58:1155–1161. [DOI] [PubMed] [Google Scholar]
- 20. Feliciano EMC, Kroenke CH, Meyerhardt JA, Prado CM, Bradshaw PT, Kwan ML, et al. Association of systemic inflammation and sarcopenia with survival in nonmetastatic colorectal cancer: results from the C SCANS study. JAMA Oncol 2017;3:e172319. [DOI] [PMC free article] [PubMed] [Google Scholar]
- 21. Cespedes Feliciano EM, Lee VS, Prado CM, Meyerhardt JA, Alexeeff S, Kroenke CH, et al. Muscle mass at the time of diagnosis of nonmetastatic colon cancer and early discontinuation of chemotherapy, delays, and dose reductions on adjuvant FOLFOX: The C‐SCANS study. Cancer 2017;123:4868–4877. [DOI] [PMC free article] [PubMed] [Google Scholar]
- 22. Prado CM, Lieffers JR, McCargar LJ, Reiman T, Sawyer MB, Martin L, et al. Prevalence and clinical implications of sarcopenic obesity in patients with solid tumours of the respiratory and gastrointestinal tracts: a population‐based study. Lancet Oncol 2008;9:629–635. [DOI] [PubMed] [Google Scholar]
- 23. Mourtzakis M, Prado CM, Lieffers JR, Reiman T, McCargar LJ, Baracos VE, et al. A practical and precise approach to quantification of body composition in cancer patients using computed tomography images acquired during routine care. Appl Physiol Nutr Metab 2008;33:997–1006. [DOI] [PubMed] [Google Scholar]
- 24. Shen W, Punyanitya M, Wang Z, Gallagher D, St‐Onge MP, Albu J, et al. Total body skeletal muscle and adipose tissue volumes: estimation from a single abdominal cross‐sectional image. J Appl Physiol (1985) 2004;97:2333–2338. [DOI] [PubMed] [Google Scholar]
- 25. Martin L, Birdsell L, Macdonald N, Reiman T, Clandinin MT, McCargar LJ, et al. Cancer cachexia in the age of obesity: skeletal muscle depletion is a powerful prognostic factor, independent of body mass index. J Clin Oncol 2013;31:1539–1547. [DOI] [PubMed] [Google Scholar]
- 26. Irving BA, Weltman JY, Brock DW, Davis CK, Gaesser GA, Weltman A, et al. NIH ImageJ and Slice‐O‐Matic computed tomography imaging software to quantify soft tissue. Obesity (Silver Spring) 2007;15:370–376. [DOI] [PubMed] [Google Scholar]
- 27. Terjimanian MN, Harbaugh CM, Hussain A, Olugbade KO Jr, Waits SA, Wang SC, et al. Abdominal adiposity, body composition and survival after liver transplantation. Clin Transplant 2016;30:289–294. [DOI] [PMC free article] [PubMed] [Google Scholar]
- 28. Gray RJ. A class of k‐sample tests for comparing the cumulative incidence of a competing risk. Ann Stat 1988;16:1141–1154. [Google Scholar]
- 29. Grossberg AJ, Chamchod S, Fuller CD, Mohamed AS, Heukelom J, Eichelberger H, et al. Association of body composition with survival and locoregional control of radiotherapy‐treated head and neck squamous cell carcinoma. JAMA Oncol 2016;2:782–789. [DOI] [PMC free article] [PubMed] [Google Scholar]
- 30. Fujiwara N, Nakagawa H, Kudo Y, Tateishi R, Taguri M, Watadani T, et al. Sarcopenia, intramuscular fat deposition, and visceral adiposity independently predict the outcomes of hepatocellular carcinoma. J Hepatol 2015;63:131–140. [DOI] [PubMed] [Google Scholar]
- 31. Caram MV, Bellile EL, Englesbe MJ, Terjimanian M, Wang SC, Griggs JJ, et al. Sarcopenia is associated with autologous transplant‐related outcomes in patients with lymphoma. Leuk Lymphoma 2015;56:2855–2862. [DOI] [PubMed] [Google Scholar]
- 32. DeFilipp Z, Troschel FM, Qualls DA, Li S, Kuklinski MW, Kempner ME, et al. Evolution of body composition following autologous and allogeneic hematopoietic cell transplantation: incidence of sarcopenia and association with clinical outcomes. Biol Blood Marrow Transplant 2018;24:1741–1747. [DOI] [PubMed] [Google Scholar]
- 33. Morkane CM, Kearney O, Bruce D, Melikian CN, Martin DS. An outpatient hospital‐based exercise training programme for patients with cirrhotic liver disease awaiting transplantation: a feasibility trial. Transplantation 2019. [DOI] [PubMed] [Google Scholar]
- 34. McAdams‐DeMarco MA, Ying H, Van Pilsum Rasmussen S, Schrack J, Haugen CE, Chu NM, et al. Prehabilitation prior to kidney transplantation: results from a pilot study. Clin Transplant 2019;33:e13450. [DOI] [PMC free article] [PubMed] [Google Scholar]
- 35. Brustia R, Savier E, Scatton O. Physical exercise in cirrhotic patients: towards prehabilitation on waiting list for liver transplantation. A systematic review and meta‐analysis. Clin Res Hepatol Gastroenterol 2018;42:205–215. [DOI] [PubMed] [Google Scholar]
- 36. Sebio Garcia R, Yanez Brage MI, Gimenez Moolhuyzen E, Salorio Riobo M, Lista Paz A, Borro Mate JM. Functional and postoperative outcomes after preoperative exercise training in patients with lung cancer: a systematic review and meta‐analysis. Interact Cardiovasc Thorac Surg 2016;23:486–497. [DOI] [PubMed] [Google Scholar]
- 37. McCune JS, Bemer MJ, Barrett JS, Scott Baker K, Gamis AS, Holford NH. Busulfan in infant to adult hematopoietic cell transplant recipients: a population pharmacokinetic model for initial and Bayesian dose personalization. Clin Cancer Res 2014;20:754–763. [DOI] [PMC free article] [PubMed] [Google Scholar]
- 38. Baracos VE, Arribas L. Sarcopenic obesity: hidden muscle wasting and its impact for survival and complications of cancer therapy. Ann Oncol 2018;29:ii1–ii9. [DOI] [PubMed] [Google Scholar]
- 39. Casaburi R, Bhasin S, Cosentino L, Porszasz J, Somfay A, Lewis MI, et al. Effects of testosterone and resistance training in men with chronic obstructive pulmonary disease. Am J Respir Crit Care Med 2004;170:870–878. [DOI] [PubMed] [Google Scholar]
- 40. Strollo F, Strollo G, More M, Magni P, Macchi C, Masini MA, et al. Low‐intermediate dose testosterone replacement therapy by different pharmaceutical preparations improves frailty score in elderly hypogonadal hyperglycaemic patients. Aging Male 2013;16:33–37. [DOI] [PubMed] [Google Scholar]
- 41. Vellas B, Fielding R, Bhasin S, Cerreta F, Goodpaster B, Guralnik JM, et al. Sarcopenia trials in specific diseases: report by the International Conference on Frailty and Sarcopenia Research Task Force. J Frailty Aging 2016;5:194–200. [DOI] [PubMed] [Google Scholar]
- 42. Esposito JG, Thomas SG, Kingdon L, Ezzat S. Growth hormone treatment improves peripheral muscle oxygen extraction‐utilization during exercise in patients with human immunodeficiency virus‐associated wasting: a randomized controlled trial. J Clin Endocrinol Metab 2004;89:5124–5131. [DOI] [PubMed] [Google Scholar]
- 43. Moyle GJ, Schoelles K, Fahrbach K, Frame D, James K, Scheye R, et al. Efficacy of selected treatments of HIV wasting: a systematic review and meta‐analysis. J Acquir Immune Defic Syndr 2004;37:S262–S276. [DOI] [PubMed] [Google Scholar]
- 44. Shah GL, Yahalom J, Matasar MJ, Verwys SL, Goldman DA, Bantilan KS, et al. Risk factors predicting outcomes for primary refractory hodgkin lymphoma patients treated with salvage chemotherapy and autologous stem cell transplantation. Br J Haematol 2016;175:440–447. [DOI] [PMC free article] [PubMed] [Google Scholar]
- 45. Reyal Y, Kayani I, Bloor AJC, Fox CP, Chakraverty R, Sjursen AM, et al. Impact of pretransplantation (18)F‐fluorodeoxyglucose‐positron emission tomography on survival outcomes after T cell‐depleted allogeneic transplantation for Hodgkin lymphoma. Biol Blood Marrow Transplant 2016;22:1234–1241. [DOI] [PubMed] [Google Scholar]
- 46. von Haehling S, Morley JE, Coats AJS, Anker SD. Ethical guidelines for publishing in the Journal of Cachexia, Sarcopenia and Muscle: update 2019. J Cachexia Sarcopenia Muscle 2019; 10: 1143‐1145. [DOI] [PMC free article] [PubMed] [Google Scholar]
Associated Data
This section collects any data citations, data availability statements, or supplementary materials included in this article.
Supplementary Materials
Table S1. Patients who underwent a first autologous HCT for lymphoma as adults between 2009 and 2014, including those who were ineligible for the current study.
Table S2. Exploratory analyses using BMI‐derived definition (≥30 Kg/m2) of obesity.
Figure S1 Kaplan‐Meier plots of overall survival in males according to (A) pre‐HCT sarcopenia, and (B) the combination of sarcopenia and abdominal obesity.
Figure S2 Kaplan‐Meier plots of overall survival in females according to (A) pre‐HCT sarcopenia, and (B) the combination of sarcopenia and abdominal obesity.
Figure S3. Cumulative incidence of non‐relapse mortality and relapse‐related mortality according to pre‐HCT sarcopenia status for the overall cohort (A), males (B), females (C)
Table S3. Correlation between imaging parameters and conventional measures such as body weight and body mass index for the overall cohort and by sex
Table S4. Patient characteristics: individuals with and without post‐HCT scans
Table S5. Pairwise t‐test comparison of pre‐ and post‐HCT measures
Table S6. Multivariable regression analysis, predictors of de novo sarcopenia after HCT