

Abstract
Background
Physical activity (PA) is a recognized contributor to healthy aging. However, the majority of studies exploring its associations with adverse outcomes in cohorts of older adults use single‐time PA estimates, which do not consider its dynamic nature. The aim of the present study is to explore the presence of different PA trajectories in the Toledo Study of Healthy Aging and their association with adverse outcomes. Our hypothesis is that prospectively maintaining or increasing PA is associated with a reduced risk of adverse outcomes.
Methods
We used data from 1679 participants enrolled in the Toledo Study of Healthy Aging. Trajectories based on the Physical Activity Scale for the Elderly were identified using group‐based trajectory modelling. Cox and logistic regression were used to investigate associations between PA trajectories and mortality and hospitalization, and incident and worsening disability, respectively. Mortality was ascertained by linkage to the Spanish National Death Index; disability was evaluated through the Katz Index; and hospitalization was defined as the first admission to Toledo Hospital. Models were adjusted by age, sex, smoking, Charlson Index, education, cognitive impairment, polypharmacy, and Katz Index at Wave 2.
Results
We found four PA‐decreasing and one PA‐increasing trajectories: high PA‐consistent (n = 566), moderate PA‐mildly decreasing (n = 392), low PA‐increasing (n = 237), moderate PA‐consistent (n = 191), and low PA‐decreasing (n = 293). Belonging to the high PA‐consistent trajectory group was associated with reduced risks of mortality as compared with the low PA‐decreasing group [hazard ratio (HR) 1.68; 95% confidence interval (CI) = 1.21–2.31] and hospitalization compared with the low PA‐increasing and low PA‐decreasing trajectory groups (HR 1.24; 95% CI = 1.004–1.54 and HR 1.25; 95% CI = 1.01–1.55, respectively) and with lower rates of incident [odds ratio (OR) 3.14; 95% CI = 1.59–6.19] and worsening disability (OR 2.16; 95% CI = 1.35–3.45) in relation to the low PA‐decreasing trajectory group and at follow‐up. Increasing PA during late life (low PA‐increasing group) was associated with lower incident disability rates (OR 0.38; 95% CI = 0.19–0.82) compared with decreasing PA (low PA‐decreasing group), despite similar baseline PA.
Conclusions
Our results suggest that sustaining higher PA levels during aging might lead to healthy aging, characterized by a reduction in adverse outcomes. Our study supports the need for enhancing PA participation among older populations, with the goal of reducing personal and economic burden in a worldwide aging population.
Keywords: Physical activity, Healthy aging, Trajectories, Adverse outcomes, Older adults, Mortality
Introduction
Lifelong physical activity (PA) promotes a wide range of health benefits and has long been recognized as an important protective factor for chronic diseases.1, 2, 3, 4, 5, 6 These beneficial effects consistently translate into lower mortality rates in both men and women.7, 8, 9, 10, 11, 12
The salutary effects of PA might extend to late life, as it is known to delay the onset of disability13, 14 and to increase lifespan.7, 8, 15, 16 Furthermore, PA might be negatively associated with other adverse outcomes such as hospitalization, thereby reducing health care expenditure.17, 18 Remarkably, at advanced ages, PA levels might surpass other cardiovascular or sociodemographic risk factors that are classically associated with adverse outcomes in younger cohorts.19, 20
The World Health Organization defines ‘healthy aging’ as the process of developing and maintaining the functional ability that enables well‐being in older age.21 Accordingly, PA is suggested to be an important contributor to healthy aging through the maintenance and enhancement of intrinsic capacity—mental and especially physical capacities.22 A common methodological limitation in exploring the association between PA and adverse outcomes in older populations is the use of a single time‐point assessment of PA (primarily the baseline PA levels) as the exposure variable,23, 24, 25, 26, 27, 28, 29 which does not account for the dynamic nature of PA behaviours.30 It is plausible that prospective trajectories (patterns) of PA levels along time in late life may influence adverse outcomes distinctly as compared with cross‐sectional estimates,31, 32 a hypothesis that remains untested to our knowledge.
Some studies have recently addressed this shortcoming and used prospective PA level evolution as the exposure variable. Most of these studies employed categorical analyses with clinical or empirical cut‐points for identifying groups with different PA progression patterns.9, 33, 34, 35
Data‐driven approaches such as group‐based trajectory modelling (GBTM) have emerged as an informative and interesting analytical method that allows grouping of subjects presenting with similar baseline values and longitudinal patterns of change, in terms of their direction and magnitude, along follow‐up for a given variable within a population.36, 37 Using this methodology, some studies have shown the existence of different PA level trajectories in older adult cohorts,30, 38 and one study explored their associations with mortality in a sample of older men.39
The main aim of this study is to investigate the existence of different PA trajectories within the Toledo Study of Healthy Aging (TSHA) sample, a Spanish longitudinal population‐based study, and to evaluate their associations with adverse outcomes (mortality, disability onset and worsening, and hospitalization). Our hypothesis is that chronically active subjects and those maintaining PA over time will have a lower likelihood of experiencing adverse outcomes compared with consistently inactive subjects or those reducing PA levels during follow‐up and that increasing PA even at older ages promotes healthy aging, as characterized by reduced mortality, disability onset/worsening, and hospitalization rates.
Methods
Study design and participants
Data were taken from the TSHA study, the details of which have been reported elsewhere.40 Briefly, this is a population‐based prospective cohort study examining the determinants and consequences of frailty in institutionalized and community‐dwelling individuals older than 65 years living in the province of Toledo (Spain). For the present analysis, we used data from those subjects with non‐missing PA scores from the first (2006–2009) and second (2011–2013) TSHA waves and available mortality and hospitalization information at the censoring time and functional ability from the third wave (2015–2017).
The Clinical Research Ethics Committee of Toledo Hospital, Spain, approved the study protocol, and participants signed an informed consent prior to their inclusion in the study.
Measures
Physical Activity Scale for the Elderly
Physical activity levels were estimated using the Physical Activity Scale for the Elderly (PASE). This questionnaire was designed to assess PA in epidemiologic studies of older people over a 1 week period. It ascertains the duration, intensity, and frequency of several activities and consists of 10 items that focus on three domains: leisure (five components), household (four), and work (one) activities. Participation in leisurely activities is recorded by frequency (e.g. never, seldom, sometimes, and often) and duration (e.g. less than an hour, 2–4 h, or >4 h); paid or unpaid work is recorded by total hours of work per week; and household activities and care for others are recorded with yes or no answers. Total PASE score is calculated by multiplying activity participation (yes/no) or the amount of time spent on each activity (hours/week) by empirically derived item weights, which are summed.41 In the present study, PASE was administered by interview, because this modality has proven superior reliability than self‐administration.42 We used PASE scores from Wave 1 and Wave 2 to construct the trajectories.
Mortality
Vital status was ascertained through the information provided by the Spanish National Death Index (Ministry of Health and Social Services). Participants were followed up to death or June 2018, whichever came first. The average follow‐up for mortality was 5.92 years (range 0.01–7.5 years).
Hospitalization
Hospitalization was ascertained by review of the Toledo Hospital Complex records and was defined as the occurrence of a first admission to the hospital during follow‐up, up to December 2016. Median follow‐up for hospitalization was 4.08 years (range 0.01–5.24 years).
Disability and worsening disability
The Katz Index was used to assess the functional ability in basic activities of daily living (BADLs).43 Incident disability was defined as the transition from a score of 6 to 5 or less in the Katz Index at follow‐up. Worsening disability at follow‐up was defined as the advent of a new difficulty in the Katz Index at follow‐up in those participants with a prevalent disability at baseline. Median follow‐up for disability onset/worsening was 2.99 years (range 2–5.4 years).
Covariates
We selected covariates based on the literature and the biological plausibility for confounding the main associations of interest. Age, sex, education (non‐educated, non‐finished primary education, and finished primary education/superior), and smoking status (yes/past/never) were registered during study visits. Presence of co‐morbidities was ascertained by self‐report and by checking the medical history to compute the Charlson Index score.44 Body mass index was computed using the standard formula (body mass × height−2). Cognitive status was assessed by using the Mini‐Mental State Examination (MMSE).45 The number of prescription and non‐prescription drugs within the Anatomical Therapeutic Chemical Classification System taken by the participant was calculated. Polypharmacy was defined as the intake of ≥5 drugs per day.46 All covariates were measured at Wave 2 assessment.
Statistical analysis
Descriptive analysis
All analyses were performed using the R statistical environment for Windows. Mean (standard deviation) and frequency (percentage) are provided for continuous and categorical variables, respectively. Descriptive variables were compared between included and excluded subjects and between trajectories with an independent Student's t‐test or analysis of variance for continuous variables and the χ 2 test for categorical variables.
Trajectory modelling
We used a GBTM approach to identify PA trajectories within our population. This type of finite mixture model provides an empirical means of identifying clusters of individuals defined by their developmental courses for a variable over time (trajectories) within a population. Briefly, this method assumes that the general population is composed of literally distinct subpopulations that are not identifiable based on measured characteristics ex ante. In GBTM, each group is conceptually thought of a collection of individuals who follow approximately the same developmental trajectory, where population variability is captured by differences across groups in the shape and direction of their trajectories.37 First, the best model among those with different number of classes (trajectories) was identified by using Bayesian information criterion (BIC). BIC is an index used in Bayesian statistics to choose between two or more alternative models, given the data. In our study, two times the change in the BIC between models greater than 10 was used as indicative of better fit in order to compare more complex—with a greater number of trajectories—vs. more parsimonious—with a lower number of trajectories—models.47 Each subject was assigned to a trajectory depending upon his individual values (baseline PASE score and progression patterns). Second, average posterior probabilities of membership were computed for each group to estimate the reliability of the classification. Individual posterior probability of membership for a subject represents his probability of belonging to the group he is assigned to by previous grouping based on his individual features. Trajectory average posterior probability of membership represents its internal consistency, with higher values indicating better classification quality.37 We finally checked the number of subjects within each trajectory to ensure adequate sample size for assessing the subsequent risk of adverse outcomes.
Associations between physical activity trajectories and adverse events
Cox proportional hazards regression was used to investigate the associations between the GBTM‐derived PA trajectories and the adverse outcomes for which we had the date of occurrence (mortality and hospitalization). Logistic regression analysis was used for disability onset and disability worsening (that were registered during study visits). Multivariate trajectory models were adjusted for age and sex (Model 1), plus Charlson Index (Model 2), and additionally for baseline Katz Index, level of education, polypharmacy, cognitive status (MMSE), and smoking status (Model 3).
Results
Baseline characteristics of the subjects within each trajectory are presented in Table 1; 1679 subjects (67.48% of TSHA whole sample; mean age = 74.26 ± 5.32; 41% men) had data available for the purpose of this analysis. Not‐included subjects were significantly older and had lower scores for the MMSE, Charlson Index, and Katz Index (Supporting Information, Table S1 ).
Table 1.
Baseline characteristics of the sample
| HPAC n = 566; 33.7% | MPAMD n = 392; 23.3% | LPAI n = 191; 11.7% | MPAC n = 293; 17.5% | LPAD n = 237; 14.1% | Whole sample n = 1679 | Between‐groups differences (P value) | |
|---|---|---|---|---|---|---|---|
| Age, mean (SD) | 72.37 (4.41) | 73.76 (4.83) | 74.94 (5.06) | 72.42 (4.41) | 78.9 (5.56) | 74.94 (5.06) | <0.001 |
| Men, n (%) | 287 (50.71) | 156 (39.79) | 107 (56.02) | 57 (19.45) | 94 (39.66) | 701 (41.74) | <0.001 |
| BMI, mean (SD), kg m−2 | 28.9 (4.1) | 29.3 (4.5) | 30.1 (5.6) | 29.5 (5.1) | 29.9 (5.2) | 29.4 (4.7) | <0.05 |
| Current smoker, n (%) | 181 (31.98) | 109 (27.81) | 77 (40.31) | 45 (15.36) | 60 (25.32) | 472 (28.11) | <0.001 |
| BADL disability, n (%) | 37 (6.54) | 45 (11.48) | 49 (26.06) | 42 (14.33) | 94 (39.66) | 267 (15.9) | <0.001 |
| MMSE score, mean (SD) | 25.47 (3.8) | 24.02 (4.37) | 22.56 (5.91) | 23.5 (3.96) | 20.34 (7.14) | 23.8 (5.07) | <0.001 |
| Charlson Index, mean (SD) | 0.82 (1.33) | 1.02 (1.45) | 1.37 (1.71) | 1.02 (1.56) | 1.45 (1.9) | 1.05 (1.55) | <0.001 |
| Depression (GDS ≥ 5), n (%) | 48 (9.76) | 45 (12.71) | 47 (27.01) | 52 (19.11) | 59 (29.21) | 251 (16.8) | <0.001 |
| PASE score, mean (SD) | 115.61 (49.15) | 80.65 (11.32) | 21.53 (11.88) | 53.27 (3.82) | 28.74 (20.81) | 73.6 (46.85) | <0.001 |
| Δ in PASE, mean (SD) | −3.26 (18.24) | −5.64 (7.22) | 5.92 (6.27) | 0.87 (5.97) | −4.69 (3.74) | −2.25 (12.24) | <0.001 |
Data are presented as mean (SD) or n (%). Significant differences between men and women groups were analysed by Student's t‐test or χ 2 test. BADL, basic activity of daily living; BMI, body mass index; GDS, Geriatric Depression Scale; HPAC, high PA‐consistent; LPAD, low PA‐decreasing; LPAI, low PA‐increasing; MMSE, Mini‐Mental State Examination; MPAC, moderate PA‐consistent; MPAMD, moderate PA‐mildly decreasing; PA, physical activity; PASE, Physical Activity Scale for the Elderly; SD, standard deviation; Δ, change.
Group‐based trajectory modelling yielded five PA trajectories as the best model: (i) high PA‐consistent (n = 566; 33.7%), (ii) moderate PA‐mildly decreasing (n = 392; 23.3%), (iii) low PA‐increasing (n = 237; 14.1%), (iv) moderate PA‐consistent (n = 191; 11.7%), and (v) low PA‐decreasing (n = 293, 17.5%) (Figure 1). The mean posterior probability of membership, an index of quality classification used in GBTM like ours, was 0.79 ± 0.65, indicating an acceptable classification of the subjects within each PA trajectory.
Figure 1.
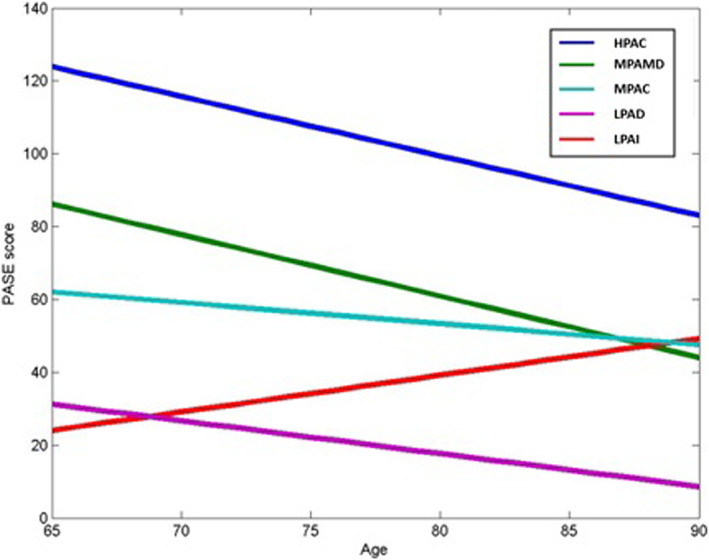
Physical activity (PA) trajectories by age. N = 1679; PA groups based on self‐reported PA via PASE scores. HPAC, high PA‐consistent; LPAD, low PA‐decreasing; LPAI, low PA‐increasing; MPAC, moderate PA‐consistent; MPAMD, moderate PA‐mildly decreasing; PASE, Physical Activity Scale for the Elderly.
In the Cox regression model, subjects in the low PA‐decreasing trajectory group had a higher mortality risk than peers in the reference group (high PA‐consistent) across all models [hazard ratio (HR) 1.68; 95% confidence interval (CI) = 1.21–2.31 in the fully adjusted model (Model 3); Table 2, Figure 2].
Table 2.
Multivariate associations between physical activity trajectories and adverse outcomes
|
HPAC n = 566; 33.7% |
MPAMD n = 392; 23.3% |
LPAI n = 237; 14.1% |
MPAC n = 191; 11.7% |
LPAD n = 293; 17.5% |
|
|---|---|---|---|---|---|
| Mortality (HR; 95% CI) | |||||
| Raw model | Reference | 1.41 (1.04–1.91)* | 2.26 (1.62–3.14)*** | 1.27 (0.9–1.79) | 5.15 (3.92–6.77)*** |
| Model 1 | 1.19 (0.88–1.63) | 1.56 (1.12–2.19)** | 1.15 (0.8–1.64) | 2.53 (1.86–3.44)*** | |
| Model 2 | 1.13 (0.83–1.54) | 1.4 (0.99–1.97) | 1.08 (0.76–1.55) | 2.21 (1.62–3.03)*** | |
| Model 3 | 1.01 (0.74–1.39) | 1.26 (0.89–1.78) | 0.97 (0.68–1.4) | 1.68 (1.21–2.31)** | |
| Hospitalization (HR; 95% CI) | |||||
| Raw model | Reference | 1.1 (0.92–1.32) | 1.68 (1.37–2.05)*** | 1.19 (0.98–1.45) | 2.22 (1.85–2.66)*** |
| Model 1 | 1.04 (0.86–1.25) | 1.43 (1.16–1.77)*** | 1.2 (0.98–1.47) | 1.68 (1.37–2.07)*** | |
| Model 2 | 1.01 (0.84–1.21) | 1.33 (1.08–1.64)** | 1.15 (0.93–1.4) | 1.48 (1.2–1.83)*** | |
| Model 3 | 0.97 (0.8–1.17) | 1.24 (1.004–1.54)* | 1.05 (0.86–1.3) | 1.25 (1.01–1.55)* | |
| Disability (OR; 95% CI) | |||||
| Raw model | Reference | 1.84 (1.27–2.66)** | 1.93 (1.21–3.09)** | 1.66 (1.1–2.51)* | 4.93 (2.62–9.28)*** |
| Model 1 | 1.5 (1.02–2.2)* | 1.5 (0.92–2.46) | 1.23 (0.79–1.91) | 3.39 (1.74–6.59)*** | |
| Model 2 | 1.51 (1.03–2.21)* | 1.41 (0.86–2.32) | 1.24 (0.8–1.94) | 3.31 (1.7–6.48)*** | |
| Model 3 | 1.44 (0.97–2.13) | 1.22 (0.73–2.04) | 1.13 (0.72–1.78) | 3.14 (1.59–6.19)*** | |
| Disability worsening (OR; 95% CI) | |||||
| Raw model | Reference | 1.71 (1.22–2.38)** | 1.99 (1.31–3.02)** | 1.75 (1.21–2.52)** | 3.33 (2.23–4.98)*** |
| Model 1 | 1.46 (1.04–2.06)* | 1.61 (1.05–2.49)* | 1.48 (1.01–2.18)* | 2.05 (1.3–3.18)** | |
| Model 2 | 1.45 (1.03–2.04)* | 1.52 (0.99–2.36) | 1.47 (1.002–2.17)* | 1.86 (1.19–2.91)** | |
| Model 3 | 1.41 (0.99–2.01) | 1.28 (0.81–2.02) | 1.32 (0.89–1.97) | 2.16 (1.35–3.45)** | |
Model 1 (age and gender); Model 2 (age, gender, and Charlson Index); Model 3 (age, gender, Charlson Index, Mini‐Mental State Examination, educational level, smoking status, Katz Index, and polypharmacy). CI, confidence interval; HPAC, high PA‐consistent; HR, hazard ratio; LPAD, low PA‐decreasing; LPAI, low PA‐increasing; MPAC, moderate PA‐consistent; MPAMD, moderate PA‐mildly decreasing; OR, odds ratio; PA, physical activity.
P < 0.05.
P < 0.01.
P < 0.001.
Figure 2.
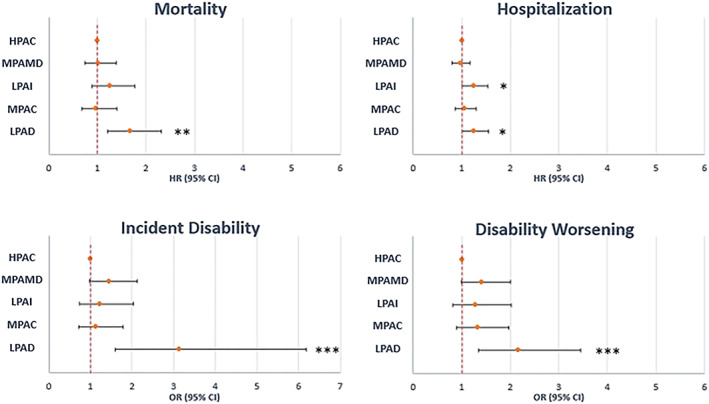
Forest plots of the risk of the different adverse outcomes in the different physical activity trajectory groups. CI, confidence interval; HR, hazard ratio; OR, odds ratio. * P < 0.05; ** P < 0.01; *** P < 0.001. HPAC, high PA‐consistent; LPAD, low PA‐decreasing; LPAI, low PA‐increasing; MPAC, moderate PA‐consistent; MPAMD, moderate PA‐mildly decreasing.
Subjects in the low PA‐increasing [HR 1.24; 95% CI = 1.004–1.54 (Model 3)] and low PA‐decreasing [HR 1.25; 95% CI = 1.01–1.55 (Model 3)] trajectory groups showed a significant increase in the likelihood of hospitalization when compared with subjects in the high PA‐consistent group, across all models (Table 2, Figure 2).
In the ‘raw’ model, logistic regression analysis showed a greater risk of progressing into incident disability across all the trajectories as compared with the reference high PA‐consistent group. These associations weakened as covariates were included in the models but remained significant for the low PA‐decreasing trajectory group [odds ratio (OR) 3.14; 95% CI = 1.59–6.19 (Model 3)].
The low PA‐decreasing trajectory group showed significant increased risk of worsening disability when compared with subjects classified into the high PA‐consistent group (OR 2.16; 95% CI = 1.35–3.45 (Model 3); Table 2, Figure 2).
We additionally sought to compare groups with similar baseline PA (similar starting risk) but divergent PA trends along time (low PA‐increasing vs. low PA‐decreasing trajectory groups). Subjects in the low PA‐decreasing trajectory group were more likely to be women (56% vs. 39%; P = 0.001), to be older (78.9 vs. 74.4 years; P < 0.0001), and to have difficulties in one or more BADLs at baseline (39.7% vs. 25.6%; P = 0.0032).
Taking the low PA‐decreasing as the reference, subjects in the low PA‐increasing trajectory showed a significantly lower risk for disability onset (OR 0.39; 95% CI = 0.19–0.82; Figure 3) in the fully adjusted model. We failed to find differences between these two trajectories in terms of mortality, hospitalization, or worsening disability risks.
Figure 3.
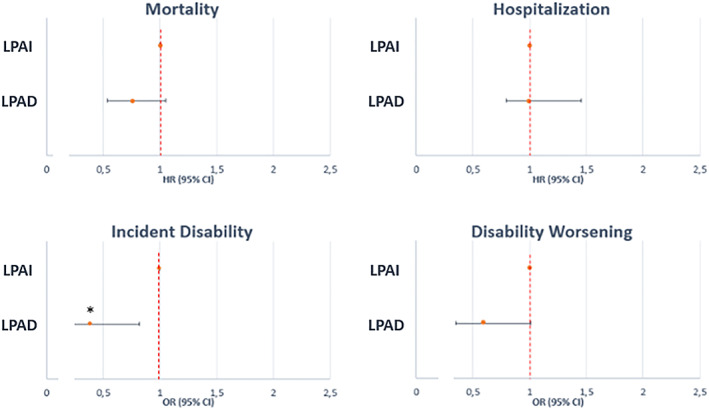
Forest plots of the differences in the risk of adverse outcomes between the low physical activity‐increasing and low physical activity‐decreasing trajectory groups. CI, confidence interval; HR, hazard ratio; OR, odds ratio. * P < 0.05; ** P < 0.01; *** P < 0.001. LPAD, low PA‐decreasing; LPAI, low PA‐increasing.
Sensitivity analyses excluding subjects with posterior probabilities <0.5 (n = 65; 3.87% of the sample) for the group they were classified into did not meaningfully change the associations.30
Discussion
The present study aimed at identifying PA trajectories in the TSHA and exploring their association with adverse outcomes. Overall, our study shows that in this large representative cohort of older adults, prospectively maintaining higher baseline PA levels at older ages is associated with a lower risk of relevant adverse outcomes (mortality, disability onset and worsening, and hospitalization), independently of important confounding factors. Subjects showing higher PA levels at baseline and sustaining them along time (high PA‐consistent trajectory) had lower odds of all adverse outcomes compared with those presenting with low baseline PA levels and an important decline along time (low PA‐decreasing trajectory) and lower risk for hospitalization than those with a low initial PASE score even when PA increased over time (low PA‐increasing trajectory). These findings support the need to promote effective intervention strategies aiming to maintain or increase PA among older adults, as a key factor for healthy aging.
We identified five longitudinal trajectories within our population. Of these, four showed a prospective reduction in PA at old age, which agrees with previous observations of a majority of older adults reducing PA along time.48 Of special note is the presence of one PA‐increasing trajectory (low PA‐increasing), suggesting the existence of qualitatively distinct trajectories in our population of interest, as previously described in other works,49, 50, 51, 52, 53, 54 and extending the findings of classical studies describing heterogeneous patterns of free‐living PA at older ages.55
Regarding the GBTM algorithm classification quality, the identified trajectory groups showed mean posterior probabilities of membership that were close to 0.8. As values of 0.7–0.8 are deemed indicative of an aggrupation that sufficiently discriminates between individuals with dissimilar patterns of change in a behaviour over time,56 we conclude that our classification is reliable.
In relation to the association of prospective PA changes and mortality, our results showing an increased risk for the low PA‐decreasing in relation to high PA‐consistent trajectory groups are consistent with the general notion that increased levels of PA lead to greater longevity in both men and women. These findings were also observed when using cross‐sectional PA estimates,9, 20, 23, 25, 27, 28, 29 prospective categorical changes in PA,9, 33, 57 and more recently, finite mixture modelling approaches for PA trajectories identification as the exposure variable,39 irrespective of the PA‐estimation tool (self‐reported vs. objective measures).58 While it is known that even a low level of participation in PA reduces mortality rates in comparison with inactive behaviour,8, 27, 28 the benefits increase in a dose–response manner at older ages in both men and women, with a saturation effect in the upper limit of both intensity and volume of PA.23 Interestingly, the magnitude of PA effect on mortality might be contingent upon the intensity of the displaced activity, which underscores the importance of this parameter as a determinant of PA effects on health.59
Importantly, the mortality‐sparing benefits of late‐life PA might only be slightly affected by pre‐cohort PA behaviour,60 meaning that at advanced age, even subjects that have never engaged in PA might gain similar benefits to those that used to be active. Additionally, PA seems to attenuate the excess risk of mortality associated with other classical predictors such as frailty,61 cognitive impairment,62 and poor mental, social, and physical health among elders.63
Because PA is a powerful countermeasureagainst the development and progression of chronic conditions, it is assumed toconstitute a means to reduce healthcare system utilization 64. In thiscontext, our results point to an important reduction in the likelihood ofhospitalization among those remaining active along time (High PA‐Consistenttrajectory) versus those showing low PA baseline levels (Low PA‐Increasing andLow PA‐Decreasing trajectories). The little research that is available hasdemonstrated that PA is related to fewer and shorter hospital admissions 65, 66.
With regard to the association between PA and disability onset, our results support previous work reporting an inverse association,14, 67 with greater PA levels (measured heterogeneously) associated with lower likelihood of functional disability captured as mobility,67, 68 clusters of BADL,69, 70 instrumental activities of daily living,69, 70 or both.69, 70, 71 The inverse PA–disability association seems to be graded, because slight increases in terms of volume71 and intensity72 are associated with significantly better functionality.
Yu et al. sought to explore associations between PA trajectories and functionality in a Taiwanese older adult cohort of 3186 subjects (mean age 63.89 ± 8.17 years; 50% women) using a growth mixture model along 11 years follow‐up.73 Notwithstanding the differences in methodology between their study and ours, the results were similar. Importantly, and analogous to our findings, their PA‐increasing trajectory group benefitted from protection against disability to a similar extent as those who remained highly active along follow‐up, despite their low baseline PA levels.73
Regarding the associations between PA levels and disability worsening, the limited evidence points to a negative association between higher activity levels (measured in diverse ways) and the odds of showing lower functionality at follow‐up. In this line, Tak et al. performed a meta‐analysis of four studies that reported associations between PA and BADL disability progression.14 These findings are also compatible with our data. Given the paucity of studies, further research is needed to study the complex relationships between PA and other determinants of disability.
The low PA‐increasing trajectory group showed an increased risk of hospitalization, but not disability, when compared with the high PA‐consistent group. We hypothesize that the strong association between increasing activity and functionality during late life might arise as the result of actual improvements in the physical domain of intrinsic capacity resulting from PA. Tellingly, associations between PA and functionality tend to be stronger in the case of motor activities of daily living,54, 66 whereas the associations with performance on more cognitive demanding tasks might be more modest.69, 74 On the other hand, the absence of significant reductions in hospitalization in the low PA‐increasing trajectory group observed here might suggest a limited potential of late‐life increases in PA to avoid outcomes that lead to hospitalization in elderly populations—mainly cardiovascular events, pulmonary disease exacerbations, and fractures resulting from lifelong development of prevalent conditions in the presence of low PA levels. Accordingly, members of more active trajectories are more likely to have been active during mild life, and thus, their odds of developing these conditions and subsequently being admitted to the hospital might be lower.
Our study has several strengths including the large sample size, excellent ascertainment of adverse outcomes, and the inclusion of relevant variables that could confound the associations. The TSHA is a representative population of community‐dwelling and institutionalized men and women with a wide range of ages and both. Furthermore, we used the novel GBTM, a powerful statistical tool to group subjects into qualitatively distinct developmental progressions that differ not only at baseline but also in the direction and magnitude of the change and that are not readily identifiable using ad hoc, ex ante classification rules. By doing so, we accounted for the factual dynamic nature of PA, overcoming bias of previous research. Although GBTM might remain unfamiliar for most of clinical focused researchers, it presents some compelling features that might be quite useful to study longitudinal data. The characterization of groups of subjects following different evolutions for a variable has commonly relied on subjective categorization based on clinical or empirical thresholds (cut‐points derived in other cohorts, tertiles, etc.). Although reasonable, these assignment rules present with some pitfalls. First, the existence of different groups is assumed a priori, and this point cannot be tested objectively. Second, they do not allow for assessing the precision of individual classifications to the various groups, and hence, uncertainty about individual group membership might emerge. In our case, an important strength of GBTM is that it allows for a data‐based in‐depth study of the features of potential healthy aging phenotypes (PA‐maintainers/increasers), which in turn could help clinicians to identify strategies for maintaining PA engagement among the elderly. To estimate PA levels, we used a well‐validated tool specific for older adults, whose advantages include its brevity, easy scoring process, the inclusion of activities other than exercise, and the inclusion of activities common to older ensuring a comprehensive assessment of overall PA. While objective PA measures are more reliable and overcome PA questionnaires' limitations, they might be impractical in large cohorts, as in ours. This work is one of the first to our knowledge trying to explore the presence of different PA trajectories within a cohort of older adults and their associations with important adverse outcomes in an older adult cohort.
Our study, nevertheless, has important limitations. First, self‐reported PA tools are poorly correlated with objectively measured PA, and their use is subject to the inclusion of recall errors and social desirability leading to bias, especially among older adults. Additionally, over‐reporting of PA levels, if present, would lead to an underestimation of the actual effect of PA on adverse outcomes.7, 32 Second, PASE cannot be translated into actual PA levels or the metabolic equivalent of task or time performing exercise. Thus, it fails at directly accounting for important modulators of the effect of PA on health, mainly intensity and volume. This makes our results challenging to interpret in relationship with other studies or PA recommendations. Third, hospitalization was only ascertained by checking Toledo Hospital Complex records. Although this centre is the reference hospital for the Toledo's province, where the whole sample dwelled at baseline, it is possible that some subjects have travelled or moved during follow‐up and some events could have gone unreported.
Although GBTM is increasingly been used for identifying trajectories for both exposures and outcomes in observational and experimental research, it is inherently limited in capturing individual variability and may lead to over‐grouping.36 Furthermore, we could only construct linear trajectories because we could only evaluate two time‐points prior to follow‐up.
Reverse causality cannot be excluded in our study, due to its observational nature. PA participation might be conditioned by health status and vice versa. Nevertheless, the associations remained significant after adjustment for important risk factors, co‐morbidities, and functional status.
We acknowledge the potential absence of unrecognized or uncontrolled covariates that could affect our observations. Of note is the absence of a measure of sedentary behaviour as a competing exposure. Sedentary behaviour has recently been postulated as a key health factor, independent of PA patterns, and is associated with mortality,75, 76 disability,69, 77 and increased health care expenditure.78 Furthermore, as we did not have information about PA before the study entry time, we are not able to assess whether the benefit from PA observed in this study could respond to a lifelong acquired benefit rather than to a recently gained PA beneficial effect. Direct comparison of our study with others is not possible due to the unique distribution of trajectories that GBTM yields within individual populations. Finally, our sample is restricted to a specific area of Spain with unique features. Although this fact may limit the generalizability of our results, it offers the advantage of reduced potential confounding by race, education, social economic class, and access to health care.
Our study contributes to expand the notion of PA as a powerful modifiable factor that promotes healthy aging by means of preventing important adverse outcomes including mortality, disability, and hospitalization. It does so from a new perspective, by using a novel approach that allows to empirically identify different PA‐related aging phenotypes, that as our results suggest, are associated with relevant outcomes for older people. The prevention of BADL disability is especially relevant, because it is associated with receiving home care services and an increased risk of long‐term nursing home admission and health care costs.14 In the context of a global aging population, our findings have important clinical and economic implications. Given that the association between PA and healthy aging seems to be valid and physiologically plausible, especially if the PA is in the form of structured exercise, the goal should be to enhance exercise participation among older people living in the community. Unfortunately, PA levels fall dramatically in the last years of life.20 If, as the evidence indicates, any activity above sedentarism in terms of volume8, 27, 28, 29, 35 and intensity,23, 32, 59 and longitudinally maintaining PA levels, are associated with better health outcomes in older adults,27, 29, 79 clinicians, relatives, and caregivers should encourage them to be as active as possible, both during planned exercise sessions and in everyday life activities. Policymakers, for their part, should increase social awareness and promote accessible, popular, and everyday activities such as walking and active commuting among older populations. Hopefully, efforts are being made to increase late‐life PA participation.80
In summary, we confirmed our hypotheses in our older adult cohort that consistent high PA levels provide protection against important adverse outcomes when compared with low PA baseline levels and decreasing PA. Importantly, increasing PA levels during late life might entail a lower risk of disability in comparison with prospectively reducing activity.
Conflict of interest
The authors declare that they have no conflict of interest.
Ethical issues
The study protocol was approved by the Clinical Research Ethics Committee of the Toledo Hospital, Spain. This work was performed according to the ethical standards laid down in the 1964 Declaration of Helsinki and later amendments. Participants signed informed consent forms prior to their inclusion in the cohort. The authors certify that they comply with the ethical guidelines for authorship and publishing of the Journal of Cachexia, Sarcopenia and Muscle.81
Supporting information
Table S1. Baseline characteristics of included vs. not‐included subjects
Acknowledgements
The present work was funded by grants from the Spanish Ministry of Economy, Industry and Competitiveness, co‐financed by the European Regional Development Funds (RD120001/0043) and the Centro de Investigación Biomédica en Red en Fragilidad y Envejecimiento Saludable (CB16/10/00464).
Sanchez‐Sanchez J. L., Izquierdo M., Carnicero‐Carreño J. A., García‐García F. J., and Rodríguez‐Mañas L. (2020) Physical activity trajectories, mortality, hospitalization, and disability in the Toledo Study of Healthy Aging, Journal of Cachexia, Sarcopenia and Muscle, 11, 1007–1017. 10.1002/jcsm.12566.
References
- 1. Moore SC, Lee I‐M, Weiderpass E, Campbell PT, Sampson JN, Kitahara CM, et al. Association of leisure‐time physical activity with risk of 26 types of cancer in 1.44 million adults. JAMA Intern Med 2016;176:816–825. [DOI] [PMC free article] [PubMed] [Google Scholar]
- 2. Pareja‐Galeano H, Garatachea N, Lucia A. Exercise as a polypill for chronic diseases. Prog Mol Biol Transl Sci 2015;135:497–526. [DOI] [PubMed] [Google Scholar]
- 3. Fiuza‐Luces C, Santos‐Lozano A, Joyner M, Carrera‐Bastos P, Picazo O, Zugaza JL, et al. Exercise benefits in cardiovascular disease: beyond attenuation of traditional risk factors. Nat Rev Cardiol 2018;15:731–743. [DOI] [PubMed] [Google Scholar]
- 4. Aune D, Norat T, Leitzmann M, Tonstad S, Vatten LJ. Physical activity and the risk of type 2 diabetes: a systematic review and dose‐response meta‐analysis. Eur J Epidemiol julio de 2015;30:529–542. [DOI] [PubMed] [Google Scholar]
- 5. Guure CB, Ibrahim NA, Adam MB, Said SM. Impact of physical activity on cognitive decline, dementia, and its subtypes: meta‐analysis of prospective studies. Biomed Res Int 2017;2017:9016924. [DOI] [PMC free article] [PubMed] [Google Scholar]
- 6. Löllgen H, Löllgen D. Risk reduction in cardiovascular diseases by physical activity. Internist 2012;53:20–29. [DOI] [PubMed] [Google Scholar]
- 7. Nocon M, Hiemann T, Müller‐Riemenschneider F, Thalau F, Roll S, Willich SN. Association of physical activity with all‐cause and cardiovascular mortality: a systematic review and meta‐analysis. Eur J Cardiovasc Prev Rehabil Off J Eur Soc Cardiol Work Groups Epidemiol Prev Card Rehabil Exerc Physiol junio de 2008;15:239–246. [DOI] [PubMed] [Google Scholar]
- 8. Löllgen H, Böckenhoff A, Knapp G. Physical activity and all‐cause mortality: an updated meta‐analysis with different intensity categories. Int J Sports Med marzo de 2009;30:213–224. [DOI] [PubMed] [Google Scholar]
- 9. Wannamethee SG, Shaper AG, Walker M. Changes in physical activity, mortality, and incidence of coronary heart disease in older men. Lancet Lond Engl 1998;351:1603–1608. [DOI] [PubMed] [Google Scholar]
- 10. Paffenbarger RS, Hyde RT, Wing AL, Hsieh CC. Physical activity, all‐cause mortality, and longevity of college alumni. N Engl J Med 1986;314:605–613. [DOI] [PubMed] [Google Scholar]
- 11. Woodcock J, Franco OH, Orsini N, Roberts I. Non‐vigorous physical activity and all‐cause mortality: systematic review and meta‐analysis of cohort studies. Int J Epidemiol febrero de 2011;40:121–138. [DOI] [PubMed] [Google Scholar]
- 12. Ekelund U, Tarp J, Steene‐Johannessen J, Hansen BH, Jefferis B, Fagerland MW, et al. Dose‐response associations between accelerometry measured physical activity and sedentary time and all cause mortality: systematic review and harmonised meta‐analysis. BMJ 2019;366:l4570. [DOI] [PMC free article] [PubMed] [Google Scholar]
- 13. Paterson DH, Warburton DE. Physical activity and functional limitations in older adults: a systematic review related to Canada's Physical Activity Guidelines. Int J Behav Nutr Phys Act 2010;7: 38. [DOI] [PMC free article] [PubMed] [Google Scholar]
- 14. Tak E, Kuiper R, Chorus A, Hopman‐Rock M. Prevention of onset and progression of basic ADL disability by physical activity in community dwelling older adults: a meta‐analysis. Ageing Res Rev enero de 2013;12:329–338. [DOI] [PubMed] [Google Scholar]
- 15. Hupin D, Roche F, Gremeaux V, Chatard J‐C, Oriol M, Gaspoz J‐M, et al. Even a low‐dose of moderate‐to‐vigorous physical activity reduces mortality by 22% in adults aged ≥60 years: a systematic review and meta‐analysis. Br J Sports Med octubre de 2015;49:1262–1267. [DOI] [PubMed] [Google Scholar]
- 16. Garatachea N, Santos‐Lozano A, Hughes DC, Gómez‐Cabello A, Ara I. Physical exercise as an effective antiaging intervention. BioMed Res Int [Internet] 2017. Disponible en;https://www.ncbi.nlm.nih.gov/pmc/articles/PMC5457745/. [DOI] [PMC free article] [PubMed] [Google Scholar]
- 17. Peeters GMEEG, Gardiner PA, Dobson AJ, Brown WJ. Associations between physical activity, medical costs and hospitalisations in older Australian women: results from the Australian Longitudinal Study on Women's Health. J Sci Med Sport junio de 2018;21:604–608. [DOI] [PubMed] [Google Scholar]
- 18. Jacobs JM, Rottenberg Y, Cohen A, Stessman J. Physical activity and health service utilization among older people. J Am Med Dir Assoc febrero de 2013;14:125–129. [DOI] [PubMed] [Google Scholar]
- 19. Aijö M, Parkatti T. Independent and combined association of physical activity and cardiac disease on mortality risk in the very old. J Aging Health febrero de 2011;23:70–85. [DOI] [PubMed] [Google Scholar]
- 20. Muscari A, Bianchi G, Forti P, Giovagnoli M, Magalotti D, Pandolfi P, et al. Physical activity and other determinants of survival in the oldest adults. J Am Geriatr Soc febrero de 2017;65:402–406. [DOI] [PubMed] [Google Scholar]
- 21. WHO|World report on ageing and health [Internet] . 2019. Disponible en: https://www.who.int/ageing/publications/world‐report‐2015/en/
- 22. Izquierdo M, Rodriguez‐Mañas L, Casas‐Herrero A, Martinez‐Velilla N, Cadore EL, Sinclair AJ. Is it ethical not to precribe physical activity for the elderly frail? J Am Med Dir Assoc 2016;17:779–781. [DOI] [PubMed] [Google Scholar]
- 23. Arem H, Moore SC, Patel A, Hartge P, Berrington de Gonzalez A, Visvanathan K, et al. Leisure time physical activity and mortality: a detailed pooled analysis of the dose‐response relationship. JAMA Intern Med junio de 2015;175:959–967. [DOI] [PMC free article] [PubMed] [Google Scholar]
- 24. Gebel K, Ding D, Chey T, Stamatakis E, Brown WJ, Bauman AE. Effect of moderate to vigorous physical activity on all‐cause mortality in middle‐aged and older Australians. JAMA Intern Med junio de 2015;175:970–977. [DOI] [PubMed] [Google Scholar]
- 25. Hirsch CH, Diehr P, Newman AB, Gerrior SA, Pratt C, Lebowitz MD, et al. Physical activity and years of healthy life in older adults: results from the Cardiovascular Health Study. J Aging Phys Act julio de 2010;18:313–334. [DOI] [PMC free article] [PubMed] [Google Scholar]
- 26. Moore SC, Patel AV, Matthews CE, Berrington de Gonzalez A, Park Y, Katki HA, et al. Leisure time physical activity of moderate to vigorous intensity and mortality: a large pooled cohort analysis. PLoS Med 2012;9:e1001335. [DOI] [PMC free article] [PubMed] [Google Scholar]
- 27. Paganini‐Hill A, Kawas CH, Corrada MM. Activities and mortality in the elderly: the leisure world cohort study. J Gerontol A Biol Sci Med Sci mayo de 2011;66:559–567. [DOI] [PMC free article] [PubMed] [Google Scholar]
- 28. Ottenbacher AJ, Snih SA, Karmarkar A, Lee J, Samper‐Ternent R, Kumar A, et al. Routine physical activity and mortality in Mexican Americans aged 75 and older. J Am Geriatr Soc junio de 2012;60:1085–1091. [DOI] [PMC free article] [PubMed] [Google Scholar]
- 29. Brown WJ, McLaughlin D, Leung J, McCaul KA, Flicker L, Almeida OP, et al. Physical activity and all‐cause mortality in older women and men. Br J Sports Med julio de 2012;46:664–668. [DOI] [PubMed] [Google Scholar]
- 30. Barnett TA, Gauvin L, Craig CL, Katzmarzyk PT. Distinct trajectories of leisure time physical activity and predictors of trajectory class membership: a 22 year cohort study. Int J Behav Nutr Phys Act 2008;5:57. [DOI] [PMC free article] [PubMed] [Google Scholar]
- 31. Shortreed SM, Peeters A, Forbes AB. Estimating the effect of long‐term physical activity on cardiovascular disease and mortality: evidence from the Framingham Heart Study. Heart Br Card Soc mayo de 2013;99:649–654. [DOI] [PubMed] [Google Scholar]
- 32. Hamer M, de Oliveira C, Demakakos P. Non‐exercise physical activity and survival: English longitudinal study of ageing. Am J Prev Med octubre de 2014;47:452–460. [DOI] [PubMed] [Google Scholar]
- 33. Stessman J, Hammerman‐Rozenberg R, Cohen A, Ein‐Mor E, Jacobs JM. Physical activity, function, and longevity among the very old. Arch Intern Med 2009;169:1476–1483. [DOI] [PubMed] [Google Scholar]
- 34. Almeida OP, Khan KM, Hankey GJ, Yeap BB, Golledge J, Flicker L. 150 minutes of vigorous physical activity per week predicts survival and successful ageing: a population‐based 11‐year longitudinal study of 12 201 older Australian men. Br J Sports Med febrero de 2014;48:220–225. [DOI] [PubMed] [Google Scholar]
- 35. Gregg EW, Cauley JA, Stone K, Thompson TJ, Bauer DC, Cummings SR, et al. Relationship of changes in physical activity and mortality among older women. JAMA 2003;289:2379–2386. [DOI] [PubMed] [Google Scholar]
- 36. Nagin DS. Group‐based trajectory modeling: an overview. Ann Nutr Metab 2014;65:205–210. [DOI] [PubMed] [Google Scholar]
- 37. Nagin DS, Odgers CL. Group‐based trajectory modeling in clinical research. Annu Rev Clin Psychol 2010;6:109–138. [DOI] [PubMed] [Google Scholar]
- 38. Laddu DR, Cawthon PM, Parimi N, Hoffman AR, Orwoll E, Miljkovic I, et al. Trajectories of the relationships of physical activity with body composition changes in older men: the MrOS study. BMC Geriatr 2017;17:–119. [DOI] [PMC free article] [PubMed] [Google Scholar]
- 39. Laddu D, Parimi N, Cauley JA, Cawthon PM, Ensrud KE, Orwoll E, et al. The association between trajectories of physical activity and all‐cause and cause‐specific mortality. J Gerontol A Biol Sci Med Sci 2018. [DOI] [PMC free article] [PubMed] [Google Scholar]
- 40. Garcia‐Garcia FJ, Gutierrez Avila G, Alfaro‐Acha A, Amor Andres MS, De Los Angeles DLT, Lanza M, et al. The prevalence of frailty syndrome in an older population from Spain. The Toledo Study for Healthy Aging. J Nutr Health Aging diciembre de 2011;15:852–856. [DOI] [PubMed] [Google Scholar]
- 41. Washburn RA, Smith KW, Jette AM, Janney CA. The Physical Activity Scale for the Elderly (PASE): development and evaluation. J Clin Epidemiol febrero de 1993;46:153–162. [DOI] [PubMed] [Google Scholar]
- 42. Washburn RA, Ficker JL. Physical Activity Scale for the Elderly (PASE): the relationship with activity measured by a portable accelerometer. J Sports Med Phys Fitness diciembre de 1999;39:336–340. [PubMed] [Google Scholar]
- 43. Katz S, Downs TD, Cash HR, Grotz RC. Progress in development of the index of ADL. Gerontologist 1970;10:20–30. [DOI] [PubMed] [Google Scholar]
- 44. Charlson ME, Pompei P, Ales KL, MacKenzie CR. A new method of classifying prognostic comorbidity in longitudinal studies: development and validation. J Chronic Dis 1987;40:373–383. [DOI] [PubMed] [Google Scholar]
- 45. Folstein MF, Folstein SE, McHugh PR. “Mini‐mental state”: a practical method for grading the cognitive state of patients for the clinician. J Psychiatr Res noviembre de 1975;12:189–198. [DOI] [PubMed] [Google Scholar]
- 46. Gnjidic D, Hilmer SN, Blyth FM, Naganathan V, Waite L, Seibel MJ, et al. Polypharmacy cutoff and outcomes: five or more medicines were used to identify community‐dwelling older men at risk of different adverse outcomes. J Clin Epidemiol septiembre de 2012;65:989–995. [DOI] [PubMed] [Google Scholar]
- 47. Jones Bobby L., Nagin Daniel S., Roeder Kathryn, 2001. [Internet]. [citado 22 de enero de 2019]. A SAS procedure based on mixture models for estimating developmental trajectories Disponible en: https://journals.sagepub.com/doi/ 10.1177/0049124101029003005 [DOI]
- 48. Lounassalo I, Salin K, Kankaanpää A, Hirvensalo M, Palomäki S, Tolvanen A, et al. Distinct trajectories of physical activity and related factors during the life course in the general population: a systematic review. BMC Public Health 2019;19, 1:271. [DOI] [PMC free article] [PubMed] [Google Scholar]
- 49. Artaud F, Sabia S, Dugravot A, Kivimaki M, Singh‐Manoux A, Elbaz A. Trajectories of unhealthy behaviors in midlife and risk of disability at older ages in the Whitehall II Cohort Study. J Gerontol A Biol Sci Med Sci 2016;71:1500–1506. [DOI] [PMC free article] [PubMed] [Google Scholar]
- 50. Aggio D, Papachristou E, Papacosta O, Lennon LT, Ash S, Whincup PH, et al. Trajectories of self‐reported physical activity and predictors during the transition to old age: a 20‐year cohort study of British men. Int J Behav Nutr Phys Act 2018;15:14. [DOI] [PMC free article] [PubMed] [Google Scholar]
- 51. Pan L‐Y, Hsu H‐C, Chang W‐C, Luh D‐L. Trajectories of physical activity and risk factors among Taiwanese older adults. Int J Behav Med febrero de 2015;22:62–69. [DOI] [PubMed] [Google Scholar]
- 52. Xue Q‐L, Bandeen‐Roche K, Mielenz TJ, Seplaki CL, Szanton SL, Thorpe RJ, et al. Patterns of 12‐year change in physical activity levels in community‐dwelling older women: can modest levels of physical activity help older women live longer? Am J Epidemiol 2012;176:534–543. [DOI] [PMC free article] [PubMed] [Google Scholar]
- 53. Hsu H‐C, Luh D‐L, Chang W‐C, Pan L‐Y. Joint trajectories of multiple health‐related behaviors among the elderly. Int J Public Health febrero de 2013;58:109–120. [DOI] [PubMed] [Google Scholar]
- 54. Pettee Gabriel K, Sternfeld B, Colvin A, Stewart A, Strotmeyer ES, Cauley JA, et al. Physical activity trajectories during midlife and subsequent risk of physical functioning decline in late mid‐life: the Study of Women's Health Across the Nation (SWAN). Prev Med diciembre de 2017;105:287–294. [DOI] [PMC free article] [PubMed] [Google Scholar]
- 55. Jackson EL, Dunn E. Integrating ceasing participation with other aspects of leisure behavior. J Leis Res 1988;20:31–45. [Google Scholar]
- 56. Andruff H, Carraro N, Thompson A, Gaudreau P, Louvet B. Latent class growth modelling: a tutorial. Tutor Quant Methods Psychol 2009;5:11–24. [Google Scholar]
- 57. Gopinath B, Kifley A, Flood VM, Mitchell P. Physical activity as a determinant of successful aging over ten years. Sci Rep 2018;8:10522. [DOI] [PMC free article] [PubMed] [Google Scholar]
- 58. Jefferis BJ, Parsons TJ, Sartini C, Ash S, Lennon LT, Papacosta O, et al. Objectively measured physical activity, sedentary behaviour and all‐cause mortality in older men: does volume of activity matter more than pattern of accumulation? Br J Sports Med 2018. [DOI] [PMC free article] [PubMed] [Google Scholar]
- 59. Stamatakis E, Rogers K, Ding D, Berrigan D, Chau J, Hamer M, et al. All‐cause mortality effects of replacing sedentary time with physical activity and sleeping using an isotemporal substitution model: a prospective study of 201,129 mid‐aged and older adults. Int J Behav Nutr Phys Act [Internet] 2015. [citado 1 de octubre de 2018];12. Disponible en;https://www.ncbi.nlm.nih.gov/pmc/articles/PMC4589071/. [DOI] [PMC free article] [PubMed] [Google Scholar]
- 60. Bembom O, van der Laan M, Haight T, Tager I. Leisure‐time physical activity and all‐cause mortality in an elderly cohort. Epidemiol Camb Mass mayo de 2009;20:424–430. [DOI] [PMC free article] [PubMed] [Google Scholar]
- 61. Higueras‐Fresnillo S, Cabanas‐Sánchez V, Lopez‐Garcia E, Esteban‐Cornejo I, Banegas JR, Sadarangani KP, et al. Physical activity and association between frailty and all‐cause and cardiovascular mortality in older adults: population‐based prospective cohort study. J Am Geriatr Soc noviembre de 2018;66:2097–2103. [DOI] [PubMed] [Google Scholar]
- 62. Esteban‐Cornejo I, Cabanas‐Sánchez V, Higueras‐Fresnillo S, Ortega FB, Kramer AF, Rodriguez‐Artalejo F, et al. Cognitive frailty and mortality in a national cohort of older adults: the role of physical activity. Mayo Clin Proc 2019. [DOI] [PubMed] [Google Scholar]
- 63. Martinez‐Gomez D, Guallar‐Castillon P, Higueras‐Fresnillo S, Garcia‐Esquinas E, Lopez‐Garcia E, Bandinelli S, et al. Physical activity attenuates total and cardiovascular mortality associated with physical disability: a national cohort of older adults. J Gerontol A Biol Sci Med Sci 2018;73:2 240–7. [DOI] [PubMed] [Google Scholar]
- 64. Simmonds B, Fox K, Davis M, Ku P‐W, Gray S, Hillsdon M, et al. Objectively assessed physical activity and subsequent health service use of UK adults aged 70 and over: a four to five year follow up study. PloS One 2014;9:e97676. [DOI] [PMC free article] [PubMed] [Google Scholar]
- 65. Li C‐L, Chu S‐J, Sheu J‐T, Huang LY‐G. Impact of physical activity on hospitalization in older adults: a nationwide cohort from Taiwan. Arch Gerontol Geriatr octubre de 2011;53:141–145. [DOI] [PubMed] [Google Scholar]
- 66. Sari N. Sports, exercise, and length of stay in hospitals: is there a differential effect for the chronically ill people? Contemp Econ Policy 2014;32:247–260. [Google Scholar]
- 67. Liao W‐C, Li C‐R, Lin Y‐C, Wang C‐C, Chen Y‐J, Yen C‐H, et al. Healthy behaviors and onset of functional disability in older adults: results of a national longitudinal study. J Am Geriatr Soc. febrero de 2011;59:200–206. [DOI] [PubMed] [Google Scholar]
- 68. DiPietro L, Jin Y, Talegawkar S, Matthews CE. The joint associations of sedentary time and physical activity with mobility disability in older people: the NIH‐AARP diet and health study. J Gerontol A Biol Sci Med Sci 2018;73:532–538. [DOI] [PMC free article] [PubMed] [Google Scholar]
- 69. Cawthon PM, Blackwell TL, Cauley JA, Ensrud KE, Dam T‐T, Harrison SL, et al. Objective assessment of activity, energy expenditure, and functional limitations in older men: the Osteoporotic Fractures in Men study. J Gerontol A Biol Sci Med Sci diciembre de 2013;68:1518–1524. [DOI] [PMC free article] [PubMed] [Google Scholar]
- 70. Young DR, Masaki KH, Curb JD. Associations of physical activity with performance‐based and self‐reported physical functioning in older men: the Honolulu Heart Program. J Am Geriatr Soc agosto de 1995;43:845–854. [DOI] [PubMed] [Google Scholar]
- 71. Ćwirlej‐Sozańska A, Sozański B, Wiśniowska‐Szurlej A, Wilmowska‐Pietruszyńska A, Kujawa J. Assessment of disability and factors determining disability among inhabitants of South‐Eastern Poland aged 71‐80 years. Biomed Res Int 2018;2018:3872753. [DOI] [PMC free article] [PubMed] [Google Scholar]
- 72. Dunlop DD, Song J, Semanik PA, Sharma L, Bathon JM, Eaton CB, et al. Relation of physical activity time to incident disability in community dwelling adults with or at risk of knee arthritis: prospective cohort study. BMJ 2014;348:g2472. [DOI] [PMC free article] [PubMed] [Google Scholar]
- 73. Yu H‐W, Chiang T‐L, Chen D‐R, Tu Y‐K, Chen Y‐M. Trajectories of leisure activity and disability in older adults over 11 years in Taiwan. J Appl Gerontol Off J South Gerontol Soc junio de 2018;37:706–727. [DOI] [PubMed] [Google Scholar]
- 74. Manini TM, Beavers DP, Pahor M, Guralnik JM, Spring B, Church TS, et al. Effect of physical activity on self‐reported disability in older adults: results from the LIFE study. J Am Geriatr Soc mayo de 2017;65:980–988. [DOI] [PMC free article] [PubMed] [Google Scholar]
- 75. Koster A, Caserotti P, Patel KV, Matthews CE, Berrigan D, Van Domelen DR, et al. Association of sedentary time with mortality independent of moderate to vigorous physical activity. PloS One. 2012;7:e37696. [DOI] [PMC free article] [PubMed] [Google Scholar]
- 76. Loyen A, Clarke‐Cornwell AM, Anderssen SA, Hagströmer M, Sardinha LB, Sundquist K, et al. Sedentary time and physical activity surveillance through accelerometer pooling in four European countries. Sports Med Auckl NZ 2016. [DOI] [PMC free article] [PubMed] [Google Scholar]
- 77. Dunlop DD, Song J, Arnston EK, Semanik PA, Lee J, Chang RW, et al. Sedentary time in US older adults associated with disability in activities of daily living independent of physical activity. J Phys Act Health enero de 2015;12:93–101. [DOI] [PMC free article] [PubMed] [Google Scholar]
- 78. Biswas A, Oh PI, Faulkner GE, Bajaj RR, Silver MA, Mitchell MS, et al. Sedentary time and its association with risk for disease incidence, mortality, and hospitalization in adults: a systematic review and meta‐analysis. Ann Intern Med 2015;162:123–132. [DOI] [PubMed] [Google Scholar]
- 79. Moore DS, Ellis R, Allen PD, Cherry KE, Monroe PA, O'Neil CE, et al. Construct validation of physical activity surveys in culturally diverse older adults: a comparison of four commonly used questionnaires. Res Q Exerc Sport marzo de 2008;79:42–50. [DOI] [PubMed] [Google Scholar]
- 80. Izquierdo M, Rodriguez‐Mañas L, Sinclair AJ. What is new in exercise regimes for frail older people—how does the Erasmus Vivifrail Project take us forward? J Nutr Health Aging 2016;20:736–737. [DOI] [PubMed] [Google Scholar]
- 81. von Haehling S, Morley JE, Coats AJS, Anker SD. Ethical guidelines for publishing in the Journal of Cachexia, Sarcopenia and Muscle: update 2019.J Cachexia Sarcopenia Muscle 2019; 10: 1143‐1145. [DOI] [PMC free article] [PubMed] [Google Scholar]
Associated Data
This section collects any data citations, data availability statements, or supplementary materials included in this article.
Supplementary Materials
Table S1. Baseline characteristics of included vs. not‐included subjects