

SUMMARY
DNA in cells is predominantly B-form double helix. Though certain DNA sequences in vitro may fold into other structures, such as triplex, left-handed Z-form, or quadruplex DNA, the stability and prevalence of these structures in vivo are not known. Here, using computational analysis of sequence motifs, RNA polymerase II binding data, and genome-wide potassium-permanganate-dependent nuclease footprinting data, we map thousands of putative non-B DNA sites at high resolution in mouse B cells. Computational analysis associates these non-B DNAs with particular structures and indicates that they form at locations compatible with an involvement in gene regulation. Further analyses support the notion that non-B DNA structure formation influences the occupancy and positioning of nucleosomes in chromatin. These results suggest that non-B DNAs contribute to the control of a variety of critical cellular and organismal processes.
Graphical Abstract
eTOC blurb:
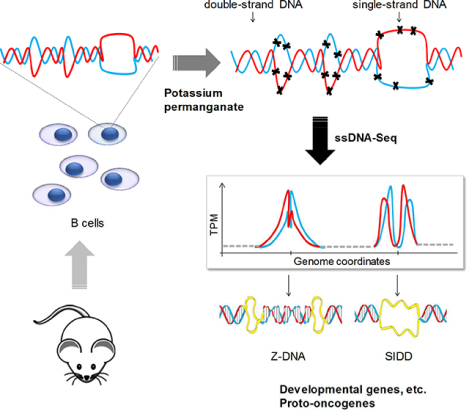
Potassium permanganate footprinting combined with high-throughput sequencing revealed abundant formation of “melted bubbles”, Z-DNA, quadruplex and other non-B DNA structures in mouse and human cells. Non-B DNA formation is dramatically coupled with chromatin re-organization and particular transcription programs, indicating high regulatory potential of non-B DNA structures across a mammalian genome.
INTRODUCTION
The sequence of bases in DNA is generally in canonical right-handed B-form double helix, but not always. Pursuant to the elucidation of B-DNA structure, a variety of other structures with different strand arrangement and stoichiometry were identified in vitro in synthetic polymers or repetitive sequences using biophysical and biochemical methods. Later more sensitive and refined assays demonstrated the focal formation of non-B DNA structures in plasmids and oligonucleotides (Sinden, 1994) including melted bubbles, left-handed double helical Z-DNA, extruded cruciforms, triple helical H-DNA and G-quadruplexes (G4) (Bacolla and Wells, 2004; Murat and Balasubramanian, 2014; Zhabinskaya and Benham, 2013) (Figure 1). To form and perdure against B-DNA, these structures all require special, often non-biological in vitro conditions (pH, modified bases, ions, etc.) (Kouzine and Levens, 2007). Nevertheless, because transcription, replication, recombination and DNA repair, in vivo and in vitro, demand at least transient, focal unwinding of double-stranded DNA (dsDNA) (Chen et al., 2016; He et al., 2016), they all have the potential to provoke DNA structural isomerization.
Figure 1. Non-B DNA structures and Sequence Motifs with propensity to adopt non-B DNA conformation.
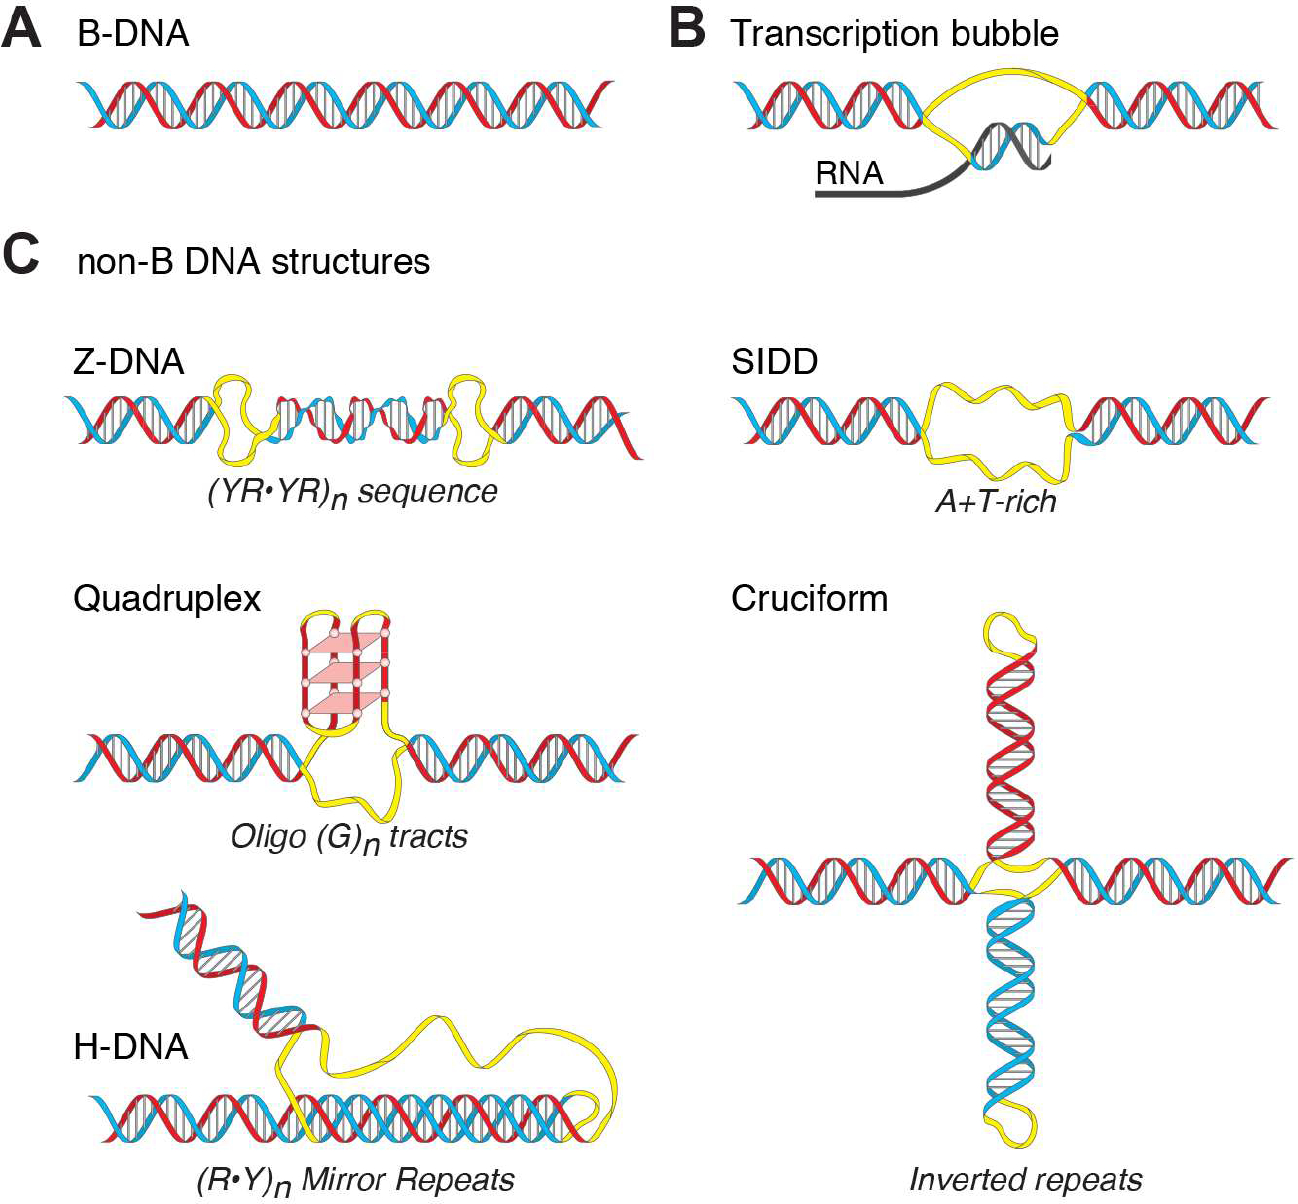
Though mainly right-handed B-form double helix (A), DNA strands separate during transcription to form a non-B DNA transcriptional bubble (B) enabling RNA polymerase to read the template strand. DNA forms other non-B DNA structures (C) from particular Sequence Motifs (SMnB): Z-DNA, left-handed double helix at alternating purine–pyrimidine sequences; Stress-Induced Duplex Destabilized site (SIDD) at locally A/T-rich regions; Quadruplex (G4), four-stranded DNA that stacks planar sets of four mutually Hoogsteen H-bonded Gs; Cruciform, an inverted sequence-repeat extruded from the central helical axis; and H-DNA, a triple-stranded DNA that melts one-half of mirror symmetric homopurine or homopyrimidine repeats, and then folds back and threads one of the melted strands into the major groove of the unmelted half Hoogsteen H-bonded triplex. Each non-B DNA conformation has a specific distribution of unpaired bases (indicated by yellow ribbon).
Torsional stress from untwisting (negative supercoiling), propagated through the DNA fiber, exerts a broadly distributed destabilizing stress that may promote alternative DNA structures, physiologically (Kouzine et al., 2013a; Naughton et al., 2013; Teves and Henikoff, 2014b). Although the average level of supercoiling across the genome is low (Sinden et al., 1980), in small regions containing active transcription units, the torsional stress may be high. Indeed, when embedded in plasmids and examined in vivo (especially in bacteria), strong evidence supports the adoption of alternative conformations by sequences with non-B potential (Jaworski et al., 1987; Kouzine et al., 2008; Krasilnikov et al., 1999; Panayotatos and Fontaine, 1987). Based on biochemical and biophysical principles and experiments in vitro, various algorithms have been devised to identify Sequence Motifs of non-B DNA (SMnB) that might fold into non-B DNA structures (Cer et al., 2011; Kikin et al., 2006; Wang et al., 2013), and in some cases to assign a probability of such isomerization in naked DNA (Figure 1). Genome sequencing has revealed pervasive SMnB, especially in metazoans (Cer et al., 2011; Du et al., 2014a; Huppert and Balasubramanian, 2007; Zhabinskaya et al., 2015). However, little is known about the prevalence and stability of non-B DNA in vivo nor of the biological parameters that regulate transitions between B-DNA and other conformations in cells (Kouzine and Levens, 2007; Nawy, 2015; van Holde and Zlatanova, 1994). Computationally, SMnB are enriched in gene regulatory regions—promoters, untranslated regions, telomeres and origins of replication— and so may be associated with transcription, replication or recombination (Bochman et al., 2012; Huppert and Balasubramanian, 2007). Non-B DNA structure formation has been proposed to account for genome damage (Bacolla et al., 2016; Belotserkovskii et al., 2013; Kovtun et al., 2007; Wang et al., 2008) and to help regulate DNA-dependent processes (Baranello et al., 2012; Kouzine and Levens, 2007). But the degree to which these motifs direct structures that are realized in vivo remains largely unassessed.
The evolutionary conservation of SMnB and the cellular consequences manifested upon pharmacologic disturbance of non-B DNA stability, or by perturbing proteins that interact with SMnB, invite consideration of the biological roles for unusual DNA conformations (Du and Zhou, 2013; Kendrick et al., 2014; Murat and Balasubramanian, 2014; Shin et al., 2015). In one case, the Far UpStream Element (FUSE) of the human MYC gene, dynamic changes in DNA conformation are coupled with promoter output by FUBP1 and FIR, proteins that interact with non-B DNA (Kouzine et al., 2008; Liu et al., 2006b). However, the paucity of in vivo experimental genomic data has confounded evaluation as to whether non-B DNA formation is an occasional epiphenomenon or a general principle of genome action (Kouzine and Levens, 2007; Nawy, 2015). To sustain progress in this field, techniques allowing the fine mapping of unusual DNA conformations throughout the genome in living cells are necessary.
Permanganate footprinting has long enabled the characterization of single stranded DNA (ssDNA), in vitro and in vivo, especially at transcription bubbles formed by RNA polymerases (Bui et al., 2003; Giardina et al., 1992; Gogos et al., 1990; Holstege and Timmers, 1997; Johnston and Rich, 1985; Krumm et al., 1992). To map non-B DNA genome-wide, we combined permanganate footprinting with high-throughput sequencing. Oxidation of nucleotides, even in transiently unwound regions, traps the unpaired state, conferring sensitivity to single-strand specific nucleases. Because different classes of non-B have distinct patterns of base unpairing, each display characteristic patterns of sensitivity to permanganate and subsequent nuclease cleavage (Figure 1) that potentially enable inferences of the frequency and nature of non-B DNAs across the genome.
Here we map permanganate-dependent nuclease hypersensitive sites to show the existence of many non-B DNA structures in vivo in the genomes of mouse and human cells, and in vitro when genomic DNA is supercoiled. The non-B DNA structures throughout the mammalian genome in vivo are temporally and locally associated with particular chromatin configurations, gene functions and cell states that may contribute to our understanding of genome biology.
RESULTS
Overview of the approach
To detect unusual DNA structures genome-wide in vivo, we interrogated existing ssDNA-Seq data (Kouzine et al., 2013b). The ssDNA-Seq procedure uses potassium permanganate and single-strand specific nuclease treatments to introduce double stranded breaks in DNA regions enriched for unpaired bases in vivo. These breaks are labeled with biotin, the DNA is sonicated, streptavidin-selected and sequenced.
Previously ssDNA-Seq was applied both to resting- and lipopolysaccharide-interleukin 4 activated murine B-cells; activation induces a dramatic global increase in transcription (Kouzine et al., 2013b). The binding of RNA polymerase II (RNAPII) at transcription start sites (TSSs) was completely congruent with the single-stranded DNA of transcription bubbles in the open transcription complexes of activated B-cells (Figure 2A, top). Many foci of single-stranded reactivity did not co-localize with RNAPII and were unassociated with active transcription (Figure 2A, middle and bottom, black arrows) raising questions about DNA conformation at these sites. Notably, single-stranded DNA occurred at a highly conserved sequence of exon 1 of Adam 12 (Figure 2A, bottom) that has been studied and proposed to function as silencer in gene expression upon Z-DNA formation (Ray et al., 2013).
Figure 2. ssDNA-Seq detects unusual DNA structures genome-wide.
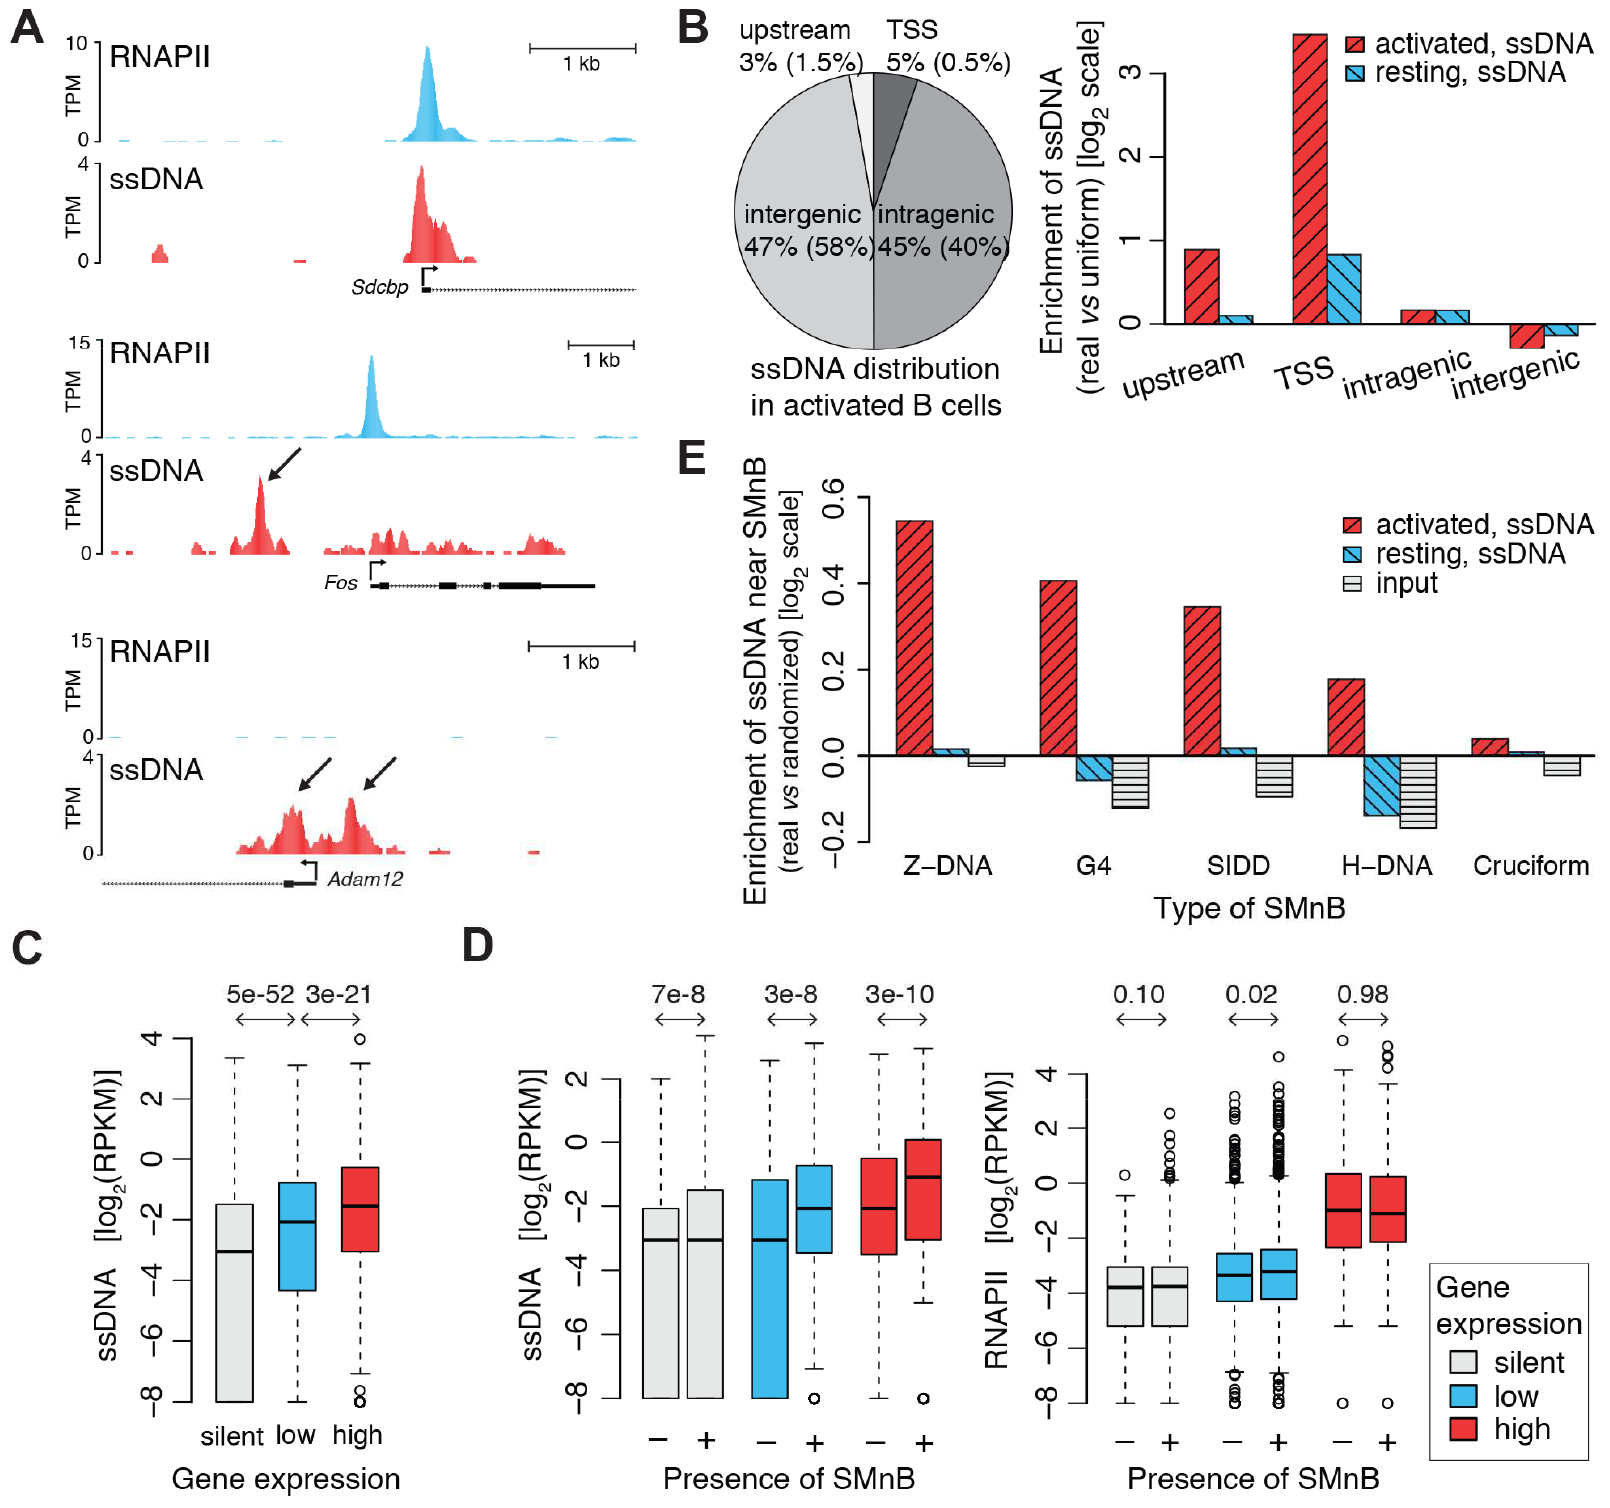
A) ChIP-Seq binding profiles for RNAPII vs. ssDNA-Seq signals at Sdcbp, Fos and Adam12 genes; normalized data as sequenced tags per million (TPM) are displayed on the UCSC genome browser. B) ssDNA signal across different genomic regions in mouse activated B-cells (left) and differential enrichment of ssDNA signal vs. uniform signal distribution (right) for activated and resting B-cells. Parenthesis include the percentages in a random background model. The upstream promoter region is defined as −2 Kb and to −0.2 Kb relative to the transcriptional start site (TSS). The TSS is a 400 bp window centered on the transcription start site. C) ssDNA-Seq tag density from −2.0 Kb to −1.0 Kb upstream of TSSs is related to expression intensity; silent, low and high expression genes ranked by RNA-Seq measurement. Density of ssDNA-Seq tags normalized as reads per kilobase per million (RPKM). See also Figure S1A. D) ssDNA-Seq tag densities from −2.0 Kb to −1.0 Kb upstream of TSS of active genes are closely related to the presence of SMnB (left), whereas RNAPII binding measured by ChIP-Seq is not (right). In (C) and (D) p-values from one-sided Wilcoxon rank sum test are shown; absolute Cohen’s d effect size of all ssDNA-Seq tests for active genes is above 0.2 while RNAPII test is negligible. There are 3799 silent, 3121 low, and 2955 high expression genes, of which 2680, 2328, and 2265, respectively, have SMnB in their upstream regions (−2.0 Kb to −1.0 Kb from TSS). E) Different sorts of SMnB are enriched for ssDNA-Seq tags in activated, but not resting murine B-cells or randomly distributed motifs. Tag enrichment obtained for the sonicated genomic DNA (input) from activated B-cells is shown. The top 5% of regions with SMnB were used for each experimental or randomized sample. The Cohen’s d effect size for all types of SMnB in activated B-cells is at least 0.4, except cruciform which is negligible. See also Figure S1.
Not all ssDNA sites are due to RNAPII
The experimental genomic distribution of all single-stranded DNA sites (STAR Methods) was compared with the distribution expected using a random background model (Figure 2B, left). The density of ssDNA at transcription start sites was higher than expected by chance, reflecting the transcription bubbles of RNAPII at promoter-proximal sequences (Kouzine et al., 2013b). The regions upstream of promoters also had high levels of ssDNA (Figure 2B, right). Recent genome-wide maps of DNA topology show that transcriptional activity is associated with torsional deformation of DNA that propagates at least 2 kb upstream of TSSs (Kouzine et al., 2013a; Naughton et al., 2013; Teves and Henikoff, 2014b). This torque can melt DNA and stabilize non-B DNA conformations at susceptible sequences remote from transcribing RNAPII (Brooks and Hurley, 2009; Kouzine et al., 2008) especially at highly transcribed genes. To validate this expectation, tag-density upstream of TSSs was analyzed as a function of gene expression, as assessed by RNA-Seq (Figure 2C) and by RNAPII ChIP-Seq (Figure S1A); as predicted, the level of ssDNA in regions upstream and separate from TSSs, correlates with the transcriptional activity of the associated genes (Spearman’s correlation: 0.3).
In addition to programing efficient transcription of their associated genes, many active promoters direct low-level transcription in the opposite direction, just upstream of the TSS (Core et al., 2008; Seila et al., 2008). Might the transcription bubbles of these divergently transcribing RNAPIIs explain the enriched ssDNA upstream of TSSs observed in Figure 2C? To answer this, regions upstream of promoters were classified by the presence or absence of SMnB. While more ssDNA tags were associated with SMnB-positive regions than with motif-less regions (Figure 2D, left), RNAPII-binding to upstream regions (by ChIP-Seq) was unrelated to the presence or absence of SMnB (Figure 2D, right). The simplest explanation of the high ssDNA signal upstream of active genes is therefore formation of non-B DNA structures at SMnB driven by dynamic negative supercoils emanating from nearby transcription.
Characterization of non-B DNAs in vivo
SMnB are defined by sequences with special sequence characteristics and/or symmetry (Figure 1) (Bacolla and Wells, 2004; Sinden, 1994). However, the mere occurrence of these features does not insure that a potential structure forms in vivo as no sequence-based method can take into account the variations in biological conditions that sponsor or oppose structure formation. Nevertheless, the features associated with a particular conformation in vivo should be extractable using meta-analysis of ssDNA tags from a sufficiently sampled population of cells.
To correlate ssDNA tags with particular unusual DNA structures, the SMnB associated with Z-DNA (716,462 motifs total), G4 (482,833 motifs total), H-DNA (728,355 motifs total), cruciform (602,450 motifs total), and Stress-Induced Duplex Destabilized DNA (SIDD, 1,057,816 motifs total) were first predicted computationally, and then separately overlapped with the genomic map of ssDNA tags (STAR Methods). The ratio of experimental tags near the sequences of interest versus tags delivered from appropriately randomized data was computed to find the enrichment. All classes of potential non-B DNA forming sequences, except for cruciforms, were significantly enriched for the ssDNA signal in the data collected from activated B-cells (Figure 2E). The very low experimental enrichment for cruciform-forming SMnB (Cohen’s effect size: 0.07, negligible) is consistent with thermodynamic calculations that cruciforms extrude infrequently (Zhabinskaya and Benham, 2013). Hence cruciforms were not further analyzed.
To estimate the extent of unusual DNA structure formation in the genome of mouse activated B-cells, the number of SMnB experimentally enriched for the ssDNA signal (STAR Methods) was compared to the total number of analyzed SMnB (Tables 1 and S1); up to 9% of the computationally identified SMnB were associated with unpaired bases in vivo with a false discovery rate of 0.05 (Figure S1B). Negative-control experiments validated the accuracy and specificity of our experimental and analytical methods. Neither ChIP-Seq with unspecific IgG nor randomized data were associated with ssDNA signal related to SMnB (data not shown). The ssDNA-Seq signal reflected the presence of unusual DNA conformations and not simply accessibility to the potassium permanganate, because DNase I hypersensitive sites (DHS) containing SMnB were more enriched for ssDNA-Seq than DHS lacking SMnB, even when matched for DNase I sensitivity (Figure S1C). Such enrichment was not observed in the datasets from resting B-cells (Figure 2E). These results indicate that ssDNA-Seq detects a variety of non-B DNA structures and suggests that the formation of these structures in vivo depends on transcription.
Table 1. Extent of non-B DNA formation in mouse genome.
Total number of predicted SMnB vs. the number of identified non-B DNA structures (ssDNA+ SMnB) in activated mouse B-cells. See also Tables S1, S2,and S4,and Figures S1B, S2D, S2E and S2F.
| Type of SMnB | SMnB not overlapping with RNAPII | SMnB overlapping with RNAPII | ||||
|---|---|---|---|---|---|---|
| Analyzed SMnB | ssDNA+MnB | Percent | Analyzed SMnB | ssDNA+SMnB | Percent | |
| Z-DNA | 249752 | 22214 | 8.9% | 41899 | 2848 | 6.8% |
| G4 | 263167 | 18397 | 7.0% | 34958 | 1862 | 5.3% |
| SIDD | 416444 | 15188 | 3.6% | 30930 | 110 | 0.4% |
| H-DNA | 320585 | 16876 | 5.3% | 20846 | 233 | 1.1% |
Structural profiles of non-B DNAs in vivo
The ssDNA in non-B DNA structures (Figure 1) impose characteristic patterns of expected permanganate modification and subsequent S1 nuclease cleavage (Bui et al., 2003; Holstege and Timmers, 1997; Jiang et al., 1991; Kato et al., 2003; Kouzine et al., 2004). For example, the transition from B- to Z-DNA is accommodated by flipping out of base pair(s) at the junctions between the left- and right-handed double helices (Ha et al., 2005). Thus, the ssDNA-Seq tag distribution for this structure should be pairs of peaks bracketing the respective SMnB (Jiang et al., 1991) depending on the exact sequence, as thymidine reacts with permanganate more than cytosine. To validate such expectations, the distributions of ssDNA tags at different SMnB were determined. To obtain the ssDNA signatures of SMnB free of confounding RNAPII transcription bubbles, SMnB overlapping RNAPII ChIP-Seq peaks (Table S2) were excluded from the initial analysis, to be analyzed separately (Table 1). [SINE elements that would otherwise overwhelm unique sequence signals were also removed (Roberts et al., 2014) (STAR Methods)]. As expected, the ssDNA-Seq profiles of Z-DNA, G4 and SIDD motifs in mouse activated B-cells (Figure 3A) were distinct and generally conformed to the predicted stereotypical structures. The bell-shaped and rather damped genomic profile of ssDNA-Seq tags at SMnB with potential H-DNA in vivo, likely reflects triplexes of varying lengths (Bacolla and Wells, 2004). As a negative control, random genomic locations near to, but offset from the authentic SMnB sites were selected, the ssDNA-Seq tag distribution at these sites was computed; no tags were enriched at these randomized sites (Figure 3B). In resting B-cells that support only low levels of transcription, the tag density was not increased for any class of SMnB (Figure S2A) indicating that transcription may promote non-B DNA conformations in activated B-cells. Direct sequencing of sonicated genomic DNA, as well as ssDNA-Seq of potassium permanganate untreated cells (STAR Methods, Figure S2B and S2C), verified that ssDNA-Seq tags required chemical modification of non-B DNA. We conclude that ssDNA-Seq detects and resolves a variety of non-B DNA structures that are distinct from RNAPII transcription bubbles.
Figure 3. Characteristic ssDNA-Seq profiles in vivo and in vitro for different sorts of SMnB evince non-B DNA structure formation.
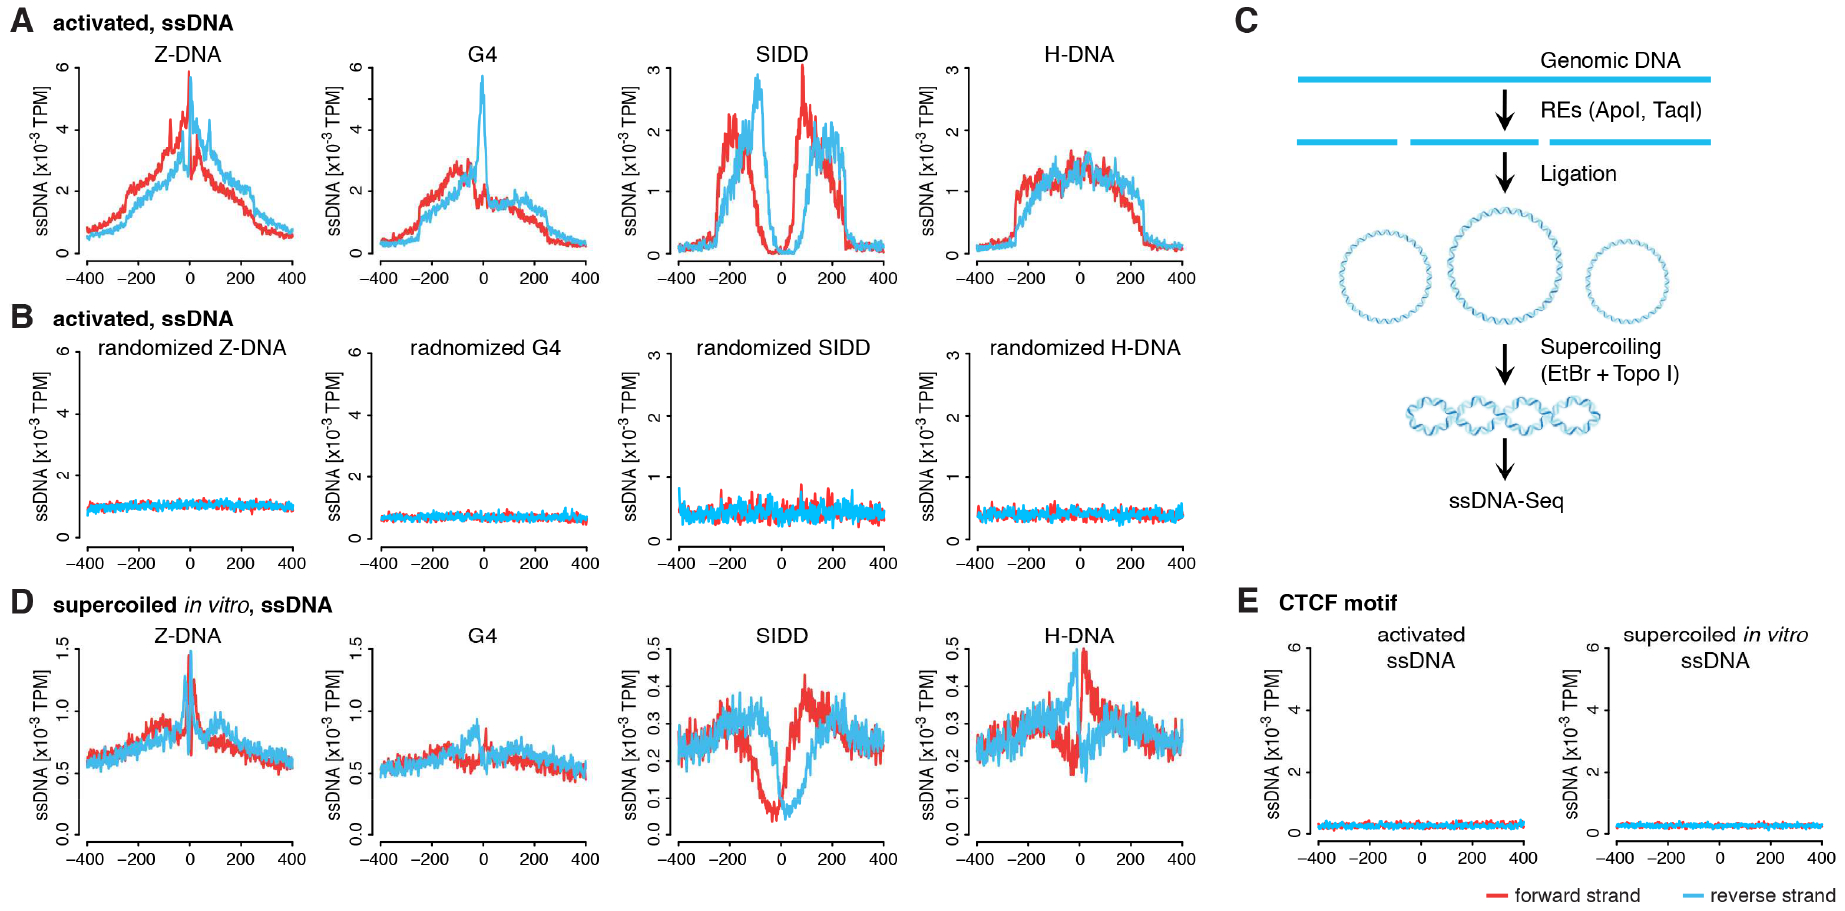
A) Composite profiles of ssDNA-Seq tags at SMnB enriched for ssDNA-Seq tags. The y-axis shows the normalized density of TPM along the x-axis numbered from the center of the aligned SMnB. Forward and reverse strand of ssDNA-Seq tags are shown in red and blue, respectively. SMnB near RNAPII binding sites were not included in this analysis. B) Composite profiles of ssDNA-Seq tags at random genomic locations near SMnB sites analyzed in (A). See also Figure S2A, S2B and S2C. C) Schema of whole genome supercoiling and subsequent ssDNA-Seq assay. D) ssDNA-Seq tag density profile from genome supercoiled in vitro at same SMnB as in (A). E) ssDNA-Seq tag distribution at CTCF binding sites in mouse activated B-cells and genome supercoiled in vitro.
We sought to use ssDNA-Seq and subsequent analyses to identify non-B DNA structures even in regions of the genome laden with RNAPII (Table 1, Tables S1 and S2). The size of the transcription bubble is defined by the active site of RNAPII, and so a large excess of ssDNA-Seq tags relative to RNAPII ChIP-Seq tags would seem attributable to nearby alternative DNA structures. Accordingly, the ratio between ssDNA-Seq tags and RNAPII ChIP-Seq tags at TSSs was analyzed and found to increase with the number of SMnB (Figures S2D, S2E and S2F). This approach identified non-B DNA sites despite nearby transcriptional bubbles (Tables 1 and S1B, and STAR Methods). A limitation of the method is that clusters of non-B DNA structures are not necessarily expected to display clear individual peaks. ssDNA-Seq signals of individual structures in broad zones harboring multiple SMnB cannot be confidently disambiguated at current sequencing depths. At some genomic sites, the SMnB for distinct structures overlap. 3%, 11%, 12%, and 18% of Z-DNA, G4, SIDD and H-DNA, respectively, overlap with other non-B DNA structures over 50% of their length; when such overlap occurs, higher resolution mapping will distinguish whether both structures co-exist or if one prevails. If supercoiling is the major driver of B-DNA destabilization, energetics favor mutual exclusivity of these structures that compete with each other to absorb the mechanical potential stored in under-wound DNA (Zhabinskaya and Benham, 2013). Overall, the analysis of ssDNA-Seq tags provides a framework to identify and map unusual DNA conformations at high resolution that combines experimental and computational methods.
Deconstruction of unusual DNA in vivo
To gain insight into the correspondence of structures detected in vivo with those reported in vitro, we developed a strategy to force SMnB throughout the genome, to adopt non-B DNA structures in vitro based on the assumption that transcription-generated dynamic supercoiling is a major driver of non-B DNA structure formation at SMnB. (Previous studies have used non-B DNA structures as sensors of torsional stress upstream of active promoters both in vitro and in vivo (Dayn et al., 1992; Jude et al., 2013; Kouzine et al., 2004; Kouzine et al., 2008). To ask if supercoiling could sponsor non-B structures formation on a genome-wide scale, DNA from mouse B-cells was fragmented using restriction enzymes, ligated into circles, and supercoiled to the expected physiological value (Kouzine et al., 2008) with topoisomerase I in the presence of ethidium bromide (Kouzine et al., 2004). ssDNA-Seq was then applied to the whole genome supercoiled in vitro (Figure 3C), analyzed as described above and compared with the results obtained in vivo. The ssDNA profiles associated with SMnB having potential for Z-DNA and SIDD formation (Figure 3D) within the DNA supercoiled in vitro resembled the profiles observed in vivo (Figure 3A); implying that these same structures form in vivo. As a control, the ssDNA sequencing tag distribution near computationally predicted CTCF binding sites in mouse genome was analyzed (Ziebarth et al., 2013). The CTCF transcription factor was selected as negative control for three reasons: 1) it binds thousands of genomic sites; 2) its binding sites are similar in length to SMnB; and 3) its sequence resembles the low complexity of SMnB (Essien et al., 2009). As expected, ssDNA-Seq tags were not enriched at CTCF sites, neither in mouse activated B cells nor in the artificially supercoiled genome (Figure 3E).
In contrast to their heterogeneous length profile in vivo, the peaks of SMnB with H-DNA forming potential in vitro were sharper suggesting a lower level of structural diversity indicating that in vivo, condition (i.e the local superhelical density) or structure-specific factors may modify the length, reactivity or isomerization of H-DNA. The ssDNA-Seq meta-profile of SMnB with G4 potential was generally similar in vivo and in vitro though much weaker in vitro reflecting a smaller signal to background ratio. This suggests that G4 structures are less readily formed from double-stranded DNA in vitro even if subjected to torsional stress. The kinetic barrier to the melting G-rich tracts in B-DNA opposes the high stability and perhaps metastability of G4es; high G4-levels in vivo suggest that they may not be in thermal equilibrium with B-DNA.
Lastly, we investigated whether the signatures of non-B DNA were apparent at individual structures, or were recognized only via meta-analysis. Relaxed and supercoiled plasmids bearing different SMnB were analyzed by ssDNA-Seq to determine if torsional stress potentiates the formation of particular structures (STAR Methods). Sequences with Z-DNA, SIDD, or G4 forming potential were embedded in the previously described pFLIP plasmid (Kouzine et al., 2004) and subjected to ssDNA-Seq (Figure S3). The ssDNA-Seq tag patterns generated for SMnB with Z-DNA and SIDD forming potential (Figure 4) resembled the composite profiles derived from meta-analyses of the ssDNA-Seq performed in vivo, and the profiles of genomic DNA supercoiled in vitro (Figure 3A and D). However, the ssDNA signal at the G4-susceptible motif was weak, again indicating that G4 was not efficiently folded from dsDNA (Figure 4). The greater prevalence of ssDNA-Seq tags at SMnB with potential for G4 formation in vivo compared with in vitro, suggests that there are factors or conditions in cells that destabilize these sequences when in B-form or that stabilize them as G4. For example, G4 DNA could be associated with ssDNA on the lagging strand at replication forks (Murat and Balasubramanian, 2014). The in vivo G4 signal could reflect folding of canonical or variant G4.
Figure 4. Detection of non-B DNA structures in supercoiled plasmids.
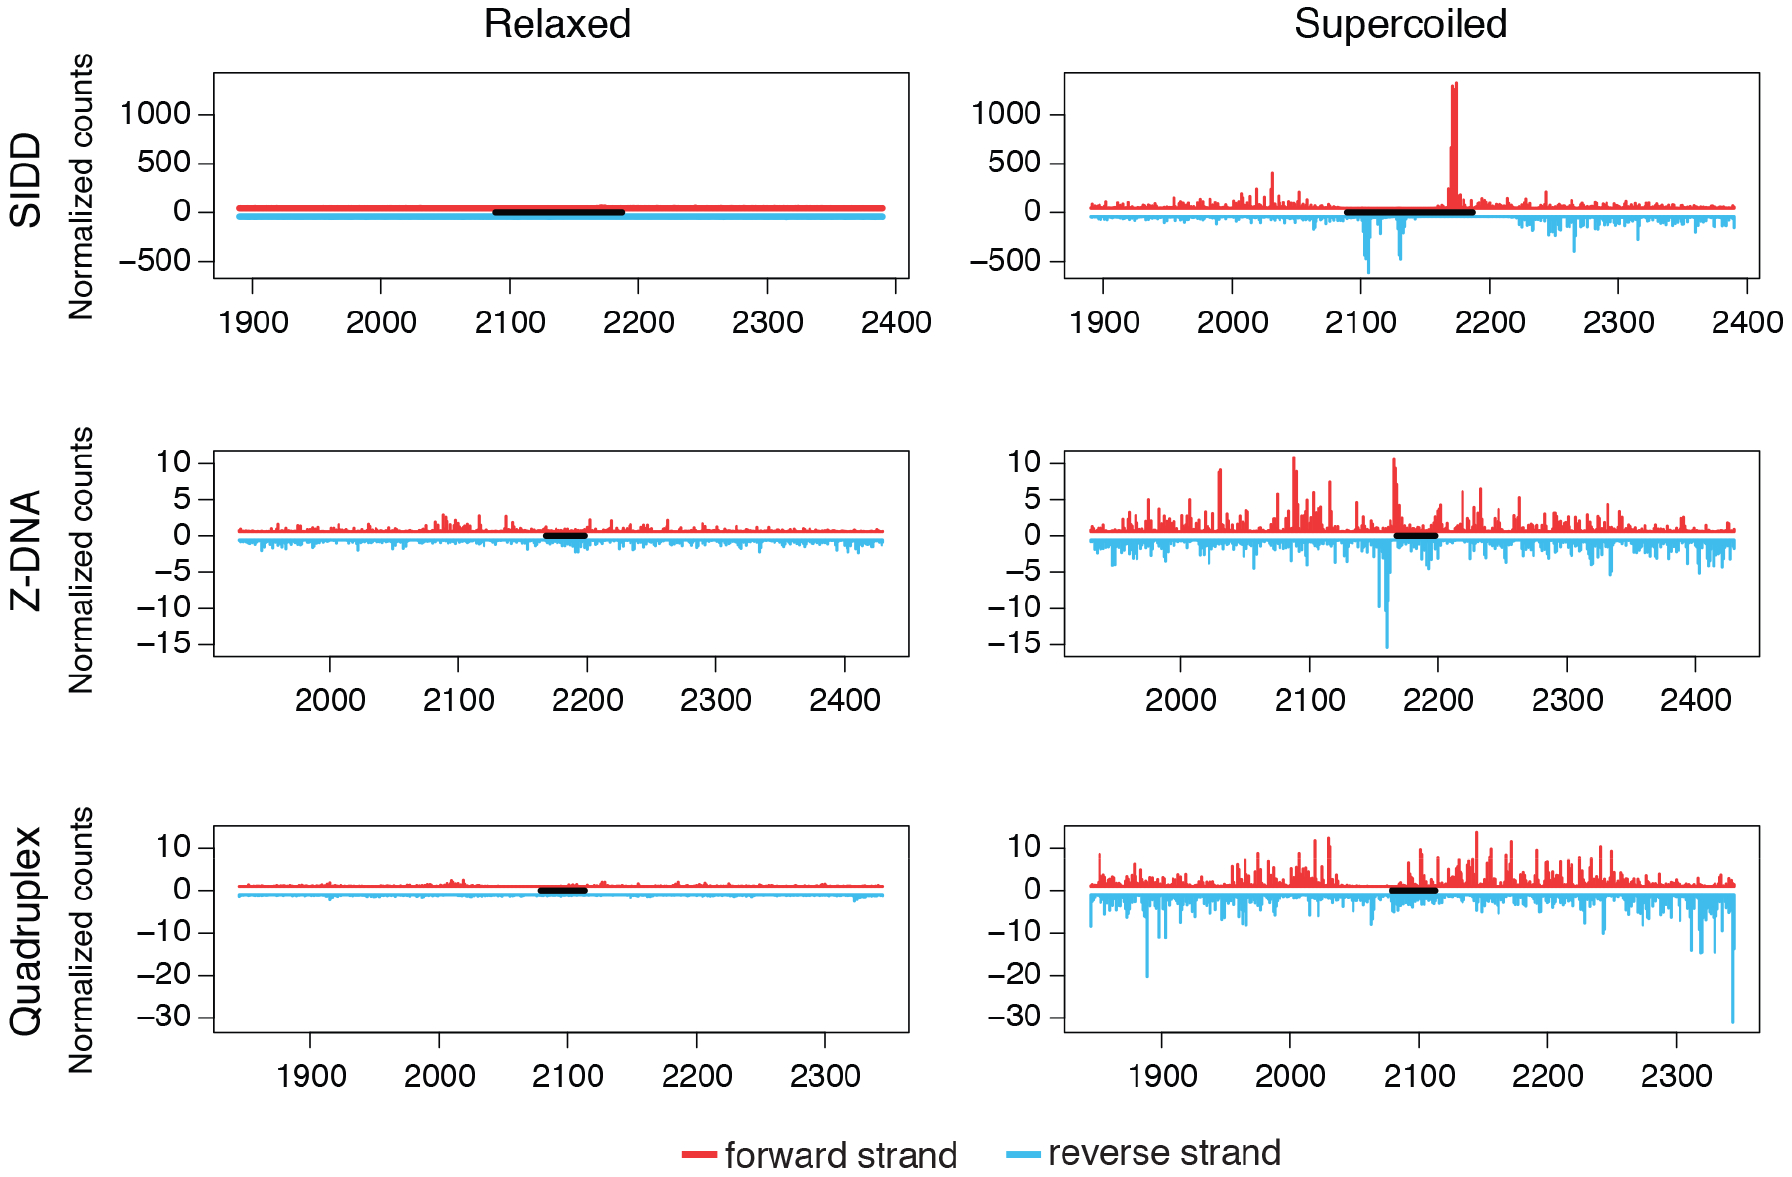
ssDNA-Seq of regions embracing sequences with non-B DNA potential (black bars) from relaxed or supercoiled pFLIP plasmids. Forward and reverse strand ssDNA-Seq tag counts in red and blue, respectively. See also Figure S3.
Thus ssDNA-Seq detected and distinguished different non-B DNA structures with high specificity in vivo. In addition, these results indicate that intracellular supercoiling might be the main factor which drives the formation of many unusual structures.
The amplitude of the ssDNA-Seq tag densities at structures forming in vivo generally exceeded those of structures forming in vitro. In vivo torsional stress might be channeled only into SMnB unfettered by chromatin; in vitro the stress would be distributed between all SMnB, with each formed structure reducing the stress available to the others. Thus there should be significant interplay between chromatin and ssDNA-Seq profiles.
Interplay of non-B DNA structures and chromatin
What is the interplay between unusual DNA structures and constraining chromatin? Nucleosome cores appear to interact only with B-DNA; so alternative DNA structures would be excluded from nucleosomes (Garner and Felsenfeld, 1987; Ruan and Wang, 2008; Wong et al., 2007). Thus nucleosomal arrays might be differently organized depending on whether constituent SMnB are folded into non-B DNA structures or not. SMnB may influence chromatin in two ways. First, the intrinsic DNA sequence requirements for particular non-B DNA structures might either reinforce or oppose the intrinsic sequence preference of nucleosomes (Struhl and Segal, 2013), thereby influencing nucleosome occupation (the probability that a particular base pair is nucleosome bound across a cell population) even when these sequences are in B-DNA. Second, when folded, non-B DNA structures might sterically exclude nucleosomes and thereby contribute to nucleosome positioning (the probability that a nucleosome in a population of cells starts at a particular base pair (Sadeh and Allis, 2011)). Thus non-B DNAs might enforce or oppose specific chromatin states associated with a particular pattern of gene activity.
To test whether non-B DNA conformations enforce nucleosome positioning, the preferred locations of nucleosomes in a population of cells were obtained by MNase-Seq (Schones et al., 2008). The distribution of nucleosomes around different SMnB is displayed in Figure 5. The upper row shows regions that include unfolded SMnB, that are not enriched for ssDNA-Seq tags. Although unfolded, these SMnB show different nucleosome occupation than their flanking sequences. The nucleosome occupancies were mildly to severely reduced at all SMnB (Figure 5, upper row) indicating either that these sequences intrinsically disfavor nucleosome binding or that these sites sporadically assume alternative structures that redistribute nucleosomes, but this redistribution persists long after the structures relax to duplex DNA.
Figure 5. Non-B DNA structures position flanking nucleosomes.
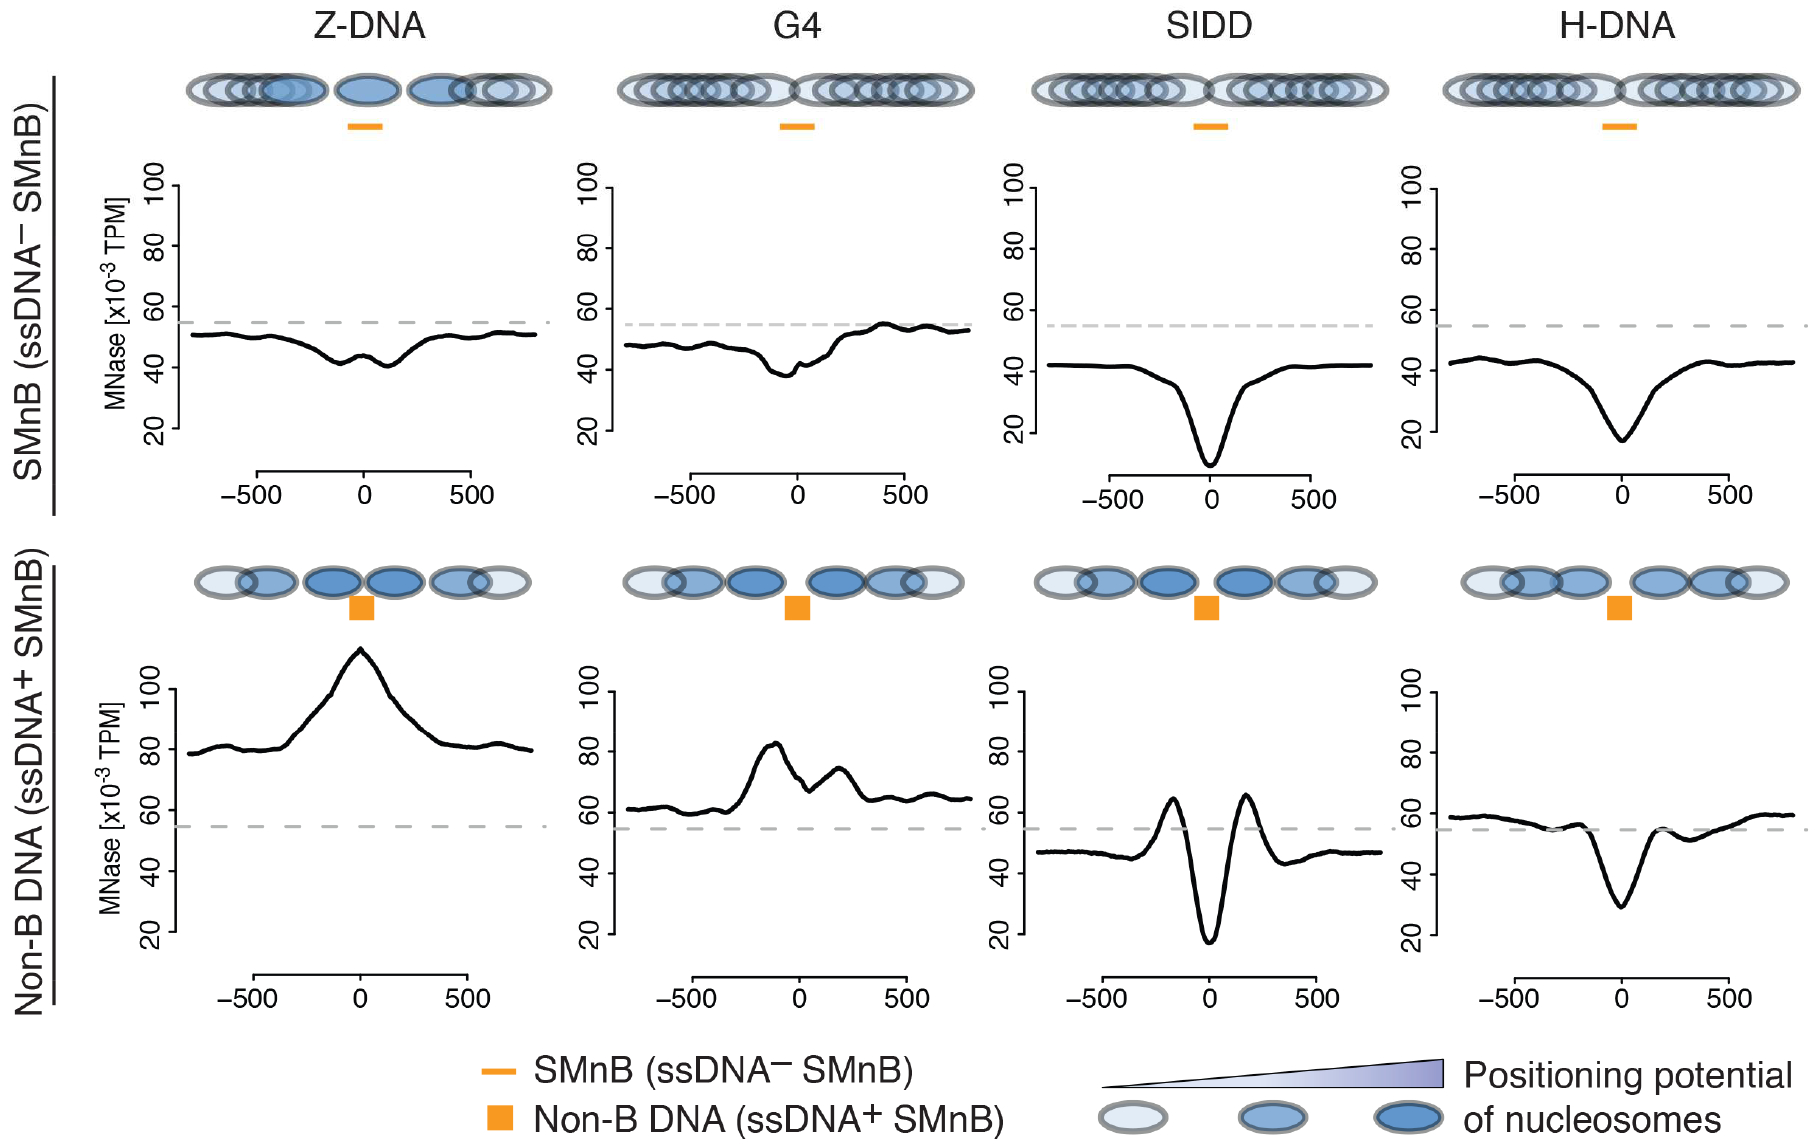
Nucleosome occupancy near the different SMnB lacking ssDNA-Seq signal (top) or near non-B DNA structures (bottom). Nucleosomes are represented by filled ovals colored in blue according to the level of positioning. Dashed line indicates the average genome nucleosome density. SMnB near RNAPII binding sites were not included in the analysis. See also Figure S4.
The bottom row (Figure 5) displays the nucleosome profiles for SMnB enriched for ssDNA tags, indicative of non-B DNA structure formation. These regions showed precisely positioned nucleosomes at the margins of the SMnB, indicating that these structures effectively position and organize nucleosomes. At formed Z-DNA, nucleosomes overlapped the B-Z junctions which may be explained by biochemical evidence that in vitro, Z-DNA may be situated at the nucleosomal DNA entry/exit sites (Mulholland et al., 2012). Genome browser inspection of prominent Z-DNA structures indicated that a nucleosome gets positioned sometimes at the left and sometimes at the right junction of Z-DNA with the flanking B-DNA (Figures S4A and S4B). Meta-analysis that superimposes these cases generates an unresolved fusion of the overlapped nucleosomes (Figure S4C).
We conclude that while in B-DNA conformation the genome-wide ensemble of SMnB contributes directly to nucleosome occupancy; when formed, non-B DNA structures strongly influence nucleosome positioning.
Non-B DNA structures and transcriptome characteristics
Our analysis suggests that non-B DNA structures occur throughout the genome, and are often associated with active genes that pump mechanical energy into DNA. Activators and repressors of transcription that interact with non-B DNA (Brooks and Hurley, 2009; Cogoi et al., 2014; Kang et al., 2014) are able to respond to the strain introduced into the DNA fiber by transcription or chromatin remodeling. Although a mechanism of this type was previously shown to operate as a molecular cruise control through a SIDD site (FUSE) of human MYC (Kouzine et al., 2008; Liu et al., 2006b), little is known about the prevalence, principles and patterns of gene regulation by non-B DNAs.
To explore the biological and regulatory significance of non-B DNA, all promoters of protein-coding genes bearing non-B DNA structures were tabulated and sorted using Gene Ontology and functional annotation (Table S3). Notably, the promoters of developmental regulatory genes were found to be enriched for non-B DNAs (Figure 6A) with high statistical significance.
Figure 6. Non-B DNA at promoters and transcriptome characteristics.
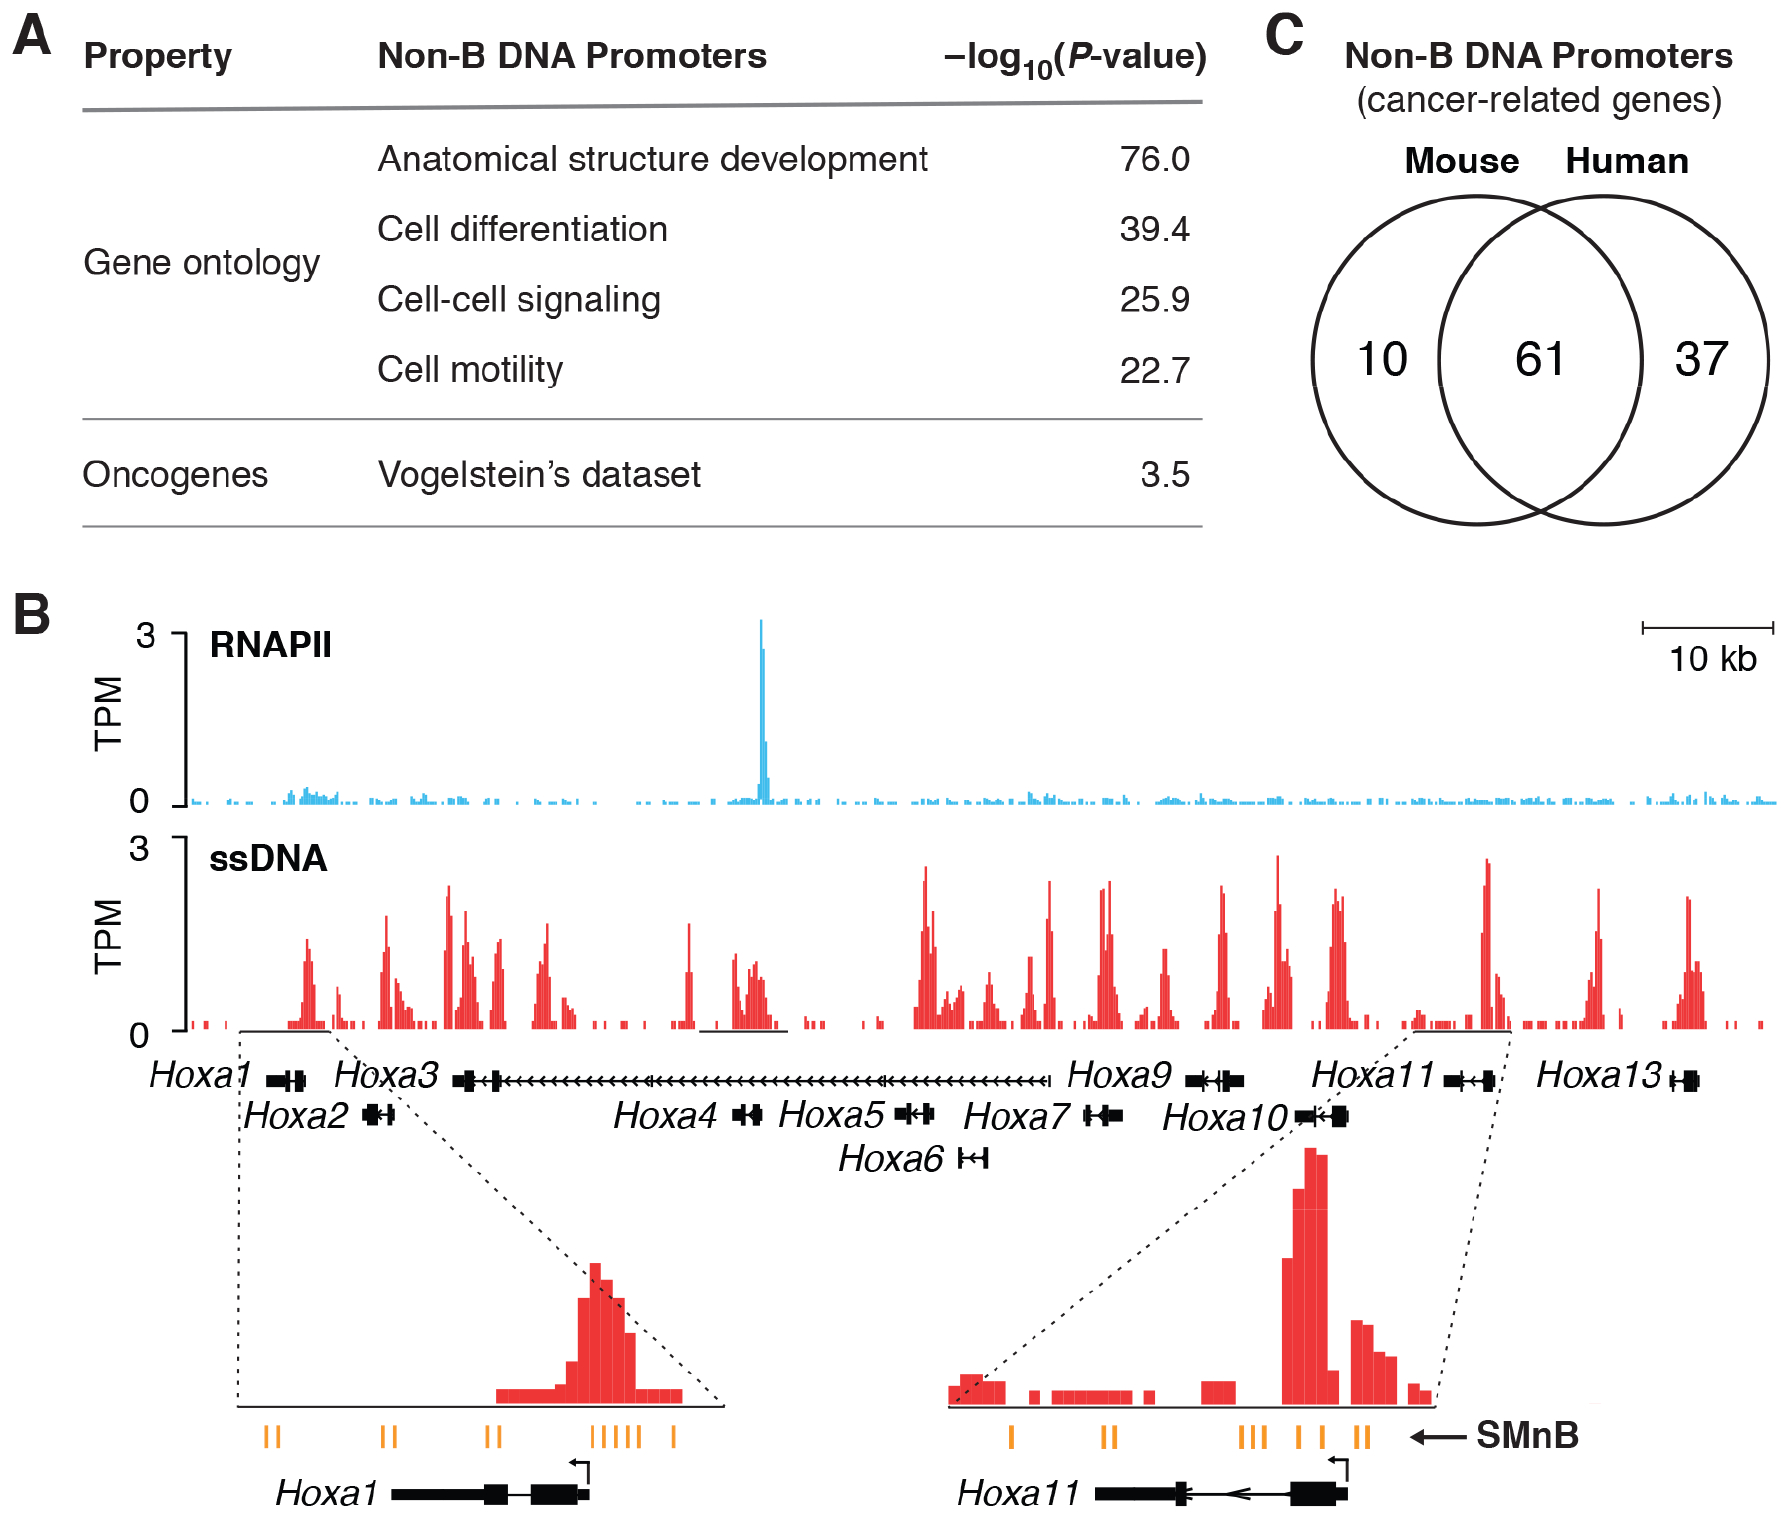
A) Non-B DNA structures in promoter regions is characteristic of developmental and cancer-related genes. Non-B DNA structures throughout promoters (−2 Kb to +0.2 Kb) were identified using the computational algorithm that enables analysis despite overlapping RNAPII binding (STAR Methods). Log of the p-value (probability that enrichment is fortuitous) is shown. See also Table S3. B) RNAPII ChIP-Seq profile overlaid with ssDNA-Seq signal at the HOXA cluster in the mouse activated B-cells genome. Transcriptionally silent HOXA genes show extensive ssDNA signal at SMnB that form different non-B DNA structures. C) Conservation of non-B DNA structures in mouse and human cancer-related genes. See also Figures S5 and S6, and Table S1.
Developmental genes are temporally and spatially restricted, and so these unusual DNA structures might help to define their expression patterns. Abnormal or forced expression of developmental regulators could also result in developmental anomalies, and recrudescent expression in adults may contribute to oncogenic transformation, as with HOX genes (Hou et al., 2012), so these genes are off in most situations. Yet, developmental genes often reside in facultative heterochromatin and are expressed at low levels. The non-B DNA that overlaps the TSS of each promoter within the HOX A cluster (Figure 6B) may be incompatible with transcription complex assembly and thus explain the paucity of RNAPII at these sites. If so, the dynamic equilibrium between canonical duplex B-DNA and non-B DNA structures may be used to limit the expression of developmental genes whose output would be tuned by the balance between the mechanical forces imparted by transcription and chromatin remodeling, and the binding of proteins, RNAs or small molecules that favor or disfavor particular DNA structures. Perdurance of non-B DNA after active transcription would provide a means to damp expression over an extended interval. Such persistence would explain how these structures constitutively repress basal transcription levels (Hoffmann et al., 2016; Lam et al., 2013; Ray et al., 2013; Shen et al., 2013). These results suggest a regulatory role for non-B DNA in development. We speculate that many of these genes may share a common requirement to reduce their expression variability, especially at low levels.
Non-B DNA structures and cancer-related genes
Genes that control oncogenic processes such as cell division and cell death may have evolved multiple safeguards and checkpoints to prevent deleterious fluctuations in expression. Our analysis shows that the promoter regions from a set of oncogenes and malignancy related genes (Vogelstein et al., 2013) were significantly enriched for ssDNA-tags in non-B structures apart from transcription bubbles (Figure 6A). Next, Raji human Burkitt lymphoma cells were analyzed by ssDNA-Seq (Table S1), to find the genes associated with cancer that bear non-B DNA structures in their promoters in vivo (Figure S5). These results provide in vivo evidence for non-B DNA structures at the promoters of six genes (Figure S5) previously proposed to be regulated by non-B DNA in other studies (STAR Methods).
This analysis supports our proposal that non-B DNA structures may report a gene’s activity back to its promoter region and help to set expression levels or to modulate inappropriate transcription of specific genes. The importance of non-B DNA structure formation in the promoter regions of cancer-related genes is further suggested by the conservation of this feature between mouse and human cells (Figure 6C).
DISCUSSION
This work shows that the genomes of living cells are replete with active non-B DNA elements, providing a resource and an impetus to study the biology of alternative DNA structures.
Previously, non-B DNAs have been examined mainly using in vitro biochemical and biophysical approaches. Often experiments used special plasmids or oligonucleotides, and chemical conditions (involving pH and metal ions) that maximized alternative structure formation, but did not recapitulate the in vivo environment. Some studies used single stranded molecules to bypass the DNA melting required to form non-B DNA (Chambers et al., 2015). Such studies established the chemical certainty of non-B DNAs, but leave moot the formation of alternative structures in vivo and shed little light on their biological roles. Fluorescent probes have detected triple helical and G4 DNA in fixed cells by light microscopy, but with resolution insufficient to map, quantify, and analyze individual sites (Biffi et al., 2013; Gorab et al., 2009; Hoffmann et al., 2016). Genomic DNA recovered by immunoprecipitation in vitro with a G4-specific antibody did not inform about the presence and abundance of this structure while in chromatin (Lam et al., 2013). A study of formaldehyde cross-linked chromatin, re-cross-linked in vitro in the presence of a Z-DNA binding protein left similar issues unresolved. The use of two formaldehyde treatments might alter the dynamic interplay between B-DNA and non-B DNA (Li et al., 2009). Structure-specific antibodies and structure-binding ligands support the occurrence of non-B DNA at a few loci in mammalian cells (Kendrick et al., 2014; Liu et al., 2006a; Wittig et al., 1992), but the utilization of these high-affinity probes during prolonged incubations with permeabilized cells, isolated nuclei or genomic DNA, raises concerns that the probe itself may drive alternative DNA structures to supra-physiological levels (van Holde and Zlatanova, 1994).
Although LM-PCR of DNA recovered from potassium permanganate-treated cells has established the existence of non-B DNA in vivo at a handful of sites, this is insufficient to certify the generality of these results (Michelotti et al., 1996). Similarly, experiments in both prokaryotes and eukaryotes using candidate SMnB engineered into episomes (Dayn et al., 1992; Jaworski et al., 1987; Kouzine et al., 2008; Krasilnikov et al., 1999) have found non-B DNA formation to be exquisitely sensitive to DNA topology, flanking sequences, and the cellular milieu. Non-B DNA formation has also been inferred from mutations arising in or near SMnB that appear to be associated with non-B DNA structures (Bacolla et al., 2016; Du et al., 2014b; Inagaki et al., 2009; Kovtun et al., 2007; Wang et al., 2008). However, such genetic scars do not testify as to the steady-state frequency, prevalence or perdurance of the non-B DNA structures, nor do they discriminate between structure versus sequence as the driver of genetic damage. While SMnB have been largely purged from prokaryotic genomes, their persistence in metazoans suggests a physiological role for these sequences. In at least one instance, non-B DNA structures have been shown to shield against genetic damage; Z-DNA formation in proximity to CCTGxCAGG repeats acts as a “pop-off valve” absorbing negative supercoils that otherwise promote repeat expansion (Edwards et al., 2009).
These data and analytic methods may facilitate further genome-wide investigation of the interplay of DNA structure and function on a genome-scale. Meta-analysis of the genomic sequences recovered by ssDNA-Seq after permanganate treatment of cells or after supercoiling genomic DNA in vitro, and using computational approaches that recognize non-B DNA potential, ascribe unpaired bases to particular non-B DNAs with high specificity. Besides the non-B DNA conformations recognized in this study, less well-characterized alternative structures may exist in vivo. If such structures contain ssDNA, their fingerprints are embedded within our datasets. With deep enough sequencing, it may be possible to classify the structure at a single element according to its ssDNA-Seq profile, and so characterize the complete “conformation-ome” of living cells.
Non-B DNA structures in regulatory pathways
Non-B DNA structure formation and transcription are coupled on a global scale, suggesting that transcription is the major duplex-destabilizing process that drives non-B DNA structure formation. That the enrichment of non-B DNAs upstream of TSSs mirrors the distribution of transcription-generated dynamic supercoiling, suggests that mechanical stress caused by transcription may be a prerequisite for alternative structure formation at many sites (Kouzine et al., 2008). In principle, DNA replication may do the same (Lopes et al., 2011; Yu and Droge, 2014). Some metastable non-B DNA structures formed during replication survive through mitosis (Lemmens et al., 2015).
Almost absent among the cohort of non-B DNA structures in the genome are extruded cruciforms. Remarkably, a rigorous genome-wide thermodynamic calculation concludes that within the same topological domain, cruciforms do not compete effectively for formation against Z-DNA or SIDDs to relieve torsional stress (Zhabinskaya and Benham, 2013), accounting for very low levels of extruded cruciforms in vivo (Sinden et al., 1983). Importantly G4 formation from B-DNA seemed not to be driven by supercoiling alone (Figure 3D and 4). The paucity of ssDNA signal at the SMnB with G4 forming potential in vitro under conditions of high torsional stress suggests that other processes cooperate to destabilize this G-C-rich B-DNA and enable G4 formation. Inability of G4 SMnB to fold into G4 from B-DNA did not reflect a limitation of G4-predictive algorithm since human genomic sequences that were verified to form G4 structures from denatured DNA in vitro (Chambers et al., 2015) were similarly underrepresented in the in vitro supercoiled dataset (Table S4).
Although the coupling between transcription and non-B DNA formation may prove to be quite general, the functional consequences of refolding an individual segment of DNA from double helix to an alternative structure in vivo would be expected to be highly context dependent. For example, many scenarios may be imagined for non-B DNAs to inhibit, activate or modify gene regulation both physiologically (Baranello et al., 2012; Brooks and Hurley, 2009; Kouzine et al., 2014; Liu et al., 2006a; Liu et al., 2006b; Ray et al., 2013) and pathologically (Belotserkovskii et al., 2007; Grabczyk and Usdin, 2000). In the same manner that α-helices and β-sheets are modules of protein architecture subserving a range of biochemical functions, so non-B DNA structures in combination with other DNA motifs, their associated factors and chromatin components, may help to customize gene activity across a range of timescales from nearly instant homeostatic regulation (Kouzine and Levens, 2007) to evolutionary times (Zhao et al., 2010).
Evidence of specialized in vivo functions for non-B DNA exists. First, here we have shown these structures fine-tune chromatin organization within cells. Because the positioning and occupancy of nucleosomes serve as potent regulators of DNA-templated processes (Struhl and Segal, 2013), non-B DNA structures that locally and dynamically organize flanking nucleosomes may exert this mode of gene control (Figure S6A). Second, while B-DNA is an intrinsically stiff polymer that resists bending (Figure S6B) and twisting (Figure S6C), non-B conformations expose hinge-like single-stranded segments (Figures S6B and S6C) that facilitate protein-DNA interactions in the densely occupied gene control regions (Tomonaga et al., 1998). Third, non-B DNA structures recognized by a non-B DNA-specific transcription factor (Brooks and Hurley, 2009; Cogoi et al., 2014; Kang et al., 2014; Murat and Balasubramanian, 2014) may monitor the moment-to-moment duplex destabilizing stress generated by transcription (Figure S6D), enabling real-time feedback (Kouzine et al., 2008; Liu et al., 2006b). In addition, unusual DNA structures would block binding by B-DNA-specific transcription factors (Michelotti et al., 1996). Indeed, in the last several years, non-B DNA, alone or complexed with a stabilizing partner, has been implicated in constitutive repression in circumstances when even basal gene expression levels are deleterious (Hoffmann et al., 2016; Ray et al., 2013; Shen et al., 2013; Wang et al., 2014), perhaps by excluding conventional transcription factors (Figure S6E). Fourth, the processivity of the transcriptional machinery and chromatin dynamics are coupled with DNA topology near TSSs (Baranello et al., 2016; Ma et al., 2013; Teves and Henikoff, 2014a). Buffering of supercoiling by non-B DNA formation (Figure S6F) would alter the mechanical properties of the template and tune the transitions between the steps of early transcription (Kouzine et al., 2014).
The plethora of non-B DNAs associated with active genes in vivo as revealed by ssDNA-Seq suggests dynamic interplay between DNA structure and the operation of the transcription and chromatin machineries to control gene activity (Figure S6G); elucidating this interplay will expose and enhance opportunities to manipulate DNA structure for therapeutic purposes (Brooks and Hurley, 2009; Du and Zhou, 2013; Murat and Balasubramanian, 2014).
STAR METHODS
CONTACT FOR REAGENT AND RESOURCE SHARING
Further information and requests for reagents may be directed to, and will be fulfilled by the Lead Contact, Dr. David Levens (levensd@mail.nih.gov).
EXPERIMENTAL MODEL AND SUBJECT DETAILS
Cells and Growth
Mouse CD43− (B6) resting B cells were isolated from splenocytes by negative selection and activated for 72 hr at 37°C in RPMI and 10% fetal calf serum plus LPS (50 mg/ml final concentration) and IL4 (2.5 ng/ml final concentration). Apoptotic cells were removed with a Dead Cell Removal Kit followed by Ficoll gradient with >90% live-cell purity. Burkitt’s lymphoma Raji cells were purchased from ATCC and maintained in RPMI and 10% fetal calf serum at 37°C. Cells were arrested at an early point of G1 phase in the cell cycle by treatment with 1.5% (v/v) DMSO for 96 hr (Sawai et al., 1990). Cells were released from DMSO in fresh medium. Experiments were conducted 6 hours later.
Single strand DNA-Sequencing (ssDNA-Seq)
ssDNA-Seq was performed as previously described (Kouzine et al., 2013b). 8×10⁷ cells were washed with PBS at 37°C and resuspended in 15 mM Tris-HCl (pH 7.5), 60 mM KCl, 15 mM NaCl, 5 mM MgCl2, and 300 mM sucrose. Cells were treated with 40 mM KMnO4 for 70 s at 37°C and reaction was quenched by the addition of 50 mM EDTA, 700 mM β-mercaptoethanol, 1% (w/v) SDS, and 40 mg/ml RNase, DNase-free. Samples were incubated for 1 hr at 37°C; proteins were digested overnight at 37°C by 300 μg/ml (final concentration) proteinase K. DNA was extracted twice with phenol, once with phenol:chloroform, and precipitated in the presence of 2 M ammonium acetate and two volumes of ethanol. The pellet was washed with 70% ethanol and resuspended in 1 ml of 10 mM Tris- HCl (pH 8.0) and 1 mM EDTA (TE) buffer. Cells treated with permanganate under our experimental conditions remain fully viable for at least 15 minutes, as essayed by Trypan Blue staining (Strober, 2015). In parallel, as a control experiment, cells were treated with water instead of permanganate (we refer to this sample as “Input”) and processed as described above.
To block any free 3’ DNA ends formed during sample preparation, genomic DNA was treated with 120 μM cordycepin-5’-triphosphate sodium salt and 800 U of Terminal transferase (TdT) in 1X TdT buffer in a final volume of 3 ml. The reaction was performed at 37°C for 1 hr. DNA was extracted with phenol:chloroform and precipitated in the presence of 2 M ammonium acetate with two volumes of ethanol. The DNA pellet was resuspended in 1 ml of TE buffer and DNA samples were divided into four microtubes (each tube containing 250 μl of DNA solution) and digested for 30 min with 0, 100, 200, or 300 U of S1 nuclease or mung bean nuclease in a final volume of 600 μl. DNA was purified as described above and dissolved in 100 μl of TE buffer. The average DNA fragment size after nuclease digestion was determined by agarose gel electrophoresis. Permanganate-treated samples, which yield a 3–5 kb average size of fragments after nuclease digestion, were chosen for further processing. In a final volume of 400 μL, 50 μg of DNA was biotinylated by 3’-end tailing reaction in 1X TdT buffer with 4,000 U of TdT, 0.5 mM dCTP and 0.08 mM Biotin-16-dUTP at 37°C for 15 min. Reactions were stopped by adding 20 mM EDTA, and purified as described above. Samples were dissolved in 200 μl of TE buffer.
The DNA samples digested with nuclease and labelled with biotin were sonicated to generate DNA fragments between 150 and 450 bp. Sonication was performed with Bioruptor (Diagenode) at high power by pulsing 20 times for 20 s and incubating on ice for 30 s between each pulse. The biotinylated fragments were pull down with streptavidin-coated beads according to the manufacturer’s protocol. After 5 washes with 10 mM Tris-HCl (pH 7.5), 1 mM EDTA, and 2 M NaCl, samples were incubated in 10 mM Tris-HCl (pH 7.5), 1 mM EDTA, 1 M NaCl, and 2 M β-mercaptoethanol at 75°C for 3 hours to disrupt biotin-streptavidin complexes (Jenne and Famulok, 1999). DNA was purified with a QIAquick PCR Purification Kit.
To remove biotinylated tails, DNA was incubated with 30 U of S1 nuclease in 100 μl of 1X S1 buffer for 30 min at 37°C. DNA was purified with a QIAquick PCR Purification Kit. DNA fragments were subsequently blunt-ended with End-It DNA end repair kit and A-tailed with Taq DNA polymerase in the presence of 200 mM of dATP for 40 min at 70°C. After each reaction, samples were purified by phenol:chloroform extraction. Illumina adaptors were ligated with T4 DNA ligase, and the reaction was purified once with AMpure XP magnetic beads (Beckman Coulter). Samples were PCR amplified for 18 cycles with KAPA HiFi DNA polymerase mix and run on a 2% agarose gel and size-selected at 200–300 bp. Sequencing data were acquired on the Illumina GAII or HiSeq2000 (Illumina).
Mapping of nucleosome positioning, MNase-Seq
Nucleosome positions were determined by MNase-seq (Schones et al., 2008). In brief, 2×10⁷ mouse activated B-cells were washed twice with ice-cold PBS and lysed in 1 ml of ice-cold lysis buffer (10 mM Tris-HCl, pH 7.5, 10 mM NaCl, 3 mM MgCl2, 0.5% NP-40, 0.15 mM spermine, 0.5 mM spermidine). After 5 min of incubation on ice, cells were centrifuged at 1000 g for 5 min at 4°C. The pellet of nuclei was washed twice with ice-cold MNase digestion buffer (10 mM Tris-HCl, pH 7.4, 15 mM NaCl, 60 mM KCl, 0.15 mM spermine, 0.5 mM spermidine) and resuspended in 1 ml of MNase digestion buffer supplemented with 1 mM CaCl2. Aliquots of 100 μl of nuclei solution were treated with 0, 0.01, 0.02, 0.04, 0.08, 0.15, 0.3, 0.6, 1.0 and 2.0 U of MNase at 37°C for 5 min. Reactions were quenched by adding 0.5% SDS, 100 mM EDTA and 100 μg/ml Proteinase K (final concentrations) and samples were incubated overnight at 65°C. DNA was extracted twice with phenol:chloroform and precipitated with 0.3 M sodium acetate and 2 volumes of ethanol 100%. DNA pellet was washed with 70% ethanol, and dissolved in 20 μl of TE buffer. To resolve the nucleosome ladder, DNA was subjected to electrophoresis on 0.6% agarose gel and examined by gel staining with SYBR green. A slice of agarose gel covering mononucleosome DNA was cut out (only from lines containing 3 to 8 bands in the nucleosome ladder) and DNA was purified by QIAquick Gel Extraction Kit. The resulting DNA was subjected to library preparation and Illumina sequencing as described above.
Supercoiling of Mouse Genome in Vitro
Genomic DNA was isolated from a total of 4×10⁷ mouse activated B cells by RNase and proteinase K treatment in lysis buffer (10 mM Tris-Cl, pH 8.0, 100 mM EDTA, 0.5% SDS), followed by repetitive phenol:chloroform extraction and ethanol precipitation. Purified DNA was divided in 2 aliquots separately digested with ApoI or Taq1 restriction enzymes. After complete digestion and purification, fragmented DNA samples were separately ligated by T4 DNA ligase at a DNA concentration of 0.4 μg/ml. The efficiency of ligation was analyzed by 2-D agarose gel electrophoresis: circular DNA has faster mobility in the second direction in comparison to linear fragments or nicked circle when chloroquine is present in the running buffer. Linear DNA fragments were subsequently removed by Lambda Exonuclease digestion. After purification, each DNA sample was again split into the two aliquots: samples 1 and 2. Samples 1 were treated with Topoisomerase I as recommended by the supplier. Samples 2 were treated with Topoisomerase I in the presence of ethidium bromide at 8 μg/ml. This topoisomerase-ethidium bromide technique produced topoisomers of circular DNA with an average superhelical density of −0.06 ± 0.01 (Singleton and Wells, 1982). Relation between ethidium bromide concentration and superhelical densities of DNA was established in the pilot experiments with plasmid DNA (Kouzine et al., 2004). Relaxed DNA of samples 1 were pooled together as well as supercoiled DNA of samples 2.
ssDNA-Seq on the Mouse Genome Supercoiled in Vitro
Supercoiled and relaxed DNA were incubated at 37°C for 1 hr in 20 mM Tris-HCl (pH 7.6), 100 mM KCl, 1mM MgCl2 and then were treated with permanganate (6 mM) at 37°C for 70 s. The reactions were quenched by the addition of β-mercaptoethanol to 1.0 M. Permanganate treated samples were purified by phenol:chloroform extraction and precipitation in the presence of 2 M ammonium acetate with two volumes of ethanol. Samples were then processed following the ssDNA-seq protocol starting from the blocking of linear DNA fragments with cordycepin-5’-triphosphate and TdT treatment. To determine the efficiency of permanganate and nuclease treatment, biotinylation and purification, we measured the final yield of DNA for relaxed and supercoiled DNA samples. Experiments in which relaxed DNA was undetectable by NanoDrop were chosen for library construction and subsequent sequencing.
ssDNA-Seq on the Relaxed and Supercoiled Plasmids
Plasmid pFLIP – vector backbone, and pFLIP-FUSE – plasmid containing SMnB with SIDD forming potential (FUSE) from the upstream promoter area of c-Myc, have been described (Kouzine et al., 2004). pFLIP-Z plasmid was constructed by cloning SMnB with Z-DNA forming potential at the 5’-UTR of ADAM-12 from the pTZ19U+30/+190 plasmid into the HindIII and EcoRI sites of pFLIP (Ray et al., 2013). pTZ19U+30/+190 was a kind gift of Alpana Ray. pFLIP-quadruplex was constructed by cloning quadruplex susceptible SMnB (CT4 element) into the BamH1 and PstI sites of pFLIP (Tomonaga and Levens, 1996). Plasmids were relaxed by Topoisomerase I treatment, or supercoiled by the topoisomerase-ethidium bromide technique (Singleton and Wells, 1982). The average superhelical density of supercoiled fraction was −0.06 ± 0.01 as determined using agarose gel electrophoresis in the presence of chloroquine (Kouzine et al., 2004). Z-DNA formation and melting of FUSE in the vector backbone was confirmed by gel electrophoresis topological analysis and by chemical probing of ssDNA regions (Kouzine et al., 2008). We were not able to detect quadruplex formation in the pFLIP-quadruplex. Treatment with permanganate (6 mM) at 37°C for 60 s was done in 20 mM Tris-HCl (pH 7.5), 10 mM KCl for pFLIP-FUSE plasmid and in 20 mM Tris-HCl (pH 7.5), 100 mM KCl, 1mM MgCl2 for pFLIP, pFLIP-Z and pFLIP-quadruplex. The reactions were quenched by the addition of β-mercaptoethanol to 1.0 M and purified using QIAquick PCR Purification Kit. Samples (2×10⁴ plasmid per cell) were added to the mouse genomic DNA prepared from the cells treated with permanganate just before the blocking of linear DNA fragments with cordycepin-5’-triphosphate and TdT treatment. Samples were then processed following the ssDNA-Seq protocol and deep sequenced.
QUANTIFICATION AND STATISTICAL ANALYSIS
Identification of occurrences of sequence motifs of non-B DNA (SMnB) in silico
Occurrences of sequence motifs of non-B DNA (SMnB) were identified in silico in the mouse (mm9) and human (hg19) genomes. Potential Z-DNA motifs were predicted using the Z-Hunt online server with default settings (Champ et al., 2004). Quadruplex sequence motifs were predicted using QuadParser (Huppert and Balasubramanian, 2005) with at least three guanine bases required in each of four runs of guanine monomer repeat and gap size between repeats of 1 to 7 bases. Both G- and C-patterns were searched in order to identify potential G-quadruplex regions on both strands. Overlapped quadruplex motifs on the same strand were merged into a single motif. Genomic sequences susceptible to H-DNA and cruciform structures were predicted using Inverted Repeats Finder (IRF, version 3.05) (Warburton et al., 2004) with minimum alignment scores of 16, matching weight 2, mismatching penalty 6, indel penalty 20, match probability 80, indel probability 10, maximum stem length 100, and maximum loop length 8; for H-DNA the mirror repeats’ option (‘-mr’) was turned on. The repeats found by IRF were further filtered to find potential H-DNA and cruciform motifs – the motif length was limited to 80 bp, loop length to 4 bp, and percent of matching nucleotides to at least 90% for both motif types, in addition potential H-DNA motifs were required to be at least 90% - purine or 90% - pyrimidine sequences. Stress induced duplex destabilization (SIDD) sites are regions where DNA strand separation is favored at equilibrium under negative superhelical stress (Wang et al., 2004). They are defined as having minimum destabilization energy no more than 3.0 kcal/mol calculated using the SIDD prediction algorithm (Zhabinskaya and Benham, 2011) at temperature 310°K and superhelical density σ = −0.055. Finally, for all motif types, we filtered out SMnB that are longer than 100 bp (250 bp for SIDDs) from the analysis.
Processing of high throughput sequencing data
Sequencing data were preprocessed using Illumina Analysis Pipeline (image analysis and base calling) and the obtained short reads (tags) were aligned to the mouse (mm9) or human (hg19) genome using Bowtie (ver. 0.12.7), allowing up to 3 mismatches with the reference genome (Langmead et al., 2009). Only tags that have a unique genome-wide best match were kept. Redundant tags from each lane were removed to minimize potential PCR bias. The data from the mouse supercoiled genome were processed the same way, i.e. we did not separately align tags from ligated fragments of distal restriction sites of ApoI and/or TaqI. To generate the UCSC Genome Browser (http://genome.ucsc.edu) tracks, each tag was extended to 100 bp in the 3’ direction, the coverage map was built using a 10 bp bins and the data were normalized to 1 million tags per sample. Tracks were smoothed in the UCSC genome browser.
Islands
Identification of significant signal islands was performed using SICER software ver. 1.03 with the random background model and the following parameters: window size = 100 bp, gap size = 100 bp, E-value = 10,000 (Zang et al., 2009). The total number of identified islands is listed in Table S2.
Plasmids
Sequencing data containing plasmids’ data (pFLIP-FUSE, pFLIP-Z and pFLIP-Quadruplex) were preprocessed using Illumina Analysis Pipeline and the obtained short tags were aligned to the respective index build from the plasmid circularized sequence using Bowtie tools, no mismatches were allowed with respect to the plasmid sequence. To normalize the plasmid data, we normalized the sum of tags that align both to each plasmid sequence and the reference genome (mouse or human) to 1 million tags per sample.
Identification of non-B DNA structures (ssDNA+ SMnB)
We used two basic tests to identify ssDNA+ SMnB, one for local and distinct signals related to single motifs (Test 1) and one for wide signals related to clusters of motifs (Test 2). Each phase is described separately. The total number of identified ssDNA+ SMnB is presented in Table S1.
We note that short interspersed elements (SINEs) often harbor non-B-DNA sequence motifs; to avoid overwhelming the characterization of non-B elements in unique sequences with structures present in the highly abundant and repetitive SINEs, we filtered out each SMnB that has any SINE element located within a 500 bp window centered at the SMnB (Roberts et al., 2014). The structures within or immediately adjacent to SINEs and other repetitive elements will be the subject of a separate analysis.
In addition to the ssDNA signal near non-B DNA structures, the signal is also expected to accompany transcription bubble formed by RNAPII (Kouzine et al., 2013b). To untangle possible superposition of these two sources of ssDNA signal in our data, we considered separately situations where RNAPII is absent (Test 1 and 2) or present (variant Test 1A and 2A) in SMnB (within 500 bp window centered at the SMnB motif). The total number of identified non-B DNA structures (ssDNA+ SMnB) for both cases is presented in Table S1.
Test 1: Narrow signals, no RNAPII.
For each occurrence of SMnB, we counted the number of sequencing tags in two windows: the signal window of 500 bp length centered at the motif midpoint, and the local background window of 2 × 250 bp length whose two parts are located on both sides of the signal window and are adjacent to it. We computed a p-value of observed number of tags in signal window assuming the total number of tags in both windows using binomial distribution and taking into account tags’ mappability in these windows. If the mappability in the signal windows was too low (below 20%) the motif was removed from the analysis. To test whether the ssDNA signal at SMnB was higher than expected by chance we used a permutation test. However, SMnB are not uniformly distributed across a genome. To control for this, we computed the total number of unique tags in all signal and background windows across the genome. We then randomly distributed the same number of tags in these windows and computed the number of randomized tags in signal and local background windows for each SMnB and the corresponding p-values. Based on real and randomized data we computed p-value thresholds for a range of False Discovery Rate FDR values. The results showed in this paper correspond to FDR of 5% (Figure S1B).
Test 2: Wide signals, no RNAPII.
SMnB are often clustered together. Clusters of non-B DNA structures are not necessarily expected to display clear individual signals. Different structures can be formed in different subpopulations of cells and the whole region can be generally destabilized yielding a complex average profile that obscures the difference between specific non-B DNA structures and local background. Thus a variation in the detection test was needed to deal with clusters of SMnB. First, we filtered out SMnB whose potential ssDNA signal can be also related to transcription, as described above. To determine the tags’ count cut-off (as opposed to p-value in Test 1), we repeated the simulation step from the previous phase restricted to the signal windows only and counted the number of randomly distributed tags near SMnB. Based on the counts from real and random data we selected the tags’ cut-off that corresponds to FDR of 5%.
Test 1A and 2A: Extension to Tests 1 and Test 2 for motifs overlapping with RNAPII.
To identify non-B DNA structures formed near RNAPII binding sites we performed an additional test. We computed the log-ratio of ssDNA to RNAPII tags’ count in a 500 bp window centered at TSS for all protein coding genes that do not have any SMnB in that window. If the log-ratio of ssDNA to RNAPII is high enough, then the level of ssDNA in a given window cannot be simply attributed to transcription bubble formed by active RNAPII but rather it should be also attributed to alternative structure formation. Based on the distribution of the computed log-ratio values at the TSS we set a threshold, which equals two standard deviations above the mean, as a cut-off for excessive level of ssDNA signal given RNAPII signal. Then for every SMnB that overlaps with RNAPII binding site (motifs that were omitted in Test 1 and 2) we compared a log-ratio of ssDNA to RNAPII with the above-defined threshold in addition to the tests performed in Tests 1 and 2 described above.
Additional details
As we already showed in our previous article (Kouzine et al., 2013b), there is a lack of ssDNA signal/tags directly within the SIDD region. This property of ssDNA signal near SIDD sites can lead to underestimation of SIDD structural formation. To overcome this artifact, we did not include the 100 bp region centered at the SIDD midpoint in our analysis, i.e. the signal window in Tests 1 and 2 consisted of two 200 bp-windows separated by that 100 bp.
As the number of sequencing tags from different experiments from mouse B cells differed significantly, we randomly sampled these datasets to get the same number of tags as in ssDNA sample from mouse activated B-cell.
We applied the same algorithm to input DNA and RNAPII ChIP-Seq data as a control. The number of motifs identified in these cases was negligible.
When processing data from mouse supercoiled genome, we filtered out all SMnB located within 200 bp of any restriction sites of ApoI or TaqI.
The ssDNA+ SMnB (non-B DNA structures) identified by Test 1 were used to generate Figures 3A, 3D, 4 and S2A–C. Results shown in Figures 6A, 6C and S5 were produced using combined output from all tests.
Composite profiling of signal density
For the purpose of building composite profiles, SMnB were aligned along their centers for each non-B DNA type separately (strand orientation was also preserved for quadruplex motifs, as they are strand-specific) and the beginning of all short tags within a given window were reported relative to the motif center. The profile was built by summing, for all SMnB in the set of interest, the number of tags starting at each position within a window. Counts were then normalized by the size of the SMnB set, and to 1 million tags per library. Density profiles were smoothed using the normal kernel with 2 bp bandwidth.
Gene annotation and genomic regions
Gene annotations for mouse (mm9) and human (hg19) were downloaded from the ENSEMBL database (Cunningham et al., 2015), release 60. Associated gene names stored in ENSEMBL database were used to match genes with external datasets (e.g. list of oncogenes). We defined the TSS of a gene as the most 5’ position among all starts of gene transcripts. The upstream region of a gene was defined as the interval starting from −2 kb and extending up to −0.2 kb upstream of the TSS of that gene. The TSS region of a gene was defined as a window of 401 bp centered at TSS. The promoter region is a union of upstream region and TSS region, i.e. region from −2 kb upstream of TSS to +0.2 kb downstream of TSS. An intragenic region of a gene is a gene body region starting from +0.2 kb downstream of TSS to transcription termination site. An intergenic region is defined as any region of a genome that is not an upstream region, TSS region, nor intragenic region of any annotated gene.
ssDNA and RNAPII signal density at genomic regions
The density of sequencing signals within a given region (e.g. promoter or upstream region) was calculated as the number of sequencing reads mapped within that region, normalized to 1 million tags per sample.
Processing of DNase I hypersensitive sites (DHS)
DHS-Seq data in activated B-cells were retrieved from the Short Read Archive under accession numbers SRX347261 and SRX347262. The data were combined and processed as described above in the subsection “Processing of high throughput sequencing data”. DNase I hypersensitive regions were detected using SICER software ver. 1.03 with the random background model and the following parameters: window size = 200 bp, gap size = 200 bp, E-value = 100 (Zang et al., 2009); total of 108,944 regions were detected.
All 200 bp windows within detected DHS were split into two groups based on their proximity to SMnB. If a DHS window has any SMnB located within 100 bp then it is called SMnB+ DHS window, otherwise SMnB− DHS. All windows located within 200 bp of any SINE were removed from the analysis. For each SMnB+ DHS window we randomly selected SMnB− DHS window of the same DNase I sensitivity measured as short read count within that window (+/− 5%). Then we compared these two sets of DHS with respect of the total signal (total number of reads) of ssDNA, input DNA and DNase I in activated B-cells.
RNA-Seq data
Short reads generated by Illumina pipeline were aligned against mouse genome using Tophat (ver. 1.0.12) (Trapnell et al., 2009) with default settings. Resulting alignments were analyzed using Cufflinks software (ver. 0.9.3) (Trapnell et al., 2010) provided with the annotation of Ensembl 60 genes (Hubbard et al., 2009) after removing germline antigen fragments, mitochondrial rRNA genes, miRNAs and small nuclear RNAs. No de novo transcript assembly was attempted since only single-end short read libraries were available. The bimodal distribution of gene expression in activated B cells suggested the existence of two gene populations: a population of genes with low levels of expression and a population of high expressed genes, in addition to population of silent genes. For Figures 2C and D, we considered only genes whose region from 5 kb to 1 kb upstream of TSS do not overlap with any other gene annotated in ENSEMBL database to avoid any signal related to transcription of other genes. Thus, in our analysis we used 3,799 (1,119+2,680), 3,121 (793+2,328), and 2,955 (690+2,265) genes that are silent, low and high expressed, respectively; numbers in the parentheses show the number of genes without or with a predicted non-B DNA sequence motif (SMnB) in region from −2 kb to − 1 kb upstream of TSS as analyzed in Figures 2C and 2D.
Nucleosome positioning
The mapped tags from MNase-Seq data were extended by 146 bp in the 3’ direction. The extended tags’ coverage was combined to build the nucleosome profile. The profiles shown in Figure 5 represent an average coverage for different SMnB (ssDNA− or ssDNA+ SMnB). The average density of nucleosomes was computed for 100,000 randomly selected sites across the genome.
Random model for non-B DNA motif occurrences
To generate a random model for non-B DNA motif occurrences in Figure 2E, positions of SMnB were randomly sampled for each non-B DNA type separately. However, to keep their location preference we preserved their density in different types of genomic regions – promoter, upstream, intergenic, and intragenic regions. We considered only the top 5% of sites with the highest number of reads from the ssDNA-Seq assay, both for predicted and randomized sites, and computed enrichment of ssDNA signal shown in Figure 2E only for those selected sites.
Association of ssDNA read counts with SMnB in supercoiled pFLIP plasmids
To relate ssDNA-Seq signals observed in some regions of supercoiled pFLIP plasmids to non-B DNA structure formation we used scanning window statistics. We scanned a circularized plasmid with fixed window of size 200 bp that was shifted by 50 bp. We counted a number of ssDNA-Seq reads starting within a given window and we sorted the window counts. We then tested if windows proximal to the SMnB were enriched in the top scoring windows. Specifically, for each plasmid, we identified windows that are located in close proximity (+/−100 bp) to the SMnB and we checked how many of these windows were among the top scoring windows across the plasmid (9 out of 10 near SIDD in pFLIP-FUSE, 14 out of 18 near Z-DNA and SIDD in pFLIP-ZDNA, and 4 out of 17 near G4 and SIDD in pFLIP-Quadruplex). To assess a statistical significance of association between top scoring windows and the SMnB we used a randomized model in which reads were randomly distributed along a plasmid and analogous sliding window statistics were computed; the randomization was repeated 10,000 times for each plasmid that gave us a p-value estimation. We found statistically significant relationship between high ssDNA-Seq counts and SMnB in two plasmids – (1) SIDD in pFLIP-FUSE plasmid (p-value 0.0009), and (2) Z-DNA and SIDD in pFLIP-ZDNA plasmid (p-value 0.003). No association was found in pFLIP-Quadruplex.
Gene enrichment analyzes of genes with non-B DNA at promoters
We compared 2,877 protein-coding genes bearing non-B DNA structures (ssDNA+ SMnB) detected by ssDNA-Seq in their promoter regions with the rest of genes coding proteins in terms of their relation to cancer and their Gene Ontology (GO). List of 420 human cancer-related genes was obtained from the Supplementary Materials of Vogelstein et al. (Vogelstein et al., 2013). Human genes were mapped to mouse genes using the list of ‘Human and Mouse Homologs’ from the Mouse Genome Informatics (MGI) database (http://www.informatics.jax.org/). After gene name mapping, we found 374 human and mouse homologous oncogenes. Non-B DNA structures at promoter regions of AR, CSF1R, HRAS, KIT, PDGFRB, RET human cancer-related genes had previously been proposed to have regulatory function (Brooks and Hurley, 2009; Mitchell et al., 2013; Qin et al., 2010; Ray and Ray, 2015). The statistical significance of the oncogene analysis was assessed using the hypergeometric test (no p-value correction was needed). The GO enrichment analysis was performed using GOrilla tool (Eden et al., 2009) with background consisting of all protein-coding genes (22,350 genes). To give a summary of the result of GO analysis, the full list of enriched terms was limited to “Generic GO slim” term developed by GO Consortium (http://geneontology.org/). The list of enriched GO slim terms with p-value below 10−7 is presented in Table S3.
Comparison with G4-Seq data
We overlapped our results from the human cell line Raji cells with a subset of quadruplex motifs verified by the experimental protocol, G4-Seq, applied to the human genome in vitro (Chambers et al., 2015). This analysis was based on quadruplexes observed simultaneously in the K+ and the PDS experiments. The results are presented in Table S4.
DATA AND SOFTWARE AVAILABILITY
All high-throughput sequencing datasets, the ssRNA-Seq of mouse B cell and Raji cells, RNAPII ChIP-Seq and RNA-Seq of mouse B cells, ssDNA-Seq for in vitro supercoiled mouse genome, input DNA, control (ssDNA, no KMnO4), and MNase-Seq, are available from the NCBI Sequence Read Archive under ID code SRA072844.
Supplementary Material
Highlights:
Single-stranded DNA (ssDNA) is a common feature of mammalian genome
The pattern of ssDNA reactivity reveals different non-B DNA structures
Non-B DNA formation drives chromatin re-organization
Non-B DNA formation is coupled to specific transcriptome output
ACKNOWLEDGMENTS
We thank Rosy Hosking, Khadija Ben Aissa, and the Levens, Przytycka and Casellas lab members for critically reading the manuscript.
This work was supported in part by the Intramural Research Program of the National Cancer Institute (Center for Cancer Research), the National Library of Medicine of the NIH, and the Intramural Research Program of National Institute of Arthritis and Musculoskeletal and Skin Diseases (NAIMS). The work of CJB reported here was supported by grant DBI-08-50214 from the National Science Foundation.
None of the authors of this manuscript have a financial interest related to this work.
Footnotes
Publisher's Disclaimer: This is a PDF file of an unedited manuscript that has been accepted for publication. As a service to our customers we are providing this early version of the manuscript. The manuscript will undergo copyediting, typesetting, and review of the resulting proof before it is published in its final citable form. Please note that during the production process errors may be discovered which could affect the content, and all legal disclaimers that apply to the journal pertain.
REFERENCES
- Bacolla A, Tainer JA, Vasquez KM, and Cooper DN (2016). Translocation and deletion breakpoints in cancer genomes are associated with potential non-B DNA-forming sequences. Nucleic acids research 44, 5673–5688. [DOI] [PMC free article] [PubMed] [Google Scholar]
- Bacolla A, and Wells RD (2004). Non-B DNA conformations, genomic rearrangements, and human disease. The Journal of biological chemistry 279, 47411–47414. [DOI] [PubMed] [Google Scholar]
- Baranello L, Levens D, Gupta A, and Kouzine F (2012). The importance of being supercoiled: how DNA mechanics regulate dynamic processes. Biochimica et biophysica acta 1819, 632–638. [DOI] [PMC free article] [PubMed] [Google Scholar]
- Baranello L, Wojtowicz D, Cui K, Devaiah BN, Chung HJ, Chan-Salis KY, Guha R, Wilson K, Zhang X, Zhang H, et al. (2016). RNA Polymerase II Regulates Topoisomerase 1 Activity to Favor Efficient Transcription. Cell 165, 357–371. [DOI] [PMC free article] [PubMed] [Google Scholar]
- Belotserkovskii BP, De Silva E, Tornaletti S, Wang G, Vasquez KM, and Hanawalt PC (2007). A triplex-forming sequence from the human c-MYC promoter interferes with DNA transcription. The Journal of biological chemistry 282, 32433–32441. [DOI] [PubMed] [Google Scholar]
- Belotserkovskii BP, Mirkin SM, and Hanawalt PC (2013). DNA Sequences That Interfere with Transcription: Implications for Genome Function and Stability. Chem Rev 113, 8620–8637. [DOI] [PubMed] [Google Scholar]
- Biffi G, Tannahill D, McCafferty J, and Balasubramanian S (2013). Quantitative visualization of DNA G-quadruplex structures in human cells. Nature chemistry 5, 182–186. [DOI] [PMC free article] [PubMed] [Google Scholar]
- Bochman ML, Paeschke K, and Zakian VA (2012). DNA secondary structures: stability and function of G-quadruplex structures. Nature reviews Genetics 13, 770–780. [DOI] [PMC free article] [PubMed] [Google Scholar]
- Brooks TA, and Hurley LH (2009). The role of supercoiling in transcriptional control of MYC and its importance in molecular therapeutics. Nature reviews Cancer 9, 849–861. [DOI] [PubMed] [Google Scholar]
- Bui CT, Rees K, and Cotton RG (2003). Permanganate oxidation reactions of DNA: perspective in biological studies. Nucleosides, nucleotides & nucleic acids 22, 1835–1855. [DOI] [PubMed] [Google Scholar]
- Cer RZ, Bruce KH, Mudunuri US, Yi M, Volfovsky N, Luke BT, Bacolla A, Collins JR, and Stephens RM (2011). Non-B DB: a database of predicted non-B DNA-forming motifs in mammalian genomes. Nucleic acids research 39, D383–391. [DOI] [PMC free article] [PubMed] [Google Scholar]
- Chambers VS, Marsico G, Boutell JM, Di Antonio M, Smith GP, and Balasubramanian S (2015). High-throughput sequencing of DNA G-quadruplex structures in the human genome. Nature biotechnology 33, 877–881. [DOI] [PubMed] [Google Scholar]
- Champ PC, Maurice S, Vargason JM, Camp T, and Ho PS (2004). Distributions of Z-DNA and nuclear factor I in human chromosome 22: a model for coupled transcriptional regulation. Nucleic acids research 32, 6501–6510. [DOI] [PMC free article] [PubMed] [Google Scholar]
- Chen R, Subramanyam S, Elcock AH, Spies M, and Wold MS (2016). Dynamic binding of replication protein a is required for DNA repair. Nucleic acids research 44, 5758–5772. [DOI] [PMC free article] [PubMed] [Google Scholar]
- Cogoi S, Shchekotikhin AE, and Xodo LE (2014). HRAS is silenced by two neighboring G-quadruplexes and activated by MAZ, a zinc-finger transcription factor with DNA unfolding property. Nucleic acids research 42, 8379–U8147. [DOI] [PMC free article] [PubMed] [Google Scholar]
- Core LJ, Waterfall JJ, and Lis JT (2008). Nascent RNA sequencing reveals widespread pausing and divergent initiation at human promoters. Science 322, 1845–1848. [DOI] [PMC free article] [PubMed] [Google Scholar]
- Cunningham F, Amode MR, Barrell D, Beal K, Billis K, Brent S, Carvalho-Silva D, Clapham P, Coates G, Fitzgerald S, et al. (2015). Ensembl 2015. Nucleic acids research 43, D662–669. [DOI] [PMC free article] [PubMed] [Google Scholar]
- Dayn A, Malkhosyan S, and Mirkin SM (1992). Transcriptionally driven cruciform formation in vivo. Nucleic acids research 20, 5991–5997. [DOI] [PMC free article] [PubMed] [Google Scholar]
- Du X, Gertz EM, Wojtowicz D, Zhabinskaya D, Levens D, Benham CJ, Schaffer AA, and Przytycka TM (2014a). Potential non-B DNA regions in the human genome are associated with higher rates of nucleotide mutation and expression variation. Nucleic acids research 42, 12367–12379. [DOI] [PMC free article] [PubMed] [Google Scholar]
- Du XJ, Gertz EM, Wojtowicz D, Zhabinskaya D, Levens D, Benham CJ, Schaffer AA, and Przytycka TM (2014b). Potential non-B DNA regions in the human genome are associated with higher rates of nucleotide mutation and expression variation. Nucleic acids research 42, 12367–12379. [DOI] [PMC free article] [PubMed] [Google Scholar]
- Du Y, and Zhou X (2013). Targeting non-B-form DNA in living cells. Chemical record 13, 371–384. [DOI] [PubMed] [Google Scholar]
- Eden E, Navon R, Steinfeld I, Lipson D, and Yakhini Z (2009). GOrilla: a tool for discovery and visualization of enriched GO terms in ranked gene lists. BMC bioinformatics 10, 48. [DOI] [PMC free article] [PubMed] [Google Scholar]
- Edwards SF, Sirito M, Krahe R, and Sinden RR (2009). A Z-DNA sequence reduces slippedstrand structure formation in the myotonic dystrophy type 2 (CCTG) x (CAGG) repeat. Proceedings of the National Academy of Sciences of the United States of America 106, 3270–3275. [DOI] [PMC free article] [PubMed] [Google Scholar]
- Essien K, Vigneau S, Apreleva S, Singh LN, Bartolomei MS, and Hannenhalli S (2009). CTCF binding site classes exhibit distinct evolutionary, genomic, epigenomic and transcriptomic features. Genome biology 10, R131. [DOI] [PMC free article] [PubMed] [Google Scholar]
- Garner MM, and Felsenfeld G (1987). Effect of Z-DNA on nucleosome placement. Journal of molecular biology 196, 581–590. [DOI] [PubMed] [Google Scholar]
- Giardina C, Perez-Riba M, and Lis JT (1992). Promoter melting and TFIID complexes on Drosophila genes in vivo. Genes & development 6, 2190–2200. [DOI] [PubMed] [Google Scholar]
- Gogos JA, Karayiorgou M, Aburatani H, and Kafatos FC (1990). Detection of single base mismatches of thymine and cytosine residues by potassium permanganate and hydroxylamine in the presence of tetralkylammonium salts. Nucleic acids research 18, 6807–6814. [DOI] [PMC free article] [PubMed] [Google Scholar]
- Gorab E, Amabis JM, Stocker AJ, Drummond L, and Stollar BD (2009). Potential sites of triple-helical nucleic acid formation in chromosomes of Rhynchosciara (Diptera: Sciaridae) and Drosophila melanogaster. Chromosome research : an international journal on the molecular, supramolecular and evolutionary aspects of chromosome biology 17, 821–832. [DOI] [PubMed] [Google Scholar]
- Grabczyk E, and Usdin K (2000). Alleviating transcript insufficiency caused by Friedreich’s ataxia triplet repeats. Nucleic acids research 28, 4930–4937. [DOI] [PMC free article] [PubMed] [Google Scholar]
- Ha SC, Lowenhaupt K, Rich A, Kim YG, and Kim KK (2005). Crystal structure of a junction between B-DNA and Z-DNA reveals two extruded bases. Nature 437, 1183–1186. [DOI] [PubMed] [Google Scholar]
- He Y, Yan C, Fang J, Inouye C, Tjian R, Ivanov I, and Nogales E (2016). Near-atomic resolution visualization of human transcription promoter opening. Nature 533, 359–365. [DOI] [PMC free article] [PubMed] [Google Scholar]
- Hoffmann RF, Moshkin YM, Mouton S, Grzeschik NA, Kalicharan RD, Kuipers J, Wolters AH, Nishida K, Romashchenko AV, Postberg J, et al. (2016). Guanine quadruplex structures localize to heterochromatin. Nucleic acids research 44, 152–163. [DOI] [PMC free article] [PubMed] [Google Scholar]
- Holstege FCP, and Timmers HTM (1997). Analysis of open complex formation during RNA polymerase II transcription initiation using heteroduplex templates and potassium permanganate probing. Methods-a Companion to Methods in Enzymology 12, 203–211. [DOI] [PubMed] [Google Scholar]
- Hou L, Xu B, Mohankumar KM, Goffin V, Perry JK, Lobie PE, and Liu DX (2012). The prolactin receptor mediates HOXA1-stimulated oncogenicity in mammary carcinoma cells. International journal of oncology 41, 2285–2295. [DOI] [PubMed] [Google Scholar]
- Hubbard TJ, Aken BL, Ayling S, Ballester B, Beal K, Bragin E, Brent S, Chen Y, Clapham P, Clarke L, et al. (2009). Ensembl 2009. Nucleic acids research 37, D690–697. [DOI] [PMC free article] [PubMed] [Google Scholar]
- Huppert JL, and Balasubramanian S (2005). Prevalence of quadruplexes in the human genome. Nucleic acids research 33, 2908–2916. [DOI] [PMC free article] [PubMed] [Google Scholar]
- Huppert JL, and Balasubramanian S (2007). G-quadruplexes in promoters throughout the human genome. Nucleic acids research 35, 406–413. [DOI] [PMC free article] [PubMed] [Google Scholar]
- Inagaki H, Ohye T, Kogo H, Kato T, Bolor H, Taniguchi M, Shaikh TH, Emanuel BS, and Kurahashi H (2009). Chromosomal instability mediated by non-B DNA: cruciform conformation and not DNA sequence is responsible for recurrent translocation in humans. Genome Res 19, 191–198. [DOI] [PMC free article] [PubMed] [Google Scholar]
- Jaworski A, Hsieh WT, Blaho JA, Larson JE, and Wells RD (1987). Left-handed DNA in vivo. Science 238, 773–777. [DOI] [PubMed] [Google Scholar]
- Jenne A, and Famulok M (1999). Disruption of the streptavidin interaction with biotinylated nucleic acid probes by 2-mercaptoethanol. Biotechniques 26, 249–252, 254. [DOI] [PubMed] [Google Scholar]
- Jiang H, Zacharias W, and Amirhaeri S (1991). Potassium-Permanganate as an Insitu Probe for B-Z-Junction and Z-Z-Junction. Nucleic acids research 19, 6943–6948. [DOI] [PMC free article] [PubMed] [Google Scholar]
- Johnston BH, and Rich A (1985). Chemical Probes of DNA Conformation - Detection of Z-DNA at Nucleotide Resolution. Cell 42, 713–724. [DOI] [PubMed] [Google Scholar]
- Jude KM, Hartland A, and Berger JM (2013). Real-time detection of DNA topological changes with a fluorescently labeled cruciform. Nucleic acids research 41, e133. [DOI] [PMC free article] [PubMed] [Google Scholar]
- Kang HJ, Le TV, Kim K, Hur J, Kim KK, and Park HJ (2014). Novel interaction of the Z-DNA binding domain of human ADAR1 with the oncogenic c-Myc promoter G-quadruplex. Journal of molecular biology 426, 2594–2604. [DOI] [PubMed] [Google Scholar]
- Kato M, Hokabe S, Itakura S, Minoshima S, Lyubchenko YL, Gurkov TD, Okawara H, Nagayama K, and Shimizu N (2003). Interarm interaction of DNA cruciform forming at a short inverted repeat sequence. Biophys J 85, 402–408. [DOI] [PMC free article] [PubMed] [Google Scholar]
- Kendrick S, Kang HJ, Alam MP, Madathil MM, Agrawal P, Gokhale V, Yang DZ, Hecht SM, and Hurley LH (2014). The Dynamic Character of the BCL2 Promoter i-Motif Provides a Mechanism for Modulation of Gene Expression by Compounds That Bind Selectively to the Alternative DNA Hairpin Structure. J Am Chem Soc 136, 4161–4171. [DOI] [PMC free article] [PubMed] [Google Scholar]
- Kikin O, D’Antonio L, and Bagga PS (2006). QGRS Mapper: a web-based server for predicting G-quadruplexes in nucleotide sequences. Nucleic acids research 34, W676–682. [DOI] [PMC free article] [PubMed] [Google Scholar]
- Kouzine F, Gupta A, Baranello L, Wojtowicz D, Ben-Aissa K, Liu J, Przytycka TM, and Levens D (2013a). Transcription-dependent dynamic supercoiling is a short-range genomic force. Nature structural & molecular biology 20, 396–403. [DOI] [PMC free article] [PubMed] [Google Scholar]
- Kouzine F, and Levens D (2007). Supercoil-driven DNA structures regulate genetic transactions. Frontiers in bioscience : a journal and virtual library 12, 4409–4423. [DOI] [PubMed] [Google Scholar]
- Kouzine F, Levens D, and Baranello L (2014). DNA topology and transcription. Nucleus 5, 195–202. [DOI] [PMC free article] [PubMed] [Google Scholar]
- Kouzine F, Liu J, Sanford S, Chung HJ, and Levens D (2004). The dynamic response of upstream DNA to transcription-generated torsional stress. Nature structural & molecular biology 11, 1092–1100. [DOI] [PubMed] [Google Scholar]
- Kouzine F, Sanford S, Elisha-Feil Z, and Levens D (2008). The functional response of upstream DNA to dynamic supercoiling in vivo. Nature structural & molecular biology 15, 146–154. [DOI] [PubMed] [Google Scholar]
- Kouzine F, Wojtowicz D, Yamane A, Resch W, Kieffer-Kwon KR, Bandle R, Nelson S, Nakahashi H, Awasthi P, Feigenbaum L, et al. (2013b). Global regulation of promoter melting in naive lymphocytes. Cell 153, 988–999. [DOI] [PMC free article] [PubMed] [Google Scholar]
- Kovtun IV, Liu Y, Bjoras M, Klungland A, Wilson SH, and McMurray CT (2007). OGG1 initiates age-dependent CAG trinucleotide expansion in somatic cells. Nature 447, 447–452. [DOI] [PMC free article] [PubMed] [Google Scholar]
- Krasilnikov AS, Podtelezhnikov A, Vologodskii A, and Mirkin SM (1999). Large-scale effects of transcriptional DNA supercoiling in vivo. Journal of molecular biology 292, 1149–1160. [DOI] [PubMed] [Google Scholar]
- Krumm A, Meulia T, Brunvand M, and Groudine M (1992). The Block to Transcriptional Elongation within the Human C-Myc Gene Is Determined in the Promoter - Proximal Region. Genes & development 6, 2201–2213. [DOI] [PubMed] [Google Scholar]
- Lam EY, Beraldi D, Tannahill D, and Balasubramanian S (2013). G-quadruplex structures are stable and detectable in human genomic DNA. Nature communications 4, 1796. [DOI] [PMC free article] [PubMed] [Google Scholar]
- Langmead B, Trapnell C, Pop M, and Salzberg SL (2009). Ultrafast and memory-efficient alignment of short DNA sequences to the human genome. Genome biology 10, R25. [DOI] [PMC free article] [PubMed] [Google Scholar]
- Lemmens B, van Schendel R, and Tijsterman M (2015). Mutagenic consequences of a single G-quadruplex demonstrate mitotic inheritance of DNA replication fork barriers. Nature communications 6, 8909. [DOI] [PMC free article] [PubMed] [Google Scholar]
- Li H, Xiao J, Li J, Lu L, Feng S, and Droge P (2009). Human genomic Z-DNA segments probed by the Z alpha domain of ADAR1. Nucleic acids research 37, 2737–2746. [DOI] [PMC free article] [PubMed] [Google Scholar]
- Liu H, Mulholland N, Fu H, and Zhao K (2006a). Cooperative activity of BRG1 and Z-DNA formation in chromatin remodeling. Molecular and cellular biology 26, 2550–2559. [DOI] [PMC free article] [PubMed] [Google Scholar]
- Liu J, Kouzine F, Nie Z, Chung HJ, Elisha-Feil Z, Weber A, Zhao K, and Levens D (2006b). The FUSE/FBP/FIR/TFIIH system is a molecular machine programming a pulse of c-myc expression. The EMBO journal 25, 2119–2130. [DOI] [PMC free article] [PubMed] [Google Scholar]
- Lopes J, Piazza A, Bermejo R, Kriegsman B, Colosio A, Teulade-Fichou MP, Foiani M, and Nicolas A (2011). G-quadruplex-induced instability during leading-strand replication. The EMBO journal 30, 4033–4046. [DOI] [PMC free article] [PubMed] [Google Scholar]
- Ma J, Bai L, and Wang MD (2013). Transcription under torsion. Science 340, 1580–1583. [DOI] [PMC free article] [PubMed] [Google Scholar]
- Michelotti GA, Michelotti EF, Pullner A, Duncan RC, Eick D, and Levens D (1996). Multiple single-stranded cis elements are associated with activated chromatin of the human c-myc gene in vivo. Molecular and cellular biology 16, 2656–2669. [DOI] [PMC free article] [PubMed] [Google Scholar]
- Mitchell T, Ramos-Montoya A, Di Antonio M, Murat P, Ohnmacht S, Micco M, Jurmeister S, Fryer L, Balasubramanian S, Neidle S, et al. (2013). Downregulation of Androgen Receptor Transcription by Promoter G-Quadruplex Stabilization as a Potential Alternative Treatment for Castrate-Resistant Prostate Cancer. Biochemistry-Us 52, 1429–1436. [DOI] [PubMed] [Google Scholar]
- Mulholland N, Xu Y, Sugiyama H, and Zhao K (2012). SWI/SNF-mediated chromatin remodeling induces Z-DNA formation on a nucleosome. Cell & bioscience 2, 3. [DOI] [PMC free article] [PubMed] [Google Scholar]
- Murat P, and Balasubramanian S (2014). Existence and consequences of G-quadruplex structures in DNA. Current opinion in genetics & development 25, 22–29. [DOI] [PubMed] [Google Scholar]
- Naughton C, Avlonitis N, Corless S, Prendergast JG, Mati IK, Eijk PP, Cockroft SL, Bradley M, Ylstra B, and Gilbert N (2013). Transcription forms and remodels supercoiling domains unfolding large-scale chromatin structures. Nature structural & molecular biology 20, 387–395. [DOI] [PMC free article] [PubMed] [Google Scholar]
- Nawy T (2015). Genomics. where the G-quadruplexes are. Nature methods 12, 806–807. [DOI] [PubMed] [Google Scholar]
- Panayotatos N, and Fontaine A (1987). A native cruciform DNA structure probed in bacteria by recombinant T7 endonuclease. The Journal of biological chemistry 262, 11364–11368. [PubMed] [Google Scholar]
- Qin Y, Fortin JS, Tye D, Gleason-Guzman M, Brooks TA, and Hurley LH (2010). Molecular Cloning of the Human Platelet-Derived Growth Factor Receptor beta (PDGFR-beta) Promoter and Drug Targeting of the G-Quadruplex-Forming Region To Repress PDGFR-beta Expression. Biochemistry-Us 49, 4208–4219. [DOI] [PMC free article] [PubMed] [Google Scholar]
- Ray A, and Ray BK (2015). Induction of Ras by SAF-1/MAZ through a feed-forward loop promotes angiogenesis in breast cancer. Cancer Med-Us 4, 224–234. [DOI] [PMC free article] [PubMed] [Google Scholar]
- Ray BK, Dhar S, Henry C, Rich A, and Ray A (2013). Epigenetic regulation by Z-DNA silencer function controls cancer-associated ADAM-12 expression in breast cancer: cross-talk between MeCP2 and NF1 transcription factor family. Cancer research 73, 736–744. [DOI] [PubMed] [Google Scholar]
- Roberts JT, Cardin SE, and Borchert GM (2014). Burgeoning evidence indicates that microRNAs were initially formed from transposable element sequences. Mobile genetic elements 4, e29255. [DOI] [PMC free article] [PubMed] [Google Scholar]
- Ruan H, and Wang YH (2008). Friedreich’s ataxia GAA.TTC duplex and GAA.GAA.TTC triplex structures exclude nucleosome assembly. Journal of molecular biology 383, 292–300. [DOI] [PubMed] [Google Scholar]
- Sadeh R, and Allis CD (2011). Genome-wide “re”-modeling of nucleosome positions. Cell 147, 263–266. [DOI] [PMC free article] [PubMed] [Google Scholar]
- Sawai M, Takase K, Teraoka H, and Tsukada K (1990). Reversible G1 arrest in the cell cycle of human lymphoid cell lines by dimethyl sulfoxide. Exp Cell Res 187, 4–10. [DOI] [PubMed] [Google Scholar]
- Schones DE, Cui KR, Cuddapah S, Roh TY, Barski A, Wang ZB, Wei G, and Zhao KJ (2008). Dynamic regulation of nucleosome positioning in the human genome. Cell 132, 887–898. [DOI] [PMC free article] [PubMed] [Google Scholar]
- Seila AC, Calabrese JM, Levine SS, Yeo GW, Rahl PB, Flynn RA, Young RA, and Sharp PA (2008). Divergent transcription from active promoters. Science 322, 1849–1851. [DOI] [PMC free article] [PubMed] [Google Scholar]
- Shen FH, Jin J, Li J, Wang Y, Zhu SH, Lu YJ, Ou TM, Huang ZS, Huang M, and Huang ZY (2013). The G-quadruplex ligand, SYUIQ-FM05, targets proto-oncogene c-kit transcription and induces apoptosis in K562 cells. Pharmaceutical biology 51, 447–454. [DOI] [PubMed] [Google Scholar]
- Shin YJ, Kumarasamy V, Camacho D, and Sun D (2015). Involvement of G-quadruplex structures in regulation of human RET gene expression by small molecules in human medullary thyroid carcinoma TT cells. Oncogene 34, 1292–1299. [DOI] [PubMed] [Google Scholar]
- Sinden RR (1994). DNA structure and function (San Diego: Academic Press; ). [Google Scholar]
- Sinden RR, Broyles SS, and Pettijohn DE (1983). Perfect Palindromic Lac Operator DNA-Sequence Exists as a Stable Cruciform Structure in Supercoiled DNA Invitro but Not Invivo. P Natl Acad Sci-Biol 80, 1797–1801. [DOI] [PMC free article] [PubMed] [Google Scholar]
- Sinden RR, Carlson JO, and Pettijohn DE (1980). Torsional tension in the DNA double helix measured with trimethylpsoralen in living E. coli cells: analogous measurements in insect and human cells. Cell 21, 773–783. [DOI] [PubMed] [Google Scholar]
- Singleton CK, and Wells RD (1982). The facile generation of covalently closed, circular DNAs with defined negative superhelical densities. Analytical biochemistry 122, 253–257. [DOI] [PubMed] [Google Scholar]
- Strober W (2015). Trypan Blue Exclusion Test of Cell Viability. Curr Protoc Immunol 111, A3 B 1–3. [DOI] [PMC free article] [PubMed] [Google Scholar]
- Struhl K, and Segal E (2013). Determinants of nucleosome positioning. Nature structural & molecular biology 20, 267–273. [DOI] [PMC free article] [PubMed] [Google Scholar]
- Teves SS, and Henikoff S (2014a). DNA torsion as a feedback mediator of transcription and chromatin dynamics. Nucleus 5, 211–218. [DOI] [PMC free article] [PubMed] [Google Scholar]
- Teves SS, and Henikoff S (2014b). Transcription-generated torsional stress destabilizes nucleosomes. Nature structural & molecular biology 21, 88–94. [DOI] [PMC free article] [PubMed] [Google Scholar]
- Tomonaga T, and Levens D (1996). Activating transcription from single stranded DNA. Proceedings of the National Academy of Sciences of the United States of America 93, 5830–5835. [DOI] [PMC free article] [PubMed] [Google Scholar]
- Tomonaga T, Michelotti GA, Libutti D, Uy A, Sauer B, and Levens D (1998). Unrestraining genetic processes with a protein-DNA hinge. Molecular cell 1, 759–764. [DOI] [PubMed] [Google Scholar]
- Trapnell C, Pachter L, and Salzberg SL (2009). TopHat: discovering splice junctions with RNA-Seq. Bioinformatics 25, 1105–1111. [DOI] [PMC free article] [PubMed] [Google Scholar]
- Trapnell C, Williams BA, Pertea G, Mortazavi A, Kwan G, van Baren MJ, Salzberg SL, Wold BJ, and Pachter L (2010). Transcript assembly and quantification by RNA-Seq reveals unannotated transcripts and isoform switching during cell differentiation. Nature biotechnology 28, 511–515. [DOI] [PMC free article] [PubMed] [Google Scholar]
- van Holde K, and Zlatanova J (1994). Unusual DNA structures, chromatin and transcription. BioEssays : news and reviews in molecular, cellular and developmental biology 16, 59–68. [DOI] [PubMed] [Google Scholar]
- Vogelstein B, Papadopoulos N, Velculescu VE, Zhou S, Diaz LA Jr., and Kinzler KW (2013). Cancer genome landscapes. Science 339, 1546–1558. [DOI] [PMC free article] [PubMed] [Google Scholar]
- Wang G, Carbajal S, Vijg J, DiGiovanni J, and Vasquez KM (2008). DNA structure-induced genomic instability in vivo. J Natl Cancer Inst 100, 1815–1817. [DOI] [PMC free article] [PubMed] [Google Scholar]
- Wang G, Gaddis S, and Vasquez KM (2013). Methods to detect replication-dependent and replication-independent DNA structure-induced genetic instability. Methods 64, 67–72. [DOI] [PMC free article] [PubMed] [Google Scholar]
- Wang H, Noordewier M, and Benham CJ (2004). Stress-induced DNA duplex destabilization (SIDD) in the E. coli genome: SIDD sites are closely associated with promoters. Genome Res 14, 1575–1584. [DOI] [PMC free article] [PubMed] [Google Scholar]
- Wang JM, Huang FC, Kuo MHJ, Wang ZF, Tseng TY, Chang LC, Yen SJ, Chang TC, and Lin JJ (2014). Inhibition of Cancer Cell Migration and Invasion through Suppressing the Wnt1-mediating Signal Pathway by G-quadruplex Structure Stabilizers. Journal of Biological Chemistry 289, 14612–14623. [DOI] [PMC free article] [PubMed] [Google Scholar]
- Warburton PE, Giordano J, Cheung F, Gelfand Y, and Benson G (2004). Inverted repeat structure of the human genome: The X-chromosome contains a preponderance of large, highly homologous inverted repeats that contain testes genes. Genome Res 14, 1861–1869. [DOI] [PMC free article] [PubMed] [Google Scholar]
- Wittig B, Wolfl S, Dorbic T, Vahrson W, and Rich A (1992). Transcription of Human C-Myc in Permeabilized Nuclei Is Associated with Formation of Z-DNA in 3 Discrete Regions of the Gene. Embo Journal 11, 4653–4663. [DOI] [PMC free article] [PubMed] [Google Scholar]
- Wong B, Chen S, Kwon JA, and Rich A (2007). Characterization of Z-DNA as a nucleosome-boundary element in yeast Saccharomyces cerevisiae. Proceedings of the National Academy of Sciences of the United States of America 104, 2229–2234. [DOI] [PMC free article] [PubMed] [Google Scholar]
- Yu H, and Droge P (2014). Replication-induced supercoiling: a neglected DNA transaction regulator? Trends Biochem Sci 39, 219–220. [DOI] [PubMed] [Google Scholar]
- Zang CZ, Schones DE, Zeng C, Cui KR, Zhao KJ, and Peng WQ (2009). A clustering approach for identification of enriched domains from histone modification ChIP-Seq data. Bioinformatics 25, 1952–1958. [DOI] [PMC free article] [PubMed] [Google Scholar]
- Zhabinskaya D, and Benham CJ (2011). Theoretical analysis of the stress induced B-Z transition in superhelical DNA. PLoS computational biology 7, e1001051. [DOI] [PMC free article] [PubMed] [Google Scholar]
- Zhabinskaya D, and Benham CJ (2013). Competitive superhelical transitions involving cruciform extrusion. Nucleic acids research 41, 9610–9621. [DOI] [PMC free article] [PubMed] [Google Scholar]
- Zhabinskaya D, Madden S, and Benham CJ (2015). SIST: stress-induced structural transitions in superhelical DNA. Bioinformatics 31, 421–422. [DOI] [PubMed] [Google Scholar]
- Zhao J, Bacolla A, Wang G, and Vasquez KM (2010). Non-B DNA structure-induced genetic instability and evolution. Cell Mol Life Sci 67, 43–62. [DOI] [PMC free article] [PubMed] [Google Scholar]
- Ziebarth JD, Bhattacharya A, and Cui Y (2013). CTCFBSDB 2.0: a database for CTCF-binding sites and genome organization. Nucleic acids research 41, D188–D194. [DOI] [PMC free article] [PubMed] [Google Scholar]
Associated Data
This section collects any data citations, data availability statements, or supplementary materials included in this article.
Supplementary Materials
Data Availability Statement
All high-throughput sequencing datasets, the ssRNA-Seq of mouse B cell and Raji cells, RNAPII ChIP-Seq and RNA-Seq of mouse B cells, ssDNA-Seq for in vitro supercoiled mouse genome, input DNA, control (ssDNA, no KMnO4), and MNase-Seq, are available from the NCBI Sequence Read Archive under ID code SRA072844.