Cortical organoids are self-organizing three-dimensional cultures that model features of developing human cerebral cortex1,2. However, the fidelity of organoid models remains unclear3-5. Here, we perform single cell transcriptomics of primary human cortex spanning developmental periods and cortical areas. We find that cortical development is characterized by progenitor maturation trajectories, the emergence of diverse cell subtypes, and areal specification of newborn neurons. In contrast, organoids contain broad cell classes, but fail to recapitulate distinct cellular subtype identities and appropriate progenitor maturation. Although molecular signatures of cortical areas emerge in organoid neurons, they are not spatially segregated. Organoids also ectopically activate cellular stress pathways, which impairs cell type specification. However, organoid stress and subtype defects are alleviated by transplantation into mouse cortex. Together, these datasets and analytical tools provide a framework for evaluating and improving the accuracy of cortical organoids as models of human brain development.
Organoid models harness natural properties of self-assembly to produce three-dimensional cultures from stem cells that recapitulate aspects of an endogenous organ’s structure and function. Organoids have applications in disease modeling, drug screening, and regenerative medicine. Single-cell RNA sequencing (scRNA-seq) provides a powerful method for comparing the fidelity of organoid cell types to their primary cell counterparts across tissues. In the liver and kidney, benchmarking studies to normally developing organs indicates that three-dimensional culture better recapitulates primary cell types than adherent culture6,7. However, the lack of a comprehensive catalog of cell types and their molecular features during normal human brain development has prevented careful evaluation of the strengths and weaknesses of cerebral organoids.
In vitro models of human cortical development are particularly valuable because early events during neurogenesis and synaptogenesis may underlie neuropsychiatric disorders, and experimental access to developing cortex is otherwise limited. Initial studies indicate that broad classes of cells are preserved in cortical organoid models3,8 but also hint at distinctions between organoids and primary cells4,9,10. In particular, the extent to which spatial and temporal gradients of gene expression and cell type maturation are recapitulated in organoids is unclear (Extended Data Fig. 1). Although some of the first organoid models suggested the emergence of spatial gradients1,2,11, we know little about the fidelity and organization of areal cell types in organoids, in part because we lack molecular cell signatures across cortical areas in developing brain.
Comparison of Human Cortex and Organoids
In order to evaluate the fidelity of cortical cell types in organoids we performed high-throughput scRNAseq of developing human cortical samples and cortical organoids, and compared the results to published organoid single-cell sequencing datasets. To characterize molecular features and gene expression signatures during human cortical development, we performed scRNAseq of dissociated cells from five individuals ranging from 6-22 gestational weeks (GW), encompassing the period of neurogenesis. To assess cell-type differences across cortical areas, primary samples were collected from seven regions, including prefrontal (PFC), motor, parietal, somatosensory and V1 cortices as well as hippocampus, resulting in transcriptomic data from 189,409 cells (Methods, Fig. 1A, Supplementary Table 1). This primary data was compared to data from 235,121 single-cells generated from 37 organoids (Fig. 1B). We generated forebrain organoids with three previously published protocols utilizing different levels of directed differentiation to evaluate whether increased stringency in patterning signals results in more endogenous-like cellular subtypes1,4,8,12 (Extended Data Fig. 2). To assess biological replicability, we utilized three induced pluripotent stem cell (PSC) lines and one embryonic stem cell line. Organoids were maintained under the same conditions, except for protocol-specific media formulations (Extended Data Fig. 2), and were harvested for immunohistochemistry and scRNAseq after three, five, eight, ten, fifteen and twenty-four weeks of differentiation to evaluate relevant cell types (Extended Data Figs. 3-4). Last, we compared our reference dataset to published organoid single-cell data generated from 276,054 cells across eight protocols, including time points from six months to a year3-5,8,9,13-15. This enabled us to extend our comparisons throughout later stages of differentiation (Extended Data Figs. 5-6).
Figure 1. Cell types in Cortical Primary and Organoid Samples.
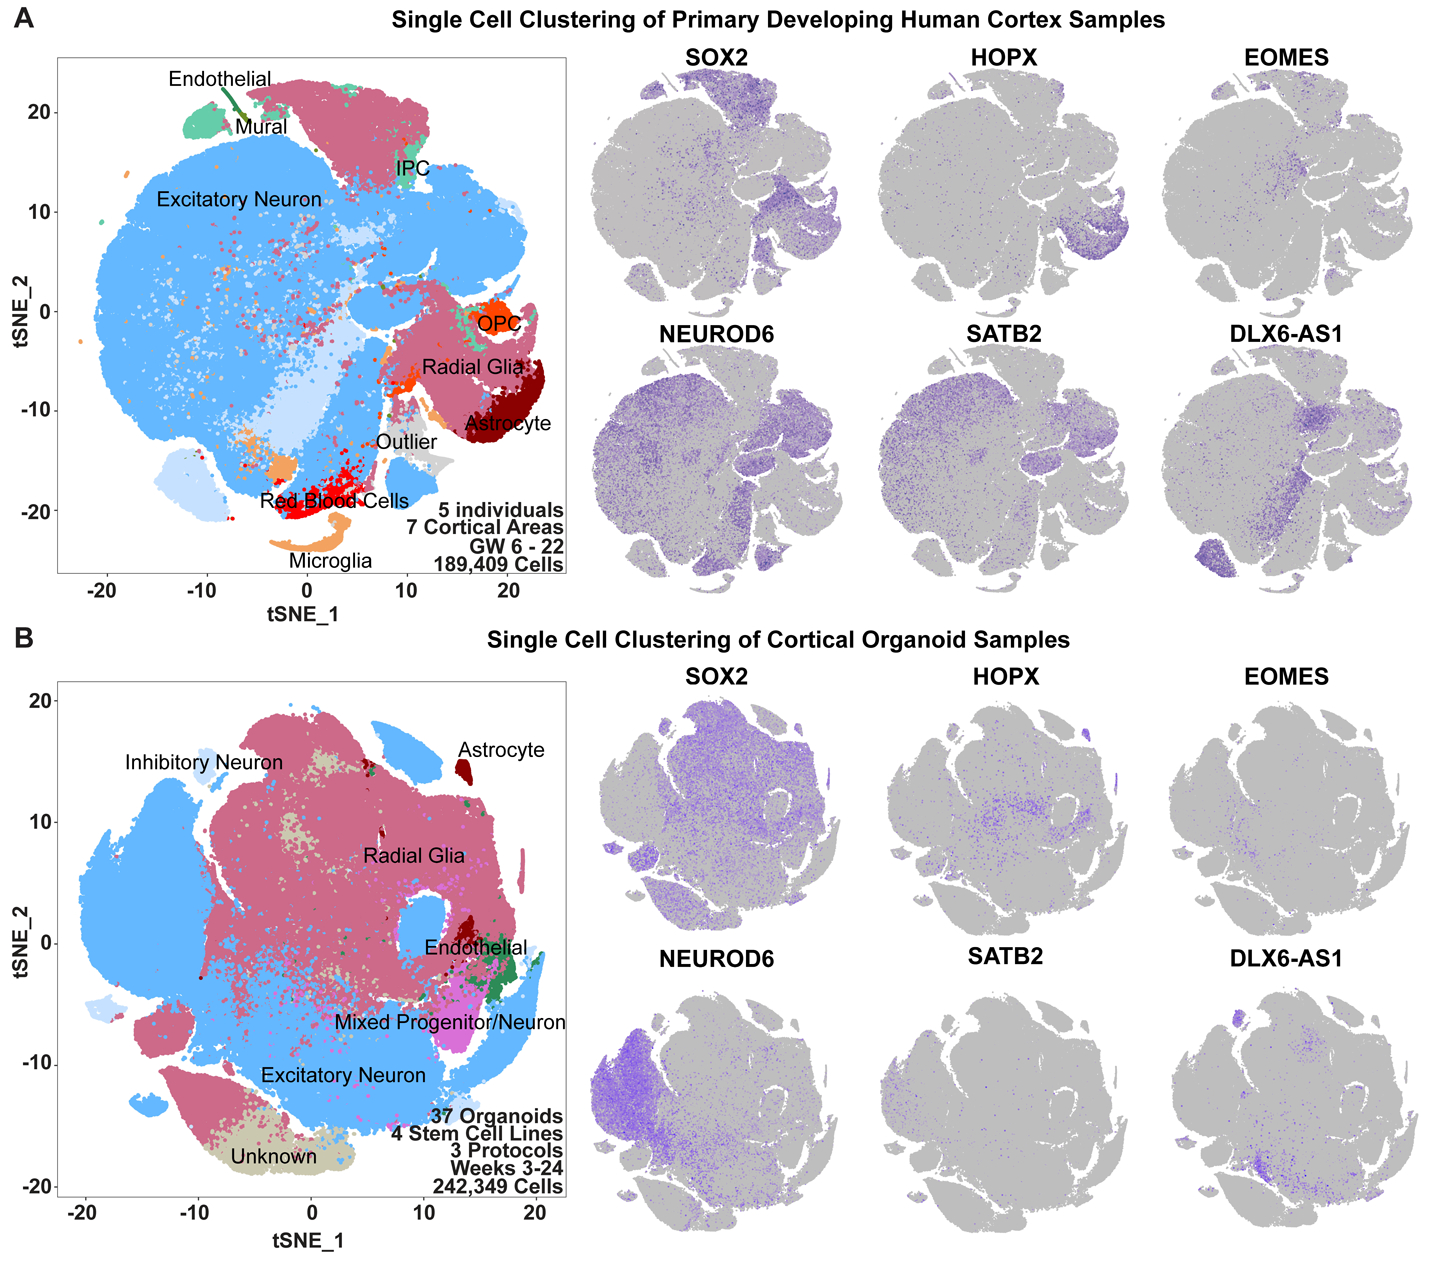
a) Single-cell sequencing of primary cortical cells identifies a number of cell types. These cell types are labeled in the tSNE plot on the left, and markers of cell type identity depict progenitors (SOX2), outer radial glia (HOPX), intermediate progenitor cells (EOMES), newborn neurons (NEUROD6), maturing neurons (SATB2) and inhibitory interneurons (DLX6-AS1). Single cell data can be explored at: https://organoidreportcard.cells.ucsc.edu. b) Single-cell sequencing of cortical organoid cells generated from four different pluripotent stem cell lines and three protocols with varied levels of directed differentiation generates similar cell types to primary cortex, however the population proportions differ. The proportion of cells for each marker in each sample type are: SOX2+ (primary 15.4%, organoid 41.2%), HOPX+ (primary 7.6%, organoid 4.2%), EOMES+ (primary 4.1%, organoid 1.5%), NEUROD6+ (primary 51.9%, organoid 20.3%), SATB2+ (primary 32.5%, organoid 2.0%), DLX6-AS1+ (primary 17.1%, organoid 3.5%).
Impaired Cell Type Fidelity in Organoids
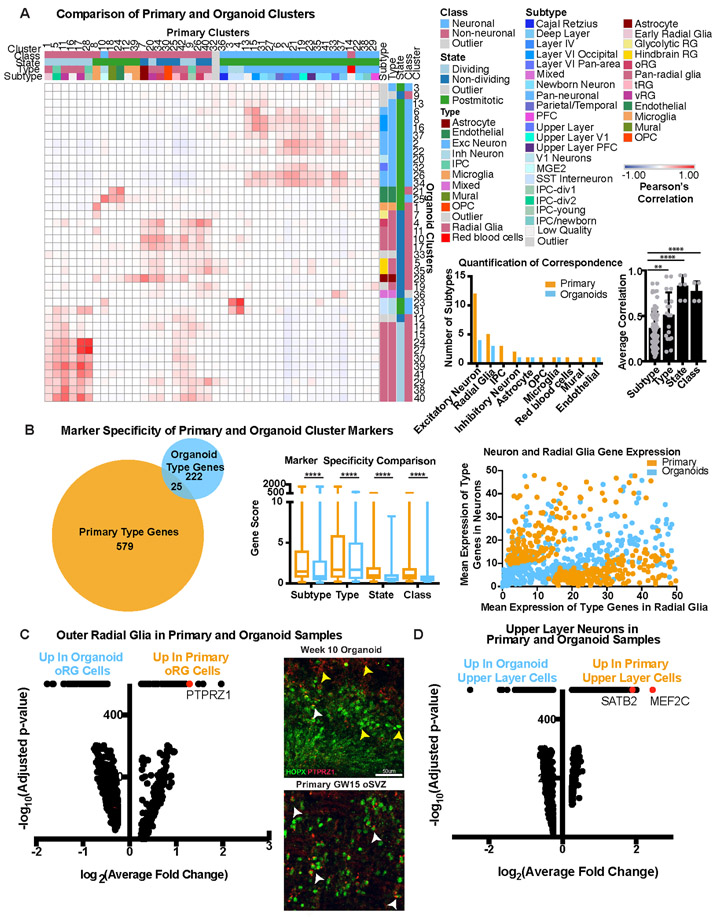
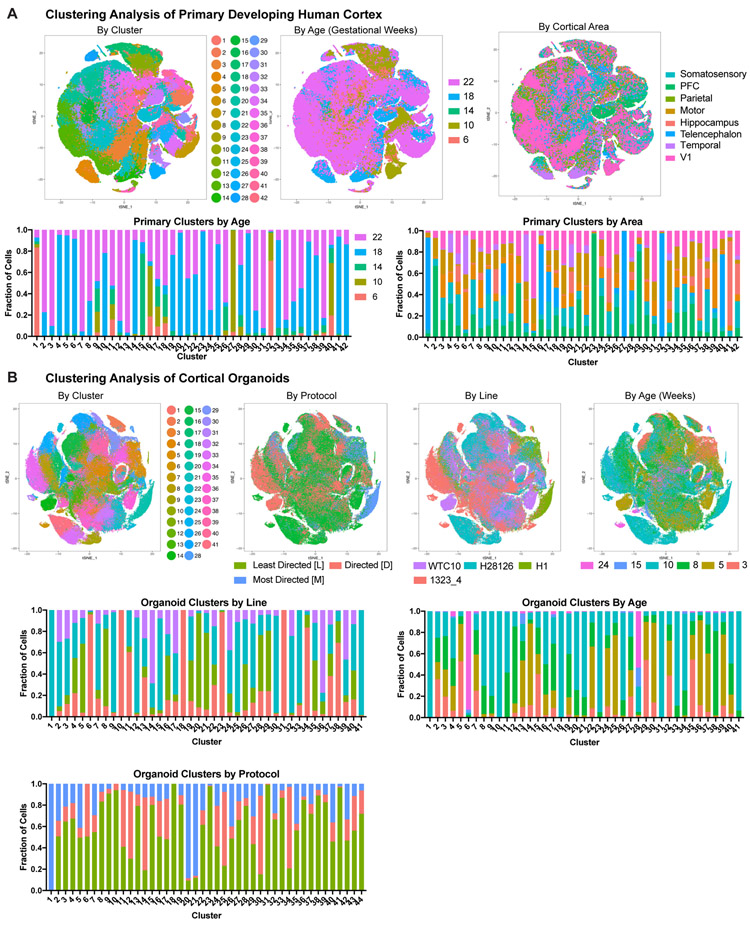
We identified broad cell types that corresponded to radial glia, intermediate progenitors (IPCs), maturing neurons, and interneurons in both datasets (Fig. 1, Supplementary Table 2-3). In the primary data we also found clusters of microglia, oligodendrocyte precursors, mural and endothelial cells. Additionally, we identified previously described radial glia subtypes, as well as a few instances of area and layer specific excitatory neuron subtypes. In the primary samples, there was extensive intermixing within clusters of ages and cortical areas (Extended Data Fig. 4A). Within our organoids, cell lines, protocols, and ages also intermixed, with variation primarily resulting from differences between cell types. Across lines and protocols the forebrain marker FOXG1 was broadly expressed (Extended Data Fig. 5B, Extended Data Fig. 7A), and the cell type composition was similar across organoids of the same ages, even between lines and protocols, validating differentiation towards forebrain identity. Organoids had 45% fewer cells expressing HOPX, a marker of outer radial glia (oRG), than primary samples, and, 63% fewer EOMES positive IPCs, as previously noted3,16. We also found a 94% reduction in the number of SATB2 positive upper layer neurons in organoids compared to primary samples (Fig. 1B, Extended Data Fig. 3).
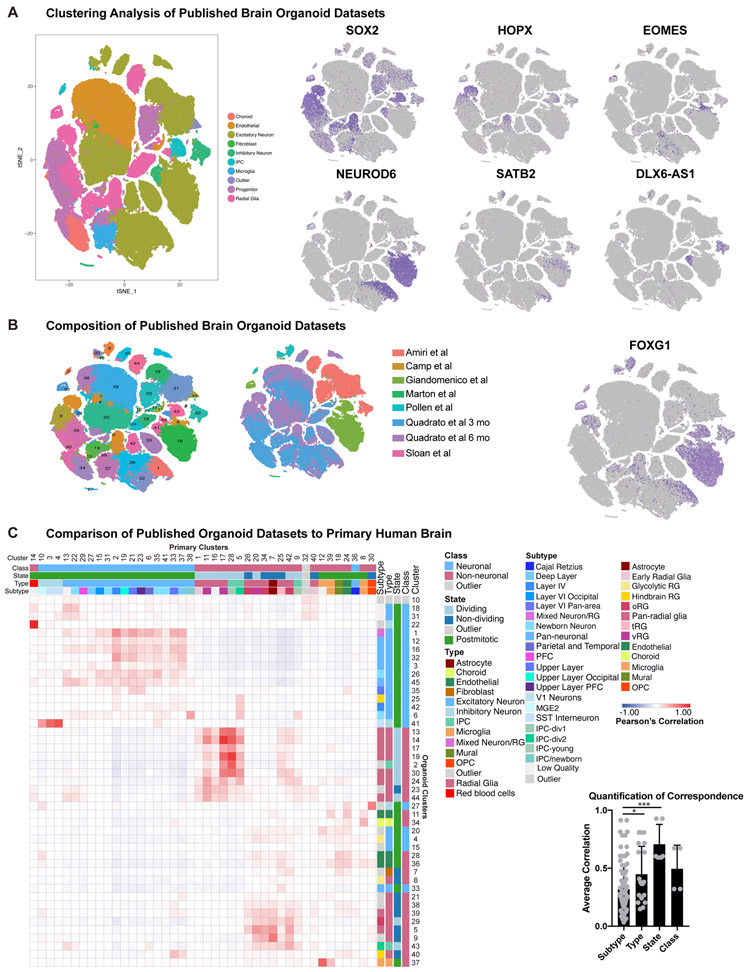
To quantitatively compare primary and organoid cell types, we performed correlation analysis of marker genes (Methods) based upon our clusters in each dataset. We categorized each cluster in terms of its class (neuronal or non-neuronal), cell cycle state (dividing or postmitotic), type (radial glia, excitatory neuron, etc.), and subtype (eg. oRG, layer IV excitatory neuron, etc.), and quantified the correlation between organoid and primary cell categories. Neural class and proliferative state were largely preserved, as has been previously reported3,4,8,13. However, cell types and subtypes were significantly less well correlated to all organoid-derived cells regardless of protocol (Fig. 2A). Our correlative analysis across all published organoid datasets suggested that a number of radial glia or neuronal clusters corresponded equally well to multiple primary cell subtypes and thus were designated as “pan-radial glia” or “pan-neuronal”. Lack of subtype resolution resulted in a smaller number of high-quality subtypes in organoids compared to primary samples (Methods) (Fig. 2A). We validated our observation of limited subtype specificity between datasets using five additional batch correction methods and observed little overlap of organoid and primary clusters (Extended Data Fig. 8, Supplementary Table 5).
Figure 2. Molecular Comparisons of Cell Subtypes Between Primary and Organoid Samples.
a) Each cluster was classified by marker genes for class, state, type and subtype (primary: n=5 individuals across independent experiments; organoids: n=37 organoids from 4 PSC lines across 4 independent experiments). Correlation between pairwise combinations of marker genes in heatmap (red intensity: Pearson’s correlation from −1 to 1). First histogram indicates cell subtypes in primary (orange) and organoid (blue) samples. Second histogram shows quantitative correlation from the best match for each category averaged across clusters (mean plus standard deviation; subtype vs type: **p= 0.0073, subtype vs state: ****p=0.00008, subtype vs class: ****p= 0.003, Welch’s two-sided t-test). b) Using VariancePartition, the genes defining metadata properties were evaluated for contribution to overall variance. Genes contributing >25% variance by cell type were used in Venn diagram. Box and whisker (mean plus standard deviation) depicts level of specificity at class (****p=4.4e−14), state (****p=4.7e−18), type (****p= 1.02e−20) and subtype level (****p= 5.34e−38). For all comparisons Welch’s two-sided t-test was used (primary: n=5; organoids: n=37). The dot plot depicts discriminating genes between radial glia and neuron identity in primary samples. Each dot is a gene, shown as the average radial glia [x-axis] and neuron [y-axis] expression in primary (orange) or organoid (blue) cells. c) Differential expression (two-tailed Wilcoxon rank sum test) between clusters annotated as oRG cells in primary and organoid datasets generated log2(fold change) [x-axis] and −log10(adjusted p-value measurements) [y-axis] (primary: n=5; organoids: n=37). A pseudocount of 500 was assigned to comparisons with an adjusted p-value of 0. Many measurements were significant, including oRG identity gene, PTPRZ1. Week 8 organoids had minimal co-expression of PTPRZ1 and HOPX (top), while GW15 oSVZ contains extensive co-localization (repeated independently 3x). White arrows: double positive cells; yellow: single positive. Scale bar = 50 uM d) Differential expression (two-tailed Wilcoxon test) between cell clusters annotated as upper layer neurons.
Organoid Radial Glia Lack Specificity
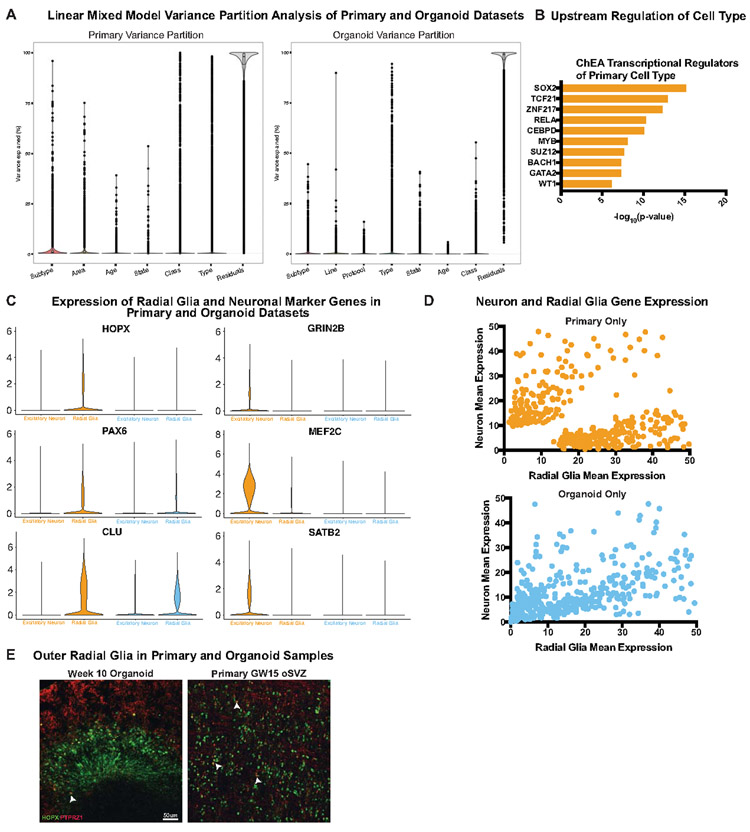
The differentiation program that generates neurons from radial glia is highly conserved17-20, and we sought to identify genes that strongly discriminate progenitors from neurons. We were surprised to find that primary cell types are defined by more than twice the genes as organoid cells, and that type defining genes largely did not overlap between datasets (Fig. 2B, Extended Data Fig. 9, Supplementary Table 6). We utilized a gene score metric that quantifies the degree of enrichment and specificity for each marker gene in a dataset (Methods), which is initially low in primary cells but increases substantially over development (Extended Data Fig. 7E). In all cases, organoids exhibited a significantly lower gene score that did not resolve over time (Extended Data Fig. 7E), suggesting that markers of progenitors and differentiated cells might be co-expressed (Fig. 2B). We plotted the normalized counts for each gene that discriminated neurons from radial glia in primary samples, finding that neurons had low expression of radial glia markers, and radial glia did not express neuronal markers. However, we found substantial co-expression in organoid cells, resulting in a lower correspondence between organoid and primary cell types and subtypes.
We explored how well organoid radial glia recapitulated their primary cell subtype counterparts at the transcriptomic level by focusing the comparison on oRG cells. A number of genes were more highly expressed in organoid oRGs, largely corresponding to glycolysis or ER stress (STable 7). One of the genes most highly upregulated in primary oRG cells, but with very low expression in organoid oRG cells, was PTPRZ1, a known oRG marker (Fig. 2C)21. To validate this finding, we stained primary and organoid samples for PTPRZ1 and HOPX, a canonical oRG marker22,23, and observed more HOPX and PTPRZ1 co-expressing cells in primary tissue than organoids (Fig. 2C, Extended Data Fig. 9E). We performed similar differential expression between upper layer neuron clusters, observing that two genes required for neuronal maturation and projection pattern specification, MEF2C and SATB224,25, were significantly upregulated only in primary cells (Fig 2D). Even when cellular subtypes can be assigned to organoids, they lack molecular subtype identifiers.
Cell Maturation Is Impaired in Organoids
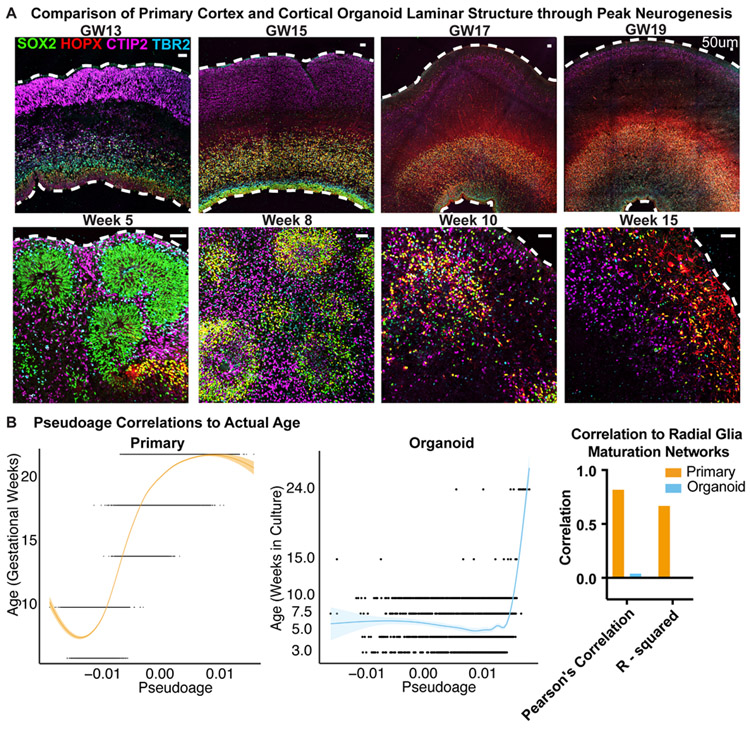
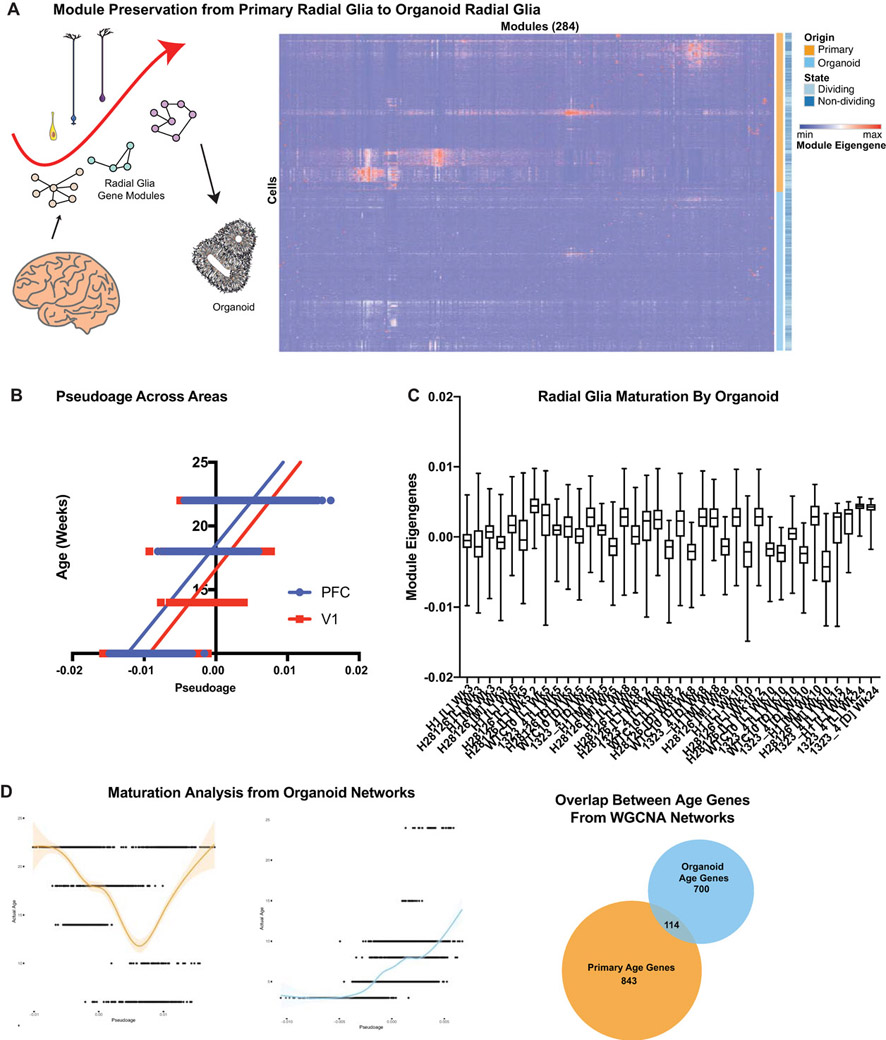
The progression of developmental events, such as the birth of neuronal and glial cell types, occurs more rapidly in organoids, and progenitor and neuronal zones do not expand as broadly as in vivo (Fig. 3A). A primitive radial glial scaffold is observed at 5 weeks of differentiation in the organoid, whereas the oRG scaffold expands predominantly after 15 weeks of primary human cortical development. Over the course of 15 weeks of differentiation the organoid progenitors differentiate, the ‘scaffold’ dissolves and intermixed populations of neurons and glia are present. Using our transcriptomic data we sought to explore how cellular maturation was affected as a result of the faster temporal development we observed cytoarchitecturally. To explore maturation of progenitor cells, we used weighted gene co-expression network analysis (WGCNA26) to generate gene modules that strongly correlate to one another in the primary radial glia. We consolidated the networks with a correlation to sample age into a pseudoage metric and then correlated pseudoage to actual age, observing a strong positive correlation in primary radial glia (Fig. 3B, Extended Data Fig. 10, Supplementary Table 8). With confidence in our networks, we applied them to the organoid radial glia. We saw limited correlation between organoid pseudoage and actual age, suggesting a lack of activation of the molecular maturation programs that exist in vivo. Importantly, this heterogeneous maturation level existed within each organoid (Extended Data Fig. 10C), indicating variability between individual cells and not just across organoids, lines, or batches. The lack of a radial glia molecular maturation signature in organoids correlates with absence of molecular diversity in this model. The impact of radial glia subtype and maturation on their role as neural precursors is unknown, but the dysregulation of these programs in organoids may impact their ability to completely recapitulate differentiation trajectories of cortical neurons in vivo.
Figure 3. Maturation of Cortical Lamina and Radial Glia.
a) Immunohistochemistry of SOX2+ progenitors, HOPX+ oRG cells, CTIP2+ deep layer neurons and TBR2+ IPCs in primary and organoid samples during neurogenesis. Primary samples express SOX2 and TBR2 in the VZ and CTIP2 in the cortical plate at GW13. By GW15 HOPX+ oRGs are born and reside in the oSVZ. The cortex expands dramatically over the next weeks with more HOPX+ oRG cells residing in the oSVZ providing a scaffold for neurons to migrate. Organoids express similar markers to GW13 samples by week five of differentiation with multiple VZ-like structures. oRG cells arise and increase between week eight and ten. The radial architecture expands and dissolves over this period. By week 15 a mix of cell types are present in the organoid. Organoids shown were differentiated using the ‘least directed’ differentiation protocol and staining validated independently three times (primary: n=4 biologically independent samples; organoid: n=3 biologically independent samples). Scale bar = 50 uM b) Pseudoage was calculated by identifying networks from a 10,000 cell subset of primary radial glia that highly correlated to age (either positively or negatively). These networks were then collapsed into a single “age network”. The module eigengene for this age network was then calculated on the remaining data and used for pseudoage. Pseduoage is indicated by the graph line and shading represents the geometric density standard error of the regression. The primary dataset (orange) has a high Pearson’s correlation and R-squared value, while the organoid dataset has no correlation to the pseudoage metric.
Definition of Cortical Areal Signatures
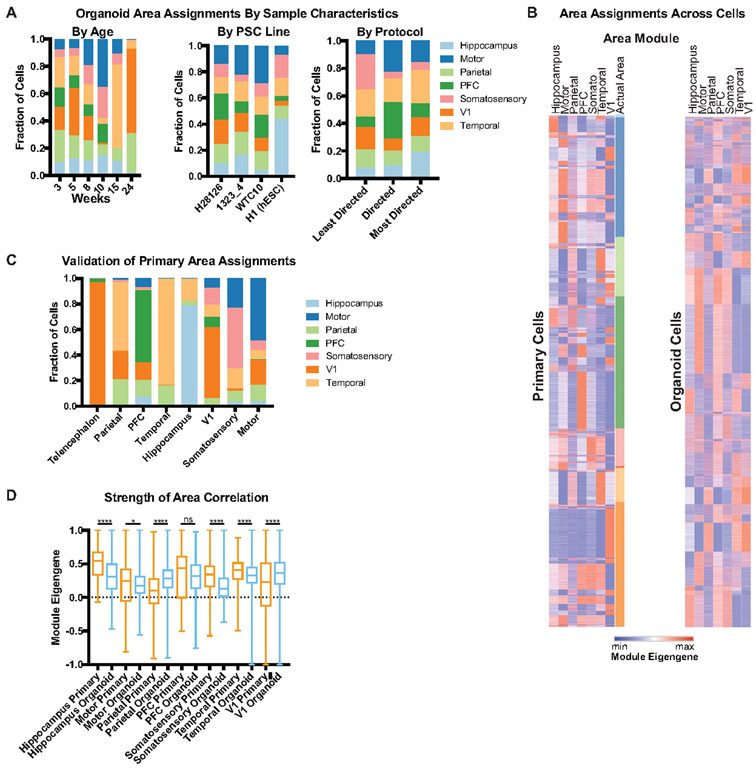
Recent studies have uncovered molecular differences between excitatory neurons across cortical regions27-29, and these differences may emerge during neurogenesis19. Given that regional specification may represent a central feature of neuronal identity, we investigated how molecular properties of areal identity emerge. We leveraged primary cell data collected for seven cortical regions. For genes uniquely enriched in each region, we calculated a weighted average expression (eigengene) across primary and organoid cells (Supplementary Table 9). In primary cells, some signatures, such as those from the PFC, temporal lobe, hippocampus, and V1 were highly enriched in their respective areas (Extended Data Fig. 11). Interestingly, the parietal lobe tracked closely with the temporal lobe and the somatosensory and motor cortex co-expressed signatures, suggesting a lack of areal segregation between these regions at the time points sampled (Extended Data Fig. 11C). The earliest samples in our dataset preceded the development of anatomical distinctions between cortical regions, and thus could not be sub-dissected. The early ‘telencephalon’ samples were highly enriched for V1 signatures, but additional work is required to disentangle whether excitatory neurons born early in development all begin by expressing V1 areal genes, or if this was a sampling artifact of our dissections. These data offer a new categorization of cortical area signatures and enable us to evaluate areal identities of cortical organoid neurons.
Areal Signatures Reflected in Organoids
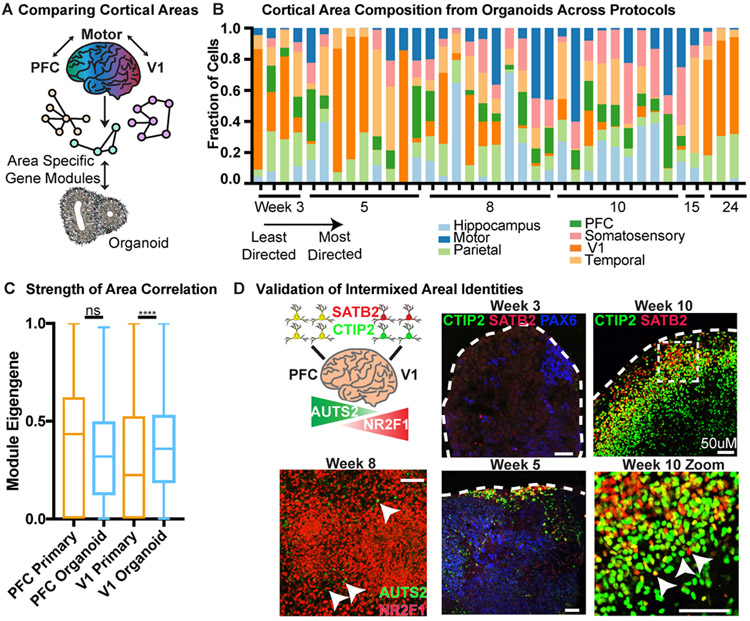
Our analysis indicates that many aspects of neuronal subtype are not preserved or are averaged into a “pan-neuronal” identity in organoids. However, our primary data suggests that areal identity is an early marker of neuronal differentiation. Based on areal signatures from primary cells, we were able to evaluate the closest areal identity for each excitatory organoid neuron profiled by scRNA-seq. We were surprised to discover that most neurons correspond to a defined areal signature (Fig. 4B) despite the lack of thalamic input, which is thought to refine areal identity30,31. Although each organoid contained neurons with multiple areal identities, the strength of areal correspondence of organoid excitatory neurons was robust, including to regions such as PFC and V1 (Fig. 4C, Extended Data Fig. 11D). Regardless of the PSC line or differentiation protocol, cortical organoids were comprised of heterogeneous areal identities. To explore whether cells corresponding to different areas were spatially segregated within an organoid, we performed immunohistochemistry for two sets of area-specific genes. We recently described that PFC excitatory neurons co-express the projection specification transcription factors SATB2 and BCL11B (CTIP2), and through a narrow topographical transition these markers segregate entirely in V119. We explored the expression of these factors in our organoids, and observed both co-expression and segregation of SATB2 and CTIP2 in adjacent cells (Fig. 4D). AUTS2 and NR2F1 are well described genes with rostral-caudal gradient expression patterns, and we similarly observed cells expressing either of these factors in proximal space. Together, these data suggest a model where cortical excitatory neuron differentiation is strongly defined by areal identity, and organoids recapitulate this process, but without spatial organization.
Figure 4. Analysis of Areal Identity in Organoid Excitatory Neurons.
a) Each of seven cortical areas was used to generate a unique area gene signature by comparing expression to the other six areas. The unique signatures were considered networks, and module eigengenes across area networks were calculated for each primary and organoid cell. The area with the highest normalized eigengene (normalized to the highest score within each area for equal comparison) was designated as the areal identity of that cell. b) Areal identity was assigned for each cell within an organoid and the areal composition is shown for the 37 organoids in our dataset. Organoid samples are listed from earliest to latest stage collected (weeks 3-24). Within a timepoint, the organoid protocol used is ordered from least to most directed differentiation; each timepoint is comprised of multiple PSC lines. Every organoid has heterogeneous areal expression. c) The average module eigengene score for each primary (orange) and organoid (blue) cell designated (primary) or assigned (organoid) PFC or V1 identity (primary: n=5 independent samples across 5 experiments; organoid: n=37 organoids across 4 independent experiments). The average value for PFC was not significantly different between organoid and primary, while the V1 organoid cells had higher correlation to the V1 signature than primary cells, indicating areal identity in the organoid strongly resembles normal development (mean with standard deviation shown, two-sided Welch’s t-test, p= 0). d) Validation of intermixing of areal identities in organoid samples differentiated using the ‘least directed’ differentiation protocol. In the PFC, BCL11B (CTIP2) and SATB2 co-localize in the same cell, whereas in V1 cells they are mutually exclusive. Both patterns are in close proximity in the organoid. AUTS2 is a rostrally expressed transcription factor while NR2F1 is a caudally expressed factor, but are adjacent in the organoid. Scale bar = 50 uM, representative image shown (n = 3 replicates each).
Cellular Stress Increases in Organoids
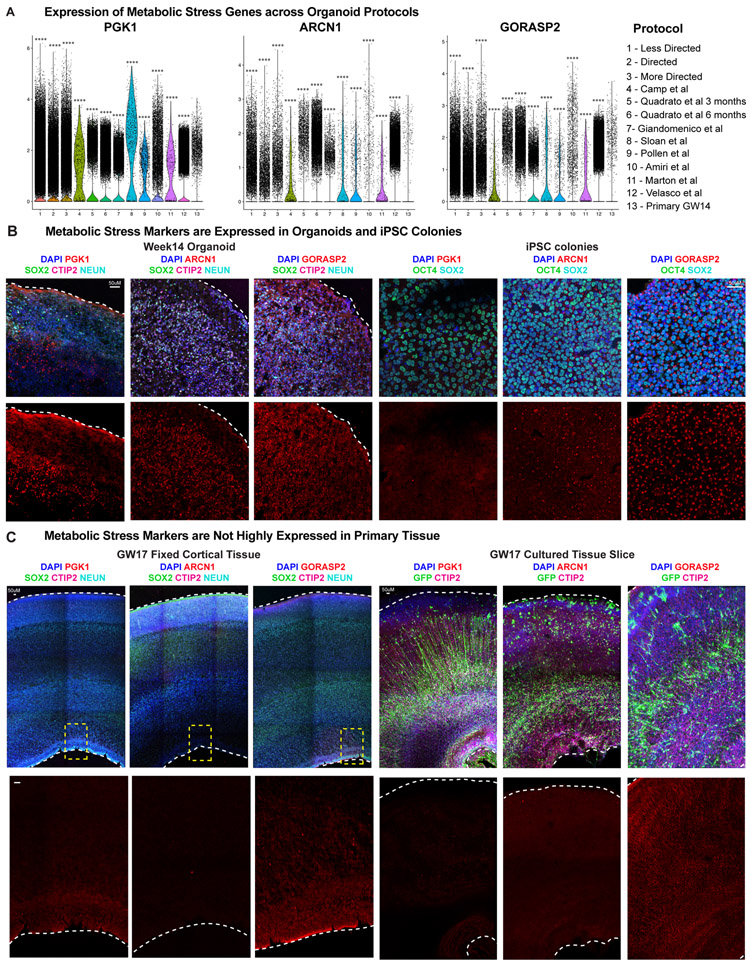
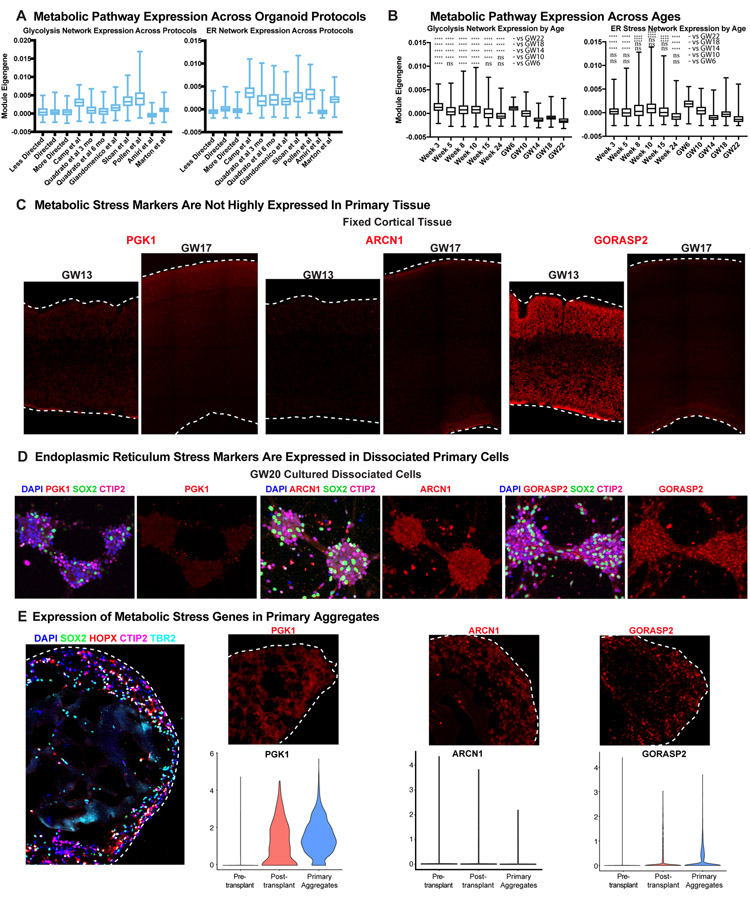
We and others have observed an enrichment of modules related to the activation of glycolysis and endoplasmic reticulum (ER) stress in organoid cells, and additional analysis with four orthogonal co-clustering methods found universal upregulation of stress pathways in organoids across all protocols (Extended Data Fig. 12-13). We validated that several genes upregulated in organoid datasets4, including the glycolysis gene, PGK132, and the ER stress genes, ARCN133 and GORASP234,35, were enriched at the protein level in organoids (Extended Data Fig. 12). Immunostaining verified that, regardless of stage of organoid differentiation or PSC line used, there was significant activation of PGK1, ARCN1 and GORASP2 in distinct organoid domains, not restricted to the organoid core.
To probe the origin of this cellular dysregulation, we first evaluated the expression of stress genes during normal human cortical development and observed little expression in fixed cryosectioned tissue samples throughout peak neurogenesis (Extended Data Fig. 12C), though some ER stress was observed at earlier cortical stages (Extended Data Fig. 13B, C). As ER stress and glycolysis genes are not canonically activated during cortical development, we hypothesized that the in vitro conditions of the organoid model resulted in increased cellular stress. We first evaluated activation of stress pathways in PSCs and were surprised to find expression of both ARCN1 and GORASP2, suggesting that ER stress occurs in stem cells prior to organoid formation (Extended Data Fig. 12B). To determine the rate at which cellular stress arises in vitro, we cultured organotypic cortical slices for one week and observed negligible change in stress activation compared with acutely fixed samples. However, we did observe upregulation of ARCN1 and GORASP2 in primary dissociated cells after one week in culture (Extended Data Fig. 12-13), suggesting that cellular stress may be a broader feature of in vitro culture.
Organoid Environment Activates Stress
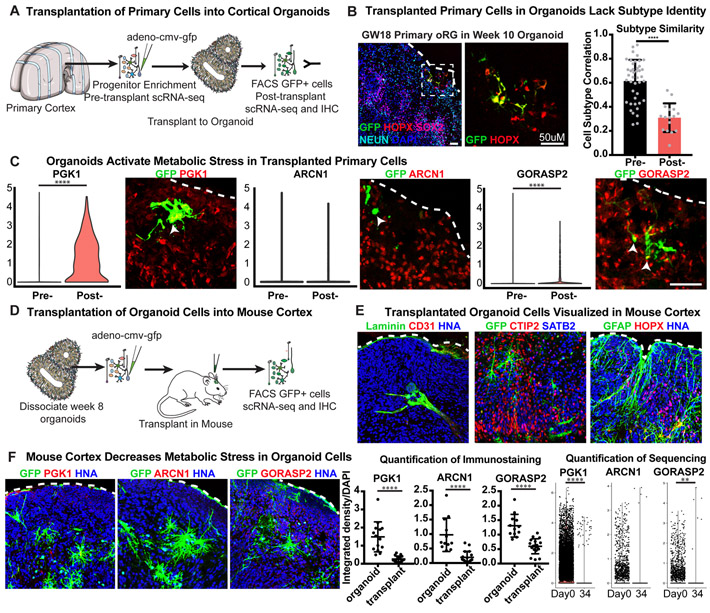
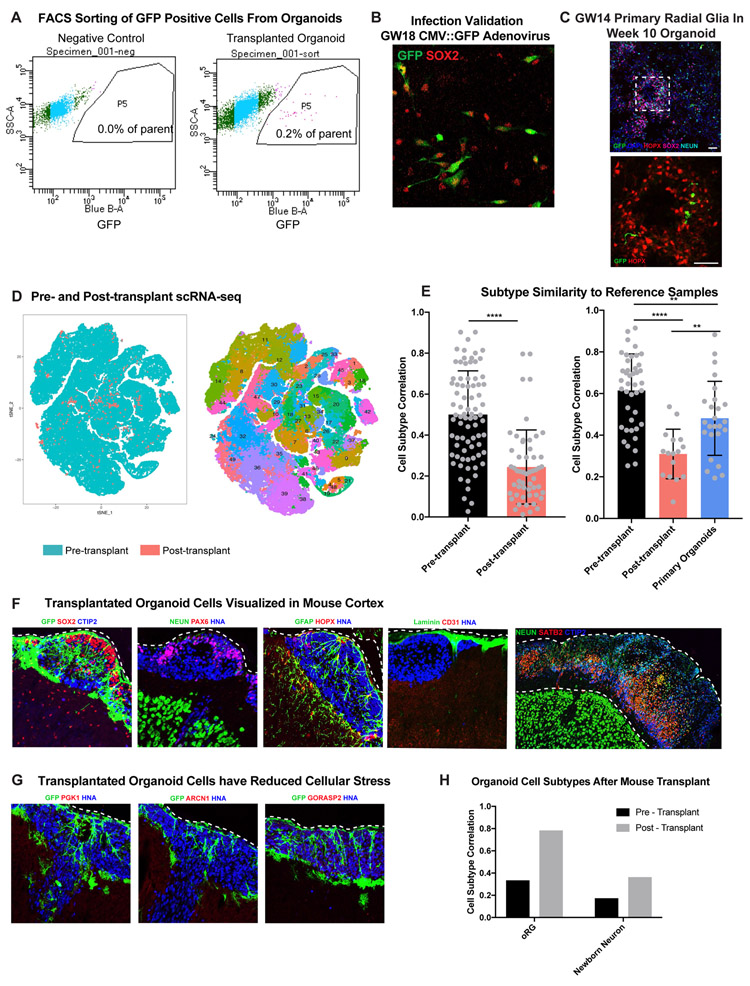
To test whether aggregate cell culture conditions induced cellular stress, we transplanted GFP-labeled primary progenitors from GW14-20 into organoids. After 2.5 weeks we observed GFP labeled SOX2+ HOPX+ primary radial glia within the organoids (Fig. 5B, Extended Data Fig. 14). We isolated GFP+ primary cells and performed scRNA-seq to compare pre- and post- transplanted cells to our primary reference dataset (Supplementary Table 10). We found a dramatic increase in the expression of glycolysis gene PGK1 and the ER stress gene, GORASP2, in primary cells transplanted into, or generated within, the organoids (Fig. 5C, Supplementary Table 11).
Figure 5. Influence of Culture on Metabolic Stress and Cell Type.
a) Primary samples were progenitor-enriched, GFP-labeled and transplanted into organoids. After 2.5 weeks, GFP+ cells were isolated via FACS and processed for scRNA-seq. b) Primary GFP+ cells integrate into organoids differentiated using the ‘least directed’ protocol. Scale bar = 50 uM. Pre-transplantation cells have similar profiles and cellular subtypes as primary data. After transplantation, there is a decrease in subtype correlation (n=7 biologically independent samples across 2 independent experiments). Mean subtype correlation indicated on graph, error bars show standard deviation (p= 2.8e−9, two-sided Welch’s t-test). c) After transplant, primary cells increase expression of stress genes, PGK1 (****p= 1.76e−87, two-sided student’s t-test) and GORASP2 (arrow; ****p= 9.60e−63 two-sided student’s t-test) as indicated by width of colored domain in each respective violin plot (n=7 samples across 2 experiments). Scale bar = 50 uM. d) Organoids were dissociated, GFP labeled, and injected into the cortex of P4 mice. After 2-5 weeks, mouse brains were harvested for scRNA-seq and immunostaining. e) Human cells are visualized by GFP and human nuclear antigen expression (n=13 mice transplanted with 14 organoids derived from 2 iPSC lines across 2 independent experiments). Organoid cells express markers of progenitors (HOPX), neurons (CTIP2, SATB2) and astrocytes (GFAP). Mouse vascular cells (Laminin & CD31) innervate the transplant. f) Post-transplant, organoid cells have reduced expression of stress genes. Scatter plots show decreased staining intensity in transplanted organoids (error bars: standard deviation) of PGK1 (****p= 9.64E-07), ARCN1 (****p=1.28E-05) and GORASP2 (****p=1.88E-06; n=19 sections from 6 transplanted mice across 2 experiments, each marker stained independently; all comparisons used the two-sided student’s t-test). Violin plots show a decrease in PGK1 (****p= 2.16e−17) and GORSASP2 (**p= 0.0019) expression in organoid cells post-transplant from single cell analysis (n= 1980 cells from 7 transplanted mice across 2 experiments, all groups were evaluated using the two-sided Welch’s t-test).
Increased Stress Impairs Cell Subtype
Mouse knockout studies have suggested activation of ER stress pathways can inhibit cell type specification36,37, so we assessed whether metabolic stress was affecting specification in transplanted primary cells. We noted similar subtypes when comparing pre-transplantation cell clusters and our primary reference data. In contrast, post-transplanted primary cells had significantly lower subtype correlation, similar to organoid cells, and they lacked markers of specific progenitor or neuronal subtypes (Fig. 5B, Extended Data Fig. 11E). In order to test if the differences were driven by induction of stress pathways, we also generated three-dimensional aggregates of dissociated primary cortical cells from GW14/15 and found a similar upregulation of metabolic stress genes (Extended Data Fig. 13E). However, we observed an intermediate phenotype on subtype correlation where primary aggregates were significantly higher than post-transplanted primary cells, but still significantly lower than pre-transplant (Extended Data Fig. 14E). Some of these discrepancies might be attributable to other cell types, including microglia, endothelial cells, and pericytes in the primary aggregate that may promote normal maturation and differentiation.
Transplantation Rescues Cell Stress
To determine whether an in vivo environment could rescue the cellular stress derived from organoid culture conditions, week 8 organoids were dissociated, virally labeled with GFP, and transplanted into cortices of postnatal day four (p4) mice (Fig. 5D). After two and five weeks post-transplant, organoid derived cells could be visualized incorporated into the mouse cortex (Fig. 5E, Extended Data Fig. 14F). After 5 weeks, organoid-derived cells had intricate morphologies and significantly reduced expression of cellular stress markers. The glycolysis gene, PGK1, and the ER stress gene, ARCN1, were absent, and the ER stress gene, GORASP2, was reduced compared to normal organoid conditions (Fig. 5F, Extended Data Fig. 14G). As organoid cells had reduced stress after transplantation, we evaluated whether organoid-derived cells are capable of higher subtype specificity when removed from the in vitro environment. We isolated GFP+ organoid cells 2 and 5 weeks after transplant for scRNAseq and compared pre- and post-transplantation organoid-derived cells to our primary reference. We noted increased cell subtype specification of both oRG cells and newborn neurons (Extended Data Fig. 14H) suggesting that metabolic stress contributes to specification deficiencies in organoid cells (Supplementary Discussion).
Conclusions
Here, we provide a comprehensive molecular characterization of developing human cortical cell types and their preservation in brain organoid models. Using single-cell transcriptomics, we identify broad cell classes and types, as well as fine grain subtypes such as outer radial glia progenitors in primary human samples. Compared to primary tissue, organoids contain a smaller number of cell subtypes and often co-express marker genes resulting in broad type assignment, such as pan-radial glia or pan-neuron. We use this dataset to generate pseudoage metrics and provide in-depth analysis of area specific gene signatures and their developmental trajectories in primary and organoid neurons. Finally, we identify a role for stress pathway activation in impaired subtype specification of cortical organoid cell types; the lack of specificity in organoids must be carefully considered when studying developmental processes, cell type specific disease phenotypes, or cellular connectivity. Additionally, metabolic stress in utero could lead to molecular identity changes with potential consequences to human brain development. Overall, our compilation of raw and analyzed data, paired with visualization of single-cell clustering in a cell browser, provides a valuable resource to better understand normal human development and benchmark the fidelity of in vitro cellular data.
Methods
PSC expansion culture
Human induced pluripotent stem cell lines, H28126 (Gilad Lab, University of Chicago), 13234 and WTC10 (Conklin Lab, Gladstone Institutes) which we previously authenticated4 and embryonic stem cells line, H1 (WiCell, authenticated at source), were expanded on matrigel-coated plates six well plate. Cells tested negative for mycoplasma. Stem cells were thawed in StemFlex Pro Media (Gibco) containing 10uM Rock inhibitor Y-27632. Media was changed every other day and lines passaged when colonies reached about 70% confluency. Stem Cells were passaged using PBS-EDTA and residual cells manually lifted with cell lifters (Fisher). All lines used for this study were between passage 25 - 40.
Cortical Organoid Differentiation Protocols
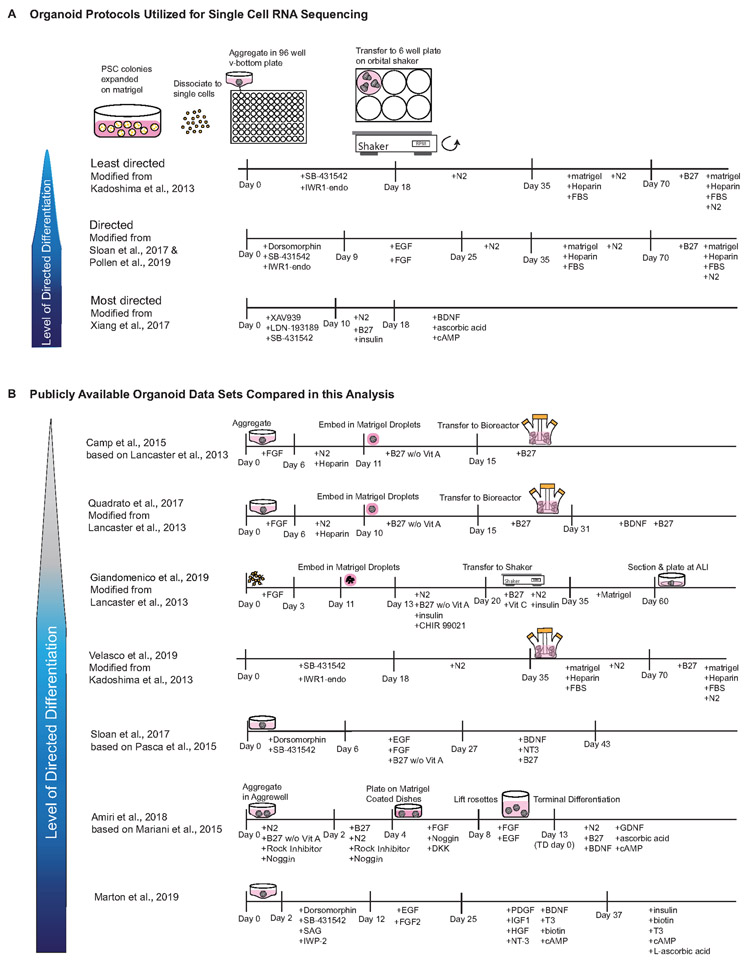
Cortical organoids were differentiated using three directed differentiation protocols. Briefly, PSC lines were expanded and dissociated to single cells using Accutase. After dissociation cells were reconstituted in neural induction media at 10,000 cells per well in a 96 well v-bottom low adhesion plate. After 18 days, organoids from all protocols were transferred from 96 well to six well low adhesion plates and moved onto an orbital shaker rotating at 90rpm. Throughout culture duration organoids were fed every other day. Organoids were collected for immunohistochemistry and scRNAseq at 3, 5, 8 and 10 weeks.
Using the least directed differentiation protocol1 GMEM-based induction media included 20% Knockout Serum Replacer (KSR), 1X non-essential amino acids, 0.11mg/mL Sodium Pyruvate, 1X Penicillin-Streptomycin, 0.1mM Beta Mercaptoethanol, 5uM SB431542 and 3uM IWR1-endo. Media was supplemented with 20uM Rock inhibitor Y-27632 for the first 6 days. After 18 days media was changed to DMEM/F12 media containing 1X Glutamax, 1X N2, 1X CD Lipid Concentrate and 1X Penicillin-Streptomycin. At 35 days, organoids were moved into DMEM/F12 based media containing 10% FBS, 5ug/mL Heparin, 1X N2, 1X CD Lipid Concentrate and 0.5% Matrigel (BD). At 70 days media was additionally supplemented with 1X B27 and Matrigel concentration increased to 1%.
In the directed differentiation protocol4,8 induction media consisted of GMEM including 20% KSR, 1X non-essential amino acids, 0.11mg/mL Sodium Pyruvate, 1X Penicillin-Streptomycin, 0.1mM Beta Mercaptoethanol and supplemented with 5uM SB431542, 3uM IWR1-endo and 2uM Dorsomorphin. From day 9 to 25 small molecules were removed induction media was instead supplemented with 10ng/ml EGF and 10ng/ml FGF. After 25 days media was changed to DMEM/F12 media containing 1X Glutamax, 1X N2, 1X CD Lipid Concentrate and 1X Penicillin-Streptomycin. At 35 days, organoids were moved into DMEM/F12 based media containing 10% FBS, 5ug/mL Heparin, 1X N2, 1X CD Lipid Concentrate and 0.5% Matrigel (BD). At 70 days media was additionally supplemented with 1X B27 and Matrigel concentration increased to 1%.
The most directed12 protocol utilized a DMEM/F12 based induction medium containing 15% KSR, 1X MEM-NEAA, 1X Glutamax, 100uM B-ME, 100nM LDN-193189, 10uM SB431542, and 2uM XAV939. For the first 2 days media was supplemented with 50uM Rock Inhibitor Y-27632 and 5% heat-inactivated FBS. After 10 days organoids were moved into neuronal differentiation media consisting of equal parts DMEM/F12 and Neurobasal containing 0.5% N2, 1% B27 w/o Vitamin A, 1% Glutamax, 0.5% MEM-NEAA, 0.025% human insulin solution, 50uM B-ME and 1% Penicillin-Streptomycin. After 18 days organoids were maintained in maturation media containing equal parts DMEM/F12 and Neurobasal with 0.5% N2, 1% B27, 1% Glutamax, 0.5% NEAA, 0.025 human insulin solution, 50uM B-ME, 20ng/mL BDNF, 200uM cAMP and 200uM ascorbic acid.
Immunohistochemistry
Cortical organoids and primary human cortical tissue were collected, fixed in 4% PFA, washed with 1xPBS and submerged in 30% sucrose in 1xPBS until saturated. Samples were embedded in cryomolds containing 50% O.C.T. (Tissue-tek) and 50% of 30% sucrose in 1xPBS and frozen at −80C. Primary samples were sectioned at 20uM and organoids at 16uM onto glass slides. Antigen-retrieval was performed on tissue sections using a citrate-based antigen retrieval solution at 100x (Vector Labs) which was boiled to 95C and added to slides for 20mins. After antigen retrieval, slides were briefly washed with PBS and blocked with PBS containing 5% donkey serum, 2% gelatin and 0.1% Triton for 30mins. Primary antibodies were incubated in blocking buffer on slides at 4C overnight, washed with PBS containing 0.1% Triton three times and then incubated with AlexaFluor secondary (Thermo Fisher) antibodies at room temperature for 2 hours. Primary Antibodies included Mouse: Sox2 (Santa Cruz, 1:500, sc-365823), Hopx (Santa Cruz, 1:250, sc-398703), Satb2 (Abcam, 1:250, ab51502), AUTS2 (abcam, 1:100, ab243036), Human Nuclei (Millipore, 1:500, MAB1281), Rabbit: Hopx (Proteintech, 1:500, 11419-1-AP), GORASP2 (Proteintech, 1:50, 10598-1-AP), ARCN1 (Proteintech, 1:50, 23843-1-AP), PGK1 (Thermo Fisher 1:50, PA5-13863), PTPRZ1 (Atlas, 1:250, HPA015103), NR2F1 (Novus, 1:100, NBP1-31259), Rat: Ctip2 (Abcam, 1:500, ab18465), Sheep: Eomes (R&D, 1:200, AF6166), Guinea pig: NeuN (Millipore, 1:500, ABN90), Chicken: Gfp (Aves, 1:500, GFP-1020).
Primary Sample Collection
All primary tissue was obtained and processed as approved by the UCSF Human Gamete, Embryo and Stem Cell Research Committee (GESCR) approval 10-05113. All experiments were performed in accordance with protocol guidelines. Informed consent was obtained prior to sample collection for the use of all tissue samples within this study. First and second trimester human cortex tissue was collected from elective pregnancy termination specimens from San Francisco General Hospital and the Human Developmental Biology Resource (HDBR). Tissue was collected only with previous patient consent for research and in strict observation of legal and institutional ethical regulations.
Dissociation
Primary human cortical samples were dissociated using Papain (Worthington) containing DNase. Samples were grossly chopped and then placed in 1mL of Papain and incubated at 37C for 15mins. Samples were inverted three times and continued incubating for another 15 mins. Next samples were triturated by manually pipetting with a glass pasteur pipette approximately ten times. Dissociated cells were spun down at 300g for 5mins and Papain removed.
10X Capture and Sequencing
Single-cell capture from live cells was performed following the 10X v2 Chromium manufacturer’s instructions for both primary and organoid samples. For primary samples, each sample was its own batch. For organoid samples, batch is indicated in the metadata annotation in STable 1. In each case, 10,000 cells were targeted for capture and 12 cycles of amplification for each the cDNA amplification and library amplification were performed. Libraries were sequenced as per manufacturer recommendation on a NovaSeq S2 flow cell.
Clustering
We first explored the cell type identities of primary and organoid samples using Louvain-Jaccard clustering19,38. Prior to clustering, batch correction was performed similar to previous approaches39. Briefly, each set of cells within a batch were normalized to the highest expressing gene, making the range of expression from 0 to 1. These values were multiplied by the average number of counts within the batch. These normalized datasets were piped into Seurat v240, where cells with less than 500 genes per cell or greater than 10% of reads aligning to mitochondrial genes being discarded. Normalized counts matrices were log2 transformed, and variable genes were calculated using default Seurat parameters. Data was scaled in the space of these variable, and batch was regressed out. Principal component analysis was performed using FastPCA, and significant PCs were identified using the formula outlined in Shekhar et al. In the space of these significant PCs, the k=10 nearest neighbors were identified as per the RANN R package. The distances between these neighbors was weighted by their Jaccard distance, and louvain clustering was performed using the igraph R package. If any clusters contained only 1 cell, the process was repeated with k=11 and up until no clusters contained only 1 cell. Cluster markers and tSNE plots were generated with Seurat package default parameters.
Cell Type Annotations
Primary cell type annotations of clusters were performed by comparison to previously annotated cell types, and when a repository of substantial matching was not available, a combination of literature based annotation of layer or maturation stage identity was used. The genes used to annotate each cluster are highlighted in Supplementary Table 2. When a cluster was substantially enriched based upon an age or an areal metadata property, this empirical observation was used to inform the annotation. Organoid cell types were first annotated by their similarity to primary cell clusters, if the correspondence was at or above 0.4 and only one primary cell type had such a high correspondence, the primary cell type was applied to the organoid cluster. If the correspondence was between 0.2 – 0.4 and included only one similarity, that cell type was used to identify the organoid cell type unless there was an obvious discrepancy in top marker gene expression between the two clusters. If no correlation was above 0.2, literature annotations or unknown identities were assigned. If an organoid cluster correlated equally well (within 10%) of multiple primary subtypes of the same or similar cell type, “pan” identity was assigned. Low quality cell types for all analyses were assigned when markers were dominated (>60%) by mitochondrial genes, ribosomal genes, or pseudogenes. Occasionally, an intersection of these approaches was used for organoid clusters, and is indicated in Supplementary Table 3.
Correlation Analysis
Correlation analysis was generated in the space of marker genes. For each marker gene, a speificity score was calculated. This score equaled the ‘enrichment’ – log2(fold change) of the marker compared to other clusters – and the ‘specificity’ – the percent of the relevant cluster expressing the marker divided by the percent of other clusters expressing the marker. These two values were multiplied by one another to obtain the final score, and was represented across all marker genes for each sample in box and whisker plots. A matrix of all markers across all clusters was created for each individual dataset; if a marker was not expressed at all in a certain cluster, it was marked as 0. If a value was divided by 0 to calculate the score, the score was placed as a dummy score at 1500. Matrices between comparisons were correlated in the space of overlapping marker gene space using Pearson’s correlations.
Co-clustering Analysis
Each of the five batch correction methods were performed with default parameters. For each analysis, the same 20,000 cell subset of each organoid and primary cells was used because most of the algorithms were too computationally intensive to perform on the full dataset.
Linear Mixed Models
VariancePartition41 was used for linear mixed model analysis. Analysis was performed in a randomized subset of 50,000 genes in the space of expressed genes across the meta data properties noted in Extended Data Figure 5. Age was used as a continuous variable and all other variables were assigned as discrete.
WGCNA and Maturation Analysis
WGCNA networks were calculated as previously described19 in 10,000 randomly chosen primary radial glia cells and in parallel from 10,000 randomly chosen organoid radial glia cells. These networks were applied to the remaining primary and organoid cells using the ModuleEigengene function from the WGCNA R package. Pseudoage was calculated by taking networks that correlated highly to age in the 10,000 cell subset and combining their genes into a single gene set. PCA was performed in this gene space in the full space of radial glia and the loading of the first principle component dictated the pseudoage. This analysis was performed reciprocally.
Area Signatures
Area signatures were obtained by performing pairwise differential expression between each of the seven cortical areas and the six remaining areas. Differential expression across all of the areas was combined, with a count of how many times a gene was differentially expressed in an area from each of the pairwise comparison. While combining the lists, the enrichment and specificity were averaged across all six analyses and multiplied by the number of times the gene appeared as a marker for an area of interest. This value, the “area specificity score” was compared across all areas. For any genes that were considered markers of multiple areas, the area with the highest area specificity score was allocated to the gene as a marker, thus making all area markers unique to one area alone. This is how some areas have a higher percentage of cells assigned to another area other than their area or origin, and enables cleaner comparison of areal pattern emergence. Each set of area marker genes were designated as a network, and the correlation of each cell to this area was calculated by applyModules and calculating a module eigengene. After assignment, in order to normalize unequal module eigengene distributions, within a dataset the module eigengenes were normalized by area and the assigned area for a cell was the area for which that cell had the highest module eigengene.
PSA-NCAM Protocol & Viral Infection of Primary Cells
Primary cortical samples were grossly dissected to isolate the ventricular and subventricular zones excluding cortical plate neurons. Dissociated cells were enriched for neural progenitor cells using a PSA-NCAM antibody and the MACs magnetic sorting kit (Miltenyi Biotech). Briefly, dissociated cells were incubated with the PSA-NCAM antibody for 30mins at RT, washed with PBS containing 0.1% BSA and added to an equilibrated magnetic L column. Cells positive for antibodies bind to the column and negative cells are collected in the elute. The negatively sorted cells were pelleted at 300g for 10mins and supernatant removed. Negatively sorted samples were infected with CMV::GFP adenovirus (Vector Biolabs), which preferentially labels progenitors, at 37C for 15mins. Cells were spun down for 5mins at 300g and reconstituted in 500ul media. Cells were counted and 50,000 primary cells isolated for transplantation in 100ul of media.
Primary Cell Transplantation into Organoids
Week 10 or 15 organoids made from the 13234 iPSC line using the ‘least directed’ differentiation protocol were placed at the air liquid interface on Millicell (Millipore) inserts to limit movement. 50,000 primary cortical cells were reconstituted in media containing DMEM/F12, 5% FBS, 1X N2 (Thermo Fisher), 1X B27 (Thermo Fisher), 1X Penicillin-Streptomycin (Thermo Fisher) and CD lipid concentrate (Thermo Fisher). Cells were slowly pipetted on top of the semi-dry organoids and left to integrate into the organoids for 30mins at 37C. Afterwards, organoids were gently lifted off of inserts by increasing media volume by 3mL. After 2 days organoids were transferred to a new 6 well plated without inserts and media supplemented with 1% GF-reduced Matrigel and 1X Amphotericin B.
Fluorescence Activated Cell Sorting Purification of GFP Cells
Cells were dissociated into a single-cell suspension as described above. Cell suspensions were triturated and placed on top of 4 ml 22% Percoll. Tubes with Percoll and cell suspension were spun at 500g for 10 minutes without break. The supernatant was discarded, and the cell pellet resuspended in HBSS with BSA and glucose. Cells were sorted using a Becton Dickinson FACSAria using 13 psi pressure and 100 μm nozzle aperture. All FACS gates were set using unlabeled cells. Data was analyzed post hoc for enrichment percentages with FlowJo software.
Maintenance of Transplanted Organoids
Organoids were maintained in 6 well low-adhesion plates in DMEM/12 with Glutamax (Thermo) medium containing 10% FBS (Hyclone), 1% GF-reduced Matrigel (Corning), 1X N2 (Thermo Fisher), 1X B27 (Thermo Fisher), 1X CD Lipid Concentrate (Thermo Fisher), 5ug/mL Heparin, 1X Penicillin-Streptomycin, and 1X Amphotericin B (Gibco). Media was changed every other day for the duration of their culture. Transplants were collected for immunohistochemistry at weeks 1, 2.5, 4 and 6 post-transplant. At week 2.5 paired organoid samples were FACS sorted for GFP+ cells and captured cells were collected for single cell RNA sequencing.
Organoid Cell Transplantation into Mice
Mouse experiments were approved by UCSF Institutional Animal Care and Use Committee (IAUCUC) protocol AN178775-01 and performed in accordance with relevant institutional guidelines. Organoids from the H28126 and 13234 iPSC lines were differentiated using the ‘least directed’ protocol described above. Week 7/8 organoids were dissociated and labeled with a CMV::GFP adenovirus for 30mins at 37C. Cells were pelleted and immediately transplanted into postnatal NSG mice (NOD.Cg-Prkdcscid Il2rgtm1Wjl/SzJ, stock No:005557) at four days of age (p4). Using a stereotaxic rig, either the PFC or V1 of the left hemisphere was localized and 10,000 cells were transplanted into the cortex at each injection site. Two transplantations/injections, 0.5mM apart, were made per animal within the same cortical area of 10,000 cells each. Animals developed for either 2 or 5 weeks post-transplantation before being harvested. A total of 13 mice were used (7 male, 6 female), no statistical method was used to determine this sample size. Mice were sacrificed, the brain extracted and grossly dissected using GFP expression to visualize relevant areas for collection. Tissue with GFP expression was dissociated for 30mins at 37C using Papain, manually triturated, centrifuged and re-suspended in HBSS. Cells were sorted for GFP using the FACS strategy described previously. After FACS isolation, GFP+ cells were utilized for scRNAseq using the 10x V2 platform. Animals from the same experiment were collected in parallel and perfused with 10 mL of PBS followed by 10 mL of 4% PFA before the brains were extracted. Mouse brains were further fixed O/N at 4C, washed in 1xPBS three times for 30mins each, and rocked O/N at 4C in 30% sucrose in PBS. Brains were embedded in 50/50 mix of 30% sucrose and O.C.T. before being cryosectioned.
Organotypic Slice Culture
Primary cortical tissue was maintained in CO2 bubbled artificial cerebral spinal fluid until embedded in a 3% low melt agarose gel. Embedded tissue was live sectioned at 300uM using a vibratome (Leica) and plated on Millicell (Millipore) inserts in a 6 well tissue culture plate. Slices were cultured at the air liquid interface in media containing 32% Hanks BSS, 60% BME, 5% FBS, 1% glucose, 1% N2 and 1% Penicillin-Streptomycin-Glutamine. Slices were maintained for 7 days in culture at 37C and media changed every third day.
Primary Cortical Aggregates
Primary human cortical samples from gestational weeks 14 and 15 were gross dissected at the outer subventricular zone, removing the cortical plate. Samples were dissociated using Papain as described previously. Samples were aggregated in 96 v-bottom low-adhesion plates (S bio) containing 20,000 cells per well. They were aggregated in DMEM/F12 with Glutamax (Thermo) based medium containing 10% FBS (Hyclone), 1X N2 (Thermo Fisher), 1X CD Lipid Concentrate (Thermo Fisher), 5ug/mL Heparin, 1X Penicillin-Streptomycin and 1X Amphotericin B (Gibco). Media was supplemented with 20uM Rock Inhibitor for the first week. After 2 weeks, aggregates were transferred to 6 well low adhesion plates and media supplemented with 1% Matrigel and 1X B27.
Dissociated Primary Cell Culture
Dissociated primary cortical cells were reconstituted in DMEM/F12 based medium containing 1X N2 (Thermo Fisher), 1X B27 (Thermo Fisher), 1X Penicillin-Streptomycin (Thermo Fisher) and 1X Sodium Pyruvate (Thermo Fisher). Cells were plated at 1million/mL in 12 well matrigel-coated tissue culture plates.
Extended Data
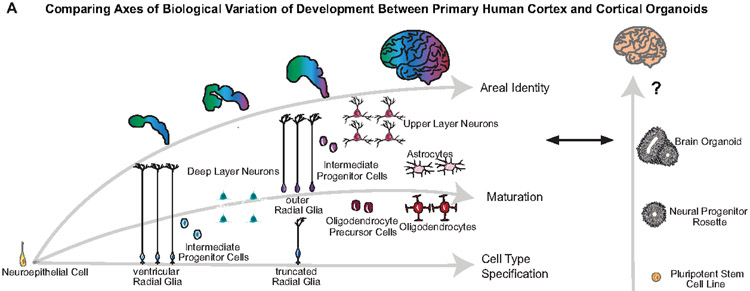
Extended Data Figure 1. Schematic of Human Cortex and Human Organoid Development.
a) Schematic of normal brain developmental trajectories queried in this study and their comparison to organoid models. Normal cortical development requires the emergence of a diversity of progenitor cell types from a seemingly uniform neuroepithelium. Through a sequence of cell type specification and maturation, progenitor cells undergo neurogenesis and gliogenesis to generate the cellular diversity of the cortex. Areal identities are specified during this process and comprise a core property of developing neurons.
Extended Data Figure 2. Brain and Cortical Organoid Generation Protocols.
a) Cortical organoid protocols utilizing different levels of directed differentiation were evaluated using scRNA-seq and immunohistochemistry. Stem cells were expanded on matrigel, dissociated to single cells, and re-aggregated in v-bottom low adhesion plates. Small molecules were used to promote forebrain induction and after 18 days moved to 6 well plates onto an orbital shaker. Organoids were maintained in culture and collected from weeks 3-24. b) Protocol schematics for other methods used to differentiate whole brain and cortical organoids, which have published single cell data. Publicly available data was utilized for comparative analyses with our collected data.
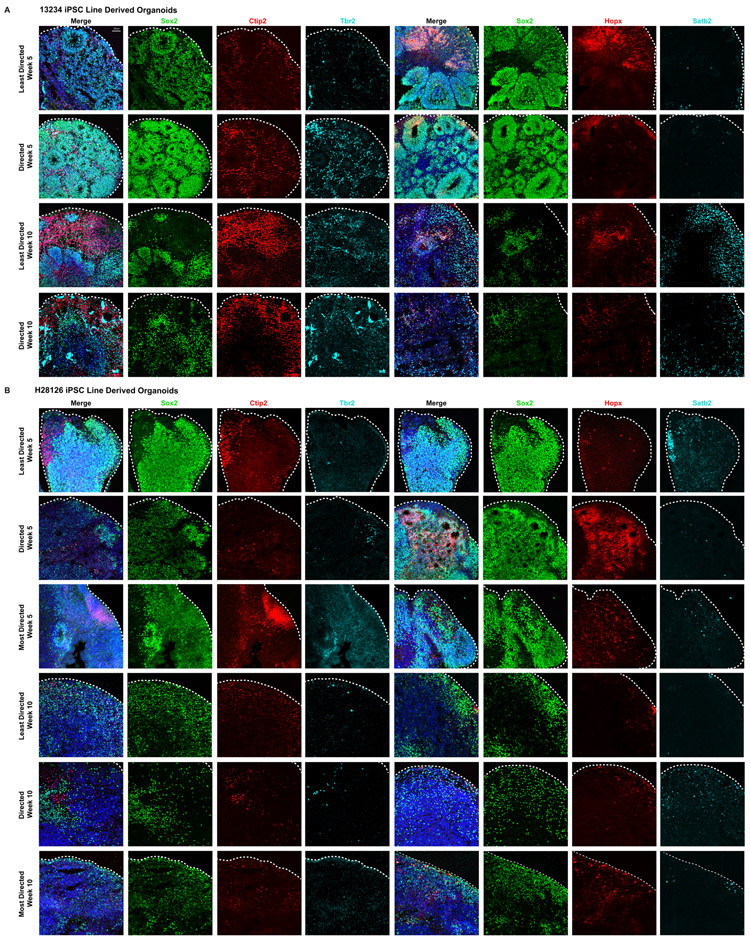
Extended Data Figure 3. Comparison of Broad Cell Types Across Differentiation Protocols.
a) Organoids derived from the 13234 iPSC line underwent the least and directed differentiation protocols, were collected at weeks 5 and 10, and processed for immunohistochemistry. Organoids from both protocols were stained with SOX2 to mark progenitors, HOPX to identify outer radial glia, and TBR2 to label intermediate progenitor cells. Cultures were also stained with CTIP2+ to mark deep layer neurons and SATB2+ to identify upper layer neurons. At week 5 all progenitor subtypes were present and by week 10 both deep and upper layer neurons were detected. b) Organoids from the H28126 iPSC line were differentiated using the least, directed and most directed protocols. All progenitor types marked by SOX2, HOPX and TBR2 and CTIP2+ and SATB2+ neuronal populations were present by week 5. Expression of all markers decreased by week 10. Organoid staining validation of broad cell types was repeated independently three times.
Extended Data Figure 4. Single-cell Comparison of Cell Types Across Samples.
a) tSNE plots depicting the single-cell analysis of primary cortical cells as colored by cluster, age of sample, and cortical area. Stacked histograms showing composition of each cluster for these metadata properties are also included. b) tSNE plots depicting the single-cell analysis of cortical organoid cells as colored by cluster, protocol, pluripotent stem cell line (iPSC or hESC), and age of sample. Stacked histograms showing composition of each cluster for these metadata properties are also included.
Extended Data Figure 5. Single-cell Comparison of Cell Types Across Published Datasets.
a) Re-analysis of published single-cell sequencing in organoid samples. tSNE plot is colored by cell type designation, while the feature plots depict the same cell populations as presented in Figure 1. b) tSNE plots depicting the single-cell analysis of published organoid cells as colored by cluster, protocol (including paper of origin) and FOXG1 expression. c) Recapitulation of the heatmap in Figure 2, using published organoid clusters from above and comparing to primary reference dataset from this paper. Quantification of correspondence shows the quantitative correlation from the best match in the heatmap for each category of class, state, type and subtype, averaged across all clusters (primary: n=189,409 cells from five individuals collected independently; published organoid data: n=_109,813__cells from 7 data sets collected independently by different scientific groups; two-sided Welch’s t-test evaluating mean plus standard deviation; subtype vs type: * p= 0.0193, subtype vs. state: ***p=0.00017).
Extended Data Figure 6. Single-cell Comparison of Cell Types Across Published Datasets.
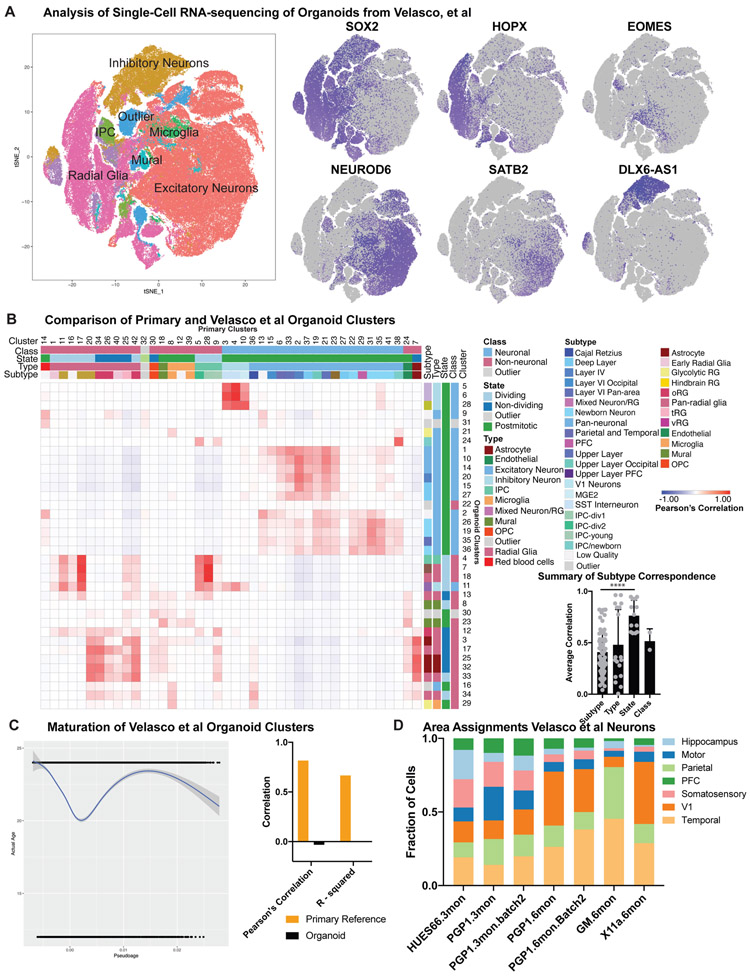
a) Re-analysis of published single-cell sequencing from Velasco et al, where a reproducible cortical organoid protocol was presented. tSNE plot is colored by cell type designation, while the feature plots depict the same cell populations as presented in Figure 1. b) Recapitulation of the heatmap in Figure 2, using published organoid clusters from Velasco et al and comparing to primary reference dataset from this paper. Quantification of correspondence shows the quantitative correlation from the best match in the heatmap for each category of class, state, type and subtype, averaged across all clusters (primary: n= 189,409 cells from five individuals collected independently; Velasco 2019 organoid data: n= 166,241 cells from an independently collected data set; two-sided Welch’s test was used to evaluate mean plus standard deviation; subtype vs state ****p= 1.8e−7). c) Pseudoage analysis of Velasco et al organoids mirrors the organoids in this study with low correspondence between pseudoage and actual age. Pseudoage calculation is indicated by the graph line and shading represents the geometric density standard error of the regression. d) Area identity was assigned for all excitatory neurons from Velasco, et al and each organoid consisted of heterogeneous areal identities, consistent with the observations in the organoids from this study.
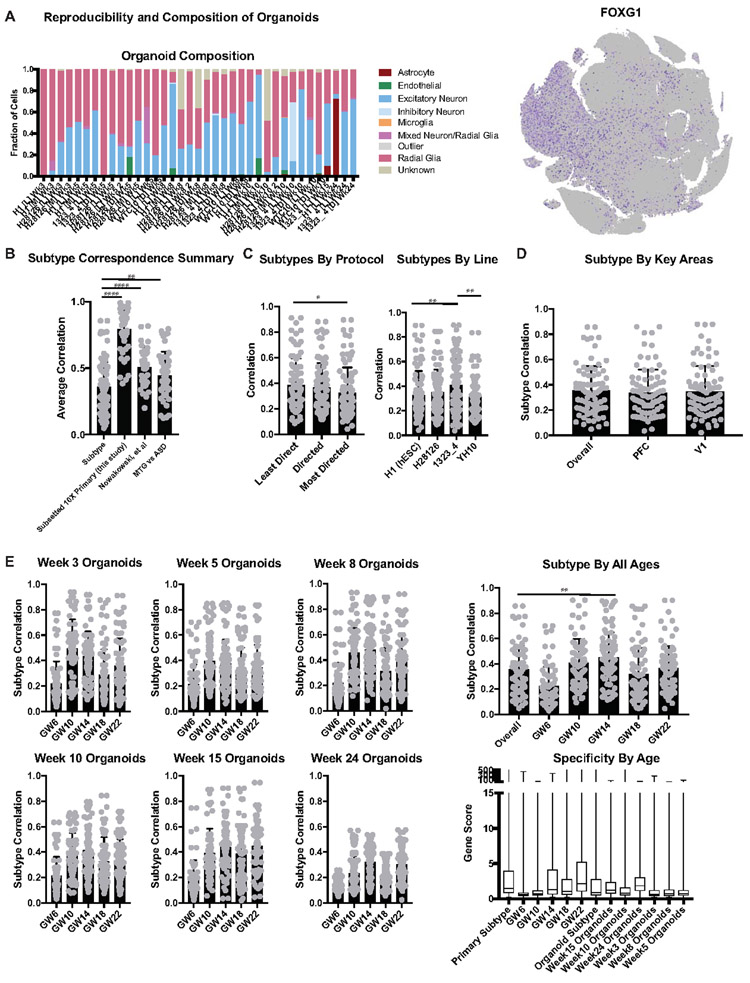
Extended Data Figure 7. Analysis of Subtype Correlation Across Metadata Properties.
a) Composition of each organoid by cell type designation. FOXG1 expression across all organoid samples shown by feature plot on the right. b) Comparison of organoid subtype as determined by this study versus three control analyses. Graphically, the column indicates subtype correspondence and the error bar is standard deviation. The first was performed by halving the primary dataset randomly and without overlap and then comparing the subclusters from the two datasets. This age and method matched analysis shows that primary variation is significantly lower than the variation between organoids and primary cells, as indicated by the significantly higher subtype correlation between primary datasets (organoids: n=242,349 cells collected from 37 organoids from 4 biologically independent samples from 4 independent experiments; primary data: 189,409 cells from 5 biologically independent samples from 5 experiments,****p= 2.0e−24, two-sided Welch’s t-test). A similar analysis was performed comparing the primary data from this study to the data collected by microfluidic approaches from Nowakowski et al. Although the ages, capture method, and number of cells varied greatly, subtype correlation between the published primary data and the data in this study is significantly higher than the subtype similarity between organoids and primary samples (Nowakowski data: n= 4,261 cells from 48 biologically independent samples across more than 35 independent experiments, ****p=2.0e−5). We additionally performed this analysis between two published datasets in the adult human, comparing middle temporal gyrus (MTG, Hodge et al 2019, n= 15,928 cells) from an older adult with distinct brain regions from young adults in the control samples of an autism spectrum disorder study (ASD, Velmeshev et al 2019, n= 104, 559). Despite differences across ages and individuals, who could be expected to have unique cortical gene expression profiles based upon sensory experience, the distinct cortical regions isolated and the different capture methods, the subtype correlation between these two primary datasets is significantly higher than the correlation between organoid cells and primary cells (**p=0.0076). c) Subtype correlation as calculated and shown in Figure 2 which is broken down by protocol and pluripotent line where the graph bars indicate subtype correlation and error bars are standard deviation. The least directed protocol was significantly better at recapitulating cell subtype than the most directed protocol (*p= 0.0483, two-sided Welch’s t-test) which is consistent with the recent findings from Velasco et al. We also observed that the iPSC line 1323_4 generated significantly more similar subtypes to primary samples than WTC10 or H1 (**p=0.0013, 0.0089 respectively). d) Clustering and subtype analysis was performed between all organoids and primary PFC samples and primary V1 individually. Subtype correlation did not change regardless of which area the organoids were compared to. “Overall” refers to the subtype correlation observed when comparing all organoids cells to all primary cells and is shown for comparison. Histogram bars show subtype correlation and error bars are standard deviation (n=242,349 cells from 37 organoids across 4 independent experiments). e) Subtype correlation analysis was performed across all organoid stages (n=week 3: 38,417 cells, week 5: 26,787 cells, week 8: 11,023 cells, week 10: 50,550 cells, week 15: 2,722 cells, week 24: 4,506 cells from 4 independent experiments) and all primary ages (n= GW6: 5,970 cells, GW10: 7,194 cells, GW14: 14,435 cells, GW18: 78,157 cells, GW22: 83,653 cells from 5 independent experiments). Histogram bars show subtype correlation and error bars are standard deviation. Week 3 organoids are more similar to younger primary stages, while week 15 organoids are most similar to older primary ages. Other ages correspond similarly well to the primary stages of peak neurogenesis (GW10-24), while all together, the organoids are most significantly similar to GW14 (**p= 0.0015, two-sided Welch’s t-test). “Overall” refers to the subtype correlation observed when comparing all organoids cells to all primary cells and is shown for comparison. The last histogram shows the average gene score of each sample and error bars are standard deviation. Younger primary samples and organoids have a relatively lower gene score related to their marker specificity; this specificity increases substantially over time in primary cells but less so in organoid cells.
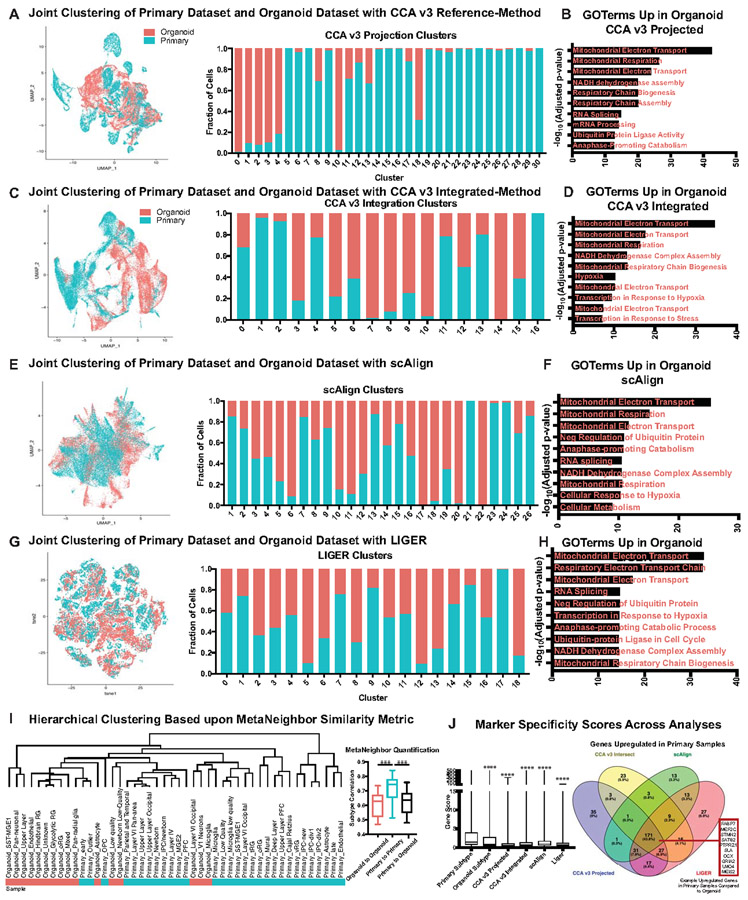
Extended Data Figure 8. Co-clustering of Primary and Organoid Single-cell Datasets with CCA, scAlign, LIGER and MetaNeighbor.
a) Canonical correlation analysis from Seurat v3 was performed using the reference-based integration. For this analysis, 20,000 cells were randomly subsetted from both the primary and organoid datasets and their counts matrices were merged. The primary samples were designated as the reference, and using CCA the organoid cells were projected into that reference space. A UMAP plot of the intersection is shown. The stacked histogram shows the relative contributions of each sample to each cluster. Most clusters were primarily one dataset or the other, validating the observations of limited primary subtype recapitulation in organoids. b) For the clusters with at least 20% contribution from both primary and organoid cells, differential expression was performed across all of these clusters jointly using a two-sided Wilcoxon rank sum test. The full differential expression is presented in STable 5, but genes upregulated in organoid cells were examined with Enrichr pathway analysis, and a summary of the top Gene Ontology terms are presented (organoid: n=20,000 cells from 37 organoids across 4 independent experiments; primary: n=20,000 cells from 5 individuals across 5 independent experiments). c) Canonical correlation analysis from Seurat v3 was performed using the integration based method. For this analysis, 20,000 cells were randomly subsetted from both the primary and organoid datasets and their counts matrices were merged. A UMAP plot of the intersection is shown. The stacked histogram shows the relative contributions of each sample to each cluster. Most clusters were primarily one dataset or the other, validating the observations of limited primary subtype recapitulation in organoids. d) For the clusters with at least 20% contribution from both primary and organoid cells, differential expression was performed across all of these clusters jointly using a two-sided Wilcoxon rank sum test. The full differential expression is presented in STable 5, but genes upregulated in organoid cells were examined with Enrichr pathway analysis, and a summary of the top Gene Ontology terms are presented (organoid: n=20,000 cells from 37 organoids across 4 independent experiments; primary: n=20,000 cells from 5 individuals across 5 independent experiments). e) scAlign was performed for integration of datasets. For this analysis, 20,000 cells were randomly subsetted from both the primary and organoid datasets and their counts matrices were merged. A UMAP plot of the intersection is shown. The stacked histogram shows the relative contributions of each sample to each cluster. Many clusters were primarily one dataset or the other, validating the observations of limited primary subtype recapitulation in organoids. f) For the clusters with at least 20% contribution from both primary and organoid cells, differential expression was performed across all of these clusters jointly using a two-sided Wilcoxon rank sum test. The full differential expression is presented in STable 5, but genes upregulated in organoid cells were examined with Enrichr pathway analysis, and a summary of the top Gene Ontology terms are presented (organoid: n=20,000 cells from 37 organoids across 4 independent experiments; primary: n=20,000 cells from 5 individuals across 5 independent experiments). g) LIGER was performed for integration of datasets. For this analysis, 20,000 cells were randomly subsetted from both the primary and organoid datasets and their counts matrices were merged. A UMAP plot of the intersection is shown. The stacked histogram shows the relative contributions of each sample to each cluster. Although the clusters were well mixed, they had very diffuse marker gene expression suggesting key biological drivers of variation were obscured by the analysis. h) For the clusters with at least 20% contribution from both primary and organoid cells, differential expression was performed across all of these clusters jointly using a two-sided Wilcoxon rank sum test. The full differential expression is presented in STable 5, but genes upregulated in organoid cells were examined with Enrichr pathway analysis, and a summary of the top Gene Ontology terms are presented (organoid: n=20,000 cells from 37 organoids across 4 independent experiments; primary: n=20,000 cells from 5 individuals across 5 independent experiments). i) MetaNeighbor was performed using unsupervised analysis to compare the clusters from primary and organoid samples. MetaNeighbor uses cell-cell similarity scores based upon neighbor voting and AUROC calculations to quantify the similarities between cells. These pairwise values were used as an input to hierarchical clustering, and almost entirely segregated primary clusters from organoid clusters. Box and whiskers plot shows quantification of the similarities within organoid and primary datasets versus the comparison of the two showed the primary alone comparisons were significantly higher (organoid to organoid: ***p= 0.00078; primary to organoid: ***p= 0.00036, two-sided Welch’s t-test) (organoid: n=20,000 cells from 37 organoids across 4 independent experiments; primary: n=20,000 cells from 5 individuals across 5 independent experiments). The bars show range of subtype correlation with middle line indicating the mean and error bars the maximum and minimum. These results further validate our observations that there are important distinctions between the organoid and primary subtypes j) The gene score for each of the 4 integration methods is presented, and all are significantly lower than primary clustering alone (organoid subtype: ****p=5.3e−38; CCA v3 Projected: ****p5.5e−94; CCA v3 Integrated: ****p=2.8e−24; scAlign: ****p=2.1e−23; LIGER: ****p=2.9e−94, two-sided Welch’s t-test). The one method that substantially integrated the samples (LIGER) had the lowest gene score. Box and whisker plot shows average mean score and error bars are max and minimum (n=242,349 cells from 37 organoids across 4 independent experiments). The differentially expressed genes that were upregulated in primary samples from all 4 analyses were intersected. A significant number of these genes were found in all 4 datasets, and these genes included examples that we identified from other methods in this study, including PTPRZ1, MEF2C and SATB2, validating the accuracy of our analytical methods and our main findings.
Extended Data Figure 9. Comparing Cell Type Specification in Primary and Organoid Samples.
a) Variance Partition was run on both primary and organoid datasets across the metadata properties shown. Each dot represents a gene and the amount of variance of that gene explained by the relevant metadata property. b) ChEA analysis of type genes identified in primary cortical samples. X-axis shows the −log10(adjusted p-value) of the transcription factors indicated; results obtained from Enrichr, datasets included a variety of experimental systems but have been shortened for ease of reading to the relevant transcription factor (n=189,409 cells from 5 biologically independent samples; two-sided Wilcoxin rank sum test). Type genes in organoid samples were not unified for significant transcription factor regulation. c) Violin plots of radial glia and neuron markers in primary (orange) and organoid (blue) radial glia and neurons where width of colored section indicates distribution of expression of each data point within a sample. In some cases, organoids have expression of multiple markers, lower expression of key markers, or similar expression as seen in primary samples (organoids: n=242,349 cells from 37 organoids across 4 independent experiments; primary: n=189,409 cells from 5 biologically independent samples from 5 independent experiments). d) Dotplots from Figure 2 shown with one color only in order to avoid dot overlap. e) Lower magnification images of PTPRZ1 and HOPX overlap as shown in Figure 2C shows domains of overlapping expression in the primary oSVZ and distinct domains of expression in the organoid ventricular zone. Validation stains were repeated independently three times.
Extended Data Figure 10. Molecular Maturation Analysis.
a) WGCNA networks generated from annotated primary radial glia, as described in methods, were applied to both primary and organoid radial glia cells. Module eigengenes shown in the heatmap indicate overall higher expression in primary compared to organoid radial glia. b) Pseudoage (x-axis) versus actual age (y-axis) in PFC and V1 radial glia showing PFC are more mature than V1 radial glia. c) Box and whisker plot (min to max, bar at mean) across all cells within a single organoid from all organoids within this study show heterogeneity of maturation is within a single organoid and not between individuals (n=242,349 cells from 37 organoids across 4 independent experiments). d) The parallel pseudoage analysis to the analysis in Fig 3C is shown, but starting with organoid networks for the pseudoage calculation. Graph line shows mean pseduoage score against actual age, shading represents the geometric density standard error of the regression. The same pattern is observable, with organoids failing to recapitulate the molecular maturation of primary radial glia, though genes related to the switch from neurogenesis to gliogenesis are preserved and may account for some of the limited correlation.
Extended Data Figure 11. Areal Identification.
a) Organoid areal assignments by age, line, and protocol indicates heterogeneous areal identity. b) Heatmaps showing normalized module eigengene signature of each area in primary samples (with known area on the right) and in organoid samples. c) Summary of assigned area in primary samples compared to actual area. In many cases, they correspond strongly, while in others there is evidence of lack of distinction. For example, parietal cells still strongly express temporal signatures suggesting they have not yet been distinctly specified in primary samples though this specification does exist in organoids. d) Box and whisker plot (min to max, bar at mean, error bars of standard deviation) is the same comparison as shown in Figure 4C, but across all areas (Primary: n = 122958 excitatory neurons from 5 individuals from 5 independent experiments; Organoids: n = 97531 excitatory neurons from 37 organoids from 4 biologically independent stem cell lines. In some cases there is no significant difference between strength of area signal in primary cells and organoid cells (PFC, n.s. p= 0.5373), in other cases either the primary or organoid sample is significantly stronger (Motor: *p = 0.0148 all other areas: ****p<0.0001, Welch’s two-sided t-test).
Extended Data Figure 12. Glycolysis and ER stress Across Culture Systems.
a) Markers of metabolic stress are expressed across cortical organoid protocols. Violin plots show data both from our experiments (1-3) and published data sets from other protocols (4-12) which have significantly increased expression of the glycolysis gene PGK1, and the ER stress genes ARCN1 and GORASP2 compared to primary samples (n= 5 individual replicates, GW14 shown). Width of the colored area indicates mean gene expression level of each data set and overlaid dots show each individual data point. All protocols have significantly higher expression of these three markers compared to primary samples (****p= < 0.0001, two-sided Student’s t-test). b) Single cell sequencing identified increased expression of genes in organoids which were validated across all stages of organoid differentiation evaluated (week 3-14). Validation staining experiments were repeated independently three times. Representative images from week 14 organoids differentiated using the ‘least directed’ differentiation protocol. Colonies of iPSCs also express the ER stress markers ARCN1 and GORASP2 (n=3 biologically independent samples across three experiments). Scale bar = 50 uM. c) Primary cortical tissue express glycolysis and ER stress genes at undetectable levels (n=3 biologically independent samples across three experiments). When tissue was cultured for one week, there was no significant increase in cellular stress (n=3 biologically independent samples across three experiments). Scale bar = 50 uM.
Extended Data Figure 13. Glycolysis and ER Stress Across Experimental Conditions.
a) Metabolic stress network module eigengene expression across all cells is shown in box and whisker plots (min to max, bar at average, error bars of standard deviation) across 11 datasets generated either in this manuscript or from publicly available datasets. Data is shown for expressed genes from KEGG pathway glycolysis and ER stress networks (This study: n=242,349 cells from 37 organoids across 4 independent experiments; published datasets as annotated). b) The same box and whisker plots (min to max, bar at average, error bars of standard deviation) are shown for organoid (n=week 3: 38,417 cells, week 5: 26,787 cells, week 8: 11,023 cells, week 10: 50,550 cells, week 15: 2,722 cells, week 24: 4,506 cells from 4 independent experiments) and all primary ages (n= GW6: 5,970 cells, GW10: 7,194 cells, GW14: 14,435 cells, GW18: 78,157 cells, GW22: 83,653 cells from 5 independent experiments). ER stress and glycolysis networks decrease over time in primary samples but decrease less in organoids and are significantly higher in most organoid stages than primary samples. Significance was calculated for each organoid sample with respect to each primary sample, and a one-sided Welch’s t-test was performed (to evaluate if organoid was higher than primary). All comparisons were either not significant (ns) or significant with ****p < 0.0001. c) Cellular stress genes are expressed at low levels during human cortical development. GW13 and 17 samples were stained for the glycolysis gene, PGK1, and showed little expression at either age. The ER stress gene, ARCN1, had little expression at either age, however there was modest expression of the ER stress gene, GORASP2, at GW13 that decreased by later neurogenesis. Staining validation studies were performed independently four times. d) Dissociated primary cells were cultured for one week. Across five independent studies , there was no detectable expression of the glycolysis gene, PGK1, however the ER stress genes, ARCN1 and GORASP2, significantly increased. e) Immunostaining of primary aggregates (n=5 biologically independent samples), which express markers of oRG cells (HOPX and SOX2), IPCs (TBR2) and neurons (CTIP2). Aggregates also had increased cellular stress indicated by PGK1, ARCN1 and GORASP2 staining. Violin plots show expression level and data distribution for each maker in primary cells, primary cells after organoid transplantation and primary cells after being aggregated together. The expression of PGK1 and GORASP2 are increased in post-transplanted primary cells from the organoid as well as in primary cell aggregates. Cell types and physical distribution in the primary aggregate are shown, scale bar = 50 mM, representative image shown (n = 3 replicates).
Extended Data Figure 14. Organoid Transplantation at Multiple Timepoints.
a) Fluorescence associated cell sorting (FACS) plots showing dummy infection (left) and transplanted organoids (right) in terms of the their GFP signal [x-axis] vs sidesscatter [y-axis]. Cells in gated region were collected (% of parent written on plot) and sequenced for transplantations 2.5 weeks after incubating in the organoid, representative plot shown on right, n=5. b) Immunohistochemical validation of cells infected with GFP virus were all SOX2 labeled progenitor in cells dissociated from primary cortical tissue GW14-20. Scale bar = 50 mM, representative image shown (n = 5 replicates). c) An additional example of primary cell integration into organoids after transplant, where the primary cells integrate into organoid rosettes (n=7 primary samples into 21 organoids across 2 independent studies). d) tSNE of pre- and post-transplant primary cells, as well as the cluster designations. Many cell types represented in pre-transplanted cells are not present in the post-transplant population. e) Subtype similarity correlation between pre-transplant, post-transplant, and primary aggregate samples. Includes plot (bar is average subtype correlation, error bars are standard error) as a replicate to the experiment in Figure 5B, validating that at older organoid ages (week 12) the post-transplanted cells are still significantly impaired in their subtype specification (****p = 1.46e−11 n = 2 primary biologically independent samples into 2 organoids in addition to n = 5 biologically independent samples into 10 organoids in Figure 5, two-sided Welch’s t-test). Primary aggregates are significantly impaired in their subtype specification (**p = 0.0016), but are significantly better than post-transplanted primary cells (**p= 0.0037). This may be related to non-neural populations in the aggregates. f) Transplanted organoid cells were visualized in the mouse cortex after 2 and 5 weeks post-transplant (n=13 independent mice transplanted with 14 organoids derived from 2 iPSC lines across 2 independent experiments). Human cells were visualized by GFP and human nuclear antigen (HNA) expression. Organoid-derived cells expressed markers of progenitors (SOX2 and PAX6), neurons (CTIP2, SATB2, NEUN) and astrocytes (GFAP, HOPX). Mouse-derived vascular cells (Laminin & CD31) innervate the organoid transplant. g) After 2 weeks post-transplantation, organoid cells have reduced expression of the glycolysis gene, PGK1, and ER stress genes, ARCN1 and GORASP2 (n=6 transplanted mice stained with each marker independently from 2 iPSC lines across 2 independent experiments). h) Subtype correlation analysis of pre- and post- transplanted organoid cells shows an increase in oRG subtype identity (similarity to primary cluster 26) and in newborn neurons (similarity to primary cluster 22).
Supplementary Material
Acknowledgments
The authors thank Q Bi, S Wang, W Walantus, C Villareal, A Alvarez-Buylla, C Kim, O Meyerson, and members of the A.R.K laboratory for providing resources, technical help and helpful discussions. This study was supported by NIH award U01MH114825 A.R.K., and F32NS103266 and K99NS111731 to A.B, as well as by the California Institute for Regenerative Medicine (CIRM) through the CIRM Center of Excellence in Stem Cell Genomics (GC1R-06673-C to A.R.K.).
Footnotes
Competing Interests
The authors declare no competing interests.
Data Availability Statement
Single-cell RNA sequencing data has been deposited in dbGAP for accession “A Cellular Resolution Census of the Developing Human Brain” and in GSE132672. An interactive browser of single cell data and raw and processed counts matrices can be found at the UCSC cell browser website: https://organoidreportcard.cells.ucsc.edu. Source data for Figures 1-5 and Extended Data Figures 1-14 are available with the paper. Remaining source data can be retrieved directly from the single-cell data available in public repositories or from the UCSC cell browser website.
References
- 1.Kadoshima T et al. Self-organization of axial polarity, inside-out layer pattern, and species-specific progenitor dynamics in human ES cell-derived neocortex. Proceedings of the National Academy of Sciences of the United States of America 110, 20284–20289, doi: 10.1073/pnas.1315710110 (2013). [DOI] [PMC free article] [PubMed] [Google Scholar]
- 2.Lancaster MA et al. Cerebral organoids model human brain development and microcephaly. Nature 501, 373–379, doi: 10.1038/nature12517 (2013). [DOI] [PMC free article] [PubMed] [Google Scholar]
- 3.Camp JG et al. Human cerebral organoids recapitulate gene expression programs of fetal neocortex development. Proceedings of the National Academy of Sciences of the United States of America 112, 15672–15677, doi: 10.1073/pnas.1520760112 (2015). [DOI] [PMC free article] [PubMed] [Google Scholar]
- 4.Pollen AA et al. Establishing Cerebral Organoids as Models of Human-Specific Brain Evolution. Cell 176, 743–756 e717, doi: 10.1016/j.cell.2019.01.017 (2019). [DOI] [PMC free article] [PubMed] [Google Scholar]
- 5.Velasco S et al. Individual brain organoids reproducibly form cell diversity of the human cerebral cortex. Nature 570, 523–527, doi: 10.1038/s41586-019-1289-x (2019). [DOI] [PMC free article] [PubMed] [Google Scholar]
- 6.Camp JG et al. Multilineage communication regulates human liver bud development from pluripotency. Nature 546, 533–538, doi: 10.1038/nature22796 (2017). [DOI] [PubMed] [Google Scholar]
- 7.Wu H et al. Comparative Analysis and Refinement of Human PSC-Derived Kidney Organoid Differentiation with Single-Cell Transcriptomics. Cell Stem Cell 23, 869–881 e868, doi: 10.1016/j.stem.2018.10.010 (2018). [DOI] [PMC free article] [PubMed] [Google Scholar]
- 8.Sloan SA et al. Human Astrocyte Maturation Captured in 3D Cerebral Cortical Spheroids Derived from Pluripotent Stem Cells. Neuron 95, 779–790 e776, doi: 10.1016/j.neuron.2017.07.035 (2017). [DOI] [PMC free article] [PubMed] [Google Scholar]
- 9.Amiri A et al. Transcriptome and epigenome landscape of human cortical development modeled in organoids. Science 362, doi: 10.1126/science.aat6720 (2018). [DOI] [PMC free article] [PubMed] [Google Scholar]
- 10.Mansour AA et al. An in vivo model of functional and vascularized human brain organoids. Nature biotechnology 36, 432–441, doi: 10.1038/nbt.4127 (2018). [DOI] [PMC free article] [PubMed] [Google Scholar]
- 11.Eiraku M et al. Self-organized formation of polarized cortical tissues from ESCs and its active manipulation by extrinsic signals. Cell Stem Cell 3, 519–532, doi: 10.1016/j.stem.2008.09.002 (2008). [DOI] [PubMed] [Google Scholar]
- 12.Xiang Y et al. Fusion of Regionally Specified hPSC-Derived Organoids Models Human Brain Development and Interneuron Migration. Cell Stem Cell 21, 383–398 e387, doi: 10.1016/j.stem.2017.07.007 (2017). [DOI] [PMC free article] [PubMed] [Google Scholar]
- 13.Quadrato G et al. Cell diversity and network dynamics in photosensitive human brain organoids. Nature 545, 48–53, doi: 10.1038/nature22047 (2017). [DOI] [PMC free article] [PubMed] [Google Scholar]
- 14.Giandomenico SL et al. Cerebral organoids at the air-liquid interface generate diverse nerve tracts with functional output. Nature neuroscience 22, 669–679, doi: 10.1038/s41593-019-0350-2 (2019). [DOI] [PMC free article] [PubMed] [Google Scholar]
- 15.Marton RM et al. Differentiation and maturation of oligodendrocytes in human three-dimensional neural cultures. Nature neuroscience 22, 484–491, doi: 10.1038/s41593-018-0316-9 (2019). [DOI] [PMC free article] [PubMed] [Google Scholar]
- 16.Pasca AM et al. Human 3D cellular model of hypoxic brain injury of prematurity. Nat Med 25, 784–791, doi: 10.1038/s41591-019-0436-0 (2019). [DOI] [PMC free article] [PubMed] [Google Scholar]
- 17.Lui JH, Hansen DV & Kriegstein AR Development and evolution of the human neocortex. Cell 146, 18–36, doi: 10.1016/j.cell.2011.06.030 (2011). [DOI] [PMC free article] [PubMed] [Google Scholar]
- 18.Gotz M & Huttner WB The cell biology of neurogenesis. Nat Rev Mol Cell Biol 6, 777–788, doi: 10.1038/nrm1739 (2005). [DOI] [PubMed] [Google Scholar]
- 19.Nowakowski TJ et al. Spatiotemporal gene expression trajectories reveal developmental hierarchies of the human cortex. Science 358, 1318–1323, doi: 10.1126/science.aap8809 (2017). [DOI] [PMC free article] [PubMed] [Google Scholar]
- 20.Mayer C et al. Developmental diversification of cortical inhibitory interneurons. Nature 555, 457–462, doi: 10.1038/nature25999 (2018). [DOI] [PMC free article] [PubMed] [Google Scholar]
- 21.Pollen AA et al. Molecular identity of human outer radial glia during cortical development. Cell 163, 55–67, doi: 10.1016/j.cell.2015.09.004 (2015). [DOI] [PMC free article] [PubMed] [Google Scholar]
- 22.Nowakowski TJ, Pollen AA, Sandoval-Espinosa C & Kriegstein AR Transformation of the Radial Glia Scaffold Demarcates Two Stages of Human Cerebral Cortex Development. Neuron 91, 1219–1227, doi: 10.1016/j.neuron.2016.09.005 (2016). [DOI] [PMC free article] [PubMed] [Google Scholar]
- 23.Vaid S et al. A novel population of Hopx-dependent basal radial glial cells in the developing mouse neocortex. Development 145, doi: 10.1242/dev.169276 (2018). [DOI] [PubMed] [Google Scholar]
- 24.Harrington AJ et al. MEF2C regulates cortical inhibitory and excitatory synapses and behaviors relevant to neurodevelopmental disorders. Elife 5, doi: 10.7554/eLife.20059 (2016). [DOI] [PMC free article] [PubMed] [Google Scholar]
- 25.Barbosa AC et al. MEF2C, a transcription factor that facilitates learning and memory by negative regulation of synapse numbers and function. Proceedings of the National Academy of Sciences of the United States of America 105, 9391–9396, doi: 10.1073/pnas.0802679105 (2008). [DOI] [PMC free article] [PubMed] [Google Scholar]
- 26.Langfelder P & Horvath S WGCNA: an R package for weighted correlation network analysis. BMC bioinformatics 9, 559, doi: 10.1186/1471-2105-9-559 (2008). [DOI] [PMC free article] [PubMed] [Google Scholar]
- 27.Tasic B et al. Shared and distinct transcriptomic cell types across neocortical areas. Nature 563, 72–78, doi: 10.1038/s41586-018-0654-5 (2018). [DOI] [PMC free article] [PubMed] [Google Scholar]
- 28.Saunders A et al. Molecular Diversity and Specializations among the Cells of the Adult Mouse Brain. Cell 174, 1015–1030 e1016, doi: 10.1016/j.cell.2018.07.028 (2018). [DOI] [PMC free article] [PubMed] [Google Scholar]
- 29.Zeisel A et al. Molecular Architecture of the Mouse Nervous System. Cell 174, 999–1014 e1022, doi: 10.1016/j.cell.2018.06.021 (2018). [DOI] [PMC free article] [PubMed] [Google Scholar]
- 30.Cadwell CR, Bhaduri A, Mostajo-Radji MA, Keefe MG & Nowakowski TJ Development and Arealization of the Cerebral Cortex. Neuron 103, 980–1004, doi: 10.1016/j.neuron.2019.07.009 (2019). [DOI] [PMC free article] [PubMed] [Google Scholar]
- 31.Simi A & Studer M Developmental genetic programs and activity-dependent mechanisms instruct neocortical area mapping. Current opinion in neurobiology 53, 96–102, doi: 10.1016/j.conb.2018.06.007 (2018). [DOI] [PubMed] [Google Scholar]
- 32.Yoshida A & Tani K Phosphoglycerate kinase abnormalities: functional, structural and genomic aspects. Biomed Biochim Acta 42, S263–267 (1983). [PubMed] [Google Scholar]
- 33.Izumi K et al. ARCN1 Mutations Cause a Recognizable Craniofacial Syndrome Due to COPI-Mediated Transport Defects. Am J Hum Genet 99, 451–459, doi: 10.1016/j.ajhg.2016.06.011 (2016). [DOI] [PMC free article] [PubMed] [Google Scholar]
- 34.Gee HY, Noh SH, Tang BL, Kim KH & Lee MG Rescue of DeltaF508-CFTR trafficking via a GRASP-dependent unconventional secretion pathway. Cell 146, 746–760, doi: 10.1016/j.cell.2011.07.021 (2011). [DOI] [PubMed] [Google Scholar]
- 35.Kim J et al. Monomerization and ER Relocalization of GRASP Is a Requisite for Unconventional Secretion of CFTR. Traffic 17, 733–753, doi: 10.1111/tra.12403 (2016). [DOI] [PubMed] [Google Scholar]
- 36.Laguesse S et al. A Dynamic Unfolded Protein Response Contributes to the Control of Cortical Neurogenesis. Dev Cell 35, 553–567, doi: 10.1016/j.devcel.2015.11.005 (2015). [DOI] [PubMed] [Google Scholar]
- 37.Tseng KY et al. MANF Is Essential for Neurite Extension and Neuronal Migration in the Developing Cortex. eNeuro 4, doi: 10.1523/ENEURO.0214-17.2017 (2017). [DOI] [PMC free article] [PubMed] [Google Scholar]
- 38.Shekhar K et al. Comprehensive Classification of Retinal Bipolar Neurons by Single-Cell Transcriptomics. Cell 166, 1308–1323 e1330, doi: 10.1016/j.cell.2016.07.054 (2016). [DOI] [PMC free article] [PubMed] [Google Scholar]
- 39.Peng YR et al. Molecular Classification and Comparative Taxonomics of Foveal and Peripheral Cells in Primate Retina. Cell 176, 1222–1237 e1222, doi: 10.1016/j.cell.2019.01.004 (2019). [DOI] [PMC free article] [PubMed] [Google Scholar]
- 40.Butler A, Hoffman P, Smibert P, Papalexi E & Satija R Integrating single-cell transcriptomic data across different conditions, technologies, and species. Nature biotechnology 36, 411–420, doi: 10.1038/nbt.4096 (2018). [DOI] [PMC free article] [PubMed] [Google Scholar]
- 41.Hoffman GE & Schadt EE variancePartition: interpreting drivers of variation in complex gene expression studies. BMC bioinformatics 17, 483, doi: 10.1186/s12859-016-1323-z (2016). [DOI] [PMC free article] [PubMed] [Google Scholar]
Associated Data
This section collects any data citations, data availability statements, or supplementary materials included in this article.


