Abstract
Application of a protease inhibitor, 4-(2-aminoethyl) benzenesulfonyl fluoride (AEBSF), during the cell culture process was demonstrated to effectively reduce proteolytic activity at a specific amino acid site during the production of an HIV-1 broadly neutralizing antibody (bNAb). However, the addition of AEBSF could potentially introduce some modifications to the bNAb protein. Experimental design from sample preparation to LC-MS characterization was performed using middle-up and bottom-up approaches to identify AEBSF-modified species for the bNAb using an AEBSF supplementation in the cell culture media. Modified species along with the unmodified control sample were also subjected to binding activity assessment. The results showed that two amino acids (Tyr177 and Lys250) were susceptible to AEBSF modification in the bNAb test articles but at a negligible level and not in the CDR regions, which therefore did not reduce the in vitro binding activity of the bNAb.
Keywords: LC-MS, AEBSF, Protease inhibitor, Antibody, Modification
Introduction
In biopharmaceutical drug development, protein degradation is observed occasionally during the production of monoclonal antibodies (mAbs), which puts the product quality into question [1, 2]. Proteolysis is one of the major causes for mAb degradation and may lead to a decline in the molecular bioactivity [3, 4]. This phenomenon was observed during the fed-batch cell culture work of an anti-HIV-1 broadly neutralizing antibody (bNAb), where site-specific clipping was discovered [5]. Various approaches were thereafter developed to control the clipping of the bNAb, including (1) re-engineering/mutating the susceptible amino acid, (2) regulating the protease concentration using different bioreactor configurations, and (3) supplementing a protease inhibitor during the cell culture stage [6].
Among the three parallel approaches, 4-(2-aminoethyl) benzenesulfonyl fluoride (AEBSF) was added to the cell culture media as one of the protease inhibitor options, which irreversibly inhibits serine proteases in the cell culture and effectively reduced the clipping percentage of this bNAb. A workflow with AEBSF addition to reduce protein clipping took much less time for process optimization than the other two strategies mentioned above. However, this approach is not commonly used for commercialized protein production yet.
One of the reasons is due to the limited understanding of AEBSF degradation pathways and its effect on the active protein, which may raise the safety concerns of the drug product. AEBSF-bound proteases are expected to be removed during the host cell protein (HCP) clearance process [7], where free AEBSF and its degradant can also be potentially eliminated during purification processes [8, 9]. In addition, AEBSF is known to be an electro-phile targeting nucleophilic atoms and may modify amino acid side chains of the bNAb, including Arg, His, Lys, Asp, Glu, Ser, Thr, Asn, Gln, Cys, and Tyr [10]. Among those amino acids, some are unlikely to be modified by AEBSF. Firstly, Arg with a guanidinium ion represents an efficient resonance structure, which prevents the reaction with AEBSF under the aqueous incubation condition at 37 °C and pH 7.0 [10, 11]. Secondly, if any one of the Asp, Glu, Asn, and Gln reacts with AEBSF, it yields an anhydride-like compound, which is unstable in aqueous solution and likely to convert back to its original amino acid structure [12]. Lastly, most Cys in the bNAb forms disulfide bonds, so a very low percentage of free thiols are likely to be available for AEBSF modifications to occur. Most likely only 5 amino acids, i.e., His, Lys, Ser, Thr, and Tyr, can potentially react with AEBSF, which has been reported elsewhere to be modified by other sulfonyl fluoride compounds [13]. However, little characterization work has been reported in-depth for the potential formation of protease inhibitor–modified byproducts. Therefore, characterization of the bNAb was needed to pinpoint the AEBSF-modified amino acid, assess the level of modified species, and determine its effect on molecular bioactivity.
Therefore, LC-MS and in vitro potency methods were developed to tackle this challenge using the following three types of samples: (1) negative control—the purified bNAb without AEBSF modifications; (2) positive control—the purified bNAb containing an elevated level of AEBSF modification species by forced treatment; and (3) bNAb research material (also named test articles later), which was exposed to AEBSF supplementation during the cell culture process. LC-MS analysis was able to accurately identify the AEBSF-modified amino acid sites on the bNAb and determine its relative abundance. Additionally, a potency assessment was applied to characterize the in vitro binding activity in correlation with the AEBSF modifications on the bNAb.
Experimental section
Chemicals and reagents
The following reagents were LC-MS grade: water was purchased from OmniSolv (Billerica, MA), acetonitrile (ACN) was purchased from J. T. Baker (Center Valley, PA), and formic acid (FA) was purchased from Thermo Fisher Scientific (Rockford, IL). The rest of the chemicals were analytical grade: guanidine HCl, AEBSF-HCl, and dithiothreitol (DTT) were purchased from G-Biosciences (St. Louis, MO). 2-Iodoacetamide (IAM) was purchased from Thermo Fisher Scientific, and 1 M Tris HCl buffer (pH 7.0) was purchased from Rockland (Limerick, PA). IdeS, trypsin, and PNGase F were purchased from Promega (Madison, WI). Rapid PNGase F was purchased from New England Lab (Ipswich, MA). Amicon filters were purchased from Millipore Sigma (Burlington, MA). A 10× Kinetics Buffer used for the potency analysis was purchased from ForteBio Inc. (Menlo Park, CA).
Preparation of the negative and positive bNAb controls
The purified bNAb standard generated from a perfusion process with a clipping percentage less than 1% (without exposure to AEBSF) was prepared in-house and diluted to 7 mg/mL (to mimic the fed-batch harvest concentration) in 100 mM Tris buffer at pH 7.0. To prepare the positive control, the purified bNAb was incubated at 37 °C at pH 7.0 with a daily addition of 500 μM of AEBSF for 3 and 7 days in two experimental designs. To prepare the negative control, the same volume of water (instead of AEBSF solution) was added daily to the purified bNAb for 7 days.
Preparation of samples for LC-MS subunit analysis
Twenty micrograms of each bNAb sample was digested with 50 units of IdeS and 10 units of PNGase F at 37 °C (pH 7.8) for 2 h. The samples were then incubated at 50 °C for 30 min with 1 μL Rapid PNGase F (5× dilution) to ensure complete deglycosylation, followed by a reduction with 25 mM DTT at 37 °C for 30 min.
Preparation of samples for peptide mapping analysis
Twenty micrograms of each bNAb sample was denatured with 6 M guanidine and reduced with 25 mM DTT at 37 °C for 30 min, followed by alkylation with 50 mM IAM at room temperature in the dark for 30 min. Each sample was buffer exchanged to 50 mM ammonium bicarbonate buffer (pH 7.8) using a 3-kDa Amicon filter. Twenty microliters of each sample was recovered and digested with 2 μg of trypsin at 37 °C for 4 h. FA (1% v/v) was used to terminate the digestion.
LC-MS analysis
The Acquity H-Class Bio UPLC system (Waters, Milford, MA) was operated using MassLynx v.4.1. Mobile phases A and B consisted of 0.1% (v/v) FA in water and ACN, respectively, delivering at a flow rate of 0.2 mL/min.
For subunit analysis, the UPLC system was coupled with a Synapt G2 QTof mass spectrometer (Waters). The samples were injected onto a BEH C8 column (Acquity, 1.7 μm, 2.1 mm × 50 mm) heated at 80 °C. The system was equilibrated at 25% mobile phase B for 2 min, and then the mobile phase B increased linearly to 37% from 2.0 to 9.0 min. The column was then washed with 90% mobile phase B from 9.1 to 12.0 min and re-equilibrated from 12.1 to 17.0 min at the starting conditions. The mass spectrometer was operated in a positive ionization mode with a detection range of 600–4500 m/z. The capillary voltage, desolvation temperature, and source temperature were set to 3.0 kV, 350 °C, and 100 °C, respectively. MassLynx v.4.1 was used for data processing.
For peptide mapping analysis, the UPLC system was coupled with a Q Exactive HF mass spectrometer (Thermo Fisher Scientific). The samples were injected onto a BEH C18 column (Acquity, 1.7 μm, 2.1 mm × 150 mm) heated at 65 °C. The system was equilibrated at 3% mobile phase B for 1 min. Mobile phase B then increased linearly to 43% from 1 to 91 min and to 90% from 91 to 100 min. The column was washed with 90% mobile phase B from 100 to 102 min and followed by re-equilibration with 3% mobile phase B from 103 to 113 min. The mass spectrometer was operated in a positive ionization mode. The capillary voltage was 3.5 kV, and the desolvation temperature was 250 °C. Data-dependent acquisition MS/MS method was set up as the following: each full mass scan was acquired at the detection range of 150–2000 Da (resolution 60,000 FWHM), followed by 10 MS/MS scans (resolution 15,000 FWHM), with the normalized collision energy at 27%. BioPharma Finder v.2.0 was applied for data processing by setting up the customized post-translational modification (PTM) on each amino acid with the mass shift of + 183.035 Da. The peaks related to AEBSF modification (> 1% using the software for relative quantification) were manually verified afterwards. All charge state signals of the peptide were applied to quantify each AEBSF modification percentage, i.e., full-scan MS peak areas of the AEBSF-modified peptide were divided by the sum of the AEBSF-modified and non-modified peptides.
In vitro potency and clipping percentage analysis
An in vitro binding assay was employed against in-house HIV trimer using a biolayer interferometry technique on an Octet Red device (ForteBio Inc., CA). Each bNAb sample was serially diluted to 7 concentrations at 1.56, 0.78, 0.39, 0.20, 0.10, 0.05, and 0.02 μg/mL using a diluted (1x) Kinetics Buffer. A set of ProA biosensors was sequentially dipped into the bNAb samples followed by a wash and equilibration step in trimer solution. The response of each sample was plotted against its concentration (log scale) using the GraphPad Prism v.7.0 (GraphPad Software Inc., CA) with 4PL sigmoidal curve fitting. The maximum response (Rmax) was obtained for each sample. A ratio of the Rmax between a sample and the bNAb standard (using perfusion process with clipping < 1% and without AEBSF exposure) was calculated as the relative binding potency. The experiment was performed in duplicate for each sample. Percent coefficient of variation (CV%) was applied to evaluate assay precision. The bNAb from the regular fed-batch process (without AEBSF addition) with the clipping percentage at 39% was used for an assay control (high clipping bNAb). The clipping percentage of all bNAb samples was determined using DTT reduction followed by capillary gel electrophoresis (CGE) (Perkin-Elmer, Waltham, MA) analysis [14].
Results and discussions
Each AEBSF molecule modifies an amino acid on the bNAb resulting in a + 183 Da mass shift (Scheme 1) [15]. To characterize the by-products associated with the AEBSF modifications, the three types of samples, i.e., a positive control, negative control, and test article, were prepared. (1) The negative control was a purified bNAb material without AEBSF treatment (i.e., free of AEBSF-bNAb modifications and < 1% clipping). (2) The positive control was a purified bNAb (< 1% clipping) being forced modified by incubation with AEBSF. This process generated elevated levels of AEBSF-bNAb species. Two positive control samples were prepared with AEBSF solution added daily, one for 3 days and the other one for 7 days, which presented a forced modification scenario and provided samples to monitor the AEBSF modifications for trending purposes. (3) The bNAb test articles were generated from a fed-batch production, which went through the application of AEBSF supplementation during the cell culture stage followed by purification. Two lots of bNAb test articles were prepared and analyzed in this study. Both middle-up and bottom-up LC-MS techniques were first performed to evaluate the method capability on AEBSF modifications using the negative and positive controls. After the successful proof-of-concept study, the bNAb test articles were then analyzed.
Scheme 1.
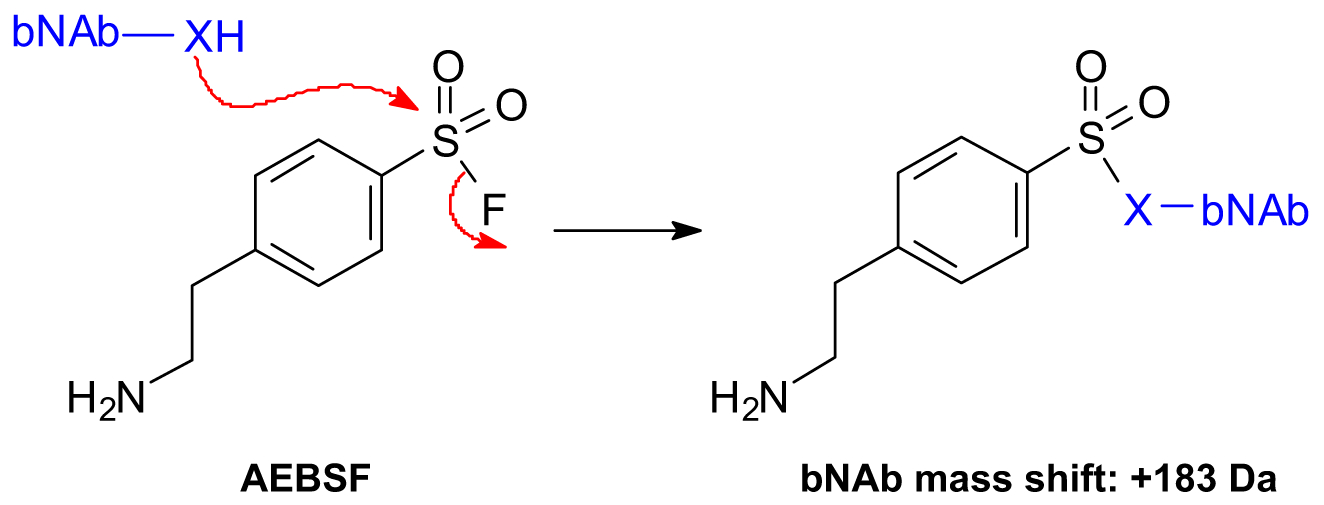
Reaction between bNAb and AEBSF resulting in a + 183 Da mass shift for the bNAb (sX: a side chain of amino acid) [15]
A middle-up LC-MS technique was first applied to identify any AEBSF modifications at the subunit level [5]. IdeS proteolysis followed by full reduction was performed, during which the bNAb was cleaved into three subunits, i.e., Fc/2, light chain, and Fd fragments, with molecular weights around 25 kDa for each. The bNAb glycans were also completely removed using sequential PNGase F and Rapid PNGase F deglycosylation steps. The digested samples were then subjected to LC-MS analysis. Figure 1 shows a representative total ion chromatogram (TIC) of three major peaks, correlating to the Fc/2, Fd, and light chain at 5.2 min, 7.0 min, and 7.2 min, respectively. Each fragment with or without the AEBSF modifications coeluted with each other, and the peaks were identified by MS analysis.
Fig. 1.
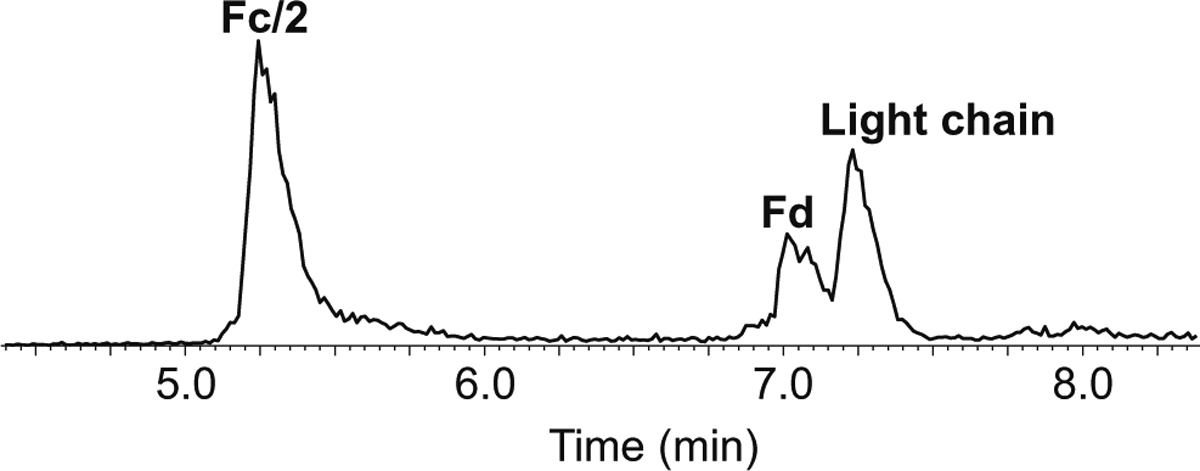
A typical TIC of the IdeS-digested, deglycosylated, and reduced bNAb (y-axis is relative abundance, normalized to the highest peak in the TIC)
The theoretical mass of the Fc/2 was 23,714.5 Da, which was observed in all of the digested control samples (Fig. 2). On top of the Fc/2 domain, 3 peaks with + 183 Da mass increments were observed, correlating to 1-, 2-, and 3-AEBSF adducts, respectively. 3-AEBSF adducts were detected in the day-7 positive control sample but not in the day-3 positive control (see Electronic Supplementary Material (ESM) Fig. S1, Tables S1 and S2). This suggested that a longer incubation time resulted in greater amounts of AEBSF-modified bNAb. Table 1 summarized the observed masses and their related identity assignments for the Fc/2 subunit.
Fig. 2.
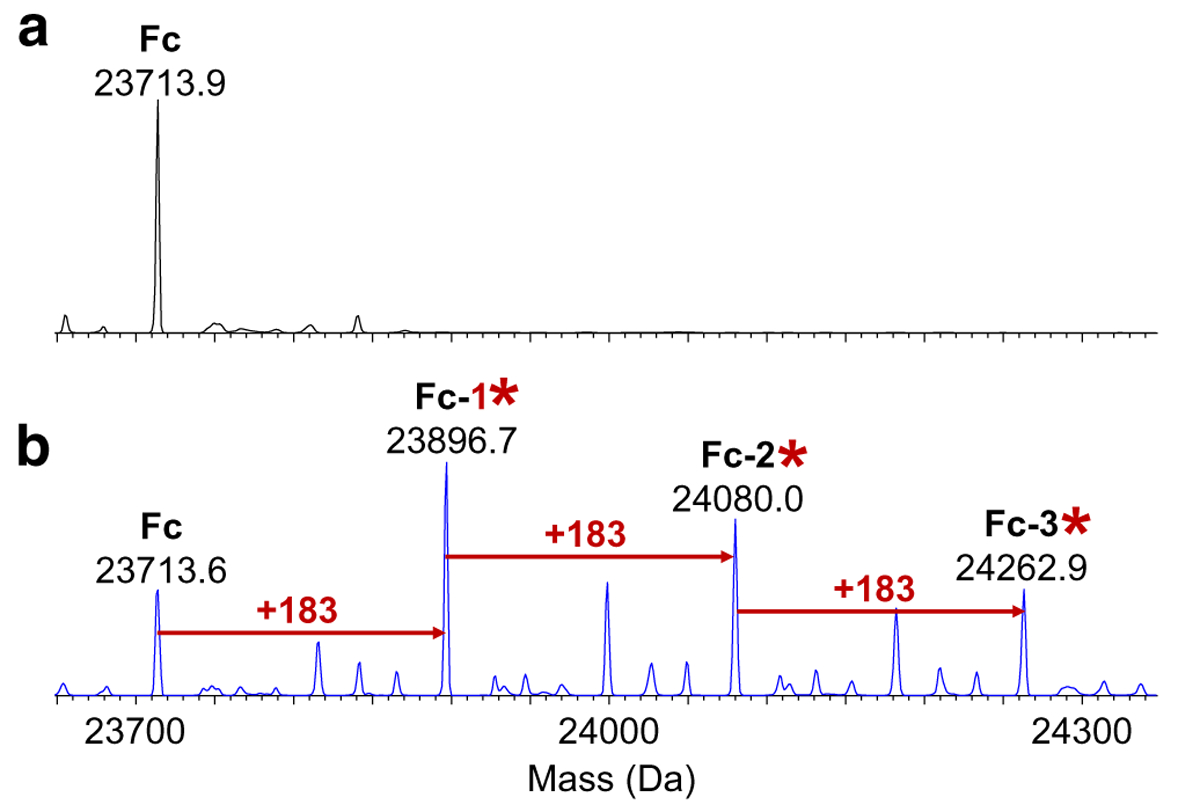
Deconvoluted mass spectra of the Fc/2 subunit (abbreviated as Fc) at 5.2 min for (a) the negative control and (b) day-7 positive control (*AEBSF; y-axis is relative abundance, normalized to the highest peak in each spectrum)
Table 1.
Theoretical and measured average masses (mass error < 1 Da) of the Fc/2 and light chain subunit for the bNAb samples from Figs. 2 and 3 (ND not detected)
| Subunits | No. of AEBSF adducts | 0 | 1 | 2 | 3 | |
|---|---|---|---|---|---|---|
| Fc/2 | Theoretical mass (Da) | 23,714.5 | 23,897.5 | 24,080.6 | 24,263.6 | |
| Measured mass (Da) | Negative control | 23,713.9 | ND | ND | ND | |
| Day-7 positive control | 23,713.6 | 23,896.7 | 24,080.0 | 24,262.9 | ||
| Light chain | Theoretical mass (Da) | 23,002.3 | 23,185.3 | 23,368.4 | 23,551.4 | |
| Measured mass (Da) | Negative control | 23,002.3 | ND | ND | ND | |
| Day-7 positive control | 23,002.1 | 23,185.3 | 23,368.7 | 23,552.3 |
Similar AEBSF modification patterns were observed on the light chain fragment and are illustrated in Fig. 3 and Table 1. Again, AEBSF adducts were only detected in the positive control samples. The measured masses and peak assignments for the Fd fragments with and without AEBSF modifications were illustrated in Table 2 and Fig. 4. Sulfation (SO3), an important characteristic of this bNAb, was observed for the Fd subunit [16]. The theoretical masses corresponding to the Fd fragment without and with one sulfation (+ 80 Da) were detected in the negative and positive bNAb samples. The Fd fragment peaks with 1- and 2-AEBSF adducts were again only detected in the positive control samples as expected.
Fig. 3.
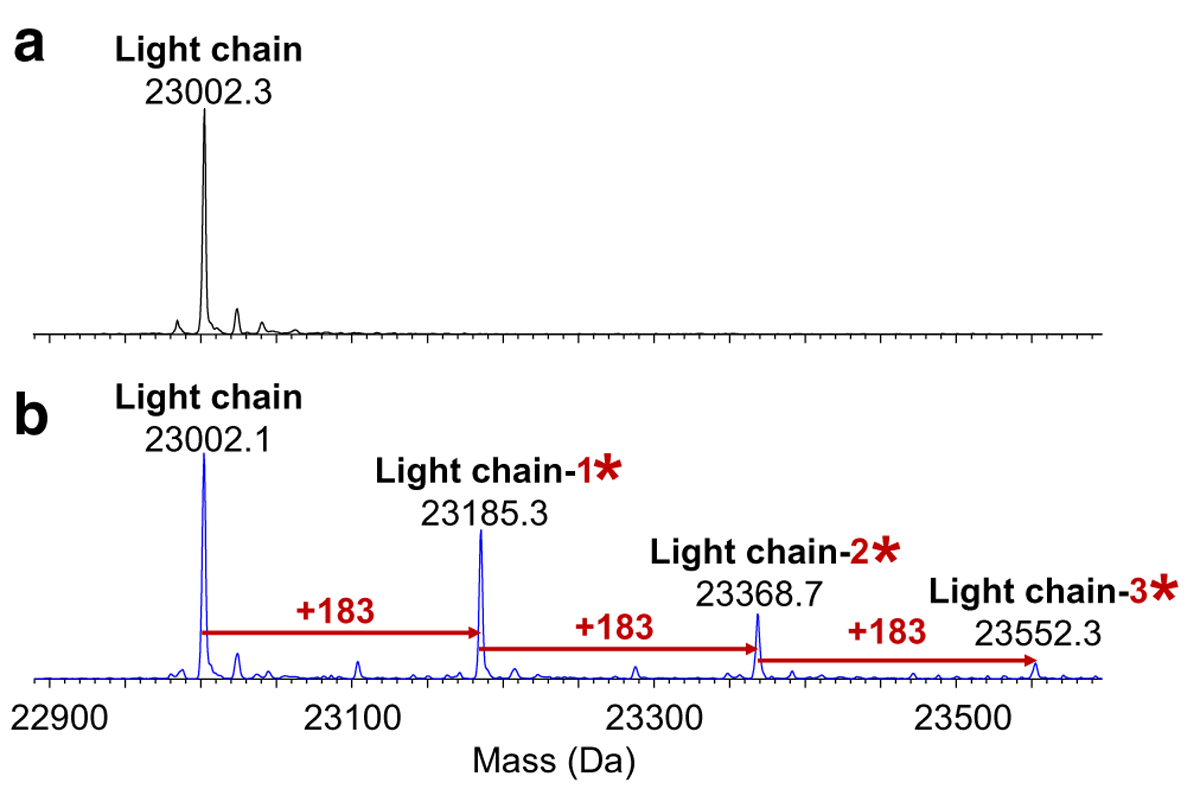
Deconvoluted mass spectra of the light chain subunit at 7.2 min for (a) the negative control and (b) day-7 positive control samples (*AEBSF; y-axis is relative abundance, normalized to the highest peak in each spectrum)
Table 2.
Theoretical and measured average masses (mass error < 1 Da) of the Fd subunit for the bNAb samples from Fig. 4 (ND not detected)
| No. of sulfation groups | 0 | 1 | 0 | 1 | 0 | 1 | |
|---|---|---|---|---|---|---|---|
| No. of AEBSF adducts | 0 | 0 | 1 | 1 | 2 | 2 | |
| Theoretical mass (Da) | 28,479.9 | 28,559.9 | 28,662.9 | 28,742.9 | 28,846.0 | 28,926. | |
| Measured mass (Da) | Negative control | 28,479.6 | 28,559.3 | ND | ND | ND | ND |
| Day-7 positive control | 28,479.5 | 28,559.8 | 28,662.7 | 28,743.0 | 28,845.7 | 28,926. | |
Fig. 4.
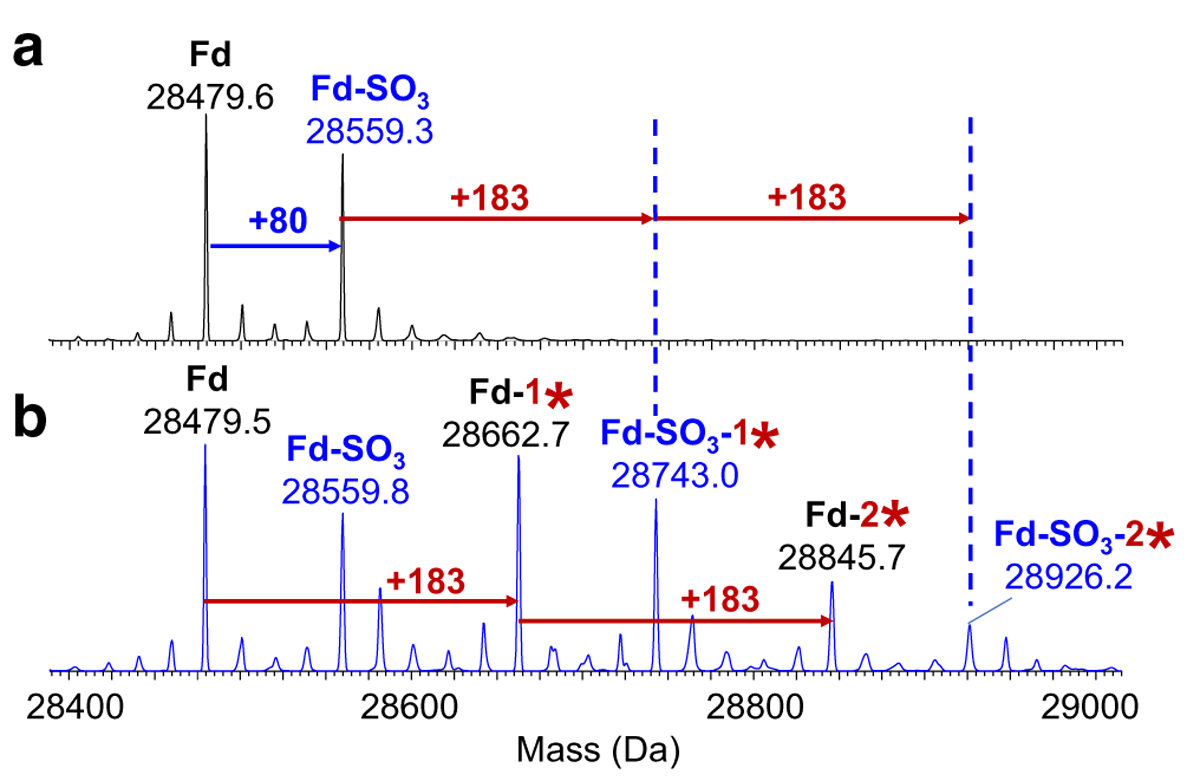
Deconvoluted mass spectra of the Fd subunit at 7.0 min for (a) negative control and (b) day-7 positive control samples (*AEBSF; y-axis is relative abundance, normalized to the highest peak in each spectrum)
After showing the validity of the middle-up approach for AEBSF-modified subunit analysis in the positive controls, the method was then applied to evaluate the test articles, i.e., research bNAb material with AEBSF supplemented during the cell culture process in a fed-batch production. The mass spectra of the test articles (see ESM Figs. S2 and S3) were similar to the ones of the negative control, i.e., no AEBSF-modified subunits (Fc/2, Fd, and light chain) were detected. In theory, the AEBSF modifications should not exist in the negative controls (0%) without any exposure to AEBSF. Concluded from the subunit analysis, AEBSF modifications were not detected in the bNAb test articles and trended higher in the day-3 positive control and highest in the day-7 positive control. To further understand the AEBSF modifications, especially for the test articles, a peptide mapping method with better sensitivity was performed.
Tryptic digestion followed by LC-MS/MS analysis was applied to characterize the AEBSF-bNAb modifications at the amino acid level. This commonly used bottom-up strategy is expected to be more applicable for detecting targeted modifications, which can locate the exact modified amino acids. Through peptide mapping followed by data analysis using BioPharma Finder, 40 peptides with AEBSF adducts (+ 183.035 Da) were identified based on the mass error < 5 ppm for the full-scan MS and MS/MS fragment analysis. With the assumption that the ionization efficiency was similar between the unmodified and AEBSF-modified peptides, the percentage of each AEBSF modification was also obtained using the software.
The following criteria were then applied to exclude any false-positive identification manually. The retention time range of AEBSF-modified and unmodified species was appropriate to the peptide chemistry with AEBSF adduction. It means the modified and unmodified peptides could co-elute with each other if their hydrophobicity was similar. However, if the hydrophobicity of the peptide is much higher or lower than that of AEBSF, the modified peptide retention time could shift later or earlier than the unmodified one, respectively. As observed by subunit analysis, the percentage of AEBSF-modified peptide in the bNAb samples should trend upwards in the following order: (i) negative control (0%), (ii) test articles (if detected), (iii) day-3 positive control, and (iv) day-7 positive control. The MS/MS fragment ions of the AEBSF-modified peptide in the bNAb test articles should be comparable to the ones observed in the positive and negative control samples.
The following example shows the manual peak verification after BioPharma Finder data processing using the peptide Y177AASSYLSLTPEQWK in the light chain. The extracted ion chromatograms (XICs) in Fig. 5 show the unmodified peptide (monoisotopic mass at 1742.86 Da) partially coeluting with its corresponding AEBSF-modified peptide (monoisotopic mass at 1925.91 Da) with + 183 Da mass shift at around 44.3 min. The unmodified peptide was detected in all three types of samples: negative control, test article, and positive control. The AEBSF-modified peptide at Y177 was not detected in the negative control (0%) but was observed and quantified at 4.4% and 6.5% in both lots of bNAb test articles and was also detected at 29.7% and 66.5% in day-3 and day-7 positive control samples, respectively (Table 3). The percentage of AEBSF modifications trended similarly as the subunit analysis results.
Fig. 5.
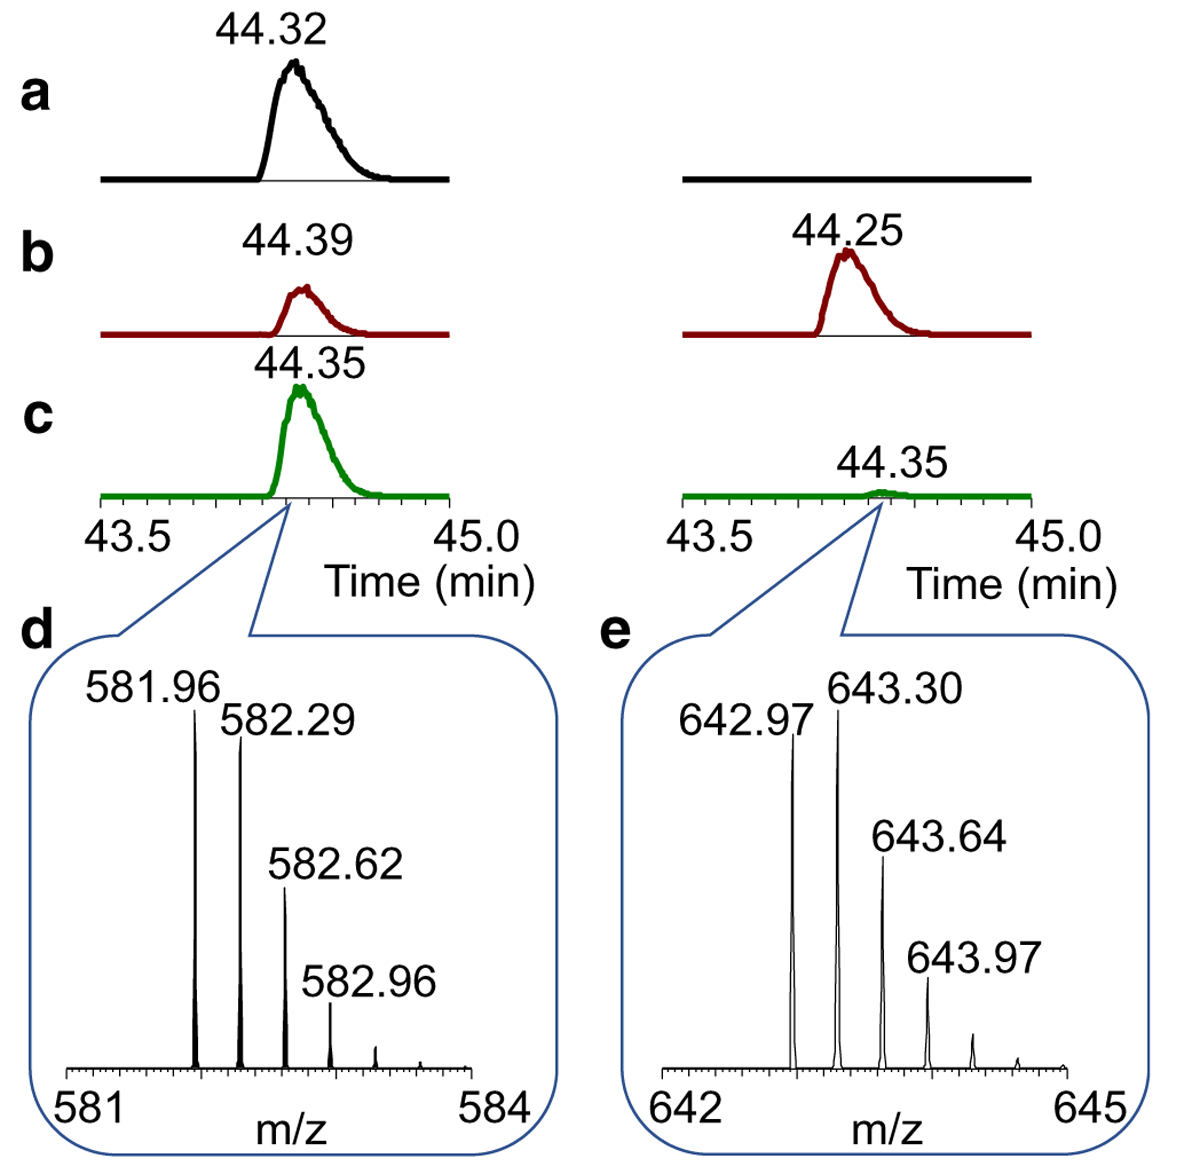
The representative XICs of the peptide Y177AASSYLSLTPEQWK: the unmodified peptide on the left (extracted m/z range 872.0–874.0, 581.5–583.5) and the AEBSF-modified peptide on the right (extracted m/z range 642.5–644.5, 482.5–484.5) for (a) negative control, (b) day-7 positive control, and (c) test article (y-axis is relative abundance, normalized to the same trypsin-digested peptide fragment A135-K154, m/z 737.72 (z = 3), retention time 69.74 min), with (d) the peak detected at m/z 581.96 (z = 3) and 872.44 (z = 2, not shown) for the unmodified peptide and (e) the peak observed at m/z 642.97 (z = 3) and 482.48 (z = 4, not shown) for the AEBSF-modified peptide
Table 3.
Relative quantification of AEBSF-modified peptides (ND not detected)
| AEBSF-modified amino acid sites | % AEBSF modification | ||
|---|---|---|---|
| Tyr177 in light chain | Lys250 in Fd | ||
| Negative Control | ND | ND | |
| Positive control | Day 3 | 29.7 | 27.5 |
| Day 7 | 66.5 | 31.7 | |
| Test articles | Lot #1 | 4.4 | 3.3 |
| Lot #2 | 6.5 | 2.3 | |
MS/MS spectra were next applied to pinpoint the AEBSF-modified amino acid in this peptide. MS/MS spectra show the similar y-ion series in Fig. 6 for the unmodified peptide and AEBSF-modified peptide (y1–y9), which confirmed the peptide sequence. The b-ion series show lower intensity than yions in general due to its structurally lower stability [17, 18], but they were also identified in both peptides (b2–b9). Moreover, the corresponding b-ions with + 183 Da mass shift was observed between the unmodified and AEBSF-modified peptides, which provided the evidence that the AEBSF modifications occurred at the N-terminus of the peptide, either at Tyr177 or at Ala178. As literature previously reported, AEBSF is a sulfonyl fluoride molecule, which targets the side chain of amino acids [17]. Since alanine has no side chain to react with AEBSF, Tyr177 was therefore determined to be the AEBSF modification site. Among 40 AEBSF-modified peptides identified by BioPharma Finder, only 18 peptides were confirmed after manual verification according to the criteria stated previously. Table S3 (see ESM) summarized the modified amino acids including Lys, Tyr, and His for the positive bNAb control samples, which underwent forced modification.
Fig. 6.
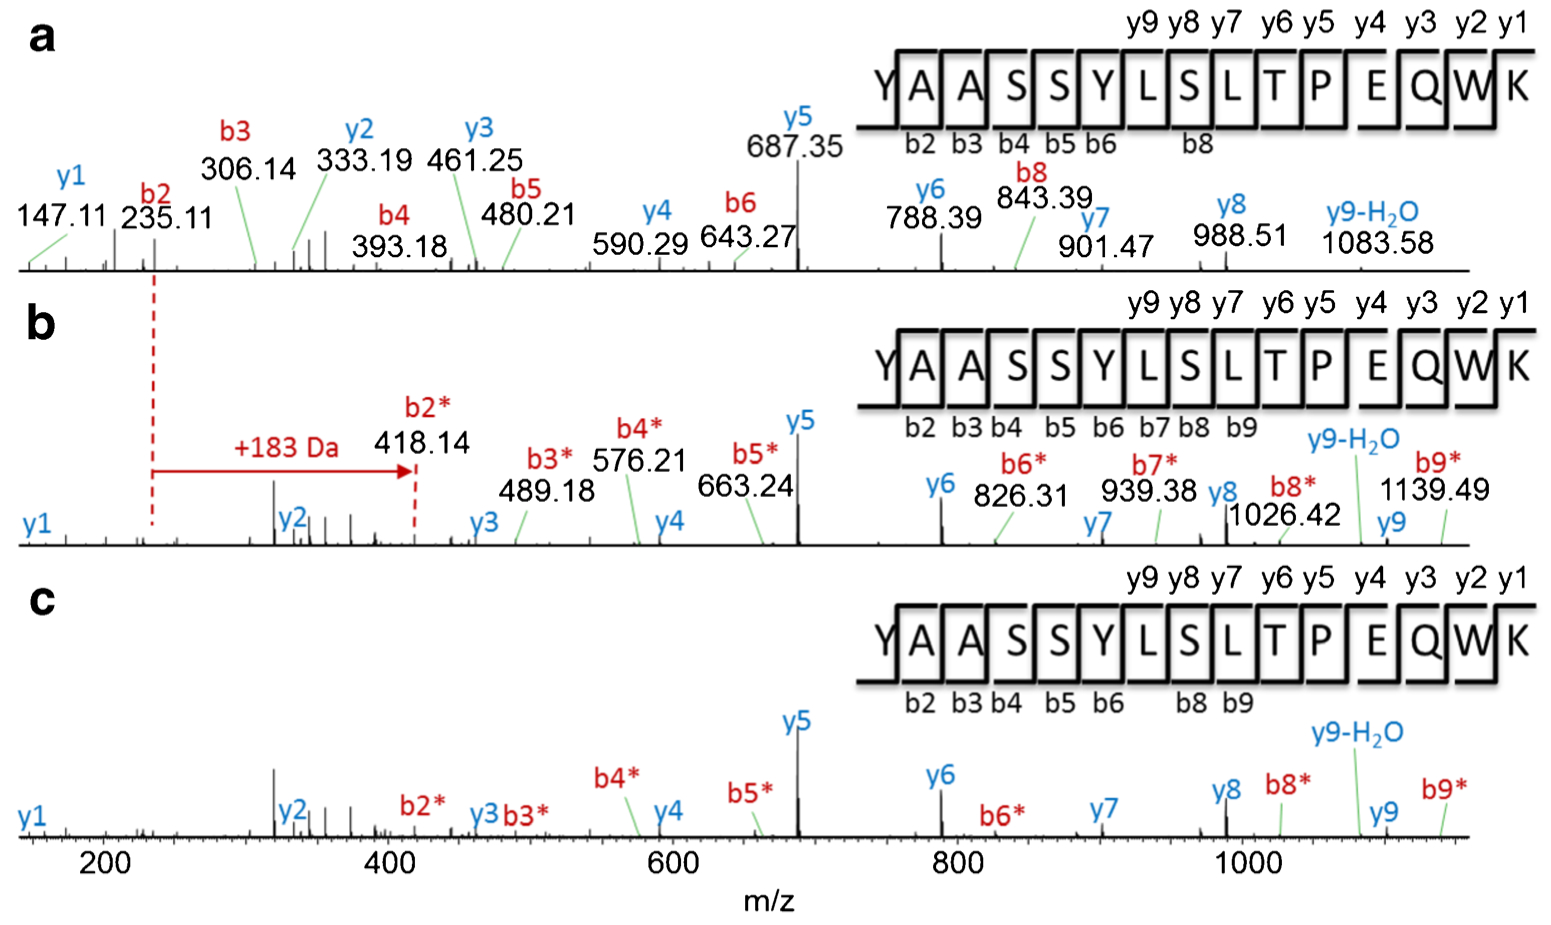
MS/MS spectra of peptide Y177AASSYLSLTPEQWK. (a) The unmodified peptide with precursor ion m/z 581.96 (z = 3) for the negative control; AEBSF-modified peptides with precursor ion m/z 642.97 (z = 3) for (b) day-7 positive control and (c) test article (*AEBSF-modified fragment ions; y-axis is relative abundance, normalized to the highest peak in each spectrum)
With the successful proof-of-concept study, the peptide mapping analysis was then applied to the test articles. Even though the MS/MS sequence coverage of the AEBSF-modified peptide, Y177AASSYLSLTPEQWK, was lower in the test articles than in the positive control samples, the full-scan MS and MS/MS fragment ions were sufficient enough to confirm the low abundant AEBSF modification. Another example of AEBSF modification analysis is presented in ESM Fig. S4. Among 18 AEBSF-modified peptides detected in the positive controls, only two of them were unambiguously confirmed in the test articles, with the amino acid modification sites at Tyr177 in the light chain and Lys250 in the Fd at a low percentage (Table 3). Results for both lots of bNAb test articles using the AEBSF supplementation strategy show the same modified amino acid sites. Therefore, hot spots for AEBSF modifications were only limited to Tyr177 and Lys250. If AEBSF is ever applied for the production of this bNAb in the future, the limit of detection (LOD) using peptide mapping method should be further investigated. In addition, 3 amino acids, i.e., His, Lys, and Tyr, were detected for AEBSF modifications in the test articles and positive control samples in this study, which was in the range of literature-cited observations stated previously.
As shown from this study, the combination of both middle-up and bottom-up LC-MS approaches enabled the identification of the AEBSF modifications in the bNAb samples. Subunit analysis employed a more straightforward sample preparation and took less time for data analysis. It was used as a characterization tool to confirm AEBSF adducts at elevated percentages. More importantly, subunit analysis provided the evidence to trend the AEBSF modification percentage among samples, which assisted to exclude false-positive results for further analysis. For the peptide mapping method, more complex sample preparation and time-consuming data mining were required to obtain the accurate results, but it was necessary to pinpoint the AEBSF-modified amino acid sites and to further quantify (relatively) the low percentage of AEBSF modifications.
Furthermore, a potency assay for understanding the bNAb binding efficacy was developed and qualified using the bNAb materials with the clipping percentage between 0 and 80%. The method precision was determined < 14% and was then applied to analyze the AEBSF modification impact for in vitro bNAb binding bioactivity. Figure 7 and Table 4 show the binding potency differences among the positive control (76%), negative control (81%), and test articles (76% and 80%) were within the assay variability range. The results indicated no potency difference among the three types of samples mentioned above. Compared with the low clipping bNAb standard, the binding potency drop for the negative control was expected due to incubation at 37 °C for 7 days [18], so was for the positive control, which was unlikely caused by the AEBSF modification. In addition, test articles, purified directly after taken from the bioreactors, only showed the binding potency at 76% and 80%, which could be due to a small amount of clipping (5–11%) still existing in the bNAb samples. However, compared with the regular fed-batch process product with 39% clipped bNAb material and 58% binding potency, the AEBSF supplementation strategy significantly improved the product quality.
Fig. 7.
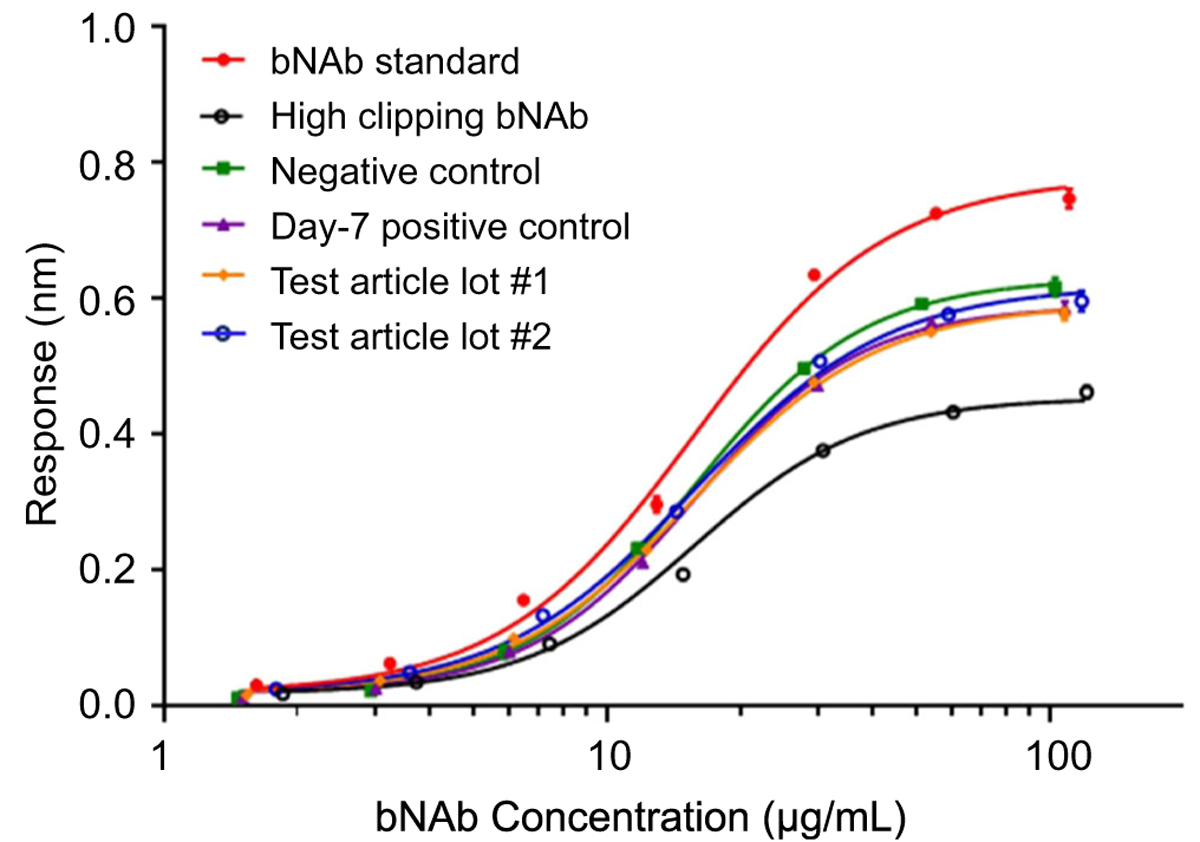
The curves of detected response to the HIV-specific antigen versus the bNAb concentration
Table 4.
Relative binding activity of the bNAb samples
| Sample description | Clipping percentage (%) | Binding activity (n = 2) | ||
|---|---|---|---|---|
| Relative binding potency (%) | CV% | |||
| bNAb standard | <1 | 101 | 1.2 | |
| High clipping bNAb | 39 | 58 | 1.9 | |
| Negative control | <1 | 81 | 1.4 | |
| Day-7 positive control | <1 | 76 | 1.5 | |
| Test articles | Lot #1 | 11 | 76 | 1.5 |
| Lot #2 | 5 | 80 | 1.4 | |
To understand the AEBSF modification effects through the structural biology approach, PyMOL™ software review of the 3D structure of the bNAb Fab region was applied. The results in Fig. S5 (see ESM) [16] indicated that neither Tyr177 nor Lys250 was in the CDR regions, which explained why the AEBSF modifications of the bNAb did not reduce the molecular binding activity.
Conclusion
With the combination of LC-MS investigations and in vitro potency analysis, AEBSF-modified amino acids were pinpointed, and the modification percentage was determined to be negligible, which indicated no reduction on the molecular binding efficacy when AEBSF was supplemented into the cell culture bioreactor. This analytical characterization approach reported herein can be applied to other similar cases to characterize modified protein impurities and analyze their corresponding impact on biofunctionality.
Supplementary Material
Acknowledgments
Acknowledgment is given to VRC leadership and scientific team support in VPP: Kevin Carlton, Kandace M. Atallah, Daniel Gowetski, Kuang-Chuan Cheng, and Adam Charlton. Also, thanks are given to Jack Yang for the insightful scientific discussion during the manuscript preparation.
Funding information
This work was financially supported by the Intramural Research Program of the Vaccine Research Center (VRC), National Institute of Allergy and Infectious Diseases (NIAID), National Institutes of Health (NIH).
Footnotes
Compliance with ethical standards
Conflict of interest The authors declare that they have no conflicts of interest.
Electronic supplementary material The online version of this article (https://doi.org/10.1007/s00216-019-01995-9) contains supplementary material, which is available to authorized users.
References
- 1.Rozkov A, Enfors SO. Analysis and control of proteolysis of recombinant proteins in Escherichia coli. Adv Biochem Eng Biotechnol. 2004;89:163–95. [DOI] [PubMed] [Google Scholar]
- 2.Young CL, Britton ZT, Robinson AS. Recombinant protein expression and purification: a comprehensive review of affinity tags and microbial applications. Biotechnol J. 2012;7(5):620–34. 10.1002/biot.201100155 . [DOI] [PubMed] [Google Scholar]
- 3.Pillay P, Schluter U, van Wyk S, Kunert KJ, Vorster BJ. Proteolysis of recombinant proteins in bioengineered plant cells. Bioengineered. 2014;5(1):15–20. 10.4161/bioe.25158 . [DOI] [PMC free article] [PubMed] [Google Scholar]
- 4.Sinha J, Plantz BA, Inan M, Meagher MM. Causes of proteolytic degradation of secreted recombinant proteins produced in methylotrophic yeast Pichia pastoris: case study with recombinant ovine interferon-tau. Biotechnol Bioeng. 2005;89(1):102–12. 10.1002/bit.20318 . [DOI] [PubMed] [Google Scholar]
- 5.Ivleva VB, Schneck NA, Gollapudi D, Arnold F, Cooper JW, Lei QP. Investigation of sequence clipping and structural heterogeneity of an HIV broadly neutralizing antibody by a comprehensive LC-MS analysis. J Am Soc Mass Spectrom. 2018;29(7):1512–23. 10.1007/s13361-018-1968-0 . [DOI] [PMC free article] [PubMed] [Google Scholar]
- 6.Ryan BJ, Henehan GT. Overview of approaches to preventing and avoiding proteolysis during expression and purification of proteins. Curr Protoc Protein Sci. 2013;Chapter 5:Unit5.25. 10.1002/0471140864.ps0525s71 . [DOI] [PubMed]
- 7.Katoch R Analytical techniques in biochemistry and molecular biology. Verlag New York: Springer; 2011. [Google Scholar]
- 8.Cai CX, Schneck NA, Harris D, Blackstock D, Ivleva VB, Lei QP, et al. Quantification of residual AEBSF-related impurities by reversed-phase liquid chromatography. J Chromatogr B Anal Technol Biomed Life Sci. 2019;1116:19–23. 10.1016/j.jchromb.2019.03.022. [DOI] [PMC free article] [PubMed] [Google Scholar]
- 9.Huang JL, Nagy A, Ivleva VB, Blackstock D, Arnold F, Cai CX. Hydrolysis-Kinetic Study of AEBSF, a Protease Inhibitor Used during Cell-Culture Processing of the HIV-1 Broadly Neutralizing Antibody CAP256-VRC25.26. Anal Chem. 2018;90(7):4293–6. 10.1021/acs.analchem.7b05316. [DOI] [PMC free article] [PubMed] [Google Scholar]
- 10.Gallivan JP, Dougherty DA. Cation-pi interactions in structural biology. Proc Natl Acad Sci U S A. 1999;96(17):9459–64. [DOI] [PMC free article] [PubMed] [Google Scholar]
- 11.Samy TS, Kappen LS, Goldberg IH. Reversible modification of arginine residues in neocarzinostatin. Isolation of a biologically active 89-residue fragment from the tryptic hydrolysate. J Biol Chem. 1980;255(8):3420–6. [PubMed] [Google Scholar]
- 12.McMurry JE. Organic chemistry. 9th ed: Cengage Learning; 2015. [Google Scholar]
- 13.Narayanan A, Jones LH. Sulfonyl fluorides as privileged warheads in chemical biology. Chem Sci. 2015;6(5):2650–9. 10.1039/c5sc00408j. [DOI] [PMC free article] [PubMed] [Google Scholar]
- 14.Gollapudi D, Wycuff DL, Schwartz RM, Cooper JW, Cheng KC. Development of high-throughput and high sensitivity capillary gel electrophoresis platform method for Western, Eastern, and Venezuelan equine encephalitis (WEVEE) virus like particles (VLPs) purity determination and characterization. Electrophoresis. 2017;38(20):2610–21. 10.1002/elps.201700217 . [DOI] [PubMed] [Google Scholar]
- 15.Hedstrom L Serine protease mechanism and specificity. Chem Rev. 2002;102(12):4501–24. [DOI] [PubMed] [Google Scholar]
- 16.Doria-Rose NA, Bhiman JN, Roark RS, Schramm CA, Gorman J, Chuang GY, et al. New member of the V1V2-directed CAP256-VRC26 lineage that shows increased breadth and exceptional potency. J Virol. 2016;90(1):76–91. 10.1128/jvi.01791-15 . [DOI] [PMC free article] [PubMed] [Google Scholar]
- 17.Bischoff R, Schluter H. Amino acids: chemistry, functionality and selected non-enzymatic post-translational modifications. J Proteome. 2012;75(8):2275–96. 10.1016/j.jprot.2012.01.041 . [DOI] [PubMed] [Google Scholar]
- 18.Chan CP. Forced degradation studies: current trends and future perspectives for protein-based therapeutics. Expert Rev Proteomics. 2016;13(7):651–8. 10.1080/14789450.2016.1200469 . [DOI] [PubMed] [Google Scholar]
Associated Data
This section collects any data citations, data availability statements, or supplementary materials included in this article.


