

Abstract
Background
The importance of appraising the risk of bias of studies included in systematic reviews is well‐established. However, uncertainty remains surrounding the method by which risk of bias assessments should be conducted. Specifically, no summary of evidence exists as to whether blinded (i.e. the assessor is unaware of the study author’s name, institution, sponsorship, journal, etc.) versus unblinded assessments of risk of bias yield systematically different assessments in a systematic review.
Objectives
To determine whether blinded versus unblinded assessments of risk of bias yield systematically different assessments in a systematic review.
Search methods
We searched MEDLINE (1966 to September week 4 2009), CINAHL (1982 to May week 3 2008), All EBM Reviews (inception to 6 October 2009), EMBASE (1980 to 2009 week 40) and HealthStar (1966 to September week 4 2009) (all Ovid interface). We applied no restrictions regarding language of publication, publication status or study design. We examined reference lists of included studies and contacted experts for potentially relevant literature.
Selection criteria
We included any study that examined blinded versus unblinded assessments of risk of bias included within a systematic review.
Data collection and analysis
We extracted information from each of the included studies using a pre‐specified 16‐item form. We summarized the level of agreement between blinded and unblinded assessments of risk of bias descriptively. We calculated the standardized mean difference whenever possible.
Main results
We included six randomized controlled trials (RCTs). Four studies had unclear risk of bias and two had high risk of bias. The results of these RCTs were not consistent; two demonstrated no differences between blinded and unblinded assessments, two found that blinded assessments had significantly lower quality scores, and another observed significantly higher quality scores for blinded assessments. The remaining study did not report the level of significance. We pooled five studies reporting sufficient information in a meta‐analysis. We observed no statistically significant difference in risk of bias assessments between blinded or unblinded assessments (standardized mean difference ‐0.13, 95% confidence interval ‐0.42 to 0.16). The mean difference might be slightly inaccurate, as we did not adjust for clustering in our meta‐analysis. We observed inconsistency of results visually and noted statistical heterogeneity.
Authors' conclusions
Our review highlights that discordance exists between studies examining blinded versus unblinded risk of bias assessments at the systematic review level. The best approach to risk of bias assessment remains unclear, however, given the increased time and resources required to conceal reports effectively, it may not be necessary for risk of bias assessments to be conducted under blinded conditions in a systematic review.
Keywords: Publication Bias, Review Literature as Topic, Randomized Controlled Trials as Topic, Risk Assessment
Plain language summary
Blinded versus unblinded assessments of risk of bias in studies included in a systematic review
When researchers want to answer a question they can use an approach called a systematic review, which is intended to examine all of the studies that have been done in a particular area of interest. When examining and summarizing the literature, researchers are expected to determine which of the studies were well‐conducted (i.e. high quality) and those that were not. What we do not know enough about is how researchers should conduct the assessments to determine which studies were of high quality. This is important because if the researcher is aware of certain study characteristics (e.g. what journal the study was published in) they may inadvertently assess the study a certain way. For example, if the author of the study is well‐known to the assessor, they may be more likely to assume it is of 'high quality'. Our research examines whether blinding researchers to study characteristics makes a difference when the goal is to summarize the literature. We only found a few studies that reported data relevant to our question. The results from these studies were inconsistent, however, the results suggest that it may not make a difference if quality is appraised under blinded or unblinded conditions during a systematic review.
Background
Description of the problem or issue
Over the past three decades, numerous tools have been developed to assess the risk of bias. Key aspects of these tools have been summarized in systematic reviews (Sanderson 2007; West 2002). One systematic review identified over 109 scales, checklists or other guidance documents for conducting risk of bias assessments when conducting systematic reviews (West 2002). The majority of these checklists had limitations; only 17% (19/109) fully addressed their key quality domains for a particular type of study design. Another systematic review identified 53 checklists and 33 scales specific to observational studies in epidemiology and found similar results (Sanderson 2007). Few tools addressed the majority of the risk of bias issues in observational studies and the authors did not identify a tool that covered all of the important aspects of appraising observational studies.
Issues have also been raised regarding the use of scores to assess the risk of bias in systematic reviews (Herbison 2006; Jüni 1999). One empirical study including 25 different quality scales found that the overall quality scores were not significantly associated with the treatment effect (Jüni 1999). Similarly, another study found that none of the 43 different quality scales that were included validly divided studies into low or high quality or made the meta‐analyses results more accurate (Herbison 2006). As such, The Cochrane Collaboration (Higgins 2009) and others (Herbison 2006; Jüni 1999) recommend using a component/checklist approach, which overcomes many of the problems associated with using scales.
Description of the methods being investigated
Less attention has been given to the manner in which risk of bias assessments are conducted. Awareness of certain study characteristics, including the author’s name and affiliation, journal of publication and the study results, may influence an individual’s assessment of risk of bias (Moher 1996).
How these methods might work
The concern lies in the extent to which these biases could lead to inconsistent assessments of risk of bias within and across appraisers. Currently, no summary of evidence exists to explore whether blinded (i.e. the assessor is unaware of the study author’s name, institution, sponsorship, journal, etc.) versus unblinded assessments of risk of bias yield systematically different results at the systematic review level (Assendelft 1999; Berlin 1997).
Why it is important to do this review
Systematic reviews are intended to limit bias and it is therefore important that they are conducted in a manner that minimizes bias (Moher 2007). As such, the issue of whether to appraise the risk of bias under blinded or unblinded conditions during the conduct of a systematic review is not trivial. Although individual studies have been conducted to examine this issue, to date a comprehensive systematic synthesis of evidence has not been conducted, which could bring clarity to this issue.
Objectives
To determine whether blinded versus unblinded assessments of risk of bias result in similar or systematically different assessments in studies included in a systematic review.
Methods
Criteria for considering studies for this review
Types of studies
Any study, regardless of design, examining blinded versus unblinded assessments of risk of bias for studies included in a systematic review.
Types of data
Any subjective or objective data resulting from blinded versus unblinded risk of bias appraisal of studies included in a systematic review.
Types of methods
The level of agreement between blinded and unblinded assessments of risk of bias, as well as mean scores from blinded versus unblinded assessments of risk of bias.
Types of outcome measures
The outcome measures included the following:
Primary outcomes
Mean differences and 95% confidence intervals between blinded and unblinded risk of bias scores.
Secondary outcomes
The qualitative level of agreement (e.g. good, moderate) between blinded and unblinded assessments of risk of bias.
Mean risk of bias scores and measures of variance (e.g. standard deviation, standard error) for the results of the risk of bias assessments conducted under blinded and unblinded conditions.
Inter‐rater reliability statistics (e.g. ICC or kappa statistic) for both blinded and unblinded assessments of risk of bias (presented descriptively).
Search methods for identification of studies
See: Cochrane Methodology Review Group methods used in reviews.
We searched the following electronic databases for records published in any language.
Electronic searches
We used the following search strategy for MEDLINE:
1. ((assess$ or assur$ or control$ or scor$ or measur$) adj3 quality).ti,ab. 2. (risk adj of adj bias$).ti,ab. 3. Quality Control/ 4. Jadad.ti,ab. 5. Chalmers, ti,ab. 6. ((blind$ or unblind$ or nonblind$ or mask$ or unmask$) adj3 (review$ or read$ or assess$ or author$ or referee$ or rater$ or rating$)).ti,ab. 7. (1 or 2 or 3 or 4 or 5) and 6
We modified this strategy for the other databases, as necessary. The electronic search strategies were developed and executed within the databases (21 May 2008) by experienced information specialists. We updated the search in September 2009 for all databases except EMBASE. We searched the following electronic databases for potentially relevant records:
MEDLINE (1966 to September week 4 2009, Ovid interface);
CINAHL (1982 to May week 3 2008, Ovid interface);
All EBM Reviews (inception to 6 October 2009, Ovid interface);
EMBASE (1980 to 2009 week 40, Ovid interface); and
HealthStar (1966 to September week 4 2009, Ovid interface).
Searching other resources
We supplemented the searches by contacting the Cochrane Collaboration’s Bias Methods Group and the authors of included studies. We also scanned the reference lists of included studies to identify further potentially relevant material.
Data collection and analysis
We summarized the level of agreement between blinded and unblinded assessments of risk of bias descriptively. We calculated the standardized mean difference (SMD) by estimating the difference in means divided by the standard deviation, standardized into the same scale for each study. We used the SMD because the included studies used different types of quality scales. One review author calculated the SMD between the blinded and unblinded mean risk of bias scores. When it was not possible to calculate the SMD, we reported only the mean difference between blinded and unblinded risk of bias scores descriptively.
Selection of studies
Two review authors independently screened titles and abstracts and obtained full‐text articles of potentially relevant records. Two review authors then screened all full‐text articles independently using inclusion and exclusion criteria developed a priori. Disagreements were resolved through discussion or a third individual, as required. We calculated inter‐rater reliability for title and abstract screening using the kappa statistic. We deemed that an acceptable level of agreement would be greater than 60% (Landis 1977). One review author scanned the reference lists of potentially relevant articles and another contacted experts to identify any further literature.
Data extraction and management
Two review authors independently extracted data from each relevant study using a pre‐specified 16‐item form. This form was first pilot‐tested on two reports and modified through an iterative process involving three members of the team. We extracted the following data.
Study characteristics: study design, country of corresponding author, language of publication, journal name and year of publication.
Blinding characteristics: blinded elements (e.g., author, journal, country), how blinding was achieved, length of time taken to blind reports and success of blinding procedure.
Assessment of risk of bias characteristics: assessment of risk of bias tool used, number of studies assessed, number of assessors, assessor’s level of experience, calibration exercise details, number of assessments per report, and whether each report was assessed by two assessors together or independently.
Study results: differences between assessments of risk of bias and mean numerical risk of bias scores and their respective measures of variance (e.g. standard deviation, standard error) obtained from blinded and unblinded assessments.
Test‐retest reliability (e.g. kappa statistic, intra‐class coefficient; ICC) of all included instruments (e.g. the Jadad scale, Jadad 1996) under blinded and unblinded assessments, if reported. These statistics could be calculated to determine whether the reliability changed according to blinding status for both blinded and unblinded assessments of risk of bias.
One review author contacted the authors of included studies to verify data and for further information.
Assessment of risk of bias in included studies
Two review authors independently assessed the risk of bias of all eligible study reports using The Cochrane Collaboration’s tool for assessing risk of bias (http://www.ohg.cochrane.org/forms/Risk%20of%20bias%20assessment%20tool.pdf).
Measures of the effect of the methods
The SMD was the measure we used to assess the effect of blinded or unblinded assessments of risk of bias.
Unit of analysis issues
Not applicable.
Dealing with missing data
We contacted the authors of the included studies for missing data. We did not include the results of one study in the meta‐analysis, due to missing information (Berard 2000).
Assessment of heterogeneity
We explored between‐study inconsistency visually using forest plots and expressed this statistically using the I² statistic (Higgins 2009). We reported the measures of inter‐rater agreement (e.g. ICC, kappa statistic) descriptively.
Assessment of reporting biases
We assessed reporting bias using the Cochrane 'Risk of bias' tool (http://www.ohg.cochrane.org/forms/Risk%20of%20bias%20assessment%20tool.pdf) and assessed publication bias visually by using a funnel plot.
Data synthesis
We combined the SMD assessments using a random‐effects model. We conducted the analysis using STATA version 10.0.
Subgroup analysis and investigation of heterogeneity
We conducted subgroup analyses to compare results from different risk of bias tools used in the included studies (e.g. Jadad scale versus Maastricht criteria). We made efforts to detect and exclude duplicate data that can occur when multiple reports of the same study are identified, by looking for companion reports among the included studies.
Sensitivity analysis
Not applicable.
Results
Description of studies
Results of the search
The literature search results are presented in Figure 1. A total of 799 potentially relevant records were initially captured across all databases. Twenty‐nine of these were potentially relevant; we obtained and reviewed full‐text reports, resulting in six studies that met our inclusion criteria (Berard 2000; Berlin 1997; Clark 1999; Jadad 1996; Moher 1998; Verhagen 1998). The level of agreement between the two review authors was acceptable (66% for the title and abstract screen and 100% for the full‐text screen).
1.
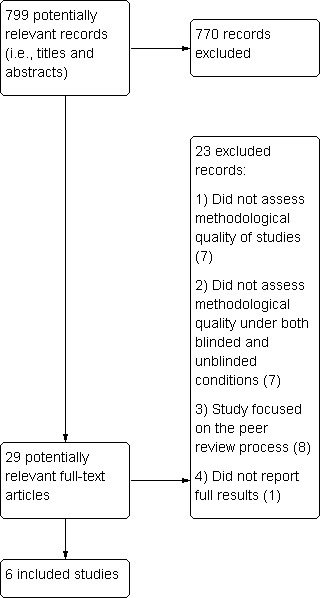
Study flow diagram.
Included studies
Relevant study characteristics are presented in the Characteristics of included studies table. All of the included studies were randomized controlled trials (RCTs) conducted in Canada (Clark 1999; Jadad 1996, Moher 1998), the United States (Berard 2000; Berlin 1997) and the Netherlands (Verhagen 1998). All of the included studies conducted blinded and unblinded risk of bias appraisal of RCTs or controlled clinical trials (CCTs) across a variety of research areas (e.g. pain, otitis media, digestive diseases, arthritis, blood transfusion, osteoporosis).
Details of the blinding process used in the included RCTs are presented in the Characteristics of included studies table. Three of the included studies used the Jadad scale (Clark 1999; Jadad 1996; Moher 1998), one used a general form adopted from five published tools (Berlin 1997), one used the Maastricht criteria (Verhagen 1998), and another used the Chalmers quality scale (Berard 2000). The number of studies that were appraised ranged from 12 to 107. All of the included studies except for one (Berard 2000) assessed the risk of bias in pairs. This means that one pair was randomly assigned to appraise the RCT or CCT under blinded conditions while another pair was randomly assigned to appraise the same study under unblinded conditions. Similar components that were blinded across studies included the authors and affiliations or institutions. The majority of the included studies also blinded assessors to the journal (Berard 2000; Berlin 1997; Clark 1999; Jadad 1996; Moher 1998; Verhagen 1998) and the organization who funded the study (Berard 2000; Clark 1999; Jadad 1996; Moher 1998). Two of the included studies blinded parts of the results or discussion (e.g. drug identities; Berlin 1997; Verhagen 1998). The method of blinding was not reported in two studies (Berard 2000; Clark 1999), performed by deletion by a computer program (Berlin 1997; Verhagen 1998), reported as just being conducted by deletion (Jadad 1996) or performed using a black marker (Moher 1998). Each of the studies will be described individually below.
Jadad et al (Jadad 1996) randomly allocated 14 assessors to work in pairs to appraise the risk of bias under blinded or unblinded assessment using the Jadad scale for 36 RCTs within the pain research area. The RCTs were selected randomly from the Oxford Pain Relief Database (http://www.medicine.ox.ac.uk/bandolier/painres/Painresstuff/people.html). One of the assessors was excluded, leaving 14 assessors in the study. Blinded components included authors, affiliations, journal, publication, date, funding and acknowledgements, and blinding was achieved via deletion. No training exercise was performed before the assessments because one of the main goals of the validation process was to yield an instrument that could be easily used following simple instructions.
Berlin et al (Berlin 1997) randomly assigned seven assessors to work in pairs; while one pair completed a blinded assessment, another pair completed an unblinded assessment of the same study. Studies examined otitis media with effusion in children, acute myocardial infarction, head and neck cancer, preterm delivery and hepatitis disease areas. The authors assessed 107 RCTs, CCTs or other unspecified study reports from a series of randomly chosen meta‐analyses, which were assessed using a general form from five published tools. Blinded components included authors, institutions, journal, parts of the abstract, identity and size of treatment groups, sections that cited literature and the discussion section. Blinding was achieved via deletion with a computer scanner and it took an average of 11 hours per study. A training exercise was performed prior to conducting the assessments.
Moher et al (Moher 1998) randomly assigned eight assessors to blinded or unblinded assessment of 127 RCTs from a random sample of 12 meta‐analyses examining digestive and circulatory diseases, mental health, stroke, pregnancy and childbirth. The Jadad three‐item scale was used for assessments (Jadad 1996). Blinding was achieved via a black marker and blinded components included authors and affiliations. A training exercise was conducted with the quality assessment tool via an interobserver reliability study.
Verhagen et al (Verhagen 1998) randomly assigned 12 RCTs and CCTs from a systematic review of arthritis to be assessed 10 times each; five times under blinded and five times under unblinded conditions. Twenty assessors used the Maastricht criteria list to assess the quality of the articles. Blinding of authors, institutions, journal and intervention results was achieved via optical character recognition software, which took an average of one hour per article. A training exercise was performed among assessors in order to ensure that the quality appraisals were conducted consistently.
Clark et al (Clark 1999) randomly assigned 76 RCTs from meta‐analyses on blood transfusion during surgery into four groups. Each RCT was assessed under both blinded and unblinded conditions during two time periods. Four assessors appraised the quality of the RCTs using the Jadad scale (Jadad 1996). It was not reported how the meta‐analyses were chosen or how blinding of authors, affiliations, journal, publication date, funding and acknowledgments was achieved. A practice exercise was conducted prior to the assessments, to ensure consistency across the reviewers.
Berard et al (Berard 2000) randomly assigned 10 RCTs and CCTs to be assessed under blinded conditions and another 10 RCTs and CCTs to be assessed under unblinded conditions. The studies were randomly selected from a meta‐analysis on osteoporosis. Four assessors used the French version of the Chalmers scoring system (Chalmers 1981) and the assessments were conducted at two different time periods, two months apart. It was not reported how blinding of authors, affiliations, journal, publication date and funding was achieved. A practice exercise was conducted prior to the assessments, to ensure consistent assessments across reviewers.
Excluded studies
We were unable to include a published abstract because the study results were unavailable (van Tulder 1997).
Risk of bias in included studies
Using the Cochrane 'Risk of bias' tool, four studies had unclear risk of bias (Berard 2000; Berlin 1997; Jadad 1996;Moher 1998) and two had high risk of bias (Clark 1999; Verhagen 1998).
Allocation
Five of the studies used adequate sequence generation (e.g. random numbers table), while one study did not report this information (Clark 1999). However, none of the included studies reported on allocation concealment.
Blinding
Not applicable.
Incomplete outcome data
None of the included studies had missing outcome data.
Selective reporting
Three of the studies reported all expected outcomes (Berard 2000; Clark 1999; Jadad 1996), while it was unclear whether the other three studies reported all expected outcomes (Berlin 1997; Moher 1998; Verhagen 1998). Publication bias did not appear to influence the results, as observed in Figure 2.
2.
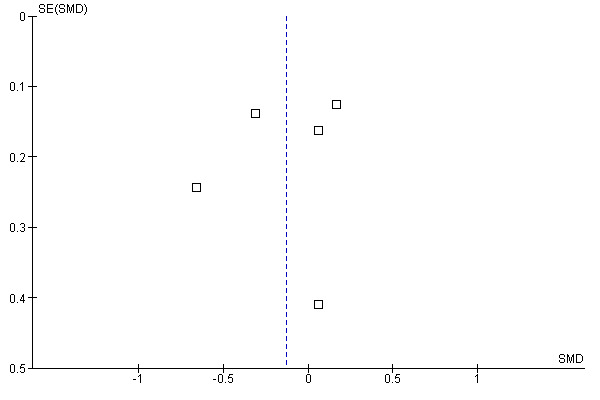
Funnel plot of comparison: 1 Blinded versus unblinded, outcome: 1.1 Blinded versus unblinded.
Other potential sources of bias
There did not seem to be any other sources of bias in any of the included studies except for two (Clark 1999; Verhagen 1998). In these two studies the articles used in the blinded and unblinded assessments were not chosen at random, which may have biased the results.
Effect of methods
Three of the included studies calculated the agreement between raters for blinded versus unblinded assessments using the ICC (Berard 2000; Jadad 1996; Verhagen 1998. In one study, blinded assessments resulted in higher agreement than unblinded assessments (P value not reported; Jadad 1996), while another study found lower agreement for blinded versus unblinded assessments (P = 0.03; Berard 2000). The third study found similar agreement for both blinded and unblinded assessments (Verhagen 1998).
Two of the studies reported unweighted kappa statistics for blinded and unblinded assessments (Berlin 1997; Clark 1999). In Berlin (Berlin 1997), a kappa statistic was calculated for each item of the appraisal tool and they ranged from 0.09 to 0.51 (Berlin 1997). In the second study, the overall kappa statistic was 0.37 and they ranged from ‐0.03 to 0.55 for each item of the appraisal tool (Clark 1999).
Clark et al also calculated the level of agreement between assessors for blinded versus unblinded assessments via the kappa statistic (Clark 1999). Blinded and unblinded assessments produced similar kappa statistics overall (0.39 blinded versus 0.37 unblinded) and per item (range: 0.43 to 0.86 blinded; range: 0.36 to 0.86 unblinded). The only exception was the randomization item, which was ‐0.01 for blinded assessment versus 0.65 for unblinded assessment.
Blinded versus unblinded assessments
Berlin et al (Berlin 1997) and Jadad et al (Jadad 1996) found that blinded assessments had significantly lower quality scores, whereas Moher et al (Moher 1998) found significantly higher quality scores for blinded assessments. Two studies (Clark 1999; Verhagen 1998) did not find a significant difference between the quality scores from blinded and unblinded assessments. In one of the studies, the level of significance was not reported between blinded and unblinded assessments (Berard 2000).
We calculated standardized mean differences for the included RCTs that used the Jadad three‐item scales (Clark 1999; Jadad 1996; Moher 1998) and two other scales (Berlin 1997; Verhagen 1998). The data from one of the included studies were insufficiently reported to calculate the standardized mean difference (Berard 2000). Thus, we combined five studies statistically (Berlin 1997;Clark 1999; Jadad 1996; Moher 1998; Verhagen 1998). We observed a small effect size (Ellis 2010) and no statistically significant difference in risk of bias assessments between assessments (standardized mean difference ‐0.13, 95% CI ‐0.42 to 0.16) (Analysis 1.1). The estimate of effect might be slightly inaccurate, as we did not adjust for clustering in our meta‐analysis. When examined visually using a forest plot, inconsistency of results was displayed and we noted statistical heterogeneity as being 70% (I² statistic).
1.1. Analysis.
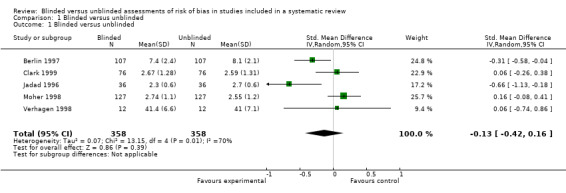
Comparison 1 Blinded versus unblinded, Outcome 1 Blinded versus unblinded.
Discussion
Summary of main results
Relatively few studies have examined whether differences exist between blinded and unblinded assessments of risk of bias during the conduct of a systematic review. Findings from the studies are inconsistent; two found that blinded assessments had significantly lower quality scores (Berlin 1997; Jadad 1996), one found significantly higher quality scores for blinded assessments (Moher 1998), and two studies did not find a significant difference between the quality scores from blinded and unblinded assessments (Clark 1999; Verhagen 1998). Pooled effects demonstrate no differences in risk of bias assessments for assessments completed in a blinded or unblinded manner.
The results of our review provide no clear guidance as to whether risk of bias assessments should be completed in a blind or unblind manner. As such this issue is still unsolved, yet is important to evaluate for pragmatic reasons. Performing blinded assessments is resource‐intensive and can take anywhere from one hour (Verhagen 1998) to 11 hours (Berlin 1997) per study. If unblinded assessments do not induce bias, this approach is likely the most resource‐efficient manner in which to complete risk of bias assessments during a systematic review. However, if blinded assessments are associated with less bias, then this approach needs to be part of the systematic review process.
Overall completeness and applicability of evidence
The forest plot displayed inconsistency of results visually and we also identified statistical heterogeneity. This inconsistency may be explained by the various methods of assessment used across the studies. For example, different scales were used (e.g. Jadad scale, Maastricht criteria list) and different study components were blinded. There simply were not enough studies to examine which blinded study aspects had more of an influence on the results. Potential confounding factors that we were unable to examine included the assessors’ level of experience with risk of bias assessments, the field of study and success of the blinding procedure (e.g. layout of the paper revealed which journal that the study was published in). We did examine the influence of a potential "cluster" effect, as some of the studies randomized the assessors while others randomized the studies to be assessed. However, using a post hoc meta‐regression analysis, such a cluster effect was not observed.
Quality of the evidence
Four of the included studies had unclear risk of bias and two had high risk of bias. This is consistent with other areas of methods research. For example, one review synthesized methodological systematic reviews and found that none of them included empirical studies with prospective designs (Tricco 2008). Another systematic review examining the effectiveness of the CONSORT checklist found that the majority of the included methodological studies used quasi‐experimental designs without a control group (Plint 2006). This might reflect difficulty in conducting this type of research or that improvement in methodological research is required.
The included studies were not well‐reported and we had to contact all of the study authors to verify the data or obtain further information. Another area warranting improvement in reporting is the provision of information about how the risk of bias was assessed during the conduct of a systematic review. For example, in one study 66.8% of the included systematic reviews provided information on quality appraisal (Moher 2007). In another study 66.4% of the included paper‐based reviews reported how the quality was appraised, while 89.7% of the included Cochrane Reviews reported this information (Wen 2008). Systematic reviewers should adequately report this information in their systematic review reports to increase reproducibility and validity of the methods employed.
The Cochrane Collaboration distinguishes between the assessment of methodological quality and risk of bias appraisal (Higgins 2009). Some components of methodological quality may not relate to bias (e.g. reporting the sample size calculation) and it is often focused on a study's reporting versus the actual study conduct. The risk of bias deals with the extent to which a study's results are believed to be true and attempts to focus on how the study was actually done. Furthermore, the risk of bias terminology overcomes rating a study as being 'low quality' when it may not be feasible (or appropriate) to conduct a particular methodological component (e.g. blinding).
Evidence also suggests that quality scores may not be appropriate to assess risk of bias (Herbison 2006; Jüni 1999). In order to address issues around study quality and the use of scores, The Cochrane Collaboration changed the terminology from 'study quality' to 'risk of bias' appraisal and developed a new tool to appraise the validity of studies included in systematic reviews (the Cochrane 'Risk of bias' tool). The Cochrane 'Risk of bias' tool differs from other quality appraisal tools because it questions the degree to which a study’s results should be believed, is based on other documents above and beyond the study report (e.g. study protocol), and the risk of bias appraisal decisions are recorded to ensure transparency (Hartling 2009). However, one study found that the Cochrane tool may take longer to conduct than another commonly used tool (the Jadad scale) and that it did not match up with all of the constructs of the Jadad scale (Hartling 2009). For example, low correlation was observed for the incomplete outcome data Cochrane item versus the Jadad withdrawal item and the Cochrane overall risk of bias and overall Jadad score. Overall, this study highlighted the utility of the Cochrane 'Risk of bias' tool to identify studies with potentially exaggerated treatment effects accurately (Hartling 2009).
Potential biases in the review process
Our Cochrane Review has several important limitations. Although our search was all‐inclusive, we heavily relied on searching electronic databases and did not conduct a formal search for unpublished literature. We did identify an abstract that was potentially relevant to our review but the abstract did not report the study results (van Tulder 1997). We contacted the authors, as well as the Cochrane Group responsible for this study and were unable to retrieve the study results. Since few studies were included in our meta‐analysis, other studies relevant to our review would likely bring clarity and increase the precision of our results. As such, we encourage further research in this area and recommend using all of the important components of the Cochrane 'Risk of bias' tool.
Agreements and disagreements with other studies or reviews
We did not find a statistically significant difference for blinded versus unblinded risk of bias appraisal, which is consistent with two of the included studies (Clark 1999; Verhagen 1998). Our results are inconsistent with three of the included studies; two observing significantly lower quality scores for blinded assessments (Berlin 1997; Jadad 1996) and one finding significantly higher quality scores for blinded assessments (Moher 1998).
Authors' conclusions
Implication for methodological research.
It would be interesting to conduct a RCT examining the influence of blinded and unblinded assessments in a systematic review using the Cochrane Risk of Bias tool. Members of the review team have discussed the possibility of conducting such a study. If conducted, the mean differences between blinded and unblinded assessments and the associated significance of the difference should be reported.
Notes
Not applicable.
Acknowledgements
We thank Alexander Tsertsvadze for all of his useful feedback on the protocol, Margaret Sampson for verification of the search strategy, Raymond Daniel for conducting the literature searches, Nick Barrowman for his statistical consultation, Lucy Turner for screening the articles for inclusion, and the Cochrane Bias Methods Group for their support.
Data and analyses
Comparison 1. Blinded versus unblinded.
| Outcome or subgroup title | No. of studies | No. of participants | Statistical method | Effect size |
|---|---|---|---|---|
| 1 Blinded versus unblinded | 5 | 716 | Std. Mean Difference (IV, Random, 95% CI) | ‐0.13 [‐0.42, 0.16] |
Characteristics of studies
Characteristics of included studies [ordered by study ID]
Berard 2000.
| Methods | Randomized controlled trial | |
| Data | Used the Chalmer's quality scale (French version) | |
| Comparisons | Randomly assigned 10 RCTs and CCTs to be assessed under blinded conditions and another 10 RCTs and CCTs to be assessed under unblinded conditions | |
| Outcomes | Mean difference in blinded versus unblinded risk of bias appraisal | |
| Notes | In the osteoporosis clinical area Blinded components: authors, affiliations, journal, publication date, funding Blinding details: not reported |
|
| Risk of bias | ||
| Item | Authors' judgement | Description |
| Allocation concealment? | Unclear | Not reported |
| Sequence generation? | Yes | Random numbers table |
| Blinding? | Unclear | Not applicable |
| Incomplete outcome data? | Yes | No missing outcome data |
| Selective outcome reporting? | Yes | Expected outcomes reported |
| Other sources of bias? | Yes | Appears to be fine |
Berlin 1997.
| Methods | Randomized controlled trial | |
| Data | Used a general form adopted from 5 published tools | |
| Comparisons | Randomly assigned 7 assessors to work in pairs to appraise 107 RCTs, CCTs or other unspecified study reports. While one pair completed a blinded assessment, another pair completed an unblinded assessment of the same study. | |
| Outcomes | Mean difference in blinded versus unblinded risk of bias appraisal | |
| Notes | Otitis media with effusion in children; acute MI; head and neck cancer; preterm delivery; non‐A, non‐B hepatitis Blinded components: authors, institutions, journal, cited literature, identity and size of treatment groups, drug identities in results, discussion section and specific conclusions in abstract Blinding details: deletion, reformatted with computer scanner, standardized font, British spelling changed to US, took an average of 11 hours per study |
|
| Risk of bias | ||
| Item | Authors' judgement | Description |
| Allocation concealment? | Unclear | Not reported |
| Sequence generation? | Yes | Computer‐generated random number |
| Blinding? | Unclear | Not applicable |
| Incomplete outcome data? | Yes | No missing outcome data |
| Selective outcome reporting? | Unclear | Agreement not reported |
| Other sources of bias? | Yes | Appears to be fine |
Clark 1999.
| Methods | RCT using a 4 x 2 x 2 repeated‐measures design | |
| Data | Used the Jadad scale (3‐item and 2‐item) | |
| Comparisons | 76 RCTs were randomly allocated into 4 groups and were reviewed during two time periods Each pair of assessors reviewed every article; one individual reviewed the blinded version and the other reviewed the unblinded version |
|
| Outcomes | Mean difference in blinded versus unblinded risk of bias appraisal | |
| Notes | Blood transfusion during elective surgery Blinded components: authors, affiliations, journal, publication date, funding, acknowledgements Blinding details: not reported |
|
| Risk of bias | ||
| Item | Authors' judgement | Description |
| Allocation concealment? | Unclear | Not reported |
| Sequence generation? | Unclear | Not reported |
| Blinding? | Unclear | Not applicable |
| Incomplete outcome data? | Yes | No missing outcome data |
| Selective outcome reporting? | Yes | Expected outcomes reported |
| Other sources of bias? | No | Articles not chosen randomly |
Jadad 1996.
| Methods | Randomized controlled trial | |
| Data | Used the Jadad scale (3‐item and 6‐item) | |
| Comparisons | Randomly allocated 15 assessors to appraise the risk of bias under blinded or unblinded assessment of 36 RCTs | |
| Outcomes | Mean difference in blinded versus unblinded risk of bias appraisal | |
| Notes | In the pain research area Blinded components: authors, affiliations, journal, publication date, funding, acknowledgements Blinding details: deletion using word processing software |
|
| Risk of bias | ||
| Item | Authors' judgement | Description |
| Allocation concealment? | Unclear | Not reported |
| Sequence generation? | Yes | Random numbers table |
| Blinding? | Unclear | Not applicable |
| Incomplete outcome data? | Yes | No missing outcome data |
| Selective outcome reporting? | Yes | Expected outcomes reported |
| Other sources of bias? | Yes | Appears to be fine |
Moher 1998.
| Methods | RCT using an incomplete randomized Latin square design | |
| Data | Used the Jadad scale (3‐item) | |
| Comparisons | Randomly assigned 8 assessors to work in pairs to assess 127 RCTs from a random sample of 12 meta‐analyses under blinded or unblinded conditions | |
| Outcomes | Mean difference in blinded versus unblinded risk of bias appraisal | |
| Notes | Digestive diseases; circulatory diseases; mental health; stroke; pregnancy and childbirth Blinded components: authors, affiliations, any other identifiers (e.g. funding), references Blinding details: black marker |
|
| Risk of bias | ||
| Item | Authors' judgement | Description |
| Allocation concealment? | Unclear | Not reported |
| Sequence generation? | Yes | Random numbers table |
| Blinding? | Unclear | Not applicable |
| Incomplete outcome data? | Yes | No missing outcome data |
| Selective outcome reporting? | Unclear | Agreement not reported |
| Other sources of bias? | Yes | Appears to be fine |
Verhagen 1998.
| Methods | Randomized controlled trial | |
| Data | Used the Maastricht criteria list | |
| Comparisons | Using a computerized random table, 12 RCTs and CCTs were scored 10 times (5 times blinded, 5 times unblinded) by 18 assessors Each reviewer scored an average of 7 articles |
|
| Outcomes | Mean difference in blinded versus unblinded risk of bias appraisal | |
| Notes | Arthritis research area Blinded components: authors, institutions, journal, results of intervention Blinding details: deletion using computer software, took 1 hour on average per study |
|
| Risk of bias | ||
| Item | Authors' judgement | Description |
| Allocation concealment? | Unclear | Not reported |
| Sequence generation? | Yes | Computerized random table |
| Blinding? | Unclear | Not applicable |
| Incomplete outcome data? | Yes | No missing outcome data |
| Selective outcome reporting? | Unclear | Agreement not reported |
| Other sources of bias? | No | Articles not chosen randomly |
MI: myocardial infarction RCT: randomized controlled trial
Characteristics of excluded studies [ordered by study ID]
| Study | Reason for exclusion |
|---|---|
| van Tulder 1997 | Results unavailable |
Differences between protocol and review
None.
Contributions of authors
Kate Morrissette: conceptualized the review, screened titles and abstracts for inclusion, screened full‐text articles for inclusion, scanned reference lists of included articles, pilot‐tested the abstraction form, extracted data from the included studies, appraised risk of bias, wrote the first draft of the manuscript, and approved the final version of the manuscript
Andrea C Tricco: conceptualized the review, screened titles and abstracts for inclusion, screened full‐text articles for inclusion, contacted authors to verify their data and identify other potentially relevant studies, pilot‐tested the abstraction form, extracted data from the included studies, appraised risk of bias, edited the draft manuscript, and approved the final version of the manuscript.
Tanya Horsley: conceptualized the review, screened titles and abstracts for inclusion, screened full‐text articles for inclusion, modified the abstraction form, appraised risk of bias, edited the draft manuscript, and approved the final version of the manuscript.
Maggie Hong Chen: conducted the statistical analysis, provided feedback on the draft manuscript, and approved the final version of the manuscript.
David Moher: conceptualized the review, resolved disagreements during screening, edited the draft manuscript, and approved the final version of the manuscript.
Sources of support
Internal sources
Ottawa Methods Centre, Ottawa Hospital Research Institute, Canada.
External sources
University of Ottawa (DM: research chair), Canada.
Canadian Institutes of Health Research (ACT: Canada Graduate Scholarship), Canada.
Declarations of interest
Kate Morissette: none declared.
Andrea C Tricco: none declared.
Tanya Horsley: none declared.
Maggie Hong Chen: none declared.
David Moher: author of an included study; one of the developers of the Cochrane 'Risk of bias' tool.
New
References
References to studies included in this review
Berard 2000 {published data only}
- Bèrard A, Andreu N, Tètrault J, Niyonsenga T, Myhal D. Reliability of Chalmers' scale to assess quality in meta‐analyses on pharmacological treatments for osteoporosis. Annals of Epidemiology 2000;10(8):498‐503. [DOI] [PubMed] [Google Scholar]
Berlin 1997 {published data only}
- Berlin JA for the University of Pennsylvania Meta‐analysis Blinding Study Group. Does blinding of readers affect the results of meta‐analyses?. Lancet 1997;350(9072):185‐6. [DOI] [PubMed] [Google Scholar]
Clark 1999 {published data only}
- Clark HD, Wells GA, Huït C, McAlister FA, Salmi LR, Fergusson D, et al. Assessing the quality of randomized trials: reliability of the Jadad scale. Controlled Clinical Trials 1999;20(5):448‐52. [DOI] [PubMed] [Google Scholar]
Jadad 1996 {published data only}
- Jadad AR, Moore RA, Carroll D, Jenkinson C, Reynolds DJ, Gavaghan DJ, et al. Assessing the quality of reports of randomized clinical trials: is blinding necessary?. Controlled Clinical Trials 1996;17(1):1‐12. [DOI] [PubMed] [Google Scholar]
Moher 1998 {published data only}
- Moher D, Pham B, Jones A, Cook DJ, Jadad AR, Moher M, et al. Does quality of reports of randomised trials affect estimates of intervention efficacy reported in meta‐analyses?. Lancet 1998;352(9128):609‐13. [DOI] [PubMed] [Google Scholar]
Verhagen 1998 {published data only}
- Verhagen AP, Vet HC, Bie RA, Kessels AG, Boers M, Knipschild PG. Balneotherapy and quality assessment: interobserver reliability of the Maastricht criteria list and the need for blinded quality assessment. Journal of Clinical Epidemiology 1998;51(4):335‐41. [DOI] [PubMed] [Google Scholar]
References to studies excluded from this review
van Tulder 1997 {unpublished data only}
- Tulder MW, Scholten RJPM, Koes BM, Bouter LM. Blinded assessment of the methodological quality. Cochrane Colloquium, Poster 266 1997.
Additional references
Assendelft 1999
- Assendelft WJ, Scholten RJ, Eijk JT, Bouter LM. The practice of systematic reviews. III. Evaluation of methodological quality of research studies. Nederlands Tijdschrift Geneeskunde 1999;143(14):714‐9. [PubMed] [Google Scholar]
Chalmers 1981
- Chalmers TC, Smith H, Blackburn B, Silverman B, Schroeder B, Reitman D, et al. A method for assessing the quality of a randomized control trial. Controlled Clinical Trials 1981;2(1):31‐49. [DOI] [PubMed] [Google Scholar]
Ellis 2010
- Ellis PD. The Essential Guide to Effect Sizes: An Introduction to Statistical Power, Meta‐Analysis and the Interpretation of Research Results. United Kingdom: Cambridge University Press, 2010. [Google Scholar]
Hartling 2009
- Hartling L, Ospina M, Liang Y, Dryden DM, Hooton N, Krebs Seida J, et al. Risk of bias versus quality assessment of randomised controlled trials: cross sectional study. BMJ 2009;339:b4012. [DOI] [PMC free article] [PubMed] [Google Scholar]
Herbison 2006
- Herbison P, Hay‐Smith J, Gillespie WJ. Adjustment of meta‐analyses on the basis of quality scores should be abandoned. Journal of Clinical Epidemiology 2006;59(12):1249‐56. [DOI] [PubMed] [Google Scholar]
Higgins 2009
- Higgins JPT, Green S (editors). Cochrane Handbook for Systematic Reviews of Interventions Version 5.0.2 [updated September 2009], The Cochrane Collaboration, 2009. Available from www.cochrane‐handbook.org.
Jüni 1999
- Jüni P, Witschi A, Bloch R, Egger M. The hazards of scoring the quality of clinical trials for meta‐analysis. JAMA 1999;282(11):1054‐60. [DOI] [PubMed] [Google Scholar]
Landis 1977
- Landis JR, Koch GG. The measurement of observer agreement for categorical data. Biometrics 1977;33:159e74. [PubMed] [Google Scholar]
Moher 1996
- Moher D, Jadad AR, Tugwell P. Assessing the quality of randomized controlled trials. Current issues and future directions. International Journal of Technology Assessment in Health Care 1996;12(2):195‐208. [DOI] [PubMed] [Google Scholar]
Moher 2007
- Moher D, Tetzlaff J, Tricco AC, Sampson M, Altman DG. Epidemiology and reporting characteristics of systematic reviews. PLoS Med 2007;4(3):e78. [DOI] [PMC free article] [PubMed] [Google Scholar]
Plint 2006
- Plint AC, Moher D, Morrison A, Schulz K, Altman DG, Hill C, et al. Does the CONSORT checklist improve the quality of reports of randomised controlled trials? A systematic review. Medical Journal of Australia 2006;185(5):263‐7. [DOI] [PubMed] [Google Scholar]
Sanderson 2007
- Sanderson S, Tatt ID, Higgins JPT. Tools for assessing quality and susceptibility to bias in observational studies in epidemiology: a systematic review and annotated bibliography. International Journal of Epidemiology 2007;36:666‐76. [DOI] [PubMed] [Google Scholar]
Tricco 2008
- Tricco AC, Tetzlaff J, Sampson M, Fergusson D, Cogo E, Horsley T, et al. Few systematic reviews exist documenting the extent of bias: a systematic review. Journal of Clinical Epidemiology 2008;61(5):422‐34. [DOI] [PubMed] [Google Scholar]
Wen 2008
- Wen J, Ren Y, Wang L, Li Y, Liu Y, Zhou M, et al. The reporting quality of meta‐analyses improves: a random sampling study. Journal of Clinical Epidemiology 2008;61(8):770‐5. [DOI] [PubMed] [Google Scholar]
West 2002
- West S, King V, Carey TS, Lohr KN, McKoy N, Sutton SF, et al. Systems to Rate the Strength of Scientific Evidence. Evidence Report/Technology Assessment No. 47 (Prepared by the Research Triangle Institute‐University of North Carolina Evidence‐based Practice Center under Contract No. 290‐97‐0011) 2002; Vol. AHRQ Publication No.02‐E016 2002. [PMC free article] [PubMed]