

Abstract

The 2019 novel coronavirus (SARS-CoV-2) epidemic, which was first reported in December 2019 in Wuhan, China, was declared a pandemic by the World Health Organization in March 2020. Genetically, SARS-CoV-2 is closely related to SARS-CoV, which caused a global epidemic with 8096 confirmed cases in more than 25 countries from 2002 to 2003. Given the significant morbidity and mortality rate, the current pandemic poses a danger to all of humanity, prompting us to understand the activity of SARS-CoV-2 at the atomic level. Experimental studies have revealed that spike proteins of both SARS-CoV-2 and SARS-CoV bind to angiotensin-converting enzyme 2 (ACE2) before entering the cell for replication. However, the binding affinities reported by different groups seem to contradict each other. Wrapp et al. (Science2020, 367, 1260–1263) showed that the spike protein of SARS-CoV-2 binds to the ACE2 peptidase domain (ACE2-PD) more strongly than does SARS-CoV, and this fact may be associated with a greater severity of the new virus. However, Walls et al. (Cell2020, 181, 281–292) reported that SARS-CoV-2 exhibits a higher binding affinity, but the difference between the two variants is relatively small. To understand the binding mechnism and experimental results, we investigated how the receptor binding domain (RBD) of SARS-CoV (SARS-CoV-RBD) and SARS-CoV-2 (SARS-CoV-2-RBD) interacts with a human ACE2-PD using molecular modeling. We applied a coarse-grained model to calculate the dissociation constant and found that SARS-CoV-2 displays a 2-fold higher binding affinity. Using steered all-atom molecular dynamics simulations, we demonstrate that, like a coarse-grained simulation, SARS-CoV-2-RBD was associated with ACE2-PD more strongly than was SARS-CoV-RBD, as evidenced by a higher rupture force and larger pulling work. We show that the binding affinity of both viruses to ACE2 is driven by electrostatic interactions.
Introduction
The 2019 novel coronavirus (SARS-CoV-2) was first reported in Wuhan, China, in December 2019. The severe acute respiratory syndrome disease caused by this virus is named COVID-19.2 The rapid spread of SARS-CoV-2 worldwide led the World Health Organization to declare a pandemic on March 11, 2020.2 As of May 8, 2020, more than 3.9 million cases of infection and about 271 thousand deaths were recorded, and thousands more are struggling for their lives in hospitals across the globe.
Clinical symptoms of Covid-19 include respiratory illness and pneumonia.3 This pathogen is known as a member of the genus β-coronavirus, which refers to severe acute coronavirus respiratory syndrome (SARS-CoV)4,5 causing a global epidemic in more than 25 countries in 2002 and 2003. SARS-CoV-26 is genetically close to the old variant SARS-CoV, but the number of confirmed cases and deaths from Covid-19 has significantly exceeded the 2002 to 2003 SARS cases in only a few months,7 and an initial review suggests that its reproductive rate is likely higher than that of SARS.7
Coronaviruses belong to the single-strand-envelope RNA virus family that can be classified into four genera.8 Both SARS-CoV and SARS-CoV-2 belong to the β genus. Coronaviruses are spherical in shape with protruding molecules from the viral surface called spike (S) proteins.9 During entry of the viral molecule into the host cell, the S protein is responsible for host binding through interaction with the receptor and for fusion of the viral and cellular membranes. In the prefusion stage, the S protein is split into two subunits S1 and S2, which noncovalently bind to each other.10 Subunit S1 binds to the receptor binding domain (RBD), and S2 mediates the fusion of the viral and cellular membranes. In the case of SARS-CoV, domain B of S1 directly interacts with angiotensin-converting enzyme 2 (ACE2) of the host cell attaching the virion to the cell surface.11−13 In addition, the injection of SARS-CoV through ACE2 may exacerbate acute pulmonary failure.14 Therefore, characterizing the molecular mechanism of the interaction between the S protein and the ACE2 receptor plays an important role in understanding the process of β-coronavirus infection.
Using the cryo-EM technique, Wrapp et al. obtained the structure of the SARS-CoV-2 S protein in the prefusion state.15 They found that the S protein of SARS-CoV-2 resembles the S of SARS-CoV. Experimental studies showed that like SARS-CoV, SARS-CoV-2 also uses ACE2 as a receptor to enter cells.16,17 Comparing the conformations of the SARS-CoV and SARS-CoV-2 at their interface with human ACE2, Yan et al. found a similarity between the receptor binding domains of SARS-CoV and SARS-CoV-2 upon binding to ACE2.18 However, there are some differences between their structures at the interface that can distinguish the binding affinity of two viral proteins. Wrapp et al.15 showed that the S protein of SARS-CoV-2 binds to the ACE2 peptidase domain (ACE2-PD) with a binding affinity clearly higher than that of SARS-CoV. The dissociation constant KD of SARS-CoV-2 is 14.7 nM, 10–20 times lower than that of SARS-CoV12,15 (Table 1). This result appears to contradict Walls et al.,17 who reported that KD is about an order of magnitude smaller and the difference between two variants is also smaller (KD ≈ 1.2 and 5 nM for SARS-CoV-2 and SARS-CoV-2, respectively) (Table 1). Therefore, understanding the binding mechanism and differences in experimental data obtained by different groups is of great interest. This problem is also important because the binding of the S protein to the host receptor is crucial to understanding why a new virus spreads faster than the old one at the atomic level.
Table 1. KD (nM) of SARS-CoV-2 and SARS-CoV Obtained by Experiment and Simulationa.
In this paper we considered the interaction of S proteins with human ACE2 by combining coarse-grained and all-atom steered molecular dynamics (SMD) simulations. All-atom models would be an ideal choice for evaluating KD, but achieving good sampling for large complexes of S protein and ACE2 is computationally challenging, prompting us to use coarse-grained models. Because coarse-grained modeling does not preserve many atomic details, SMD simulations were carried out to clarify the binding mechanism.
For clarity, we will use the following abbreviations: SARS-CoV-RBD and SARS-CoV-2-RBD denote the receptor binding domain of SARS-CoV and SARS-CoV-2, respectively, whereas ACE2-PD refers to the peptidase domain of human ACE2. With these abbreviations, the interaction of two viruses with the host receptor is simply defined as the interaction of SARS-CoV-RBD and SARS-CoV-2-RBD with ACE2-PD. The binding affinity of the two complexes will be accessed by mechanical pulling to separate SARS-CoV-RBD and SARS-CoV-2-RBD from ACE2-PD (Figure 1).
Figure 1.

(Top panel) Spike protein sequence and relative locations of different regions: RBD, receptor binding domain; SD1, subdomain 1; SD2, subdomain 2; FP, fusion peptide; HR1, heptad repeat 1; HR2, heptad repeat 2; TM, transmembrane regions; IC, intracellular domain. (Middle panel) Structures of the complex of ACE2-PD with SARS-CoV-RBD (left, PDB ID 2AJF) and SARS-CoV-2-RBD (right, PDB ID 6VW1). The arrow indicates the direction along which external force is applied in the SMD simulation. (Bottom panel) The vectors of individual hydrogen bonds in the interface are highlighted in red, and the total vector (as in the middle panel) is black.
Coarse-grained umbrella sampling simulations for SARS-CoV-2 indicate KD ≈ 7 nM, roughly 3 times less than that of SARS-CoV, implying that the new virus binds to human ACE2 slightly more strongly than the old one, and this difference in the binding affinity is not as significant as shown by the experiment of Wrapp et al.15 Our result is consistent with Walls et al.,17 who reported that KD of SARS-CoV-2 is about 4 times less than that of SARS-CoV (Table 1).
Using SMD simulations, we demonstrated that a higher rupture force (Fmax in the force–extension profile) and more pulling work are required to unbind SARS-CoV-2-RBD from ACE2-PD than to unbind SARS-CoV-RBD, which suggested that, in agreement with the experiment of Wrapp et al.,15 SARS-CoV-2 binds to ACE2 more strongly than does SARS-CoV. The binding affinity was shown to be driven by electrostatic interactions. This finding may have implications in drug design strategies in which potential drugs should be compounds that can weaken the electrostatic interaction between ACE2-PD and RBD of the virus.
Materials and Methods
Initial Structures of SARS-CoV-2-RBD and SARS-CoV-RBD Bound to ACE2-PD
The structure of ACE2-PD in complex with SARS-CoV-2-RBD was retrieved from Protein Data Bank (PDB) file PDB ID 6VW1, while the structure of ACE2-PD complexed with SARS-CoV-RBD has PDB ID 2AJF(19) (Figure 1). The PDB structures of SARS-CoV-2-RBD and SARS-CoV-RBD do not resolve 12 residues at the N-terminus and 8 residues at the C-terminus, respectively. The missing residues were added using the Modeler software package.20
Choice of Pulling Direction in the SMD Simulation
The choice of pulling direction is not unique. Nevertheless, we chose the direction so that stretching along it would break the maximum number of HBs because by trial we found that it was almost perpendicular to the two parts of the two proteins interacting at the interface if we consider these two parts to be parallel planes. Our choice was also based on the fact that the complex is stabilized by hydrogen bonds (HBs) between the two subunits.
Using Pymol software, we represent each HB between two monomers as a unit vector with two possible directions. The directions of the individual vectors should be chosen so that the sum of all the vectors is maximized (Figure 1). We have 10 and 12 vectors for SARS-CoV-RBD and SARS-CoV-2-RBD, respectively. Their total vector is shown in Figure 1, and the external force in the SMD simulation was directed along it.
Steered Molecular Dynamics
Molecular dynamics-based methods such as molecular mechanics Poisson–Boltzmann or the generalized Born surface area (MM-PB/GBSA),21 thermodynamics integration,22 free-energy perturbation,23 and umbrella sampling24 are methods that can be used to estimate the binding free energy. However, for large systems, such as the two complexes studied here, these methods are not practical due to insufficient sampling. Therefore, we use the SMD method, which is computationally fast but still reliable in predicting relative binding affinities.25−29
The simulations were performed using the GROMACS 2018.6 package,30 and the AMBER-f99SB-ILDN force field with water molecules was modeled using TIP3P.31 In the SMD simulations, a spring is attached from one side to a dummy atom and from the other side to the center of mass (CoM) of SARS-CoV-2-RBD or SARS-CoV-RBD. The dummy atom is then pulled from its initial position along the direction of the maximum total vector with a constant speed v covering a distance Δzc = vt at time t. Hence, the elastic force experienced by the chain is F = k(Δz – vt), where Δz is the displacement of the chain’s atom connected to the spring in the direction of pulling. As in the case of AFM experiments,32 in this work we chose k = 600 kJ/mol/nm2. In order to check the robustness of the results against pulling speed, we performed the simulation for three values of v = 5, 1.5, and 0.5 nm/ns. In the SMD simulation, RBD of the viral S protein was pulled, while ACE2-PD was considered to be the reference molecule. To prevent ACE2-PD from shifting during pulling, we restrained the Cα atoms of the residues, the COM of which is at a distance of more than 1.2 nm from the COM of any RBD residues of the viral S protein. A cutoff of 1.2 nm was chosen because the same cutoff was also used for nonbonded interactions. A harmonic potential with a spring constant of 1000 kJ/mol/nm2 was applied to the restrained Cα atoms.
Both complexes were solvated in a box of 19 × 18 × 18 nm3 so that there was enough space to pull the viral protein. COM of the complex is located at the 9, 9, 9 nm position. Counter ions were added to neutralize the system. The energy of the system was minimized using the steepest-descent algorithm. The system was then equilibrated in the NVT and NPT ensembles with 1 and 5 ns MD simulations, respectively. The production run was performed in the NPT ensemble at temperature T = 300 K and 1 bar of pressure, which were achieved by employing the v-rescale and Parrinello–Rahman algorithms.33,34 Bond lengths were constrained using the LINCS algorithm,35 allowing to use a time step of 2 fs. The neighbor list was updated every 10 ps. The long-range electrostatic interaction was calculated using the particle mesh Ewald (PME) method.36
Hydrogen Bonds
For analysis purposes, a hydrogen bond is considered to be present when the distance between the donor atom and acceptor atom is ≤3.5 Å and the angle between the acceptor–H-donor atoms is ≥135°.
Nonbonded Contact
A nonbonded contact is considered to be present when the distance between two Cα atoms is <6.5 Å.
Pulling Work
The pulling work is calculated using the trapezoidal rule
| 1 |
where N is the number of steps and Fi and xi are the pulling force and coordination of the COM of RBD at step i, respectively.
Coarse-Grained Model
Coarse-grained (CG) Go model simulations were performed using a previously published procedure.37 In this model, each amino acid is represented by a single interaction site centered on the Cα atom position. The energy of a given conformation of this model is calculated as
 |
2 |
The first term corresponds to the bond distance energy to hold two neighboring Cα interaction sites at a distance of r0 = 3.8 Å. The second term is the bond angle energy which employs a double-well potential that can adopt angles representative of either α or β structures of proteins.38 The next term is the standard dihedral angle potential with the sum of four terms used to approximate each virtual dihedral among four successive Cα interaction sites. Electrostatic interactions were modeled on the basis of Debye–Huckel theory with a Debye screening length of lD = 10 Å. Lysine and arginine residues are assigned a charge of +e, glutamate and aspartate are assigned a charge of −e, and all other residues are assigned a charge of 0e. The 12–10–6 potential was used for van der Waals attractive interactions.39 This potential favors the native contacts defined as in conventional Go models. Native contacts were defined on the basis of an experimental crystal structure as previously described,37 and their energy sets are based on a training set of single-domain proteins.40 Native contacts between the RBD of the S protein and ACE2 were defined in the same way as intradomain contacts.
The value of ϵijNC, which sets the depth of the energy minimum for a native contact, is calculated to be ϵij = nijϵHB + ηϵij. Here, ϵHB, and ϵij represent energy contributions arising from hydrogen bonding and van der Waals contacts between residues i and j identified from the all-atom structure of the protein, respectively. nij is the number of hydrogen bonds formed between residues i and j, and ϵHB = 0.75 kcal/mol. The value of ϵij is based on the Betancourt–Thirumalai pairwise potential.41 The scaling factor η is determined to reproduce protein stability, and its values will be given below.
Tuning the Native State Stability of Coarse-Grained Structure
The strength of the nonbonded contact energies in terms of van der Waals interactions was multiplied by a number η to tune the native state stability of the protein structures. Two different η values, named respectively ηintra and ηinter for contacts within a monomer or between monomers in a complex, were determined. For single-domain stability, we employ an average η value taken from the previous training set.40 The goal is to find the minimum η that results in a protein model that is folded at least 98% of the time during a 500 ns simulations. The choice of the “98% folded” criterion for selecting the value of η is heuristic on the basis of the following justification. If, at equilibrium at 310 K, a protein is in the folded state 98% of the time, then the folding probability is PF = 0.98 and the unfolding probability is PU = 0.02. Using the equation ΔG = −kBT ln(PF/PU), we obtain the difference in free energy between the folded and unfolded states ΔG ≈ 4kBT, which is a reasonable for a protein. Thus, it is heuristic but has a physical basis.
We ran simulations of SARS-CoV and ACE2 using different η values of 1.114, 1.359, and 1.916 (corresponding to η = ⟨η⟩ class, ⟨η⟩ class +22%, or ⟨η⟩ class + 72% using the mixed α/β structures37). For each value of η, ten 500 ns Langevin dynamics simulations at 310 K were run using a friction coefficient of 0.050 ps–1, an integration time step of 0.015 ps, and the SHAKE algorithm applied to covalent bonds. Single domains of SARS-CoV or ACE2 were considered to be folded in a simulation frame when their fraction of native contacts is greater than 0.69. ηintra = 1.359 is the lowest value that stabilizes both monomeric structures. To determine a minimum η for the interprotein interactions, ten 100 ns Langevin dynamics simulations were carried out for hetero structures of SARS-CoV and ACE2 using different overall averaged η values of 1.235, 1.507, and 2.124 (corresponding to ⟨η⟩overall, ⟨η⟩overall + 22%, and ⟨η⟩overall + 72%37). The strength of the interfacial interactions affects the stability of the heterodimer state. The whole structure is considered to be stable if the interaction energy between SARS-CoV and ACE2 is negative and the COM between the two proteins stays within 1.5 Å of the X-ray COM distance (∼9.5 Å) during the simulations. With these criteria, we find ηinter = 1.235 is the minimum value that keeps the dimer in its bound form. Different experiments give different values of the dissociation constant for the SARS-CoV systems binding to ACE2. Wrapp et al.15 reported a value of 14.7 nM for the SARS-CoV-2 complex, much lower than the 150–300 nM value for the SARS-CoV complex reported by Kirchdoerfer et al.,12 while Walls et al.17 measured a similar KD for both systems of only a few nM. Although these experiments result in different dissociation constant values, they all agree that KD should be on the level of nM.
As explained in the Method section, the choice of ηintra and ηinter is based on the requirement that the proteins in our CG models are stable folders. However, in order to reproduce the experimental result, i.e., KD is on the order of nM, we should tune these parameters. We can show that the best way to achieve this goal is to change ηintra while keeping ηinter fixed.
Using ηintra = 1.359 and ηinter = 1.235 as discussed above, we obtained KD ≈ 100 μM for the two systems. These KD values are too large in comparison to the experimental data; therefore, we ran additional simulations in which we fix ηinter at 1.235 and search for a reasonable ηintra. We found that ηintra = 1.8 results in KD on the order of nM for both the SARS-CoV and SARS-CoV-2 complexes.
Replica Exchange Umbrella Sampling (REX-US) Simulation
Chemistry at Harvard Macromolecular Mechanics (CHARMM) version c35b542 was used for all coarse-grained protein simulations. REX-US simulations were carried out using the CoM distance of interface residues as the reaction coordinate. The initial structure of the CoV-ACE2 complex is first aligned along the z axis of the local coordinate system and umbrella windows generated by translating ACE2 by 0.5 Å increments along the z dimension up to a CoM distance of 100 Å for a total of 182 windows. A harmonic restraint was applied to the CoM of each monomer to the target umbrella distance using a force constant of 7 kcal/Å.2 For each umbrella window, Langevin dynamics simulations were then run at 310 K using a frictional coefficient of 0.050 ps–1, an integration time step of 0.015 ps, and the SHAKE algorithm applied to covalent bonds. Every 5000 integration time steps a Hamiltonian replica exchange was attempted between neighboring windows. In total, 10 000 exchanges (∼750 ns of simulation time) were attempted, with the first 1000 attempted exchanges discarded to allow equilibration. The 650 ns were then used for analysis. Acceptance ratios between neighboring umbrellas were between 0.42 and 0.57.
Method for Determining Dissociation Constant KD from REX-US Simulation
Taking [CoV-ACE2], [CoV], and [ACE2] to be the concentrations of bound complex CoV-ACE2, unbound CoV, and unbound ACE2, respectively, the probability of bound (Pb) and unbound states (Pu)43 can be expressed as
| 3 |
Since we are simulating only a dimer, [CoV] = [ACE2].
The dissociation constant KD is then
| 4 |
We can then express the dissociation constant as a function of Pb, Pu, and [CoV] as
| 5 |
where [CoV] is the equilibrium concentration of monomers as given by
| 6 |
Coefficient C0 = 1660 is constant of proportionality to convert to units of molarity. Namely, in eq 6, V(r*) is measured in Å2, and the unit of concentration [CoV] is M. V(r*) is the simulation volume in which free monomers exist. Since we have radial symmetry in these simulations, it is a function of the maximum radius r* that we simulated between the separated monomers.
To determine the probability Pb, one has to integrate the potential of mean force (PMF) which can be calculated from REX-US simulations as
| 7 |
where G3D(r⃗) as the 3D potential of mean force (3D-PMF).
Using the CoM as the order parameter in our simulations, we make the simplifying assumption that the PMF is spherically symmetric, allowing us to replace ∫0rρ3D(r⃗) dr⃗ with ∫04πr2ρ1D(r) dr where r is the radial distance in spherical coordinates and eq 7 becomes
| 8 |
G1D(r) is the 1D PMF, which we calculate from the replica exchange simulations using the histogram-free formulation of the WHAM equations.44rb is the CoM distance threshold separating bound and unbound states. rb is defined as corresponding to the peak of the 1D-PMF (Figure 8). The numerical integration of eq 8 is carried out using the trapezoidal rule. Pu is then computed as 1 – Pb, and the dissociation constant is computed using eq 5.
Figure 8.
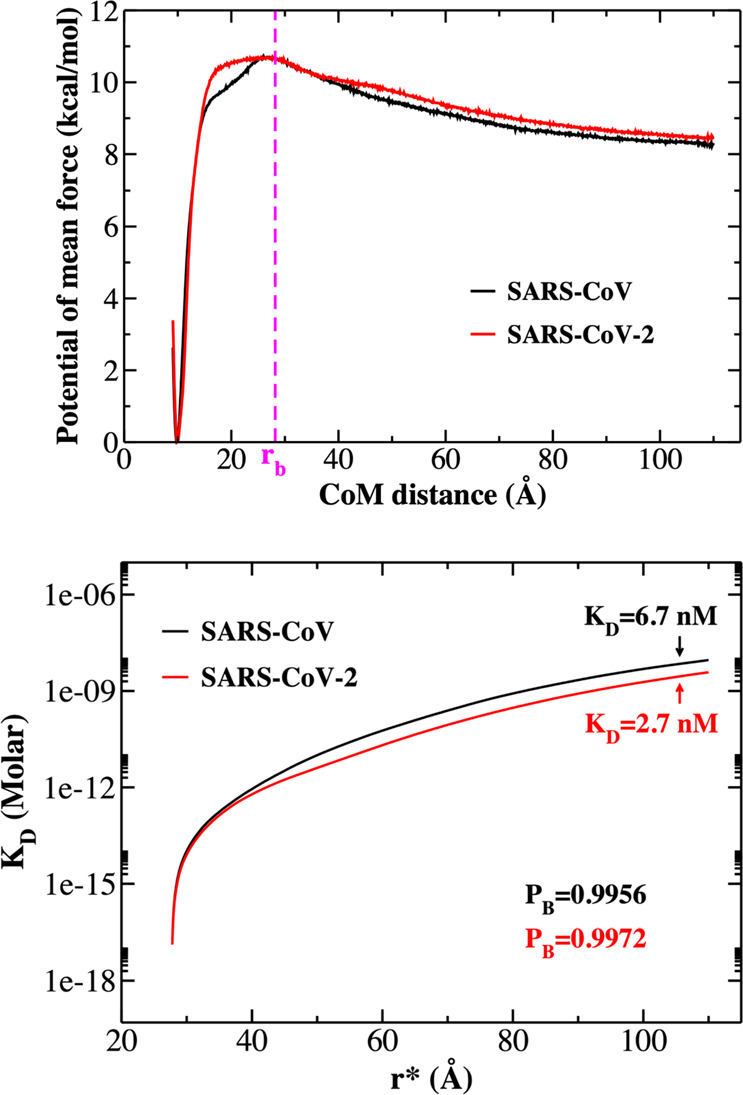
(Top) One-dimensional potential of mean force (1D-PMF) of SARS-CoV (black curve) and SARS-CoV-2 (red curve). Results were obtained by applying the WHAM analysis method for 750 ns REX-US simulations. (Bottom) KD curves as a function of r* corresponding to the change in the total free monomer concentration from eq 6. Pb and KD were determined at r* = 105 Å.
Results and Discussion
Initial Structures of SARS-CoV-RBD and SARS-CoV-2-RBD in Complex with ACE2-PD
The networks of HBs and nonbonded contacts (NBCs) between ACE2-PD and RBD of the S proteins in the initial structures used for SMD simulation are shown in Figure 2. The binding regions of the two complexes are similar, including residues 24–42, 79–83, and 329–354 (Figure 2). The superimposition of two complexes (Figure S1) also confirms this observation. The number of ACE2 residues that form HB and NBC with SARS-CoV and SARS-CoV-2 is 12 and 14, respectively, suggesting that the binding of SARS-CoV-2 with ACE2 is stronger than that of SARS-CoV.
Figure 2.

Networks of interchain HBs (green) and NBCs (red) of the initial structures used in SMD simulation. Residue indexes of the viral protein are highlighted in pink and blue, and those for ACE2, in black and green. The numbering of residues is the same as in PDB structures with the chain names shown in parentheses.
Since the residues of RBD of the two S proteins are numbered differently, the superimposition (Figure S1) allows us to determine residues at equivalent positions that form HB and NBC with ACE2-PD (Figure 2). We can show that SARS-CoV-2-RBD binds to ACE2-PD in three regions and SARS-CoV-RBD binds in two regions. The first region contains residues R426, Y436, Y484, T486, T487, G488, and Y491 in SARS-CoV, while in SARS-CoV-2 these residues are Y449, Y496, Q498, T500, G502, and Y505 (Figure S1). Yan et al. suggested that replacing R426, Y484, Y436, and T487 in SARS-CoV with N439, Q498, Y449, and N501 could alter the binding affinity between viral proteins and human ACE2.18 The second region, where both viral proteins have HB and NBC with ACE2, consists of L472, N473, A475, and Y491 in SARS-CoV, while in SARS-CoV-2 this region has three residues: F486, N487, and Y489.
In the third region (G416, V417, Y453, R454, L455, F456, Q493, and Y473 for SARS-CoV-2 and N479, D480, V404, R441, Y442, L443, and F460 for SARS-CoV), only SARS-CoV-2 forms contacts with ACE2. In general, SARS-CoV-2 and SARS-CoV form 17 NBCs with ACE2, but the number of HBs of SARS-CoV-2 (12 HBs) is greater than that of SARS-CoV (10 HBs). This result implies that SARS-CoV-2 binds to ACE2 more strongly than does SARS-CoV.
SARS-CoV-2-RBD Binds to ACE2-PD More Strongly Than Does SARS-CoV-RBD: SMD Results
The force–time profiles, obtained in the SMD simulation for the two complexes, are shown in Figure 3. Obviously, RBD of SARS-CoV-2 requires more force and time to unbind compared to the case of SARS-CoV. Averaging over five trajectories, we obtained the rupture force Fmax = 751.2 ± 42.5 and 588.2 ± 53.4 pN at v = 0.5 nm/ns for SARS-CoV-2 and SARS-CoV, respectively (Table 2). The nonequilibrium work Wneq performed by dissociating SARS-CoV-2 with ACE2 (132.1 ± 3.7 kcal/mol) is also higher than that of SARS-CoV (97.9 ± 3.0 kcal/mol) (Table 2). As shown in previous studies,25,27 the greater the pulling work and the rupture force, the higher the binding affinity. Therefore, our SMD results indicate that SARS-CoV-2-RBD binds more strongly to ACE2-PD than does SARS-CoV-RBD. These results are consistent with the experiment of Wrapp et al.,15 reporting that ACE2 is associated with SARS-CoV-2 with an affinity 10–20 times higher than with SARS-CoV. However, our assessment of dissociation constant KD using coarse-grained modeling (see below) and an experiment of Walls et al.17 showed that although the old virus exhibits a lower binding affinity the difference between the two variants is not significant.
Figure 3.

Representative force–time profiles, obtained for v = 5, 1.5, and 0.5 nm/ns.
Table 2. Nonequilibrium Work, Wneq, and Rupture Force, Fmax, Obtained in the SMD Simulation for v = 0.5, 1.5, and 5 nm/nsa.
|
v = 0.5 mn/ns |
||||||||
|---|---|---|---|---|---|---|---|---|
|
v = 5 mn/ns |
v = 1.5 mn/ns |
no salt |
150 mM salt |
|||||
| S protein | Wneq (kcal/mol) | Fmax (pN) | Wneq (kcal/mol) | Fmax (pN) | Wneq (kcal/mol) | Fmax (pN) | Wneq (kcal/mol) | Fmax (pN) |
| SARS-CoV-2 | 398.5 ± 5.7 | 1369.2 ± 93.7 | 231.9 ± 9.1 | 960.4 ± 43.2 | 132.1 ± 3.7 | 751.2 ± 42.5 | 135.0 ± 4.9 | 753.1 ± 63.8 |
| SARS-CoV | 263.8 ± 5.1 | 982.1 ± 45.2 | 124.8 ± 8.4 | 626.7 ± 51.8 | 97.9 ± 3.0 | 588.2 ± 53.4 | 98.6 ± 10.3 | 637.3 ± 65.9 |
For v = 0.5 nm/ns, an additional simulation was performed at a salt concentration of 150 mM. The errors represent standard deviations.
In order to show that our main conclusion is independent of the pulling speed, we carried out the SMD simulations at v = 1.5 and 5 nm/ns (Figure 3). As expected,27,45 the rupture force and nonequilibrium work increase with increasing v, but for both pulling speeds, Fmax and Wneq of SARS-CoV-2-RBD are higher than those for SARS-CoV-RBD (Table 2). Thus, the fact that SARS-CoV-2 binds to ACE2 more strongly than does SARS-CoV is evidence that it is robust against pulling speed. In what follows, we report the results obtained for the lowest speed, v = 0.5 nm/ns.
In order to investigate the effect of salt concentration on the SMD results, we performed additional simulations with a physiological salt concentration of 150 mM and a pulling speed of 0.5 nm/ns. Within the error bars, Fmax and the nonequilibrium work computed from these simulations are similar to values computed without salt (Table 2), which indicate that salt at the physiological concentration does not affect the SMD results.
Binding of SARS-CoV-RBD and SARS-CoV-2-RBD to ACE2-PD is Driven by Electrostatic Interactions
The time dependence of the total nonbonded interaction energy (electrostatic and van der Waals (vdW)) between ACE2-PD and RBD of two S proteins is shown in Figure 4. Because the systems are large, the interaction energy does not vanish even when the distance between the COMs of two subunits is >8 nm. The interaction between ACE2 and SARS-CoV-2-RBD is stronger than in the case of SARS-CoV, supporting the fact that the complex of SARS-CoV-2 and ACE2 is more stable than that of its partner, SARS-CoV.
Figure 4.

(Left) Time dependence of the total nonbonded interaction energy (electrostatic and vdW) of SARS-CoV and SARS-CoV-2 in complex with ACE2 and a pulling speed of 0.5 nm/ns. (Right) Time dependence of the electrostatic and vdW interaction energies of two complexes. The results were obtained by averaging over five trajectories and a time window of 0–7000 ps.
Averaging over five trajectories, we find that the electrostatic interaction is significantly stronger than vdW interactions (Figure 4, right; Table 3) for both heterodimers, implying that the binding of the novel and old viruses to ACE2 is driven by the electrostatic interaction. At pH 7.4 used in this work, the total charges of SARS-CoV-2-RBD and SARS-CoV-RBD are +3 and +2e, respectively, leading to a stronger electrostatic interaction between the former and ACE2-PD compared to the latter. In addition, within the error bars, the vdW interaction of ACE2 and SARS-CoV-2 is also stronger than that of the SARS-CoV complex (Figure 4 and Table 3).
Table 3. Nonbonded Interaction Energies (kcal/mol) Obtained by Averaging over Five Trajectories and a Time Window of 0–7000 psa.
| interaction energy (kcal/mol) | SARS-CoV | SARS-CoV-2 |
|---|---|---|
| electrostatic | –620.39 ± 2.53 | –791.41 ± 2.44 |
| van der Waals | –75.56 ± 0.98 | –84.48 ± 0.54 |
| total | –695.95 ± 3.51 | –875.89 ± 2.98 |
The pulling speed is v = 0.5 nm/ns. Errors represent standard deviations.
To confirm the finding that electrostatic interaction dominates the vdW interaction, we did the following. As follows from Figure 6, positively charged residues R1, K403, R408, R439, and K452 of SARS-CoV-2-RBD have a strong electrostatic interaction, and the total nonbonded interaction (vdW and electrostatic) with ACE2-PD is lower than or equal to −200 kcal/mol. We mutated these five residues with neutral alanine. For the mutant (R1A, K403A, R408A, R439A, and K452A), we carried out five SMD runs at a pulling speed of 0.5 nm/ns and obtained Fmax and work values of 671.7 ± 49.3 pN and 96.4 ± 8.5 kcal/mol, respectively (Table 2). Within the error bars, these values are similar to 588.2 ± 53.4 pN and 98.6 ± 10.3 kcal/mol of the old SARS-CoV-RBD (Table 2), which implies that the electrostatic interaction plays a key role in the association of the S protein with human cells. In general, the replacement of positively charged residues with neutral alanine weakens the binding of viral RBD to ACE2-PD.
Figure 6.

Energy of the nonbonded interaction between the residues of RBD of S proteins and ACE2-PD. Residues that have an energy below −100 kcal/mol are shown in blue, while red indicates residues with an energy above 100 kca/mol. Other residues are in black. In the case of SARS-CoV-2, charged residues R1, K403, R408, R439, and K452 have a total nonbonded interaction below −200 kcal/mol. Results were obtained by averaging over five trajectories and a time window of 0–7000 ps. Pulling speed v = 0.5 nm/ns.
SARS-Co-RBD Is More Flexible Than SARS-Co-2-RBD
The RMSF (root-mean-square fluctuation) profile of the residues of RBD of S glycoproteins is different for the two variants (Figure 5). In SARS-CoV, there are three regions with significant RMSF: the blue and magenta regions are located on the border with ACE2-PD, and the cyan region is in contact with solvent molecules but not with ACE2-PD. In SARS-CoV-2, the red, yellow, and blue regions, which are located at the interface with ACE2, have significant RMSFs (Figure 5). The 380–420 region strongly fluctuates in SARS-CoV but not in SARS-CoV-2. Three other regions with high RMSFs are highlighted in cyan, magenta, and yellow. They have contact with solvent molecules but not with ACE2. Overall, having a lower RMSF, SARS-Co-RBD is more flexible in complex with ACE2 than is SARS-CoV-2-RBD (Figure 5), supporting the increased binding affinity of the novel virus to the receptor cell.
Figure 5.

RMSF of the residues of viral RBD S proteins, obtained in the SMD simulation with v = 0.5 nm/ns. The regions with high RMSFs are shown with colored bands. Blue refers to the area where the RBD residues are in contact with ACE2-PD. The results were obtained by averaging over five trajectories and a time window of 0–7000 ps.
The RMSF (root-mean-square fluctuation) profiles of the residues of viral RBD proteins are different for the two viruses (Figure 5). In SARS-CoV, there are five regions with a significant RMSF and only the blue region is located on the border with ACE2-PD, while the other regions are in contact with solvent molecules but not with ACE2-PD. In SARS-CoV-2, the two blue regions, which are located at the interface with ACE2, have significant RMSFs (Figure 5). A few residues at the C-terminus have very strong fluctuations because they are entirely located in the bulk. The 394–420 region strongly fluctuates in SARS-CoV (red region) but not in SARS-CoV-2. Three other regions of SARS-CoV-2 with high RMSFs are highlighted in cyan, magenta, and yellow. They have contact with solvent molecules but not with ACE2.
Averaging over all residues we obtained RMSFs of 1.04 and 1.08 Å for SARS-CoV and SARS-CoV-2, respectively. However, for residues that are in contact with ACE2-PD the mean RMSF for SARS-CoV (1.53 Å) is higher than that for SARS-Cov-2 (1.27 Å). Thus, having a higher RMSF, SARS-CoV-RBD is more flexible in complex with ACE2 than is SARS-CoV-2-RBD (Figure 5). This may support the increased binding affinity of the novel virus to the receptor cell.
Role of Specific Residues of ACE2-PD
The contributions of ACE2-PD residues to the energy of the nonbonded interaction with RBD of the S protein have similar profiles for the two complexes (Figure S2). This is expected because in both complexes ACE2-PD has the same sequence and its structures are highly overlapped (Figure S1). In general, the interaction energies of individual ACE2-PD residues in complex with SARS-CoV-2 are lower than in SARS-CoV, which is consistent with the results obtained for the rupture force and nonequilibrium work.
Role of Specific Residues of RBD of S Proteins
The interaction energy profiles of the viral protein residues with ACE2-PD (Figure 6) show that regions 425–460 of SARS-CoV-RBD and 450–475 of SARS-CoV-2-RBD contain many residues that attract ACE2-PD strongly. However, in both RBDs there is no specific segment that dominates the interaction between the two monomers because prominent residues are distributed discretely over the entire sequences (Figure 6). These distributions are almost identical in SARS-CoV-RBD and SARS-CoV-2-RBD. For both viral S proteins, RBD residues that have medium interaction with ACE2-PD are located in the region of 460–500. Therefore, there is no specific region of SARS-CoV-2-RBD that can play a dominant role in the difference between the two variants in their propensity to bind to human ACE2-PD.
In order to understand the role of the residues that are different for SARS-Cov and SARS-Cov-2 at the interface, we superimposed the structures of two complexes as shown in Figure 7, where a list of these residues in three regions is given in the upper panel. For example, in region 1 they are R426, Y436, Y484, and T487 for SARS-Cov and R439, Y449, Q498, and N501 for SARS-Cov-2. Yan et al. suggested that these sequence variations may result in differences in the binding affinity with ACE2,18 but the corresponding interaction energy was not obtained. We verified this assumption by calculating the interaction energy of individual residues using the SMD simulation. In general, SARS-CoV-2-RBD residues have a stronger nonbonded interaction with ACE2 than their counterparts in SARS-CoV-RBD. (See the numbers in parentheses next to each residue in Figure 7.) The difference in the interaction energy of one pair is insignificant compared to the total interaction energy (Figure 7 and Table 3). Using the numbers shown in Figure 7, we can show that the contribution of all of the selected residues to the interaction energy difference is about −82.8 kcal/mol, which is significant compared to the total energy difference between the SARS-CoV-2 and SARS-CoV complexes (about −179.9 kcal/mol, Table 3). Thus, our SMD results confirm the previous assumption18 that variations in the sequence of RBD at the border with ACE2 significantly affect the binding affinity.
Figure 7.

(Upper panel) List of the residues that are different for SARS-Cov and SARS-Cov-2 in three regions denoted by boxes at the interface. (Middle panel, left) Interface with three regions enclosed in boxes. For the SARS-CoV system, the viral protein is shown in cyan, and magenta highlights ACE2-PD. For the SARS-CoV-2 system, the viral protein and ACE2-PD are highlighted in orange and green, respectively. The bottom and middle panels (right) refer to regions 1, 2, and 3. The residues of the viral protein in SARS-CoV and SARS-CoV-2 are highlighted in teal and orange, respectively. The numbers in parentheses denote the mean nonbonded interaction energies between these residues and ACE2-PD (kcal/mol). Results were obtained by averaging over five trajectories and a time window of 0–7000 ps. Pulling speed v = 0.5 nm/ns.
Estimation of the Difference in Binding Affinity between SARS-CoV and SARS-CoV2 to Human ACE
Combining Jarzynski’s equality46,47 and SMD, we can determine the absolute binding affinity, but this approach is not reliable for our large systems because a huge number of SMD trajectories are required.48 Therefore, in this section, we calculate the dissociation constant KD for both complexes using CG-MD replica exchange umbrella sampling. We used the same set of η value as described in the Materials and Methods for both single-domain and dimer simulations.
To ensure the sampling was converged, we constructed 1D-PMF profiles for different time windows including 75–400, 400–750, and 75–750 ns. Since these profiles are nearly identical for the three windows tested (Figure S3), we conclude that the quantities we calculated represent equilibrium values, and we report the results obtained for the widest window of 75–750 ns for further analyses (Figure 8, upper panel).
As seen from 1D-PMF profiles (Figure 8), a barrier separating the bound and unbound regimes occurs at a CoM distance of rb ≈ 28 Å for both complexes, while the most stable bound state is near the native-state CoM distance of ∼10 Å. To determine KD, we calculated Pb at different r* values (eq 3) and then used eq 5 to calculate KD. Figure 8 (lower panel) plots KD as a function of the distance r*. As seen in this figure, KD increases with the increase in r* and tends to converge at large r* as expected because physically KD should not depend on r*. To calculate KD, we need to determine a cutoff value of r* above which the interaction between CoV and ACE2 disappears. We can show that for both complexes the cutoff is r* ≈ 105 Å, and we use this value for estimating KD. Substituting r* = 105 Å into eq 3, we obtained Pb = 0.9956 and 0.9972 for the SARS-CoV and SARS-CoV-2 complexes, respectively (Figure 8, lower panel). Using eq 6, we obtained the free monomer concentrations [CoV] = 3.0 μM and [CoV-2] = 1.9 μM. Finally, using eq 5 and Figure 8, we obtained KD = 6.7 and 2.7 nM for the dissociation constants of SARS-CoV and SARS-CoV-2 complexes, respectively, which implies that both viruses tightly bind to human ACE2. This result is also consistent with the SMD results in which SARS-CoV-2 binds to ACE2-PD better than SARS-CoV.
Using the surface plasmon resonance technique for SARS-CoV-2, Wrapp et al.15 obtained KD = 14.7 nM, and while using biolayer interferometry, Walls et al.17 obtained KD = 1.2 ± 0.1 nM (Table 1; note that error bars were not reported in Wrapp et al.). The difference between them is probably related to experimental techniques, and the result of the latter group is closer to our value of 2.7 nM. More importantly, the relative binding affinities reported by three groups are different. For SARS-CoV, Wrapp et al.15 and Kirchdoerfer et al.12 reported KD ≈ 150–300 nM, which is 10–20 times greater than that of SARS-CoV-2, implying that the old virus is much more weakly associated with ACE2 than the new virus.
Walls et al.17 advocated that KD of SARS-CoV is roughly 4 times larger than KD of SARS-CoV-2, while our simulation yields an approximately 2 times larger value (Table 1). Therefore, contrary to Wrapp et al. the experimental and theoretical results of these groups show that SARS-CoV-2 binds to the host cell slightly more strongly than does SARS-CoV. We can estimate the binding free energy using the relation ΔGbind = −kBT ln(KD), where KD is measured in M. Since at room temperature kBT ≈ 0.592 kcal/mol, differences in KD of 2- and 4-fold result only in differences in ΔGbind of about 0.4 and 0.8 kcal/mol, respectively, which once again confirms that both in vitro(17) and in silico experiments provided a small difference in the binding affinities of the two viruses.
It should be noted that the difference in binding free energies of 1 to 2 kcal/mol is practically within the calculation error. Consequently, the difference in ΔGbind of approximately 0.4 kcal/mol obtained with coarse-grained umbrella sampling is marginal. However, the result shown in Figure 8 correctly reflects the tendency that SARS-CoV-2 binds more strongly with the host cell than does SARS-CoV.
Conclusions
Recent experiments have shown that both SARS-CoV and SARS-CoV-2 bind strongly to ACE2 with a KD of 1–100 nM, which allow them to invade host cells. Both the experiment of Walls et al.17 and our simulation show that with a lower KD, SARS-CoV-2 binds more strongly than SARS-CoV, but the difference is small in terms of differential binding free energies. In contrast, a large difference between the two S proteins was observed by Wrapp et al.,12,15 which partially helps us to understand why the Wuhan virus spreads faster. Moreover, due to high-binding-affinity human organs which are rich in ACE2 in the oral and nasal mucosa, the lungs, skin, lymph nodes, stomach, small intestine, colon, thymus, bone marrow, kidneys, spleen, liver, and brain can be easily infected.49 Because the binding of the virus to host cells is the first important step in the infection process, preventing S protein from interacting with ACE2 is one of the strategies to stop a viral outbreak. Therefore, this protein is a primary target for developing potential drugs to combat the pandemic.50
The result obtained for the rupture force and nonequilibrium work using all-atom SMD simulations indicates that the RBD of the new virus binds more tightly than the old one. Because this method can predict only the relative binding affinity, KD cannot be determined and compared with the experiment. However, the SMD approach has advantages over the experiment and coarse-grained modeling and allows us to characterize the binding process in atomic detail and demonstrate that the electrostatic interaction is more important than the vdW interaction in stabilizing the studied heterodimers.
Recent experiments51 have shown that many antibodies, such as CR3022, bind to SARS-CoV but not to SARS-CoV-2. It would be interesting to study this phenomenon using molecular simulations because a deep understanding of the underlying structural origin of binding affinities is useful for the development of new monoclonal antibodies (as candidate therapeutics) that can specifically bind to SARS-CoV-2 RBD.
Acknowledgments
This work was supported by the Department of Science and Technology at Ho Chi Minh City (grants 07/2019/HĐ-KHCNTT and 02/2019/HĐ-KHCNTT), the Vietnam Ministry Education and Training (project B2019.SPD.03), the Domestic Master/PhD Scholarship Programme of Vingroup Innovation Foundation (H.L.N.) Vietnam, and the Narodowe Centrum Nauki in Poland (grant 2019/35/B/ST4/02086). This research was supported by supercomputer centre TASK in Gdansk, PLGrid infrastructure, Poland, and computer cluster at ICST, Vietnam. E.P.O. acknowledges funding support from the National Science Foundation (MCB-1553291) and the National Institutes of Health (R35-GM124818).
Supporting Information Available
The Supporting Information is available free of charge at https://pubs.acs.org/doi/10.1021/acs.jpcb.0c04511.
Superimposition of the initial structures of two complexes; contributions of the residues of ACE2-PD to the nonbonded interaction energy; and convergence of coarse-grained REX-US simulations (PDF)
Author Contributions
+ H.L.N., P.D.L., and N.Q.T. contributed equally.
The authors declare no competing financial interest.
Supplementary Material
References
- Organization, W. H. WHO Director-General’s opening remarks at the media briefing on COVID-19–11 March 2020. Geneva, Switzerland, 2020.
- Huang C.; Wang Y.; Li X.; Ren L.; Zhao J.; Hu Y.; Zhang L.; Fan G.; Xu J.; Gu X.; et al. Clinical features of patients infected with 2019 novel coronavirus in Wuhan. Lancet 2020, 395, 497–506. 10.1016/S0140-6736(20)30183-5. [DOI] [PMC free article] [PubMed] [Google Scholar]
- Chan J. F.-W.; Kok K.-H.; Zhu Z.; Chu H.; To K. K.-W.; Yuan S.; Yuen K.-Y. Genomic characterization of the 2019 novel human-pathogenic coronavirus isolated from a patient with atypical pneumonia after visiting Wuhan. Emerging Microbes Infect. 2020, 9, 221–236. 10.1080/22221751.2020.1719902. [DOI] [PMC free article] [PubMed] [Google Scholar]
- Wan Y.; Shang J.; Graham R.; Baric R. S.; Li F.. Receptor recognition by novel coronavirus from Wuhan: An analysis based on decade-long structural studies of SARS J. Virology 2020, 10.1128/JVI.00127-20. [DOI] [PMC free article] [PubMed] [Google Scholar]
- Gorbalenya A. E.; Baker S. C.; Baric R. S.; de Groot R. J.; Drosten C.; Gulyaeva A. A.; Haagmans B. L.; Lauber C.; Leontovich A. M.; Neuman B. W.; et al. Coronaviridae Study Group of the International Committee on Taxonomy of, V. The species Severe acute respiratory syndrome-related coronavirus: classifying 2019-nCoV and naming it SARS-CoV-2. Nat. Microbiol. 2020, 5, 536–544. 10.1038/s41564-020-0695-z. [DOI] [PMC free article] [PubMed] [Google Scholar]
- Liu Y.; Gayle A. A.; Wilder-Smith A.; Rocklöv J. The reproductive number of COVID-19 is higher compared to SARS coronavirus. J. Travel Med. 2020, 27, taaa021. 10.1093/jtm/taaa021. [DOI] [PMC free article] [PubMed] [Google Scholar]
- Perlman S.; Netland J. Coronaviruses post-SARS: update on replication and pathogenesis. Nat. Rev. Microbiol. 2009, 7, 439–450. 10.1038/nrmicro2147. [DOI] [PMC free article] [PubMed] [Google Scholar]
- Tortorici M. A.; Veesler D. In Advances in Virus Research; Rey F. A., Ed.; Academic Press, 2019; Vol. 105, Chapter 4, pp 93–116. [DOI] [PMC free article] [PubMed] [Google Scholar]
- Belouzard S.; Chu V. C.; Whittaker G. R. Activation of the SARS coronavirus spike protein via sequential proteolytic cleavage at two distinct sites. Proc. Natl. Acad. Sci. U. S. A. 2009, 106, 5871–5876. 10.1073/pnas.0809524106. [DOI] [PMC free article] [PubMed] [Google Scholar]
- Ge X.-Y.; Li J.-L.; Yang X.-L.; Chmura A. A.; Zhu G.; Epstein J. H.; Mazet J. K.; Hu B.; Zhang W.; Peng C.; et al. Isolation and characterization of a bat SARS-like coronavirus that uses the ACE2 receptor. Nature 2013, 503, 535–538. 10.1038/nature12711. [DOI] [PMC free article] [PubMed] [Google Scholar]
- Kirchdoerfer R. N.; Wang N.; Pallesen J.; Wrapp D.; Turner H. L.; Cottrell C. A.; Corbett K. S.; Graham B. S.; McLellan J. S.; Ward A. B. Stabilized coronavirus spikes are resistant to conformational changes induced by receptor recognition or proteolysis. Sci. Rep. 2018, 8, 15701. 10.1038/s41598-018-34171-7. [DOI] [PMC free article] [PubMed] [Google Scholar]
- Li W.; Moore M. J.; Vasilieva N.; Sui J.; Wong S. K.; Berne M. A.; Somasundaran M.; Sullivan J. L.; Luzuriaga K.; Greenough T. C.; et al. Angiotensin-converting enzyme 2 is a functional receptor for the SARS coronavirus. Nature 2003, 426, 450–454. 10.1038/nature02145. [DOI] [PMC free article] [PubMed] [Google Scholar]
- Kuba K.; Imai Y.; Rao S.; Gao H.; Guo F.; Guan B.; Huan Y.; Yang P.; Zhang Y.; Deng W.; et al. A crucial role of angiotensin converting enzyme 2 (ACE2) in SARS coronavirus–induced lung injury. Nat. Med. 2005, 11, 875–879. 10.1038/nm1267. [DOI] [PMC free article] [PubMed] [Google Scholar]
- Wrapp D.; Wang N.; Corbett K. S.; Goldsmith J. A.; Hsieh C.-L.; Abiona O.; Graham B. S.; McLellan J. S. Cryo-EM structure of the 2019-nCoV spike in the prefusion conformation. Science 2020, 367, 1260–1263. 10.1126/science.abb2507. [DOI] [PMC free article] [PubMed] [Google Scholar]
- Zhou P.; Yang X.-L.; Wang X.-G.; Hu B.; Zhang L.; Zhang W.; Si H.-R.; Zhu Y.; Li B.; Huang C.-L.; et al. A pneumonia outbreak associated with a new coronavirus of probable bat origin. Nature 2020, 579, 270–273. 10.1038/s41586-020-2012-7. [DOI] [PMC free article] [PubMed] [Google Scholar]
- Walls A. C.; Park Y.-J.; Tortorici M. A.; Wall A.; McGuire A. T.; Veesler D. Structure, Function, and Antigenicity of the SARS-CoV-2 Spike Glycoprotein. Cell 2020, 180, 181–292. 10.1016/j.cell.2020.02.058. [DOI] [PMC free article] [PubMed] [Google Scholar]
- Yan R.; Zhang Y.; Li Y.; Xia L.; Guo Y.; Zhou Q. Structural basis for the recognition of SARS-CoV-2 by full-length human ACE2. Science 2020, 367, 1444–1448. 10.1126/science.abb2762. [DOI] [PMC free article] [PubMed] [Google Scholar]
- Li F.; Li W.; Farzan M.; Harrison S. C. Structure of SARS Coronavirus Spike Receptor-Binding Domain Complexed with Receptor. Science 2005, 309, 1864–1868. 10.1126/science.1116480. [DOI] [PubMed] [Google Scholar]
- Webb B.; Sali A. Comparative Protein Structure Modeling Using MODELLER. Curr. Protoc. Bioinformatics 2014, 47, 5.6.1–5.6.32. 10.1002/0471250953.bi0506s47. [DOI] [PubMed] [Google Scholar]
- Genheden S.; Ryde U. The MM/PBSA and MM/GBSA methods to estimate ligand-binding affinities. Expert Opin. Drug Discovery 2015, 10, 449–461. 10.1517/17460441.2015.1032936. [DOI] [PMC free article] [PubMed] [Google Scholar]
- Bhati A. P.; Wan S.; Wright D. W.; Coveney P. V. Rapid, Accurate, Precise, and Reliable Relative Free Energy Prediction Using Ensemble Based Thermodynamic Integration. J. Chem. Theory Comput. 2017, 13, 210–222. 10.1021/acs.jctc.6b00979. [DOI] [PubMed] [Google Scholar]
- Miyata T.; Ikuta Y.; Hirata F. Free energy calculation using molecular dynamics simulation combined with the three dimensional reference interaction site model theory. I. Free energy perturbation and thermodynamic integration along a coupling parameter. J. Chem. Phys. 2010, 133, 044114 10.1063/1.3462276. [DOI] [PubMed] [Google Scholar]
- Torrie G. M.; Valleau J. P. Nonphysical sampling distributions in Monte Carlo free-energy estimation: Umbrella sampling. J. Comput. Phys. 1977, 23, 187–199. 10.1016/0021-9991(77)90121-8. [DOI] [Google Scholar]
- Mai B. K.; Li M. S. Neuraminidase inhibitor R-125489 – A promising drug for treating influenza virus: Steered molecular dynamics approach. Biochem. Biophys. Res. Commun. 2011, 410, 688–691. 10.1016/j.bbrc.2011.06.057. [DOI] [PubMed] [Google Scholar]
- Suan Li M.; Khanh Mai B. Steered molecular dynamics-a promising tool for drug design. Curr. Bioinf. 2012, 7, 342–351. 10.2174/157489312803901009. [DOI] [Google Scholar]
- Vuong Q. V.; Nguyen T. T.; Li M. S. A New Method for Navigating Optimal Direction for Pulling Ligand from Binding Pocket: Application to Ranking Binding Affinity by Steered Molecular Dynamics. J. Chem. Inf. Model. 2015, 55, 2731–2738. 10.1021/acs.jcim.5b00386. [DOI] [PubMed] [Google Scholar]
- Colizzi F.; Perozzo R.; Scapozza L.; Recanatini M.; Cavalli A. Single-molecule pulling simulations can discern active from inactive enzyme inhibitors. J. Am. Chem. Soc. 2010, 132, 7361–7371. 10.1021/ja100259r. [DOI] [PubMed] [Google Scholar]
- Truong D. T.; Li M. S. Probing the Binding Affinity by Jarzynski’s Nonequilibrium Binding Free Energy and Rupture Time. J. Phys. Chem. B 2018, 122, 4693–4699. 10.1021/acs.jpcb.8b02137. [DOI] [PubMed] [Google Scholar]
- Abraham M. J.; Murtola T.; Schulz R.; Páll S.; Smith J. C.; Hess B.; Lindahl E. GROMACS: High performance molecular simulations through multi-level parallelism from laptops to supercomputers. SoftwareX 2015, 1, 19–25. 10.1016/j.softx.2015.06.001. [DOI] [Google Scholar]
- Jorgensen W. L.; Jenson C. Temperature dependence of TIP3P, SPC, and TIP4P water from NPT Monte Carlo simulations: Seeking temperatures of maximum density. J. Comput. Chem. 1998, 19, 1179–1186. 10.1002/(SICI)1096-987X(19980730)19:10<1179::AID-JCC6>3.0.CO;2-J. [DOI] [Google Scholar]
- Binnig G.; Quate C. F.; Gerber C. Atomic Force Microscope. Phys. Rev. Lett. 1986, 56, 930–933. 10.1103/PhysRevLett.56.930. [DOI] [PubMed] [Google Scholar]
- Bussi G.; Donadio D.; Parrinello M. Canonical sampling through velocity rescaling. J. Chem. Phys. 2007, 126, 014101 10.1063/1.2408420. [DOI] [PubMed] [Google Scholar]
- Parrinello M.; Rahman A. Polymorphic transitions in single crystals: A new molecular dynamics method. J. Appl. Phys. 1981, 52, 7182–7190. 10.1063/1.328693. [DOI] [Google Scholar]
- Hess B.; Bekker H.; Berendsen H. J.; Fraaije J. G. LINCS: a linear constraint solver for molecular simulations. J. Comput. Chem. 1997, 18, 1463–1472. 10.1002/(SICI)1096-987X(199709)18:12<1463::AID-JCC4>3.0.CO;2-H. [DOI] [Google Scholar]
- Darden T.; York D.; Pedersen L. Particle mesh Ewald: An N· log (N) method for Ewald sums in large systems. J. Chem. Phys. 1993, 98, 10089–10092. 10.1063/1.464397. [DOI] [Google Scholar]
- Nissley D. A.; Vu Q. V.; Trovato F.; Ahmed N.; Jiang Y.; Li M. S.; O’Brien E. P. Electrostatic Interactions Govern Extreme Nascent Protein Ejection Times from Ribosomes and Can Delay Ribosome Recycling. J. Am. Chem. Soc. 2020, 142, 6103–6110. 10.1021/jacs.9b12264. [DOI] [PMC free article] [PubMed] [Google Scholar]
- Best R. B.; Chen Y.-G.; Hummer G. Slow Protein Conformational Dynamics from Multiple Experimental Structures: The Helix/Sheet Transition of Arc Repressor. Structure 2005, 13, 1755–1763. 10.1016/j.str.2005.08.009. [DOI] [PubMed] [Google Scholar]
- Karanicolas J.; Brooks C. L. III The origins of asymmetry in the folding transition states of protein L and protein G. Protein Sci. 2002, 11, 2351–2361. 10.1110/ps.0205402. [DOI] [PMC free article] [PubMed] [Google Scholar]
- Leininger S. E.; Trovato F.; Nissley D. A.; O’Brien E. P. Domain topology, stability, and translation speed determine mechanical force generation on the ribosome. Proc. Natl. Acad. Sci. U. S. A. 2019, 116, 5523–5532. 10.1073/pnas.1813003116. [DOI] [PMC free article] [PubMed] [Google Scholar]
- Betancourt M. R.; Thirumalai D. Pair potentials for protein folding: Choice of reference states and sensitivity of predicted native states to variations in the interaction schemes. Protein Sci. 1999, 8, 361–369. 10.1110/ps.8.2.361. [DOI] [PMC free article] [PubMed] [Google Scholar]
- Brooks B. R.; Brooks C. L. III; Mackerell A. D. Jr.; Nilsson L.; Petrella R. J.; Roux B.; Won Y.; Archontis G.; Bartels C.; Boresch S.; et al. CHARMM: The biomolecular simulation program. J. Comput. Chem. 2009, 30, 1545–1614. 10.1002/jcc.21287. [DOI] [PMC free article] [PubMed] [Google Scholar]
- Kim Y. C.; Hummer G. Coarse-grained models for simulations of multiprotein complexes: application to ubiquitin binding. J. Mol. Biol. 2008, 375, 1416–1433. 10.1016/j.jmb.2007.11.063. [DOI] [PMC free article] [PubMed] [Google Scholar]
- Kumar S.; Rosenberg J. M.; Bouzida D.; Swendsen R. H.; Kollman P. A. THE weighted histogram analysis method for free-energy calculations on biomolecules. I. The method. J. Comput. Chem. 1992, 13, 1011–1021. 10.1002/jcc.540130812. [DOI] [Google Scholar]
- Heymann B.; Grubmuller H. AN02/DNP-hapten unbinding forces studied by molecular dynamics atomic force microscopy simulations. Chem. Phys. Lett. 1999, 303, 1–9. 10.1016/S0009-2614(99)00183-9. [DOI] [Google Scholar]
- Jarzynski C. Nonequilibrium equality for free energy differences. Phys. Rev. Lett. 1997, 78, 2690–2693. 10.1103/PhysRevLett.78.2690. [DOI] [Google Scholar]
- Crooks G. E. Nonequilibrium measurements of free energy differences for microscopically reversible Markovian systems. J. Stat. Phys. 1998, 90, 1481–1487. 10.1023/A:1023208217925. [DOI] [Google Scholar]
- Park S.; Schulten K. Calculating potentials of mean force from steered molecular dynamics simulations. J. Chem. Phys. 2004, 120, 5946–5961. 10.1063/1.1651473. [DOI] [PubMed] [Google Scholar]
- Xu H.; Zhong L.; Deng J.; Peng J.; Dan H.; Zeng X.; Li T.; Chen Q. High expression of ACE2 receptor of 2019-nCoV on the epithelial cells of oral mucosa. Int. J. Oral Sci. 2020, 12, 8. 10.1038/s41368-020-0074-x. [DOI] [PMC free article] [PubMed] [Google Scholar]
- Liu C.; Zhou Q.; Li Y.; Garner L. V.; Watkins S. P.; Carter L. J.; Smoot J.; Gregg A. C.; Daniels A. D.; Jervey S.; Albaiu D. Research and Development on Therapeutic Agents and Vaccines for COVID-19 and Related Human Coronavirus Diseases. ACS Cent. Sci. 2020, 6, 315–331. 10.1021/acscentsci.0c00272. [DOI] [PMC free article] [PubMed] [Google Scholar]
- Tian X.; Li C.; Huang A.; Xia S.; Lu S.; Shi Z.; Lu L.; Jiang S.; Yang Z.; Wu Y.; Ying T. Potent binding of 2019 novel coronavirus spike protein by a SARS coronavirus-specific human monoclonal antibody. Emerging Microbes Infect. 2020, 9, 382–385. 10.1080/22221751.2020.1729069. [DOI] [PMC free article] [PubMed] [Google Scholar]
Associated Data
This section collects any data citations, data availability statements, or supplementary materials included in this article.