

SUMMARY
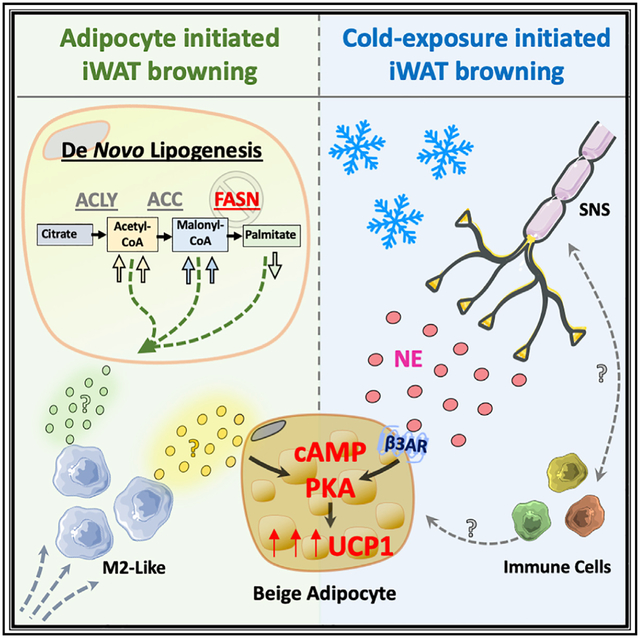
Adipocytes deficient in fatty acid synthase (iAdFASNKO) emit signals that mimic cold exposure to enhance the appearance of thermogenic beige adipocytes in mouse inguinal white adipose tissues (iWATs). Both cold exposure and iAdFASNKO upregulate the sympathetic nerve fiber (SNF) modulator Neuregulin 4 (Nrg4), activate SNFs, and require adipocyte cyclic AMP/protein kinase A (cAMP/PKA) signaling for beige adipocyte appearance, as it is blocked by adipocyte Gsα deficiency. Surprisingly, however, in contrast to cold-exposed mice, neither iWAT denervation nor Nrg4 loss attenuated adipocyte browning in iAdFASNKO mice. Single-cell transcriptomic analysis of iWAT stromal cells revealed increased macrophages displaying gene expression signatures of the alternately activated type in iAdFASNKO mice, and their depletion abrogated iWAT beiging. Altogether, these findings reveal that divergent cellular pathways are sufficient to cause adipocyte browning. Importantly, adipocyte signaling to enhance alternatively activated macrophages in iAdFASNKO mice is associated with enhanced adipose thermogenesis independent of the sympathetic neuron involvement this process requires in the cold.
Graphical Abstract
In Brief
Henriques et al. show an alternative pathway to enhance thermogenesis through an adipocyte cAMP/PKA axis in denervated iWAT. Signals emanating from this pathway generate M2-type macrophages associated with iWAT browning.
INTRODUCTION
It is well recognized that adipose tissue depots in rodents and humans can strongly influence systemic glucose and lipid homeostasis (Chouchani and Kajimura, 2019; Czech, 2020; Rosen and Spiegelman, 2006). Thermogenic brown and beige adipocytes are especially active in this regard, as they can enhance energy expenditure as well as secrete potent factors that act on the metabolism of distant tissues (Scheele and Wolfrum, 2020; Villarroya et al., 2017; Villarroya et al., 2019; Wu et al., 2012). Expansion of brown adipose tissue (BAT) and increased appearance of beige adipocytes in inguinal white adipose tissue (iWAT) of mice and humans during cold exposure are associated with the remodeling of tissue architecture (Herz and Kiefer, 2019; Saito et al., 2009; van Marken Lichtenbelt et al., 2009) and are controlled by activation of local sympathetic nerve fiber (SNF) activity (Bartness et al., 2010; Chi et al., 2018; Guilherme et al., 2019; Jiang et al., 2017). Single-cell RNA transcriptomic analysis has corroborated the extensive cellular heterogeneity of adipose depots and identified various resident immune cells and other cell types that are present (Burl et al., 2018; Hill et al., 2018; Jaitin et al., 2019; Merrick et al., 2019; Rajbhandari et al., 2019; Weinstock et al., 2019). Moreover, the association between increased abundance of iWAT macrophages with anti-inflammatory, alternatively activated properties and cold-induced adipose remodeling has been demonstrated (Burl et al., 2018; Hui et al., 2015; Lv et al., 2016; Shan et al., 2017). Norepinephrine (NE) released from SNFs activates the β-adrenergic receptor (βAR)-cyclic AMP/protein kinase A (cAMP/PKA) signaling pathway to induce these morphological and thermogenic changes during cold stimulation (Ceddia and Collins, 2020; Li et al., 2016). Accordingly, denervation of iWAT depots blocks cold-induced thermogenesis and the appearance of beige adipocytes (Blaszkiewicz et al., 2019; Harris, 2018). Overall, activation of this β-adrenergic pathway to modulate adipose tissue composition and functions yields increased glucose tolerance and resistance to high-fat-diet (HFD)-induced insulin resistance (Ceddia and Collins, 2020; Collins, 2012).
Based on these beneficial metabolic effects of adipose browning, it is of interest to note that stimuli other than cold exposure can also mediate such effects (Scheele and Wolfrum, 2020; Villarroya et al., 2019). These include intermittent fasting (Li et al., 2017), caloric restriction (Fabbiano et al., 2016), exercise (Aldiss et al., 2018), and response to burns (Patsouris et al., 2015). In addition, perturbations of metabolic pathways selectively within white adipocytes can trigger the appearance of beige adipocytes expressing uncoupling protein 1 (UCP1) in iWAT depots (Guilherme et al., 2017, 2018; Liu et al., 2016; Lodhi et al., 2012). One such trigger of iWAT browning is the adipocyte-selective ablation of the last enzyme in de novo lipogenesis, fatty acid synthase (FASN), and this occurs even when the ablation is induced in fully mature mice (Guilherme et al., 2017, 2018; Lodhi et al., 2012). Such selective ablation of adipocyte FASN in mice is accompanied by improved glucose tolerance and insulin sensitivity (Guilherme et al., 2017; Lodhi et al., 2012). However, deletion of FASN in cultured adipocytes in vitro failed to cause UCP1 upregulation in the presence or absence of β-adrenergic stimulation (Guilherme et al., 2017). Furthermore, data from this mouse model showed that signals emanating from FASN-deficient iWAT can affect distant BAT depots, presumably by transmission through the circulation or nervous system (Guilherme et al., 2018). Similar to what occurs in cold-induced iWAT browning, iAdFASNKO mice displayed increased expression of tyrosine hydroxylase (TH) in iWAT and BAT (Guilherme et al., 2017, 2018) and increased sympathetic nerve activity in these tissues (Guilherme et al., 2018). Taken together, these data suggest that, in response to disruption of de novo lipogenesis, adipocytes could be induced to release paracrine factors that might act locally to activate SNFs and initiate the appearance of beige adipocytes in iWAT.
The initial aim of the present study was to determine whether SNFs within iWAT drive the emergence of beige adipocytes in iWAT by FASN-deficient adipocytes in mice, similar to cold exposure (Chi et al., 2018; Jiang et al., 2017). In marked contrast to the expected outcome, two independent denervation procedures that blocked cold-induced iWAT browning failed to disrupt the appearance of beige adipocytes in iAdFASNKO mice. Instead, single-cell transcriptomic analysis of the stromal vascular fraction (SVF) of iWAT from iAdFASNKO mice revealed enhanced macrophage polarization toward the alternatively activated type known to be associated with tissue remodeling. The ablation of macrophages from the iWAT of iAdFASNKO mice fully prevented the emergence of beige adipocytes. These data reveal the presence of an alternate pathway for adipocyte browning in iWAT that is impervious to denervation of adipose tissue but rather inhibited upon depletion of adipose tissue macrophages.
RESULTS
Imaging UCP1 Upregulation in Whole iWAT Depots of iAdFASNKO Mice
Based on our previous data indicating that, similar to cold exposure, induced deletion of FASN in adipocytes (iAdFASNKO) of mature mice enhances both beiging and innervation in iWAT (Guilherme et al., 2017, 2018), we performed 3D imaging of entire iWAT depots (Figure 1; Videos S1, S2, S3, and S4) to visualize the distribution of SNFs and beige cells. Using the Adipo-Clear method for whole adipose clearing and 3D immunolabeling (Chi et al., 2018), iWAT samples from wild-type, iAdFASNKO (room temperature), and cold-exposed wild-type mice were immunolabeled for UCP1 and TH and analyzed by light sheet microscopy (Figure 1A; Videos S1, S2, S3, and S4). The 2D representations and the 3D images show massive numbers of UCP1+ cells in iWAT from the iAdFASNKO group as well as the cold-exposure group (Figure 1; Videos S1, S2, S3, and S4). Strikingly, the UCP1+ cells were mostly observed in the specific inguinal area of iWAT (Figure 1A), similar to previously published data for cold-exposed mice (Chi et al., 2018). Interestingly, when imaged with 24× magnification, individual UCP1-positive multilocular adipocytes could easily be seen with bumps apparently caused by the lipid droplets (Figure 1B). 3D projections (Videos S1 and S2) and optical sections with high-power magnification (Videos S3 and S4, 70 μm and 10 μm, respectively) of the iWAT depots also showed dense networks of SNFs detected by anti-TH in all groups. Although TH protein levels were increased in iWAT from iAdFASNKO mice when analyzed by western blot (Guilherme et al., 2017, 2018), it is not possible to confirm this by comparing the control group versus the iAdFASNKO group or versus the cold-exposure group using this method with limited samples.
Figure 1. 2D Representation of 3D Data Related to Whole iWAT Depots Reveals Robust UCP1 Upregulation in the iAdFASNKO Mouse.
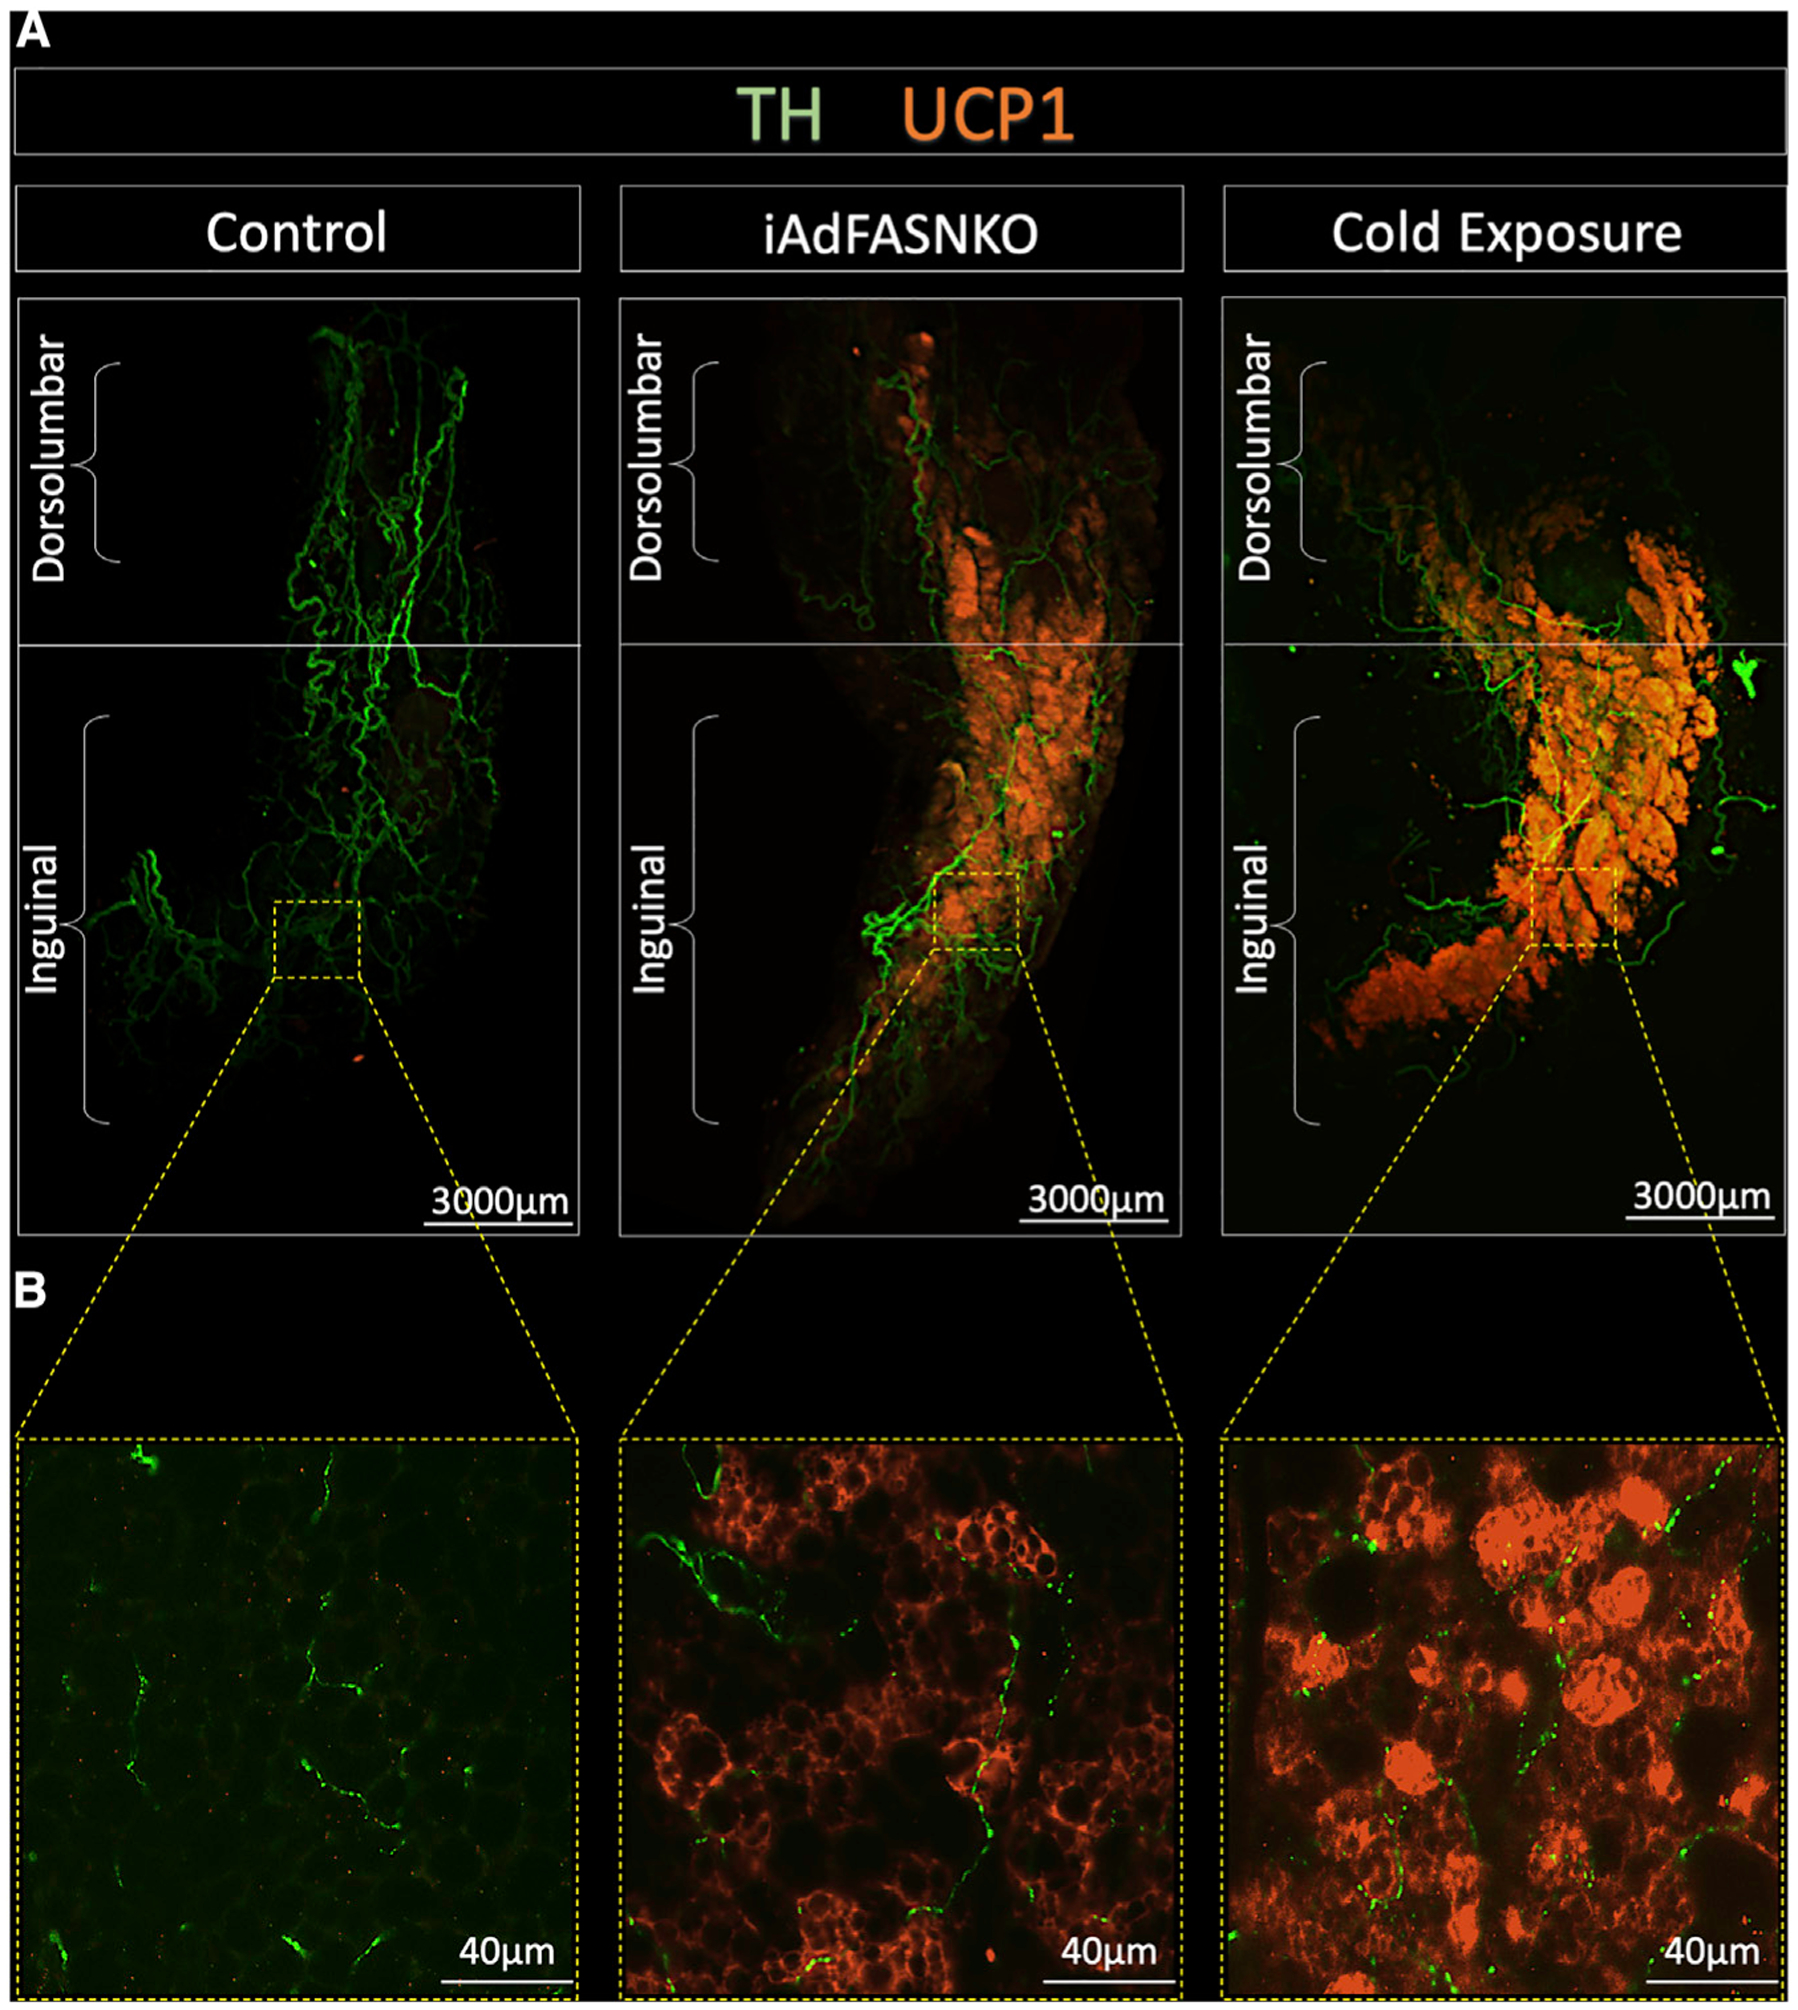
All panels are light-sheet fluorescence microscopy images of inguinal white adipose tissue (iWAT) processed using the Adipo-Clear technique.
(A and B) 2D representations of 3D reconstruction of adipose sympathetic nerves and thermogenic profile of iWAT from control, iAdFASNKO, and 6°C cold-exposed mice (A). The samples are immunolabeled with anti-TH (green) and anti-UCP1 (orange) and imaged at (A) 1.1× and (B) 24× magnification. Scale bars are provided for each panel.
iWAT Denervation Does Not Block iAdFASNKO-Induced Adipose Beiging
It is well known that cold-induced iWAT beiging in mice is absolutely dependent upon sympathetic innervation (Cao et al., 2019; Chi et al., 2018; Jiang et al., 2017). To determine whether SNFs are essential for the browning of iWAT, we performed two procedures that disrupt local sympathetic innervation in iWAT, including a chemical approach using local iWAT 6-hydroxydopamine (6-OHDA) injection (Cao et al., 2019; Harris, 2012; Vaughan et al., 2014) and local iWAT surgical denervation that it is known to destroy sympathetic and sensory nerves within the tissue (Harris, 2018; Shi et al., 2005; Vaughan et al., 2014) (Figure 2; Figures S1C–S1F). As positive controls, sham and chemically denervated wild-type mice were housed at 6°C for 6 days to induce iWAT beiging (Figure 2C). Visual inspection of the iWAT depots in these mice show cold- and iAdFASNKO-induced shrinkage of the tissue and a strong browning effect (Figure S1B). Strikingly and surprisingly, the iAdFASNKO-induced browning was not noticeably affected by iWAT denervation, while appearance of beige adipocytes in the cold-induced mice was blocked (Figure 2; Figure S1). The ability of chemical denervation to block cold-induced, but not iAdFASNKO-induced, UCP1 protein (Figures 2E, 2G, and 2H) and mRNA (Figure 2F) confirmed these observations. No difference was found in the iWAT mass associated with iAdFASNKO after denervation (Figure 2B). However, for the cold-exposure group, a decrease in the iWAT mass was observed (Figure 2C). Interestingly, the iWAT in the cold-exposed, denervated group had an attenuation in iWAT mass compared to the PBS group (Figure 2C), indicating that the iWAT denervation procedure was effective. Successful denervation in these experiments is, indeed, clearly shown by the decreased TH signal due to 6-OHDA treatment by western blot analysis (Figures 2G and 2H). Interestingly, the adipocytes in the cold-exposed mice display a smaller diameter when compared to the room-temperature group (Figure 2E). These results indicate that intact sympathetic innervation is essential for the cold-induced but not iAdFASNKO-induced appearance of UCP1-expressing beige adipocytes in iWAT.
Figure 2. Denervation Fails to Block iWAT “Browning” in iAdFASNKO Mice as It Does in Cold-Exposed Mice.
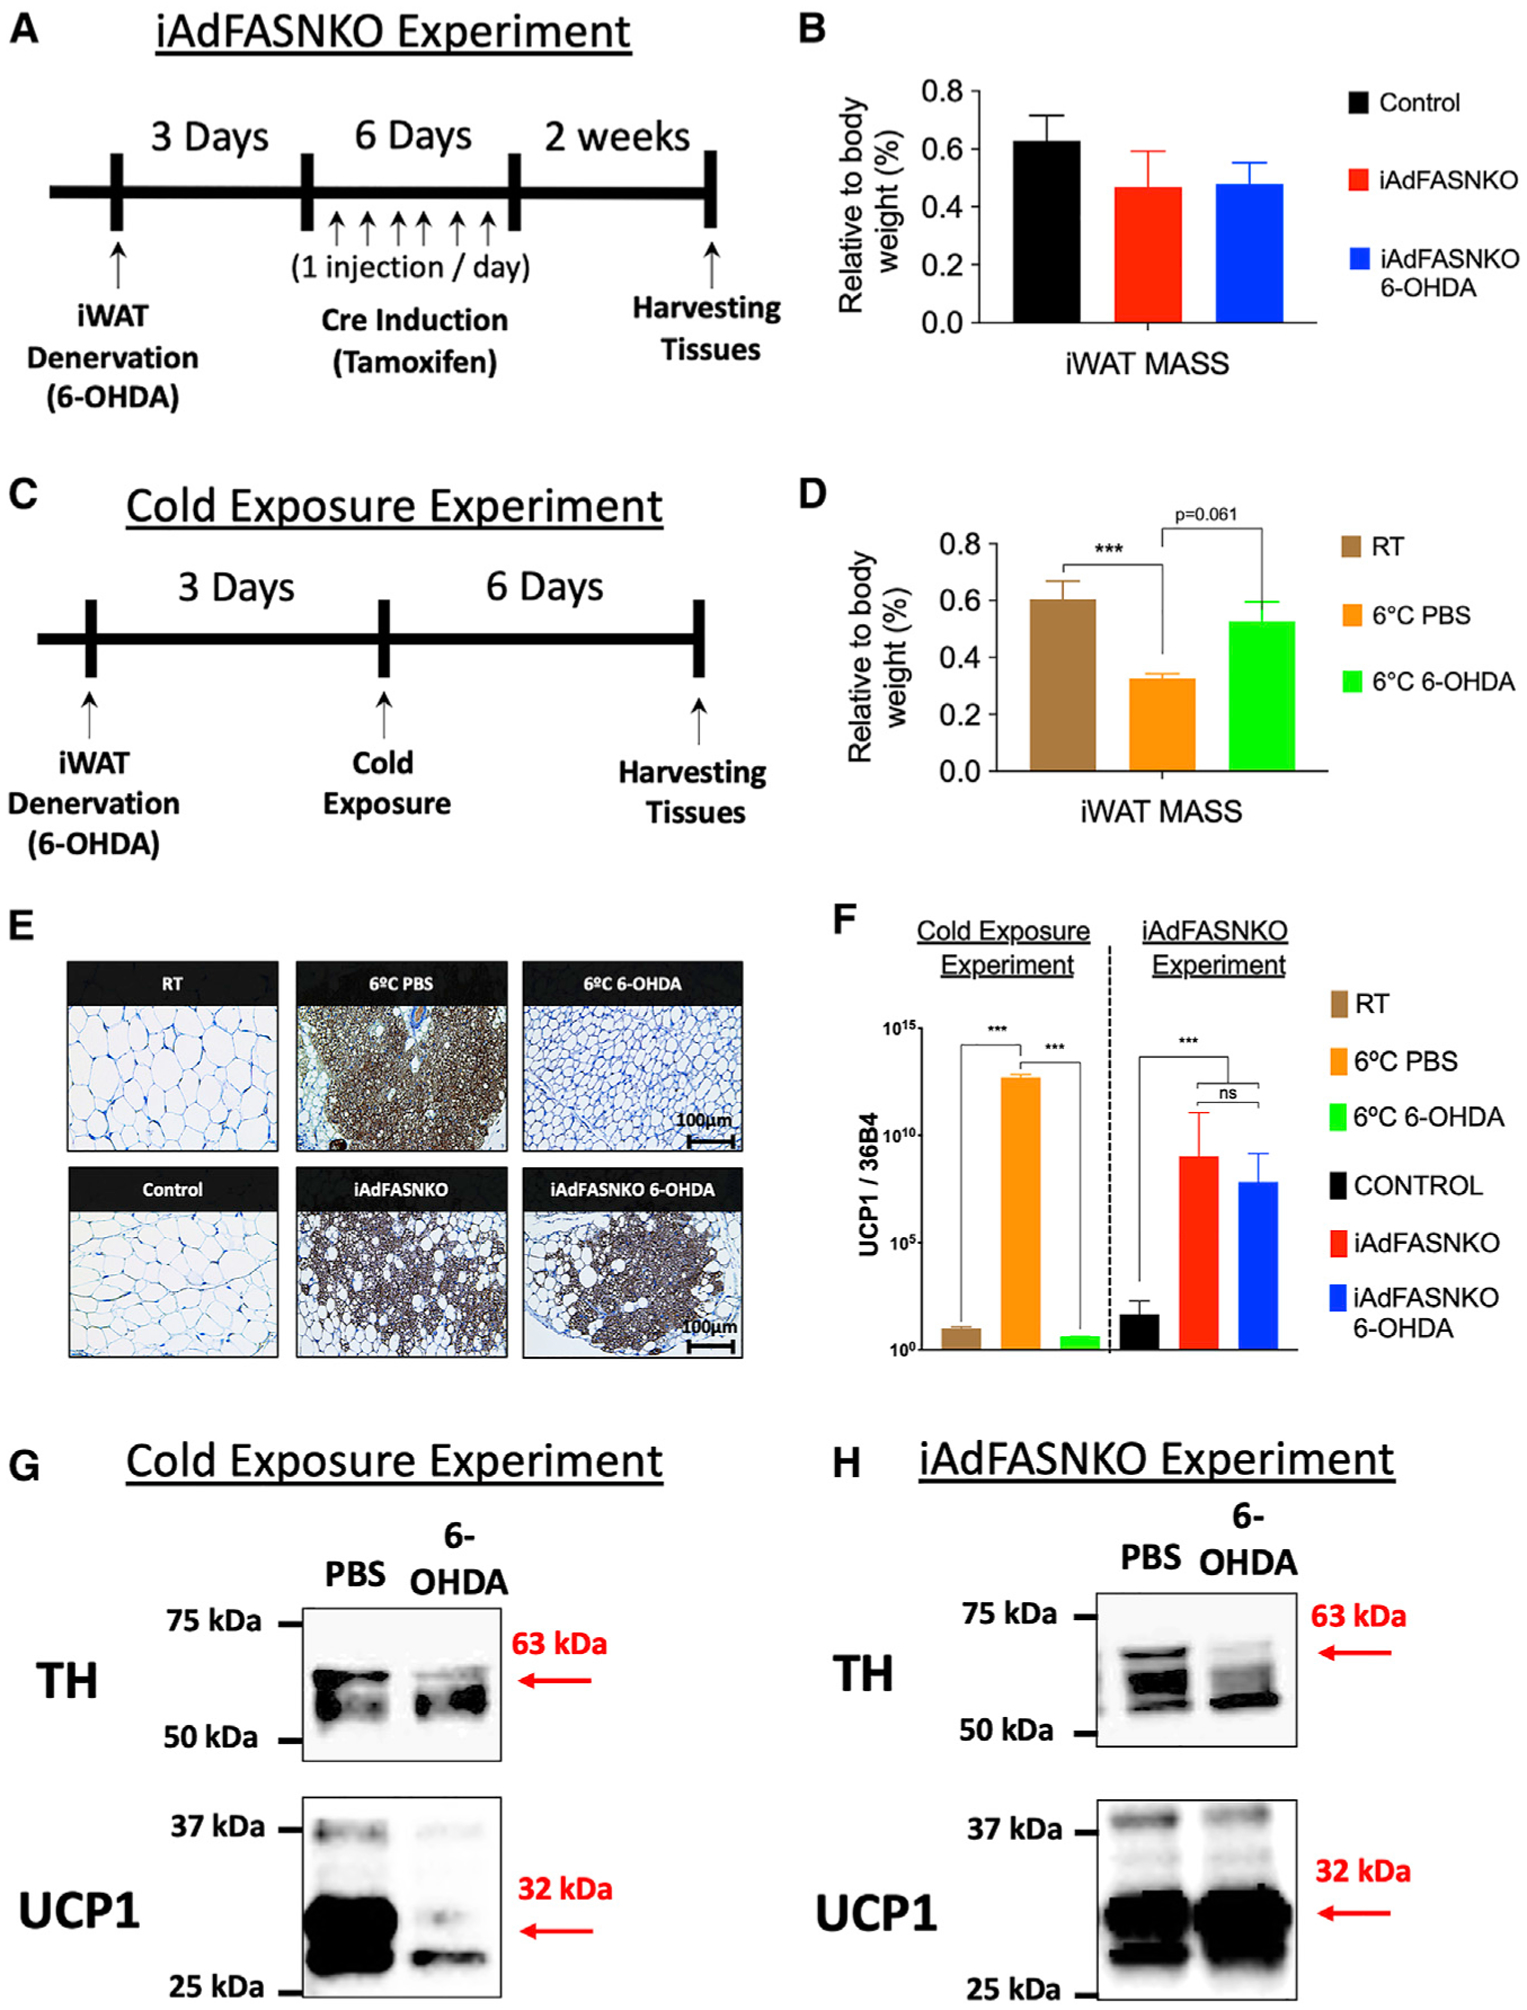
(A–D) Diagrams represent the chemical denervation experiment in (A) iAdFASNKO mice and (C) cold-exposed wild-type mice. The iWAT mass as percentage of body weight was measured in (B) iAdFASNKO mice and in (D) the cold-exposure group. n = 4 per group. The results are presented as means ± SEM. Two-tailed Student’s t test determined statistical significance; ***p < 0.001, versus the room-temperature (RT) group.
(E) IHC for detection of UCP1 in iWAT from cold-exposed and iAdFASNKO mice with and without chemical denervation. Scale bars are provided in the panels.
(F) qRT-PCR was performed for Ucp1 mRNA quantification in iWAT from the same groups as in (E). n = 3–4 per group. These results are representative of five independent experiments. The results are presented as means ± SEM. Two-way ANOVA determined statistical significance; ***p < 0.001, versus the room-temperature (RT) group. (G and H) Depicted are representative western blot analyses for the detection of TH and UCP1 protein levels in both the (G) cold-exposure and (H) iAdFASNKO experimental conditions.
Another key finding in this series of experiments was that, although chemical denervation blocked TH upregulation, it did not blunt activation of the PKA pathway in response to iAdFASNKO (Figure S1A). Anti-phospho-hormone-sensitive lipase (HSL) and anti-phospho-perilipin staining remained elevated in iWAT from iAdFASNKO mice that were chemically denervated (Figure S1A). Therefore, 6-OHDA-treated iWAT not only did not interfere with UCP1 upregulation in the iAdFASNKO mice but also failed to decrease the activation of the cAMP/PKA pathway known to induce UCP1 expression (Dickson et al., 2016; Garretson et al., 2016).
To confirm the unexpected results obtained with chemically denervated iWAT in iAdFASNKO mice, we used a surgical denervation approach known to be effective at local tissues, including iWAT (Foster and Bartness, 2006; Garretson et al., 2016; Vaughan et al., 2014). As expected, surgically denervated iWAT failed to elicit cold-induced beige adipocytes in the context of a substantial reduction in TH protein levels (Figure S1C). Similarly, no UCP1 upregulation by cold exposure after surgical denervation of iWAT was found (Figures S1C and S1E), confirming that innervation is required for the cold-induced browning in iWAT. In contrast, and consistent with the results of chemical denervation, no decrease was observed in the abundance of beige cells or UCP1 expression after surgical denervation in the iWAT from iAdFASNKO compared with sham iWAT (Figures S1D and S1F). Altogether, these data indicate that signals emanating from cell types other than SNFs are directing the beiging of iWAT in iAdFASNKO mice.
Nrg4 Deficiency Attenuates Cold-Induced but Not iAdFASNKO-Induced Beiging
Previous work has shown uniquely high levels of Neuregulin 4 (Nrg4) secreted from brown and beige adipocytes compared to other cell types (Blüher, 2019; Comas et al., 2019; Pfeifer, 2015; Wang et al., 2014), and it has been suggested that Nrg4 may enhance sympathetic nerve-induced beiging (Blüher, 2019; Pellegrinelli et al., 2018; Rosell et al., 2014). Based on this concept, coupled with the aforementioned data suggesting divergent pathways for promoting iWAT thermogenesis, we hypothesized that Nrg4 may be required for optimal iWAT beiging in response to cold exposure but not in iAdFASNKO mice. Indeed, when control versus Nrg4 whole-body knockout (NRG4KO) mice were exposed to 6°C temperature for 6 days, the beiging of iWAT was extensive in control mice but attenuated in NRG4KO mice (Figures 3A–3D). Thus, UCP1 mRNA expression (Figure 3A) and protein expression (Figures 3B–3D) in iWAT were both decreased by about 50% in mice with Nrg4 deficiency. This was readily visualized in immunohistochemistry (IHC) images of iWAT stained for UCP1 (Figure 3B). In contrast, the double knockout (double KO) mouse model, deficient in both Nrg4 and adipose tissue FASN, displayed the same amount of iWAT beiging as iAdFASNKO mice (Figures 3E–3G). Both UCP1 mRNA and protein levels were highly and equally upregulated in the iAdFASNKO and the double KO mice (Figures 3E–3G). Thus, adipocyte deficiency of FASN causes optimal iWAT beiging independent of both iWAT SNFs and Nrg4, while optimal beiging of iWAT during cold exposure requires both sympathetic nerve activity and Nrg4.
Figure 3. NRG4 Deficiency in Wild-Type Mice Attenuates Cold-Induced iWAT Browning, but Does Not Reduce iWAT Browning in iAdFASNKO Mice.
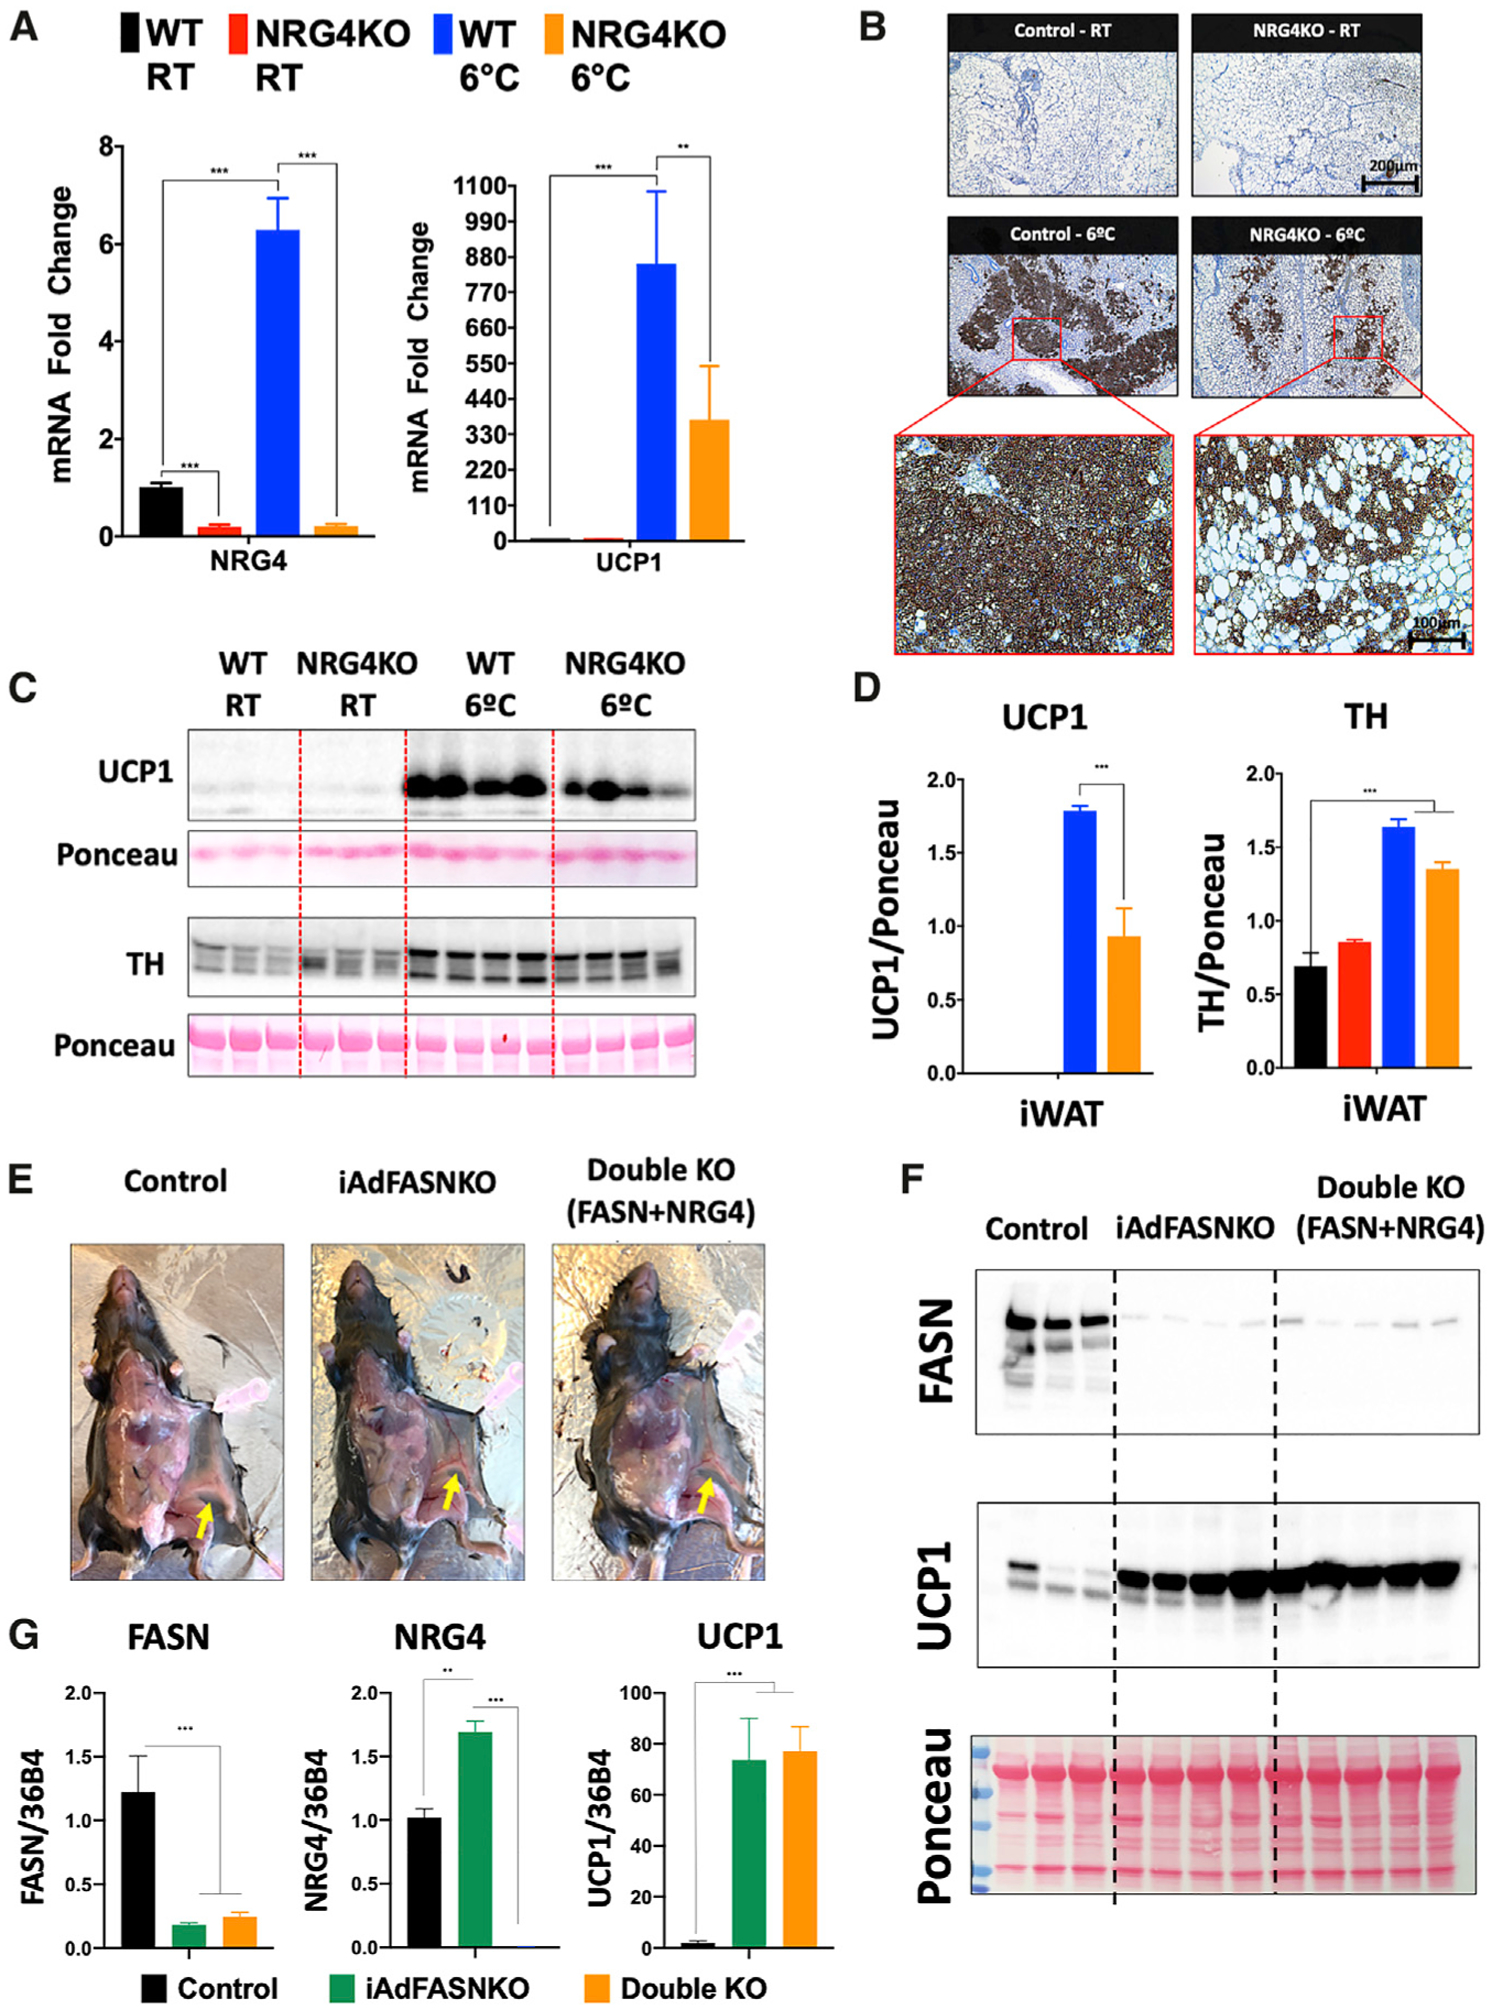
(A) qRT-PCR was performed for Nrg4 and Ucp1 mRNA quantification in iWAT from control and NRG4KO mice housed at either 22°C or 6°C. n = 3–4 per group. The data are presented as the means ± SEM. Two-tailed Student’s t test determined statistical significance: **p < 0.05; ***p < 0.001.
(B) Depicted are immunohistochemical analyses for detection of UCP1 protein in iWAT in the different groups.
(C and D) In (C): western blots of iWAT lysates from control and NRG4KO mice housed either at 22°C or 6°C. Shown are UCP1, TH, and Ponceau staining (as a loading control) and (D) their respective protein quantifications. n = 3–4 per group. The data are presented as the means ± SEM. Two-tailed Student’s t test determined statistical significance: ***p < 0.001.
(E) Representative images emphasizing the morphology of the iWAT (yellow arrows) of control, iAdFASNKO, and double KO (FASN+NRG4) mice.
(F) Western blotting for the detection of FASN and UCP1 protein levels in iWAT for the indicated mouse line.
(G) qRT-PCR was performed for Fasn, Nrg4, and Ucp1 mRNA in iWAT from control, iAdFASNKO, and double KO (FASN+NRG4) mice. n = 5–8 per group. The results are presented as the means ± SEM. Two-tailed Student’s t test determined statistical significance: **p < 0.05; and ***p < 0.001, versus the control group.
Single-Cell RNA-Seq Reveals Increased iWAT Alternatively Activated Macrophage Content in iAdFASNKO Mice
Since sympathetic innervation is not required for adipose beiging in iAdFASNKO mice (Figure 2), and cell-autonomous effects also appear not to play a major role (Guilherme et al., 2017), we hypothesized that other adipose resident cell types may be targets of FASN-deficient adipocyte signals. Therefore, we applied single-cell RNA sequencing (RNA-seq), a powerful technique to identify cell types and their mRNA expression profiles within complex tissues, including adipose tissues from cold-exposed mice (Burl et al., 2018; Merrick et al., 2019; Rajbhandari et al., 2019; Rondini and Granneman, 2020), to this question. The SVFs of iWAT from control and iAdFASNKO mice were isolated and subjected to single-cell RNA-seq analysis (for more details related to the protocol, see Figure S2A). To better resolve the relatively low numbers of immune cells present in the SVF, the cells were isolated and fractionated into lineage-marker-positive (Lin+) cells, mostly immune cells, and all other stromal cells (Lin−) using magnetic bead cell sorting (MACS) as reported by the Granneman laboratory (Burl et al., 2018). Thus, 4 different libraries were prepared from an estimated approximately 6,000 cells per condition (control and iAdFASNKO, Lin+ and Lin−) and were subjected to sequencing using the Illumina NovaSeq 6000 to obtain 2.5 billion reads per run, yielding ~625 million reads per sample. This number of reads per sample (~100,000 reads per cell) was important to gain greater depth of coverage for detecting rare cell populations. The sequencing was performed on one library per condition, while each library represents a pool of iWAT from 7–8 mice.
In analyzing the sequencing results from the aforementioned experiment, we first aggregated (Lin+ and Lin− libraries from control and iAdFASNKO) and normalized the data and subjected it to graph-based clustering to identify cell types/states, which were projected onto the uniform manifold approximation and projection (UMAP) plot using the Loupe Cell Browser (Figure 4A). Single-cell RNA-seq data from the aggregated libraries enabled us to distinguish eight distinct clusters (Figures 4A and 4B). Using differential gene expression between clusters, we analyzed the top 20 upregulated genes that we can identify and named each different cell cluster. The violin plots in Figure S3 show the representative top upregulated genes from the different clusters, further revealing that each cluster also uniquely expresses specific marker genes. The total percentage of the eight clusters from the aggregated dataset that were identified and the representative top upregulated genes are: collagen-rich progenitors, 51.80% (Col4a2); Pi16+ progenitors, 19.24% (Pi16); endothelial cells, 4.56% (Vwf); Schwann cells, 3.03% (Mpz); smooth muscle cells, 2.97% (Acta2); macrophage-like, 5.13% (Lyz2); T cells, 6.97% (Ccl5); and B cells, 6.29% (Cd79a), as illustrated in Figure 4B. Segregation of the aggregated UMAP plot revealing differences among the number of cells in the different clusters demonstrated that the adipose tissue environment present in SVFs from iAdFASNKO mice appears to have a somewhat different composition compared to the control group (Figure S2B).
Figure 4. Single-Cell RNA-Seq Reveals Heterogeneity of Non-adipocyte Cell Types within iWAT from Wild-Type and iAdFASNKO Mice.
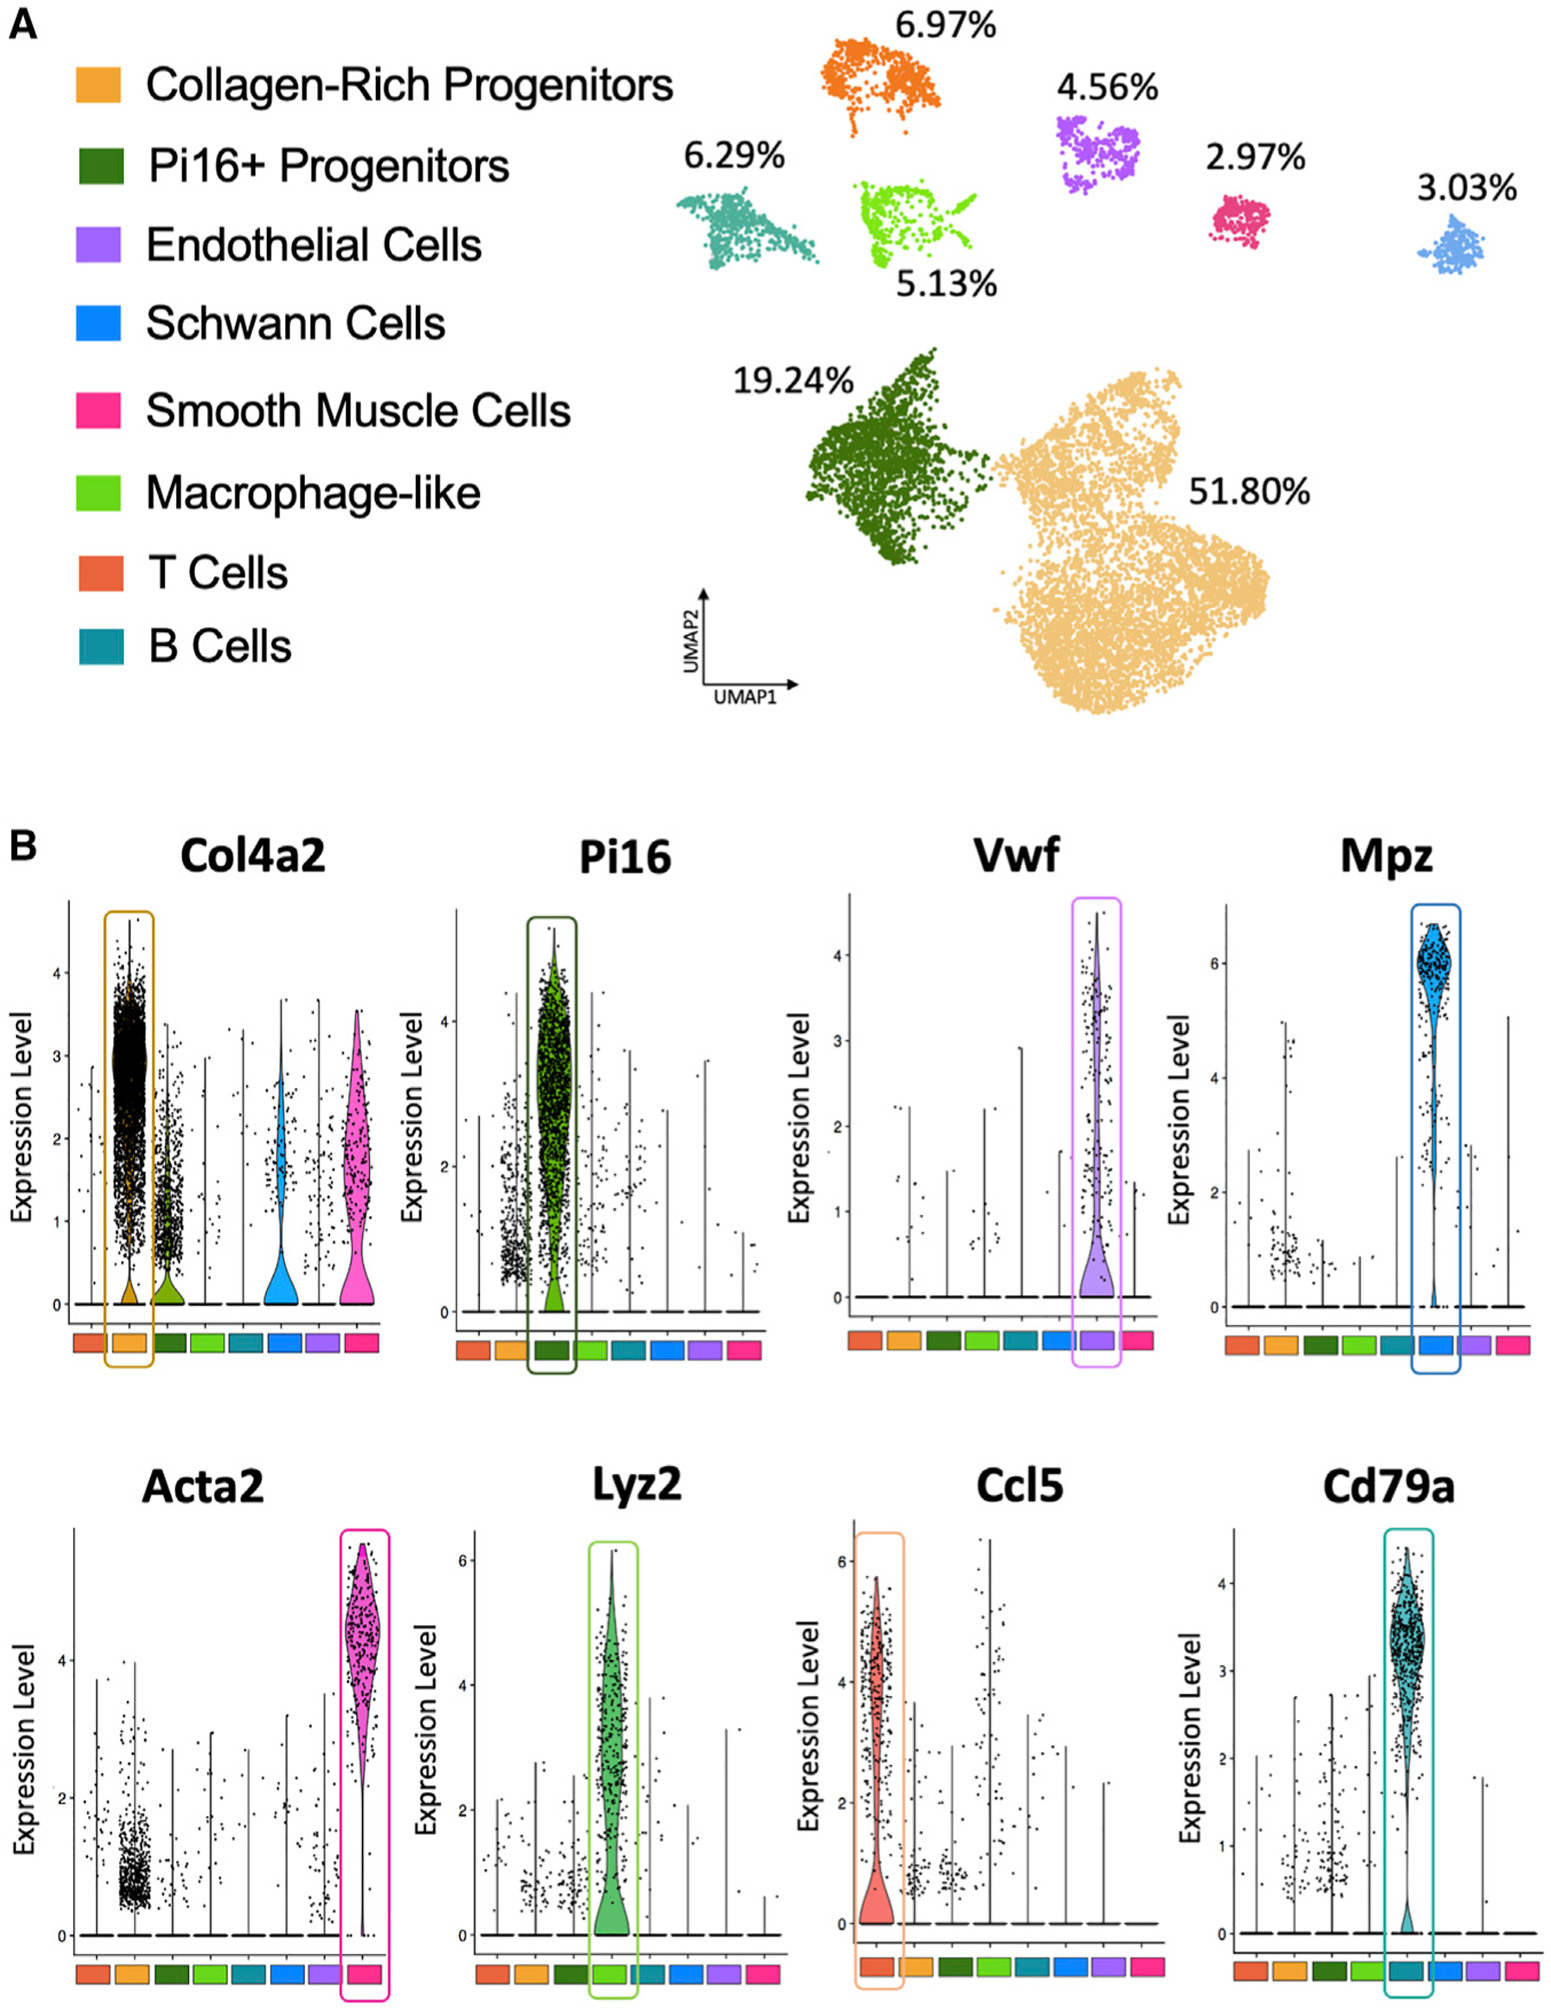
(A) Aggregated UMAP plot (control lineage positive, control lineage negative, iAdFASNKO lineage positive, and iAdFASNKO lineage negative) of 18,336 stromal vascular cells (~5,000 cells per condition) from iWAT showing eight different clusters (see color key). Clusters were generated in the 10× Cell Ranger software via K-means clustering based on the principal-component analysis (PCA) of the transcriptomic signature. Cluster names were manually determined based on the top 20 upregulated genes related to differential gene expression between clusters and knowledge of canonical cell markers.
(B) Violin plots of loge (counts per cell normalized to 10,000) for the top gene from each cluster in the aggregated dataset. Each point represents the log-expression value in a single cell. These representative genes were used to identify and name the following clusters: collagen-rich progenitors (Col4a2), Pi16+ progenitors (Pi16), endothelial cells (Vwf), Schwann cells (Mpz), smooth muscle cells (Acta2), macrophage-like (Lyz2), T cells (Ccl5), and B cells (Cd79a).
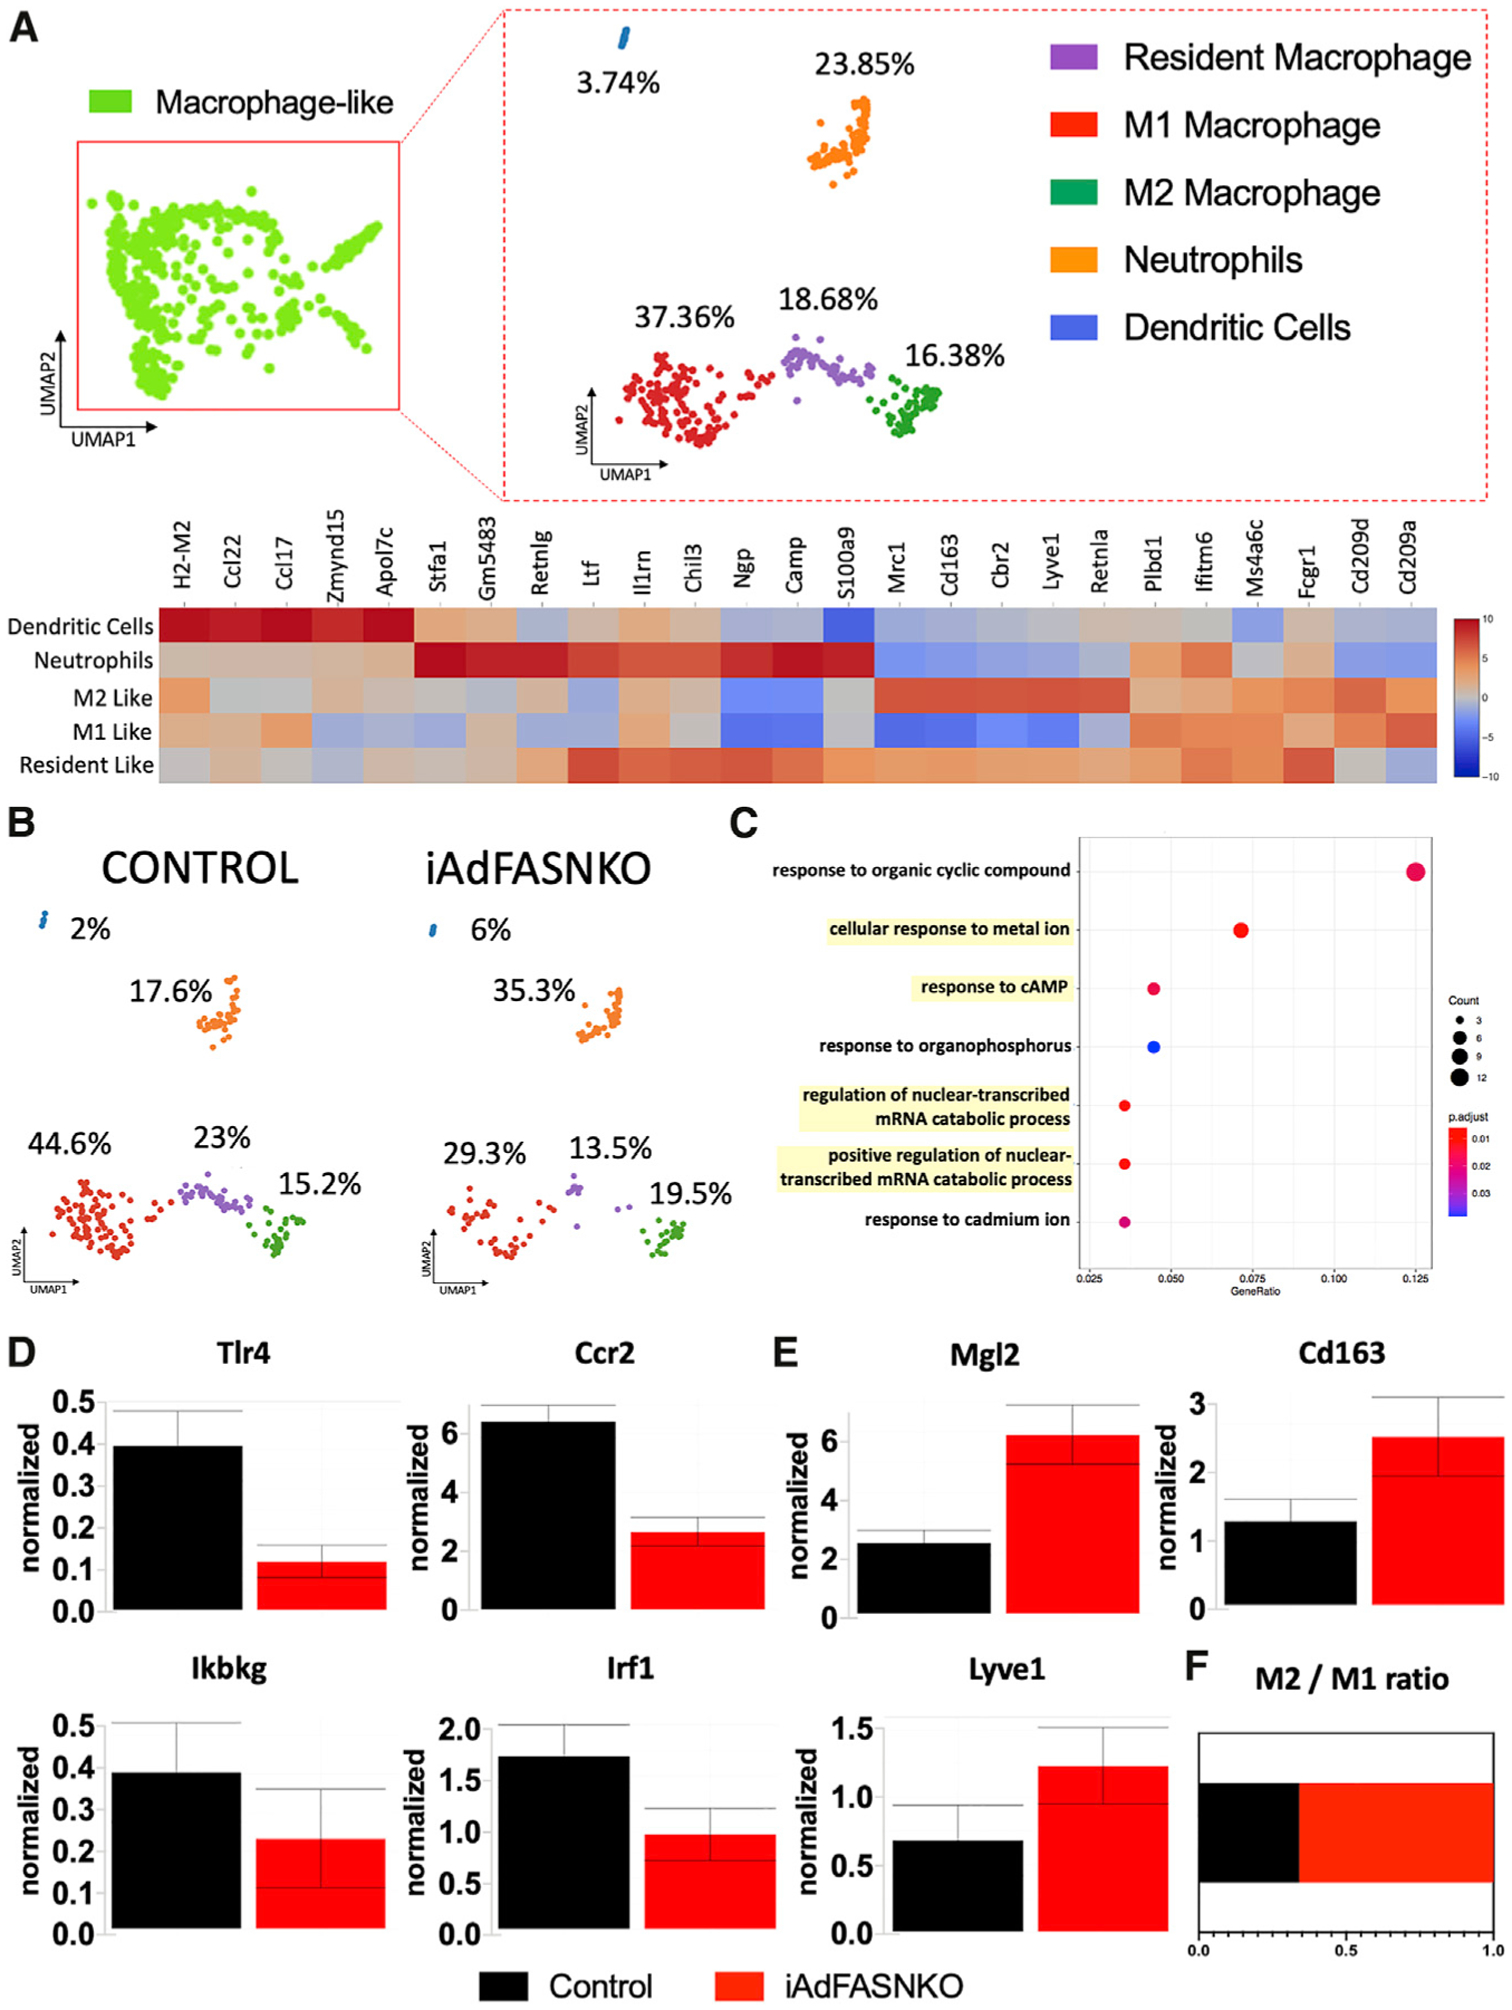
]Based on numerous publications (Camell et al., 2017; Cereijo et al., 2018; Hui et al., 2015; Jun et al., 2018; Pirzgalska et al., 2017; Villarroya et al., 2018) that have brought attention to the concept that macrophages may play a major role in adipose tissue remodeling and thermogenesis, we subjected the macrophage-like cluster to a sub-clustering process, using only Lin+ libraries from control and iAdFASNKO mice to maximize the detection of rare population types (Figure 5A). Interestingly, this sub-clustering revealed five new sub-clusters related to the original cluster (macrophage-like) that were not displayed before using the aggregate UMAP plot. Applying the same approach described earlier to identify and name these new sub-clusters, we uncovered the following clusters: resident macrophage, M1 macrophage, M2 macrophage, neutrophil cells, and dendritic cells (Figures S4 and S5). Heatmaps of graph-based, log2 fold change shows the top 5 upregulated differentially expressed genes among sub-clusters (Figure 5A). Segregation of the sub-cluster UMAP plot shows marked changes in the number of cells in the different clusters when comparing control versus iAdFASNKO mice (Figure 5B).
Figure 5. iWAT from iAdFASNKO Reveals a Shift in the M1-to-M2 Macrophage Polarization in the Macrophage-like Cluster.
The sub-clustering dashboard of macrophage-like cells from the aggregated clusters.
(A) Lineage-positive cells in the macrophage-like cluster from Figure 4 were clustered into five new sub-clusters via visual inspection within the Loupe Viewer. The heatmap shows the top 5 differentially expressed genes between sub-clusters obtained from graph-based log2 fold changes generated from the Loupe Browser. Colors (values) indicate Z scores of the average log fold change between sub-clusters for each gene (Z score is based on fold change across the 5 sub-clusters). Cluster names were manually determined based on the top 25 upregulated genes related to differential gene expression between clusters and knowledge of canonical cell markers.
(B) UMAP plot from (A) split into the different conditions: control lineage positive versus iAdFASNKO lineage positive.
(C) Gene ontology (GO) related to biological processes, with adjusted p value of < 0.05, among upregulated differentially expressed marker genes in iAdFASNKO in the M2 macrophage cluster.
(D and E) Loge of normalized expression values for (D) M1 macrophage (Tlr4, Ccr2, Ikbkg, and Irf1) and (E) M2 macrophage (Mgl2, Cd163, and Lyve1) polarization markers. Graphs indicate the means ± SEM.
(F) The ratio of M2/M1 adipose tissue macrophage in the stromal vascular cells from iWAT from control versus iAdFASNKO.
To examine the possible function of each unique subpopulation, we investigated the gene ontology (GO) of the upregulated differentially expressed marker genes in iAdFASNKO related to the M2 macrophage cluster (Figure 5C). This analysis shows that the M2 macrophage population in the iAdFASNKO iWAT SVF has an enrichment in genes related to pathways that could be linked to the regulation of nuclear-transcribed mRNA catabolic processes and responses to cAMP (Figure 5C). Furthermore, iAdFASNKO elicits an intense adipose tissue macrophage polarization toward the M2 state, demonstrated by downregulation in general markers of inflammation (Tlr4, Ccr2, Ikbkg, and Irf1; Figure 5D) and a robust upregulation in M2 macrophage markers (Mgl2, Cd163 and Lyve1; Figure 5E). This leads to a higher ratio of M2/M1 macrophages in the SVF from iAdFASNKO (Figure 5F), implying that M2 macrophage polarization may be involved in the molecular mechanism of how iAdFASNKO enhances thermogenesis in iWAT. This concept is reinforced by studies suggesting that alternatively activated macrophages (M2 macrophage polarization) are involved in the iWAT beiging process and play an essential role in maintaining systemic metabolism (Fabbiano et al., 2016; Guilherme et al., 2019; Liu et al., 2015; Shan et al., 2017; Suárez-Zamorano et al., 2015; Villarroya et al., 2018). All the significant (p < 0.05) upregulated and downregulated genes in iAdFASNKO versus control related to the macrophage-like sub-clustering are present in Table S2 and Table S3, respectively.
Adipose iAdFASNKO Enhances Macrophage Polarization toward the Alternatively Activated Phenotype Often Denoted as M2 in iWAT
In further characterizing the macrophages in iWAT, we performed histological analyses that showed a positive signal for F4/80 immunostaining among the iWAT multilocular adipocytes in the iAdFASNKO and iAdFASNKO+ denervation groups (Figure S6A). Similarly, we found F4/80-positive cells among the beige adipocyte areas in the iWAT after 6 days of cold exposure (Figure S7D) in wild-type mice, comparable to what has been reported by other groups (Hui et al., 2015; Vargovic et al., 2016). The specificity of the F4/80 antibody was confirmed by the detection of adipose tissue macrophage infiltration in the iWAT from ob/ob mice (Figure S7E).
To validate the data generated by our single-cell RNA-seq analyses, flow cytometry methods were performed on the SVF from iWAT to evaluate the adipose tissue macrophage polarization state in iAdFASNKO mice. In these analyses, CD45+/F4/80+/CD11b+/CD206− cells were marked as M1-positive cells, and CD45+/F4/80+/CD11b+/CD206+ cells were marked as M2-positive cells (Figures S6B and S6C). These fluorescence-activated cell sorting (FACS) studies provided data corroborating that obtained from single-cell RNA-seq, as the SVF from iAdFASNKO iWAT exhibited a reduction in M1 macrophage content and an enhancement in the M2 macrophage population (Figures S6B and S6C). The resulting increased ratio of M2/M1 macrophages in the iWAT from iAdFASNKO (Figure S6D) was statistically significant and similar to what was observed from the single-cell RNA-seq data.
In contrast to the large difference in the M2/M1 iWAT macrophage ratio between control and iAdFASNKO mice, there was no difference in the total number of macrophage cells detected between these different groups of mice (Figures S6C and S6E). Similarly, no differences were observed in apparent cell proliferation rates in the SVF between control and iAdFASNKO mice, as detected by labeling the SVF cells with 5-ethynyl-2′-deoxyuridine (EdU) in vivo. Thus, flow cytometry analyses of EdU incorporation failed to show any difference in proliferation ratio in any of the cell types analyzed (immune cells, EdU+/CD45+; progenitor cells, EdU+/PDGFRα; and endothelial cells, EdU+/CD31+) between iAdFASNKO mice and the control group (Figures S7A–S7C). Taken together, our analyses indicate a strong association between remodeling in the iWAT and M2 macrophage polarization in iAdFASNKO mice.
iWAT Macrophage Depletion Impairs iAdFASNKO-Induced Browning
To test the hypothesis that iWAT M2 macrophage enhancement in iAdFASNKO mice plays a physiological role in the induction and maintenance of iWAT thermogenesis, we administered clodronate-containing liposomes to deplete adipose tissue macrophages in the iWAT of iAdFASNKO mice (Figure 6A). Clodronate liposomes were previously shown to selectively target and deplete phagocytic cells of the mononuclear phagocyte system (effectively monocytes/macrophages) (Marro et al., 2019; van Rooijen and Hendrikx, 2010; Van Rooijen and Sanders, 1994; Zeisberger et al., 2006). Although this approach is not suitable for a specific subtype of macrophage depletion, the method has been used successfully before by other groups to deplete macrophages in general (Amano et al., 2014; Bu et al., 2013; Feng et al., 2011). As expected, endogenous Fasn mRNA was efficiently decreased in iWAT of iAdFASNKO and iAdFASNKO + clodronate mice (Figure 6B). Gene expression analysis for macrophage markers was performed to validate the macrophage depletion in the iWAT. Clodronate liposomes effectively blunted the expression of F4/80, Cd206, Cd11c, and Cd68 only in the iAdFASNKO + clodronate group, confirming that iWAT macrophage depletion was successful (Figure 6C). Importantly, iWAT macrophage depletion completely blocked the upregulation of UCP1 mRNA (Figure 6D) and protein levels (Figure 6E) in the iAdFASNKO group. Furthermore, multilocular adipocytes were not detected in iWAT of the iAdFASNKO + clodronate mice. Taken together, these findings are consistent with the concept that M2 macrophage polarization may be required to promote browning of iWAT in the iAdFASNKO mouse model.
Figure 6. Depletion of Macrophages Blocks iAdFASNKO-Induced iWAT Browning.
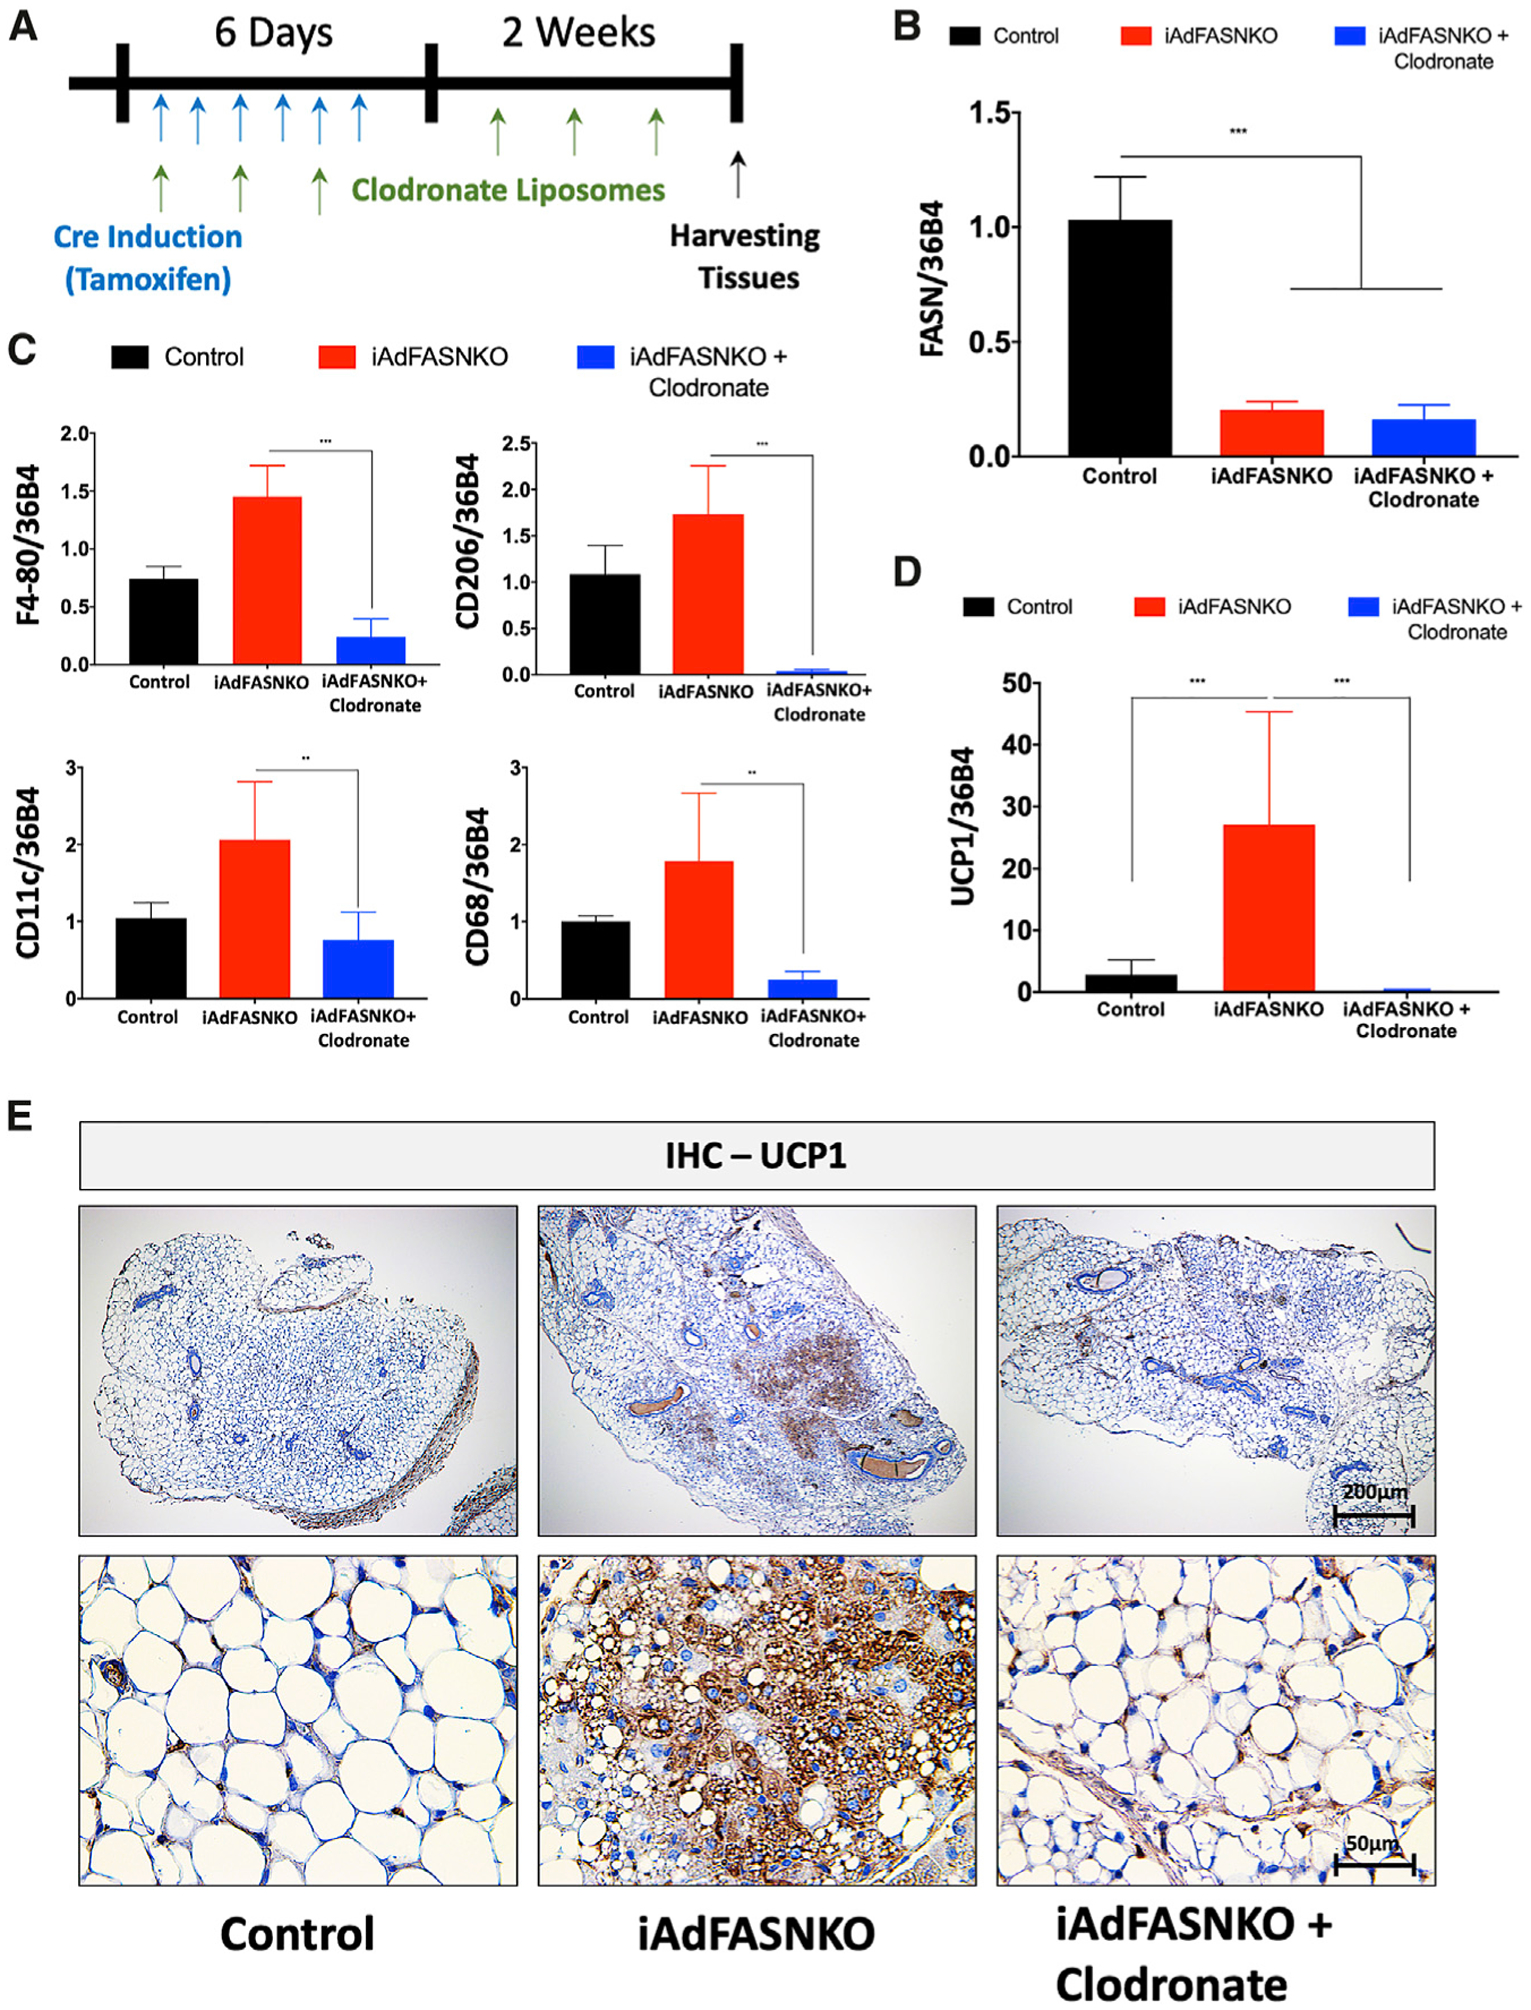
(A) Schematic representation of the experimental design for phagocytic immune cell depletion in the iAdFASNKO model using clodronate-containing liposomes. Every other day, mice received intraperitoneal injections of liposomes containing PBS or clodronate during a 2-week period.
(B–D) Shown are the qRT-PCR analyses to quantify mRNA expression levels of (B) Fasn, (C) F4/80, Cd206, Cd11c, Cd68, and (D) Ucp1 in iWAT from control, iAdFASNKO, and iAdFASNKO + clodronate groups. n = 6 mice per group. The data are presented as the means ± SEM. Two-tailed Student’s t test determined statistical significance: **p < 0.01; ***p < 0.001.
(E) IHC was used for the detection of UCP1 protein levels in iWAT from control, iAdFASNKO, and iAdFASNKO + clodronate groups. UCP1 staining reveals suppression of browning in iAdFASNKO after macrophage depletion. Representative images are shown. Scale bars are provided in the panels.
Adipocyte cAMP Signaling Is Required for iAdFASNKO-Induced Browning in iWAT
The cAMP/PKA signaling pathway is necessary for cold-induced browning of iWAT (Li et al., 2016; Reverte-Salisa et al., 2019), but the independence of adipose browning in iAdFASNKO mice from SNF innervation raised the question of whether the cAMP pathway is involved. Stimulatory G protein (Gsα) activation is required for receptor-activated increases in the production of cAMP by adenylyl cyclase, leading to activation of PKA, the phosphorylation of proteins, and functional responses (Ceddia and Collins, 2020; Collins, 2012). In order to determine whether cAMP signaling is required for iAdFASNKO-induced browning, we generated a new animal model by crossing mice with genetic deletion of Gsα selectively in adipocytes (Adipo-GsαKO) (Li et al., 2016) with iAdFASNKO mice (Figure 7A). Confirming the double KO, FASN and Gsα protein levels were shown to be reduced in the iWAT of these double KO mice (Figure 7B). Loss of cAMP production by adipocyte inactivation of Gsα completely blocked the stimulatory effect of iAdFASNKO on Ucp1 and Cidea mRNA expression levels in IWAT (Figure 7C). In agreement with the Ucp1 mRNA levels in Figure 7C, the formation of UCP1-positive multilocular adipocytes was abolished in iWAT from double KO FASN+Gsα, as illustrated in Figure 7D. Thus, these results strongly indicate that cAMP signaling in adipocytes is necessary for iAdFASNKO-induced browning in iWAT.
Figure 7. Adipocyte cAMP Signaling Is Required for iAdFASNKO-Induced Browning in iWAT.
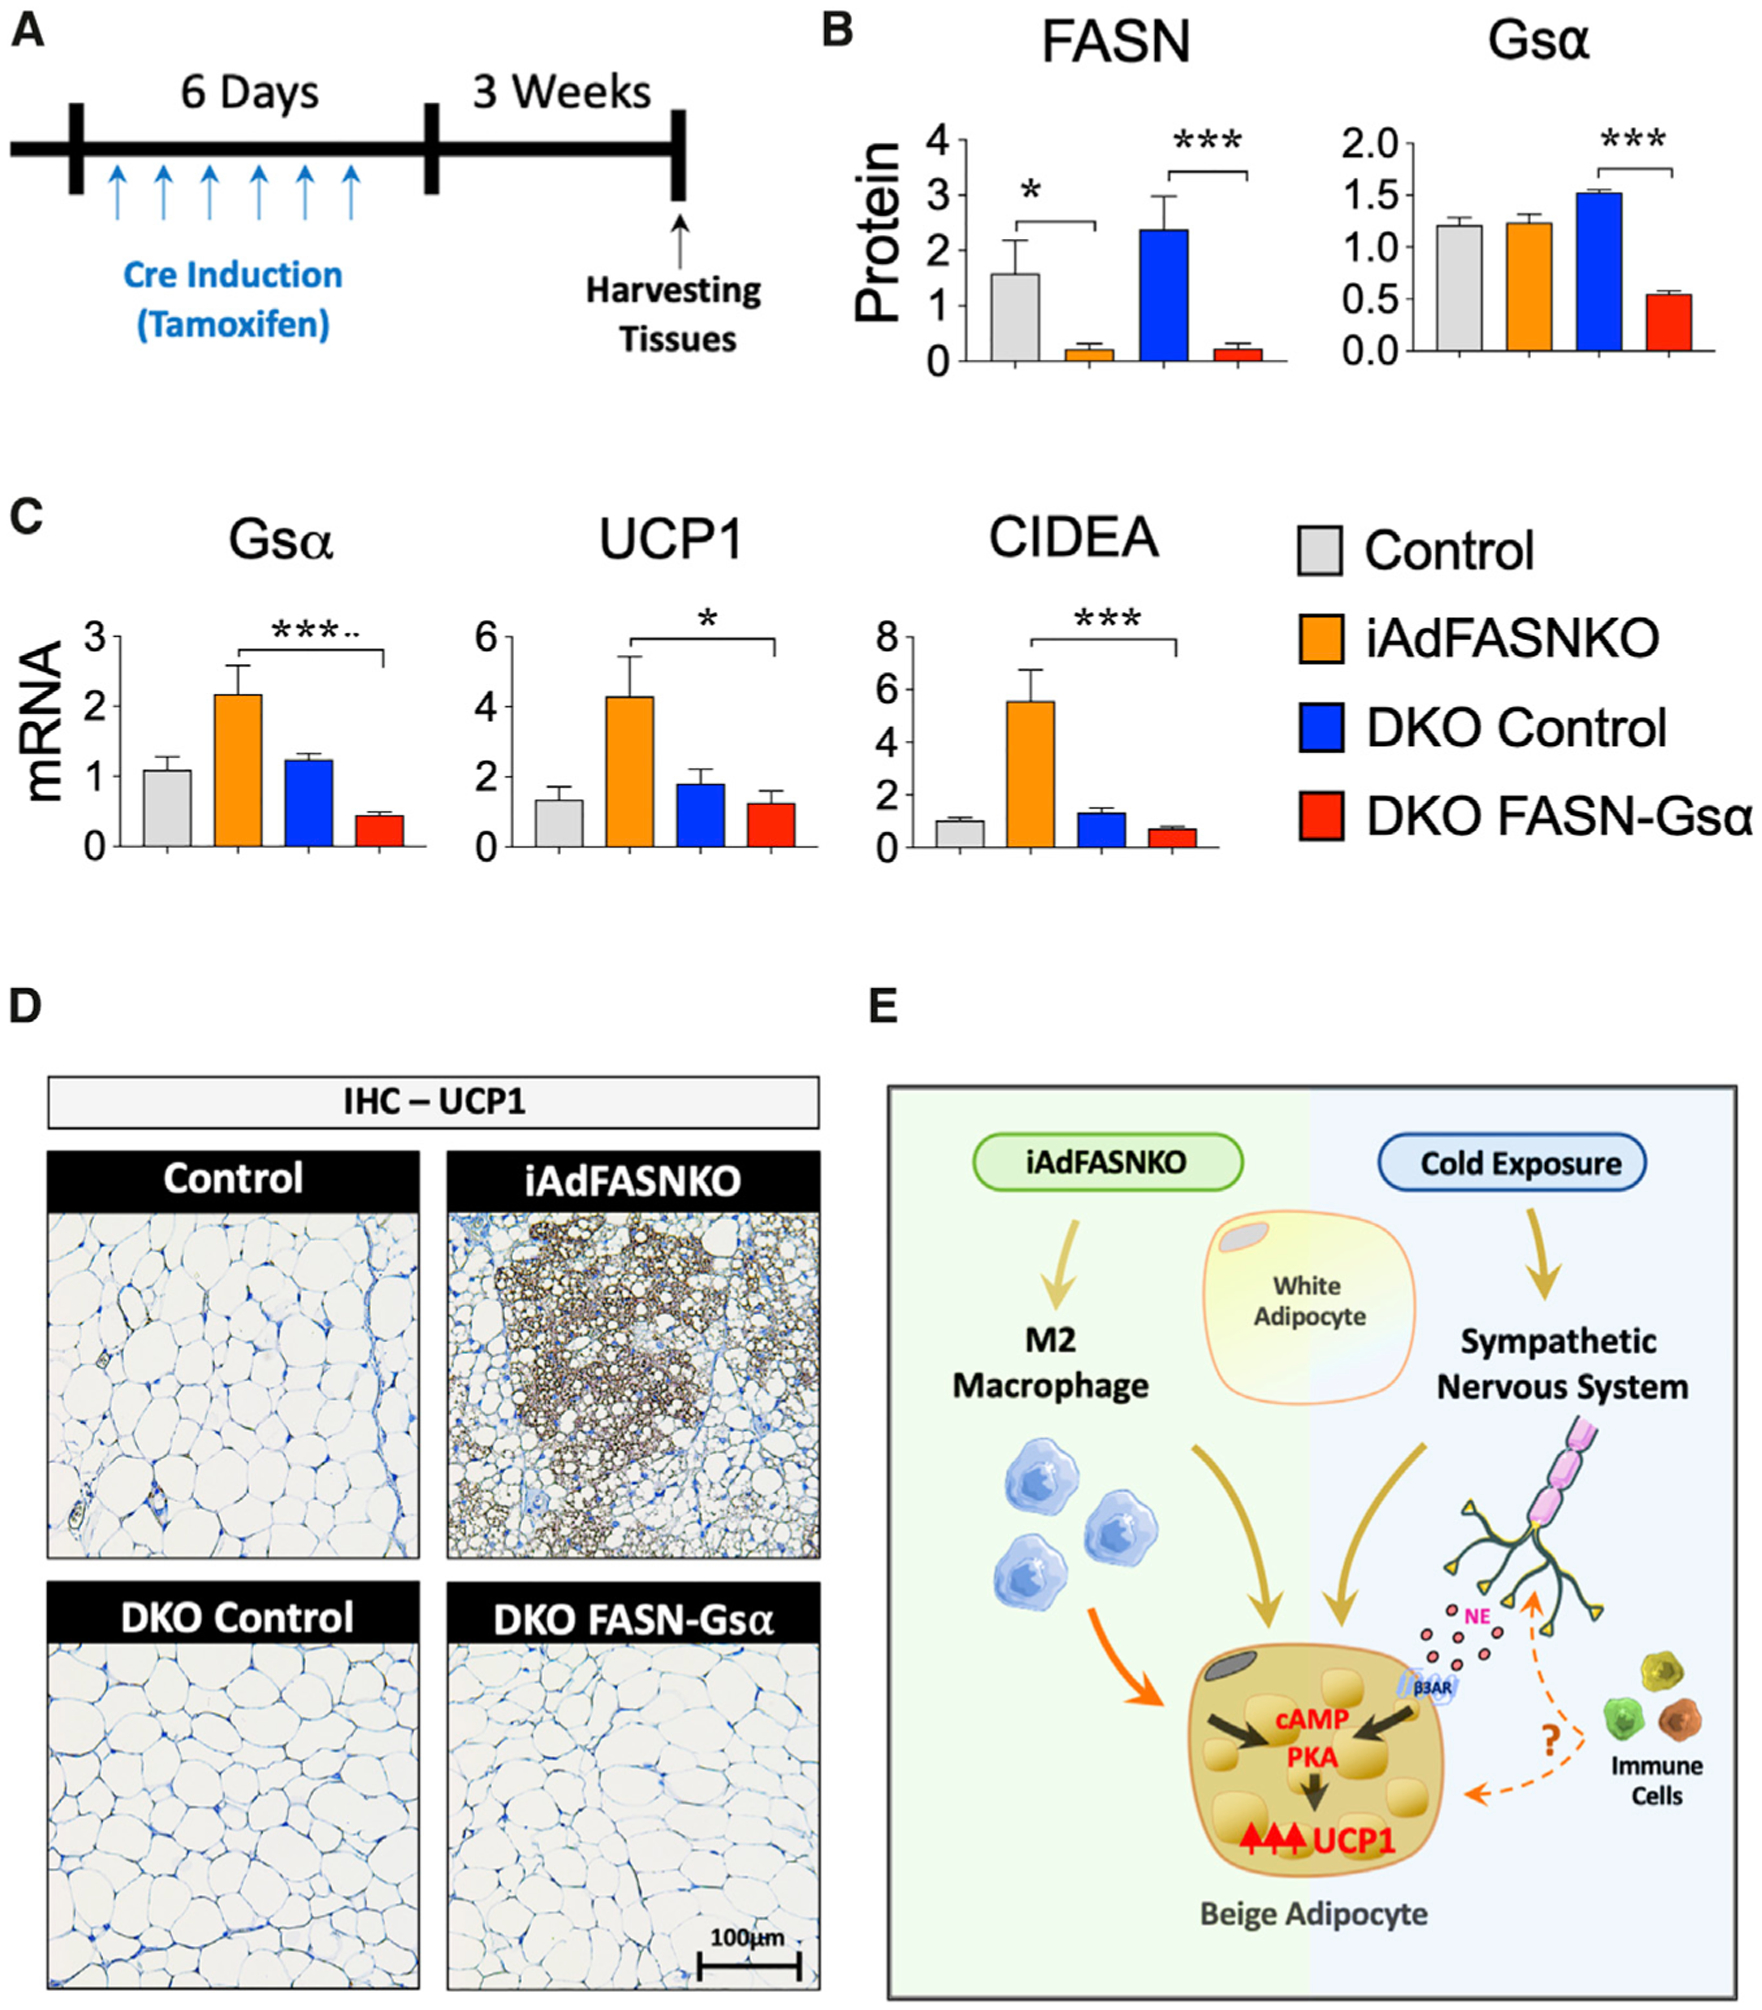
(A) Diagram representing the double KO (FASN+Gsα) experimental protocol.
(B) FASN, Gsα, and UCP1 protein levels of iWAT were quantified by densitometry from the immunoblot data from the different experimental conditions (control mice, iAdFASNKO mice, double KO control mice, and double KO FASN+Gsα mice). GAPDH was used for loading control.
(C) qRT-PCR was performed for Gsa, Ucp1, and Cidea mRNA quantification in iWAT from different experimental conditions. n = 4–5 per group. The results are presented as the means ± SEM. Two-tailed Student’s t test determined statistical significance: *p < 0.05, iAdFASNKO versus double KO (FASN+Gsα); **p < 0.001, control versus iAdFASNKO; ***p < 0.001, iAdFASNKO versus double KO (FASN+Gsα).
(D) Representative IHC analyses for the detection of UCP1 in iWAT from the different experimental conditions. Representative images are shown. Scale bars are shown in the lower right panel.
(E) The proposed model shows the two pathways hypothesized to be caused by iAdFASNKO versus cold exposure in promoting iWAT browning. The former (left) causes appearance of beige adipocytes even in denervated iWAT and is associated with a shift in macrophage polarization toward the alternatively activated, anti-inflammation type involved in tissue remodeling, while iWAT browning in response to cold exposure (right) requires intact sympathetic innervation and is enhanced by immune cells by undefined mechanisms. The factors that are released by adipocytes to modify macrophage phenotype as well as those postulated to be secreted by macrophages to cause iWAT browning are topics of current investigation.
DISCUSSION
The major finding of this study is that at least two divergent pathways involving adipose stromal vascular cell types are fully and independently able to cause the appearance of thermogenic beige adipocytes within iWAT depots in mice. One pathway can be triggered by cold exposure and is dependent on active sympathetic innervation of iWAT depots (Figures 1 and 2), while a separate pathway initiated by adipocyte FASN deficiency is dependent on phagocytic cells within iWAT but independent of innervation (Figure 2). Interestingly, stimulation of iWAT beiging by both pathways is associated with increased sympathetic activity in iWAT (Cao et al., 2018; Chi et al., 2018; Guilherme et al., 2017; Jiang et al., 2017), even though it is not required for beiging in response to adipocyte FASN deficiency. It may be that the sympathetic activation in iAdFASNKO mice also stimulates the appearance of beige adipocytes in iWAT but that this pathway is redundant with the macrophage-dependent pathway and not additive. Our imaging of iWAT by light sheet microscopy shows similar high-density SNFs within the areas of beige adipocytes, both in cold-exposed and iAdFASNKO mice, but direct comparison of the sympathetic nerve activities in these two models has not been determined. The extent of the increase in iWAT sympathetic nerve density by cold exposure is controversial, as one group reports large increases (Jiang et al., 2017) while another reports little effect (Chi et al., 2018). Our data from measuring total TH expression measured in entire iWAT pads suggests only modest increases due to either cold exposure (Figures 3C and 3D) or adipocytes deficient in FASN (Guilherme et al., 2018), in the range of 2-fold, which may not be easily quantified in the imaging experiments. Since the extent of beiging in iWAT is greater in cold exposure than in iAdFASNKO mice (Figures 1 and 2), it is likely that cold exposure stimulates SNF activity more strongly than that which occurs in iAdFASNKO mice.
The involvement of adipose tissue macrophages in iWAT browning has been controversial, following published evidence supporting the novel concept that macrophages themselves secrete catecholamine to activate adipocytes toward thermogenic activity (Nguyen et al., 2011; Qiu et al., 2014). Strong evidence against this hypothesis was then raised (Fischer et al., 2017), and, more recently, two groups reported that a specific macrophage population associated with SNFs instead takes up NE within a degradation pathway (Camell et al., 2017; Pirzgalska et al., 2017). Importantly, all of the reports that have implicated macrophage involvement in adipose tissue browning have done so in the context of intact sympathetic neurons, and no previous data that we know of have shown that macrophages can mediate browning without such adipose tissue innervation (Camell et al., 2017; Pirzgalska et al., 2017; Villarroya et al., 2018). Thus, the results presented here represent an advance on the issue of macrophage involvement in adipose browning, as we show that it can operate effectively independent of sympathetic activation (Figure 2).
Single-cell transcriptomic analysis has been a powerful tool in identifying and quantifying the various cell types within adipose tissues (Burl et al., 2018; Hill et al., 2018; Jaitin et al., 2019; Merrick et al., 2019; Rajbhandari et al., 2019; Weinstock et al., 2019); therefore, we used this method to probe the key question of what adipose cell types might be involved in mediating the phenotype of iAdFASNKO mice. By obtaining approximately 105 sequencing reads per cell from adipose tissue SVF in our analysis, we were able to initially define adipose tissue cell types reasonably compatible with previous reports (Burl et al., 2018; Merrick et al., 2019; Rajbhandari et al., 2019), including endothelial cells, several immune cell types, Schwann cells, smooth muscle cells, and progenitor cells. Interestingly, we noted an apparent increase in the abundance of a cell cluster that we denote as peripheral neuron-associated Schwann cells based on their gene expression signature (Figure 4; Figure S3), similar to the increase we have reported for SNFs (Guilherme et al., 2017, 2018). However, since SNFs are not required for adipose browning in iAdFASNKO mice, we focused our attention on macrophages, the other cell type that has been repeatedly reported to change in cold-induced browning (Cereijo et al., 2018; Hui et al., 2015; Jun et al., 2018; Pirzgalska et al., 2017). Specifically, adipose browning is reported to be associated with an increased macrophage polarization toward what has been denoted as the alternatively activated M2 state (Burl et al., 2018; Hui et al., 2015; Lv et al., 2016; Shan et al., 2017), and we observed a similar apparent increase in the M2 macrophage sub-cluster in iAdFASNKO mice (Figure 5). This finding was confirmed independently by FACS analysis in iAdFASNKO mice (Figure S6). These data, combined with the requirement for iWAT macrophages to elicit adipose browning in iAdFASNKO mice (Figure 6), suggest that these cells are critical for mediating this iWAT browning. We recognize that designations such as M1 and M2 macrophages do not appropriately reflect the full spectrum, reversibility, and dynamics of the macrophage populations under study and are only used as a way to designate which extremes are more like the populations we identify.
Interestingly, the divergent pathways that mediate iWAT beiging, emanating from nerve fibers in cold-exposed mice versus macrophages in iAdFASNKO mice, appear to converge at the level of the cAMP/PKA signaling pathway within the iWAT adipocytes (Figure 7E). Thus, a greatly increased abundance of phospho-perilipin and phospho-HSL, known substrates of PKA (Braun et al., 2018; Yang and Yang, 2016), is observed in the iWAT of iAdFASNKO mice compared to wild-type mice (Figure S1A), similar to what is observed in cold-exposed mice (Ger-hart-Hines et al., 2011; Kumar et al., 2008). In the case of cold exposure, it is known that catecholamines emanating from SNFs act through βARs to stimulate the cAMP/PKA pathway to activate protein kinase p38 and downstream transcription factors that regulate expression of UCP1 and other thermogenic genes (Collins, 2012). In contrast, in the case of iAdFASNKO mice, the data presented here suggest that catecholamines derived from local iWAT nerve fibers are not the cause of cAMP/PKA stimulation, since it is not blocked by denervation (Figure S1A). However, the important experiment in Figure 7 does show that the ability to generate cAMP within adipocytes is necessary to attain iWAT beiging in iAdFASNKO mice, as adipocyte-selective Gsα deficiency attenuates the expression of iWAT UCP1 in iAdFASNKO mice, as in cold exposure (Li et al., 2016). These data also reinforce the concept that beiging in iAdFASNKO mice results from direct conversion of white adipocytes to beige adipocytes, since it is the cAMP in mature adipocytes that is necessary for the beiging (Figure 7). Taken together, the data indicate that divergent inputs into cAMP generation in adipocytes lead to the similar outcome of iWAT beiging in the two models studied here (Figure 7E).
It is not known what factors derived from alternatively activated macrophages might be most important in driving the emergence of beige adipocytes in iWAT from cold exposure or in iAdFASNKO mice. One reported factor may be acetylcholine from immune cells, but this is not apparently sufficient to maintain chronic iWAT browning and appears to be derived from lymphocytes (Jun et al., 2018). Suggestions that macrophages themselves can synthesize and secrete catecholamines to produce adipose browning (Nguyen et al., 2011; Qiu et al., 2014) have been dismissed by others (Fischer et al., 2017), but this idea remains controversial with conflicting data (Jeon et al., 2019; Shan et al., 2017; Zhao et al., 2018). Clearly, a key gap in our knowledge about the connection between adipose tissue immune cells and emergence of iWAT beige adipocytes is how these cells mediate such effects, an important area of current investigation. However, an important conclusion from our present study is that strong adipose browning and associated improvements in glucose tolerance can be elicited through mechanisms initiated by adipocytes themselves that do not require adipose tissue innervation by SNFs.
STAR★METHODS
RESOURCE AVAILABILITY
Lead Contact
Further information and requests for resources and reagents should be directed to and will be fulfilled by the Lead Contact, Dr. Michael P. Czech (Michael.Czech@umassmed.edu).
Materials Availability
This study did not generate new unique reagents.
Data and Code Availability
The single-cell RNA sequencing data generated in this study have been deposited in GEO (https://www.ncbi.nlm.nih.gov/geo/) with accession number: GSE154047.
EXPERIMENTAL MODEL AND SUBJECT DETAILS
Mice
Eight-week-old male C57BL/6J (WT) mice were obtained from Jackson Laboratory. Mice were housed on a 12h light/dark schedule and had free access to water and food. Mice with conditional Fasnflox/flox alleles were generated as described elsewhere (Lodhi et al., 2012). To knockout Fasn in adult mice, homozygous Fasnflox/flox animals were crossed to Adiponectin-Cre-ERT2 mice as previously described (Guilherme et al., 2017). Briefly, at eight weeks of age, both Fasnflox/flox and Fasnflox/flox -Adiponectin-Cre-ERT2 (iAdFASNKO) were treated once a day with 1 mg tamoxifen (TAM) dissolved in corn oil via intraperitoneal (i.p.) injection for six consecutive days. Nrg4 whole-body knockout (NRG4KO) mice were provided by Dr. Jiandie D. Lin. To obtain the double knockout mouse model, iAdFASNKO was bred with NRG4KO to generate an iAdFASNKO + NRG4KO mouse line. Adipocyte deletion of FASN in iAdFASNKO + NRG4KO was achieved by treating adult mice with TAM injections as described. To selectively delete FASN and Gsα in adipocytes from adult mice, TAM-inducible adiponectin-GsαKO were crossed to iAdFASNKO mice to generate a TAM-inducible adipocyte-specific FASN/Gsα double knockout mouse line. All of the studies performed were approved by the Institutional Animal Care and Use Committee (IACUC) of the University of Massachusetts Medical School.
METHOD DETAILS
Cold Exposure
Wild-type mice were single-caged and housed at 6°C for six days. Animals were exposed to a standard 12h:12h light:dark cycle and had free access to food pellets and water. Rectal temperatures were recorded every hour for a total of 6h.
Western Blots
For protein expression analyses, iWAT was homogenized in TNET buffer (50 mM Tris-HCl, pH 7.6, 150 mM NaCl, 5 mM EDTA, 1% Triton X-100) as described (Morley et al., 2015) with Halt protease and phosphatase inhibitors (Thermo Pierce). Samples from tissue lysates were then resolved by SDS-PAGE. Immunoblotting was performed using standard protocols. Membranes were blotted with the following antibodies: anti-FASN (BD Biosciences); anti-UCP1 (Abcam); anti-TH (Millipore); anti-phospho HSL-S660 and anti-phospho perilipin (Cell Signaling Technology), anti-Actin and anti-Tubulin (Sigma-Aldrich).
RNA isolation and RT-qPCR
Total RNA was isolated from mouse tissues using QIAzol Lysis Reagent Protocol (QIAGEN) following the manufacturer’s instructions. cDNA was synthesized from 1 μg of total RNA using iScript cDNA Synthesis Kit (BioRad). Quantitative RT-PCR was performed using iQ SybrGreen Supermix on a BioRad CFX97 thermocycler and analyzed as previously described (Livak and Schmittgen, 2001; Schmittgen and Livak, 2008). 36B4, 18S and βM2 served as controls for normalization. Primer sequences used for qRT–PCR analyses were listed in Table S1.
Histological Analysis
For the immunohistochemistry (IHC) and immunofluorescence (IF) analyses, adipose tissue samples were fixed in 4% paraformaldehyde and embedded in paraffin. Sectioned slides were then stained with H&E, anti-UCP1 (Abcam, ab10983), anti-TH (Millipore, AB152) and anti-F4/80 (Bio-rad, MCA497GA) at the UMass Medical School Morphology Core. Photos from the fluorescent cells were taken with an Axiovert 35 Zeiss microscope (Zeiss) equipped with an Axiocam CCl camera at indicated magnification. For detection of macrophages in obese adipose tissue, epidydimal fat (eWAT) from 12-week-old ob/ob mice (JAX Lab) was fixed and stained with anti-F4/80 antibody as described.
Adipo-Clear
The Adipo-Clear method was performed following the protocol described previously (Chi et al., 2018). Mice were anesthetized, and an intracardiac perfusion/fixation was performed with 15 mL of cold 1x PBS + heparin (100 units/mL) followed by 15 mL of 4% PFA (Thermo). All harvested samples were postfixed in 4% PFA at 4°C overnight. Fixed samples were washed in 1x PBS for 1h three times at RT. The samples underwent delipidation and permeabilization following the same protocols described previously (Chi et al., 2018). Samples were incubated in primary antibody dilutions for 4 days. In this study, anti-UCP1 (1:200, Abcam, ab10983) and anti-TH (1:200, Millipore, AB1542) were used. Secondary antibodies conjugated with Alexa-568 and Alexa-647 were purchased from Invitrogen (1:200). All whole-tissue samples were imaged on a light-sheet microscope (Ultramicroscope II; LaVision Biotec) equipped with 1.1X, 4X and 12X objective lenses and sCMOs camera (Andor Neo). Images were acquired with InspectorPro software (LaVision BioTec). 3D reconstruction images were generated using Imaris x64 software (version 8.0.1, Bitplane).
Adipose sympathetic denervation
Adipose nerve fibers were chemically (6-hydroxydopamine, 6-OHDA) or surgically denervated as previously described (Vaughan et al., 2014). Regarding 6-OHDA, a slight modification was made in the final concentration: 24 μL of 6-OHDA from 100 μg/μL stock solution was administrated along each fat pad. For the cold exposures, mice were single-caged and housed at 6°C for six days following three days of post-denervation recovery. For iAdFASNKO mice, the mice were once daily treated with TAM for six consecutive days via intraperitoneal (i.p.) injection following three days of post-denervation recovery. After two weeks, animals were euthanized, and tissues were harvested. For the cold-exposed and iAdFASNKO groups, iWAT tyrosine hydroxylase content was examined via western blotting to confirm the efficiency of denervation.
Adipose Tissue Macrophage Depletion
Macrophages were depleted from mice using clodronate-containing liposomes. iAdFASNKO mice were injected i.p. with 500 μL of clodronate (150 mg/kg/mouse) every other day for two weeks. For the control group, the same protocol was applied using the PBS control liposomes. Gene expression analysis for macrophage markers was performed to validate the macrophage depletion in the iWAT. Clodronate and PBS liposomes were provided by Liposoma BV.
Single-Cell RNA-seq of Stromal Vascular Fraction from iWAT
Isolation of Stromal Vascular Fraction
Whole inguinal white adipose tissue (iWAT) pads from control (n = 7) and iAdFASNKO (n = 8) were dissected and placed in 50 mL conical tubes containing PBS. Fat pads were cut and minced in digestion buffer (5% BSA and 2 mg/ml collagenase type II) and incubated in a 37°C water bath for 45 min. The digested tissue was passed through a 100-μm-pore-size cell strainer and centrifuged at 600 g for 10 min. The pelleted cells were collected as the Stromal Vascular Fraction (SVF), and red blood cells were lysed by incubation with red blood cell lysis buffer for 5 min. The SVF was centrifuged again, and the cell pellet was resuspended in 1 mL of PBS. This final cell suspension solution was passed through a 40um cell strainer to discard debris and get single cells for Drop-Seq application.
Magnetic Bead Enrichment of Cellular Subtypes
SVF from control and iAdFASNKO mice were fractionated into lineage+ and lineage− pools. The SVF were labeled with microbead-tagged Direct Lineage Cell Depletion Cocktail (anti-CD5, CD11b, CD45R (B220), Anti-Gr-1 (Ly-6G/C), 7–4, and Ter-119; Miltenyi Biotec, Cat. No. 130–110-470) and passed onto MS columns (Miltenyi Biotec, Cat. No. 130–042-201) following the manufacturer’s protocol. The flow through (Lineage−) was collected and the bound cells were eluted (Lineage+ fraction). Cell fractions were resuspended in PBS with 0.04% BSA, counted, and diluted to a concentration of 1,000 cells/μL.
Drop-seq single-cell barcoding and library preparation
Following magnetic cell sorting, single-cell suspensions from lineage-positive (Lin+) and lineage-negative (Lin−), from control and iAdFASNKO were loaded onto the Single Cell 3′ Chip. Approximately 7,000 cells were loaded per channel for an expected recovery of ~5,000 cells. The loaded Single Cell 3′ Chip was placed on a 10X Genomics Chromium Controller Instrument (10X Genomics) to generate single-cell gel beads in emulsion (GEMs). Single-cell RNA-seq libraries were prepared using the Chromium Single Cell 3ʹ GEM, Library & Gel Bead Kit v3 (10X Genomics) according to the manufacturer’s protocol.
Illumina high-throughput sequencing libraries
The 10X genomics library molar concentration was quantified by Qubit Fluorometric Quantitation (Thermo Fisher) and library fragment length was estimated using a TapeStation System (Agilent). Libraries were sequenced using Illumina NovaSeq 6000 system performed by GENEWIZ, LLC (South Plainfield, NJ, USA) with 2.5 billion reads per run, yielding ~625 million reads per sample.
Clustering for single-cell RNA-seq
The Cell Ranger Single Cell Software Suite v.3.1.0 (10X Genomics) was used to perform sample de-multiplexing, alignment, filtering, and UMI counting, normalization between samples, and clustering (except for macrophage sub-clustering). Lin+ and Lin− from control and iAdFASNKO data were aggregated for direct comparison of single-cell transcriptomes. Clustering and gene expression were visualized with Loupe Cell Browser v.3.1.1 (10X Genomics). Clusters were generated by Cell Ranger via K-means clustering based on the PCA of the transcriptomic signature. Clusters were manually named based on the top 20 upregulated differentially expressed genes between clusters. Related to the sub-clustering, Lin+ cells in the Macrophage-like cluster were separated into five new sub-clusters via visual inspection within the Loupe Cell Browser v.3.1.1 (10X Genomics) based on the top 20 upregulated genes for each cluster and knowledge of canonical cell markers. The heatmap was generated from the Loupe browser of the top 5 upregulated differentially expressed genes between sub-clusters. Colors (values) are z-score of the average log fold-change between sub-clusters for each gene. To produce bar plots of the mean and variance of gene expression and violin plots of gene expression, cluster identities and filtered gene matrices generated by Cell Ranger Single Cell Software Suite v.3.1.0 (10X Genomics) were used as input into the open-source R toolkit Seurat. Cell-type pathway enrichment analysis were performed using gene ontology (GO), related to the biological process of differential gene expression.
QUANTIFICATION AND STATISTICAL ANALYSIS
Data were analyzed in GraphPad Prism 8 (GraphPad Software, Inc.). For analysis of the statistical significance of difference between two or three groups, two-sided unpaired Student’s t test was used. For analysis of the statistical significance between four or more groups, two-way ANOVA was used. The data are presented as means ± SEM. Sample size estimation was not used. Studies were not conducted blinded.
Supplementary Material
KEY RESOURCES TABLE
| REAGENT or RESOURCE | SOURCE | IDENTIFIER |
|---|---|---|
| Antibodies | ||
| Anti-Fatty Acid Synthase | BD Bioscience | Cat# 610963; RRID: AB_398276 |
| Anti-Fatty Acid Synthase | Abcam | Cat# ab22759; RRID: AB_732316 |
| Anti-UCP1 | Abcam | Cat# ab10983; RRID: AB_2241462 |
| Anti-Tyrosine Hydroxylase | Abcam | Cat# ab75875; RRID: AB_1310786 |
| Anti-pHSL(Ser563) | Cell Signaling Technology | Cat# 4139; RRID: AB_2135495 |
| Anti-phospho PKA substrate (RRXS*/T*) | Cell Signaling Technology | Cat# 9624; RRID: AB_331817 |
| Anti-GAPDH | Cell Signaling Technology | Cat# 2118; RRID: AB_561053 |
| Anti-β-Actin | Sigma-Aldrich | Cat# A2228; RRID: AB_476697 |
| Anti-Rabbit IgG antibody, HRP-conjugated | Millipore | Cat# AP307P; RRID: AB_11212848 |
| Anti-Mouse IgG antibody HRP-conjugated | Millipore | Cat# AP308P, RRID: AB_11215796 |
| Anti-Tyrosine Hydroxylase | Millipore | Cat# AB1542; RRID: AB_90755 |
| Donkey Anti-Rabbit IgG (H+L) Alexa Fluor 568 | Thermo Fisher Scientific | Cat# A10042; RRID: AB_2534017 |
| Donkey Anti-Sheep IgG (H+L) Alexa Fluor 647 | Thermo Fisher Scientific | Cat# A21448; RRID: AB_2535865 |
| Anti-Gsα | Li et al., 2016 | N/A |
| Chemicals, Peptides, and Recombinant Proteins | ||
| Tamoxifen | Sigma-Aldrich | Cat# T5648 |
| CL 316,243 | Sigma-Aldrich | Cat# C5976 |
| 6-Hydroxydopamine hydrochloride (6-OHDA) | Sigma-Aldrich | Cat# H4381 |
| Bovine serum albumin (fatty acid free) | Sigma-Aldrich | Cat# A8806 |
| D-(+)-Glucose | Sigma-Aldrich | Cat# G8270 |
| Phosphate-buffered saline (PBS) | GIBCO | Cat# 14190144 |
| QIAzol Lysis Reagent | QIAGEN | Cat# 79306 |
| Dichloromethane (DCM) | Sigma-Adrich | Cat# 270991; CAS Number: 75–09-2 |
| Benzyl ether (DBE) | Sigma-Adrich | Cat# 108014; CAS Number: 103–50-4 |
| Triton X-100 | Sigma-Adrich | Cat# 500ML; CAS Number: 9002–93-1 |
| Tween 20 | Sigma-Adrich | Cat# 500ML; CAS Number: 9005–64-5 |
| UltraPure Agarose | Invitrogen | Cat# 16500500; CAS Number: 9012–36-6 |
| Critical Commercial Assays | ||
| iScript™ cDNA Synthesis Kit | Bio-Rad Laboratories | Cat# 1708891 |
| iTaq Universal SYBR® Green Supermix | Bio-Rad Laboratories | Cat# 1725121 |
| Lineage Cell Depletion Cocktail - mouse | Miltenyi Biotec | Cat# 130–110-470 |
| MS Columns | Miltenyi Biotec | Cat# 130–042-201 |
| Chromium Single Cell 3’ GEM, Library & Gel Bead Kit v3 | 10X Genomics | https://www.10xgenomics.com |
| Deposited Data | ||
| scRNA-seq data | This paper | GSE154047 |
| Experimental Models: Organisms/Strains | ||
| Mouse: C57BL/6J | The Jackson Laboratory | Stock# 000664; RRID: IMSR_JAX:000664 |
| Mouse: FASN-Flox/Flox | Lodhi et al., 2012 | N/A |
| Mouse: iAdFASNKO | Guilherme et al., 2017 | N/A |
| Mouse: Gsα-Flox/Flox | Li et al., 2016 | N/A |
| Mouse: Nrg4 KO | Wang et al., 2014 | N/A |
| Mouse: DKO (FASN+Nrg4) | This paper | N/A |
| Mouse: DKO (FASN+Gsα) | This paper | N/A |
| Oligonucleotides | ||
| Table S1 | This paper | N/A |
| Software and Algorithms | ||
| GraphPad Prism 8 | GraphPad | GraphPad Software, Inc |
| Image Lab 5 Analysis Software | Bio-Rad Laboratories | Iten# 1709690 |
| ImageJ | ImageJ | ImageJ.nih.gov |
| Loupe Cell Browser 3.1.1 | 10X Genomics | https://www.10xgenomics.com |
| Cell Ranger v2.1.0 | 10X Genomics | https://www.10xgenomics.com |
| Imaris | Bitplane | https://imaris.oxinst.com/ |
| Other | ||
| ChemiDoc™ XRS+ Imaging System | Bio-Rad Laboratories | Model# 1708265 |
| Leica DM2500 LED optical microscope | Leica Microsystems | Model# DM2500 LED |
| Leica MC170 HD camera | Leica Microsystems | Model# MC170 HD |
| Chromium Controller & Next GEM Accessory Kit | 10X Genomics | https://www.10xgenomics.com |
Highlights.
Light sheet microscopy reveals nerve fibers abutting beige adipocytes in iWAT
iWAT denervation blocks cold-induced but not adipocyte FASNKO-induced iWAT beiging
cAMP/PKA pathway in adipocytes mediates iWAT beiging in adipocyte FASNKO mice
Macrophages but not innervation are required for beiging in adipocyte FASNKO mice
ACKNOWLEDGMENTS
We thank all members of the Czech Lab for helpful discussions and critical reading of the manuscript. We thank the University of Massachusetts (UMass) Morphology Core for assistance. This work was supported by National Institutes of Health grants DK30898 and DK103047 to M.P.C., DK120649 to P.C., and DK102456 to J.D.L. and partially supported by the Intramural Research Program of the National Institute of Diabetes and Digestive and Kidney Diseases (NIDDK), NIH, to L.S.W. The authors gratefully acknowledge the commitment and support from American Diabetes Association grant 1-19-PMF-035 to F.H. and Pathway Program grant 1-17-ACE-17 to P.C.
Footnotes
DECLARATION OF INTERESTS
The authors declare no competing interests.
SUPPLEMENTAL INFORMATION
Supplemental Information can be found online at https://doi.org/10.1016/j.celrep.2020.107998.
REFERENCES
- Aldiss P, Betts J, Sale C, Pope M, Budge H, and Symonds ME (2018). Exercise-induced ‘browning’ of adipose tissues. Metabolism 81, 63–70. [DOI] [PMC free article] [PubMed] [Google Scholar]
- Amano SU, Cohen JL, Vangala P, Tencerova M, Nicoloro SM, Yawe JC, Shen Y, Czech MP, and Aouadi M (2014). Local proliferation of macrophages contributes to obesity-associated adipose tissue inflammation. Cell Metab. 19, 162–171. [DOI] [PMC free article] [PubMed] [Google Scholar]
- Bartness TJ, Vaughan CH, and Song CK (2010). Sympathetic and sensory innervation of brown adipose tissue. Int. J. Obes 34 (Suppl 1), S36–S42. [DOI] [PMC free article] [PubMed] [Google Scholar]
- Blaszkiewicz M, Willows JW, Johnson CP, and Townsend KL (2019). The Importance of Peripheral Nerves in Adipose Tissue for the Regulation of Energy Balance. Biology (Basel) 8, 10. [DOI] [PMC free article] [PubMed] [Google Scholar]
- Blüher M (2019). Neuregulin 4: A “Hotline” Between Brown Fat and Liver. Obesity (Silver Spring) 27, 1555–1557. [DOI] [PMC free article] [PubMed] [Google Scholar]
- Braun K, Oeckl J, Westermeier J, Li Y, and Klingenspor M (2018). Nonadrenergic control of lipolysis and thermogenesis in adipose tissues. J. Exp. Biol 221 (Pt Suppl. 1), jeb165381. [DOI] [PubMed] [Google Scholar]
- Bu L, Gao M, Qu S, and Liu D (2013). Intraperitoneal injection of clodronate liposomes eliminates visceral adipose macrophages and blocks high-fat diet-induced weight gain and development of insulin resistance. AAPS J 15, 1001–1011. [DOI] [PMC free article] [PubMed] [Google Scholar]
- Burl RB, Ramseyer VD, Rondini EA, Pique-Regi R, Lee YH, and Granneman JG (2018). Deconstructing Adipogenesis Induced by beta3-Adrenergic Receptor Activation with Single-Cell Expression Profiling. Cell Metab 28, 300–309.e4. [DOI] [PMC free article] [PubMed] [Google Scholar]
- Camell CD, Sander J, Spadaro O, Lee A, Nguyen KY, Wing A, Goldberg EL, Youm YH, Brown CW, Elsworth J, et al. (2017). Inflammasome-driven catecholamine catabolism in macrophages blunts lipolysis during ageing. Nature 550, 119–123. [DOI] [PMC free article] [PubMed] [Google Scholar]
- Cao Y, Wang H, and Zeng W (2018). Whole-tissue 3D imaging reveals intra-adipose sympathetic plasticity regulated by NGF-TrkA signal in cold-induced beiging. Protein Cell 9, 527–539. [DOI] [PMC free article] [PubMed] [Google Scholar]
- Cao Q, Jing J, Cui X, Shi H, and Xue B (2019). Sympathetic nerve innervation is required for beigeing in white fat. Physiol. Rep 7, e14031. [DOI] [PMC free article] [PubMed] [Google Scholar]
- Ceddia RP, and Collins S (2020). A compendium of G-protein-coupled receptors and cyclic nucleotide regulation of adipose tissue metabolism and energy expenditure. Clin. Sci. (Lond.) 134, 473–512. [DOI] [PMC free article] [PubMed] [Google Scholar]
- Cereijo R, Gavalda-Navarro A, Cairo M, Quesada-Lopez T, Villarroya J, Moron-Ros S, Sanchez-Infantes D, Peyrou M, Iglesias R, Mampel T, et al. (2018). CXCL14, a Brown Adipokine that Mediates Brown-Fat-to-Macrophage Communication in Thermogenic Adaptation. Cell Metab 28, 750–763.e6. [DOI] [PubMed] [Google Scholar]
- Chi J, Wu Z, Choi CHJ, Nguyen L, Tegegne S, Ackerman SE, Crane A, Marchildon F, Tessier-Lavigne M, and Cohen P (2018). Three-Dimensional Adipose Tissue Imaging Reveals Regional Variation in Beige Fat Biogenesis and PRDM16-Dependent Sympathetic Neurite Density. Cell Metab 27, 226–236. e3. [DOI] [PubMed] [Google Scholar]
- Chouchani ET, and Kajimura S (2019). Metabolic adaptation and maladaptation in adipose tissue. Nat. Metab 1, 189–200. [DOI] [PMC free article] [PubMed] [Google Scholar]
- Collins S (2012). β-Adrenoceptor Signaling Networks in Adipocytes for Recruiting Stored Fat and Energy Expenditure. Front. Endocrinol. (Lausanne) 2, 102. [DOI] [PMC free article] [PubMed] [Google Scholar]
- Comas F, Martínez C, Sabater M, Ortega F, Latorre J, Díaz-Sáez F, Aragonés J, Camps M, Gumà A, Ricart W, et al. (2019). Neuregulin 4 Is a Novel Marker of Beige Adipocyte Precursor Cells in Human Adipose Tissue. Front. Physiol 10, 39. [DOI] [PMC free article] [PubMed] [Google Scholar]
- Czech MP (2020). Mechanisms of insulin resistance related to white, beige, and brown adipocytes. Mol. Metab 34, 27–42. [DOI] [PMC free article] [PubMed] [Google Scholar]
- Dickson LM, Gandhi S, Layden BT, Cohen RN, and Wicksteed B (2016). Protein kinase A induces UCP1 expression in specific adipose depots to increase energy expenditure and improve metabolic health. Am. J. Physiol. Regul. Integr. Comp. Physiol 311, R79–R88. [DOI] [PMC free article] [PubMed] [Google Scholar]
- Fabbiano S, Suárez-Zamorano N, Rigo D, Veyrat-Durebex C, Stevanovic Dokic A, Colin DJ, and Trajkovski M (2016). Caloric Restriction Leads to Browning of White Adipose Tissue through Type 2 Immune Signaling. Cell Metab 24, 434–446. [DOI] [PubMed] [Google Scholar]
- Feng B, Jiao P, Nie Y, Kim T, Jun D, van Rooijen N, Yang Z, and Xu H (2011). Clodronate liposomes improve metabolic profile and reduce visceral adipose macrophage content in diet-induced obese mice. PLoS ONE 6, e24358. [DOI] [PMC free article] [PubMed] [Google Scholar]
- Fischer K, Ruiz HH, Jhun K, Finan B, Oberlin DJ, van der Heide V, Kalinovich AV, Petrovic N, Wolf Y, Clemmensen C, et al. (2017). Alternatively activated macrophages do not synthesize catecholamines or contribute to adipose tissue adaptive thermogenesis. Nat. Med 23, 623–630. [DOI] [PMC free article] [PubMed] [Google Scholar]
- Foster MT, and Bartness TJ (2006). Sympathetic but not sensory denervation stimulates white adipocyte proliferation. Am. J. Physiol. Regul. Integr. Comp. Physiol 291, R1630–R1637. [DOI] [PubMed] [Google Scholar]
- Garretson JT, Szymanski LA, Schwartz GJ, Xue B, Ryu V, and Bartness TJ (2016). Lipolysis sensation by white fat afferent nerves triggers brown fat thermogenesis. Mol. Metab 5, 626–634. [DOI] [PMC free article] [PubMed] [Google Scholar]
- Gerhart-Hines Z, Dominy JE Jr., Blättler SM, Jedrychowski MP, Banks AS, Lim JH, Chim H, Gygi SP, and Puigserver P (2011). The cAMP/PKA pathway rapidly activates SIRT1 to promote fatty acid oxidation independently of changes in NAD(+). Mol. Cell 44, 851–863. [DOI] [PMC free article] [PubMed] [Google Scholar]
- Guilherme A, Pedersen DJ, Henchey E, Henriques FS, Danai LV, Shen Y, Yenilmez B, Jung D, Kim JK, Lodhi IJ, et al. (2017). Adipocyte lipid synthesis coupled to neuronal control of thermogenic programming. Mol. Metab 6, 781–796. [DOI] [PMC free article] [PubMed] [Google Scholar]
- Guilherme A, Pedersen DJ, Henriques F, Bedard AH, Henchey E, Kelly M, Morgan DA, Rahmouni K, and Czech MP (2018). Neuronal modulation of brown adipose activity through perturbation of white adipocyte lipogenesis. Mol. Metab 16, 116–125. [DOI] [PMC free article] [PubMed] [Google Scholar]
- Guilherme A, Henriques F, Bedard AH, and Czech MP (2019). Molecular pathways linking adipose innervation to insulin action in obesity and diabetes mellitus. Nat. Rev. Endocrinol 15, 207–225. [DOI] [PMC free article] [PubMed] [Google Scholar]
- Harris RB (2012). Sympathetic denervation of one white fat depot changes norepinephrine content and turnover in intact white and brown fat depots. Obesity (Silver Spring) 20, 1355–1364. [DOI] [PMC free article] [PubMed] [Google Scholar]
- Harris RBS (2018). Denervation as a tool for testing sympathetic control of white adipose tissue. Physiol. Behav 190, 3–10. [DOI] [PMC free article] [PubMed] [Google Scholar]
- Herz CT, and Kiefer FW (2019). Adipose tissue browning in mice and humans. J. Endocrinol 241, R97–R109. [PubMed] [Google Scholar]
- Hill DA, Lim HW, Kim YH, Ho WY, Foong YH, Nelson VL, Nguyen HCB, Chegireddy K, Kim J, Habertheuer A, et al. (2018). Distinct macrophage populations direct inflammatory versus physiological changes in adipose tissue. Proc. Natl. Acad. Sci. USA 115, E5096–E5105. [DOI] [PMC free article] [PubMed] [Google Scholar]
- Hui X, Gu P, Zhang J, Nie T, Pan Y, Wu D, Feng T, Zhong C, Wang Y, Lam KS, and Xu A (2015). Adiponectin Enhances Cold-Induced Browning of Subcutaneous Adipose Tissue via Promoting M2 Macrophage Proliferation. Cell Metab 22, 279–290. [DOI] [PubMed] [Google Scholar]
- Jaitin DA, Adlung L, Thaiss CA, Weiner A, Li B, Descamps H, Lundgren P, Bleriot C, Liu Z, Deczkowska A, et al. (2019). Lipid-Associated Macrophages Control Metabolic Homeostasis in a Trem2-Dependent Manner. Cell 178, 686–698.e14. [DOI] [PMC free article] [PubMed] [Google Scholar]
- Jeon EJ, Kim DY, Lee NH, Choi HE, and Cheon HG (2019). Telmisartan induces browning of fully differentiated white adipocytes via M2 macrophage polarization. Sci. Rep 9, 1236. [DOI] [PMC free article] [PubMed] [Google Scholar]
- Jiang H, Ding X, Cao Y, Wang H, and Zeng W (2017). Dense Intra-adipose Sympathetic Arborizations Are Essential for Cold-Induced Beiging of Mouse White Adipose Tissue. Cell Metab 26, 686–692. e3. [DOI] [PubMed] [Google Scholar]
- Jun H, Yu H, Gong J, Jiang J, Qiao X, Perkey E, Kim DI, Emont MP, Zestos AG, Cho JS, et al. (2018). An immune-beige adipocyte communication via nicotinic acetylcholine receptor signaling. Nat. Med 24, 814–822. [DOI] [PMC free article] [PubMed] [Google Scholar]
- Kumar N, Liu D, Wang H, Robidoux J, and Collins S (2008). Orphan nuclear receptor NOR-1 enhances 3′,5′-cyclic adenosine 5′-monophosphate-dependent uncoupling protein-1 gene transcription. Mol. Endocrinol 22, 1057–1064. [DOI] [PMC free article] [PubMed] [Google Scholar]
- Li YQ, Shrestha YB, Chen M, Chanturiya T, Gavrilova O, and Weinstein LS (2016). Gsα deficiency in adipose tissue improves glucose metabolism and insulin sensitivity without an effect on body weight. Proc. Natl. Acad. Sci. USA 113, 446–451. [DOI] [PMC free article] [PubMed] [Google Scholar]
- Li G, Xie C, Lu S, Nichols RG, Tian Y, Li L, Patel D, Ma Y, Brocker CN, Yan T, et al. (2017). Intermittent Fasting Promotes White Adipose Browning and Decreases Obesity by Shaping the Gut Microbiota. Cell Metab 26, 672–685.e4. [DOI] [PMC free article] [PubMed] [Google Scholar]
- Liu PS, Lin YW, Burton FH, and Wei LN (2015). Injecting engineered anti-inflammatory macrophages therapeutically induces white adipose tissue browning and improves diet-induced insulin resistance. Adipocyte 4, 123–128. [DOI] [PMC free article] [PubMed] [Google Scholar]
- Liu D, Bordicchia M, Zhang C, Fang H, Wei W, Li JL, Guilherme A, Guntur K, Czech MP, and Collins S (2016). Activation of mTORC1 is essential for β-adrenergic stimulation of adipose browning. J. Clin. Invest 126, 1704–1716. [DOI] [PMC free article] [PubMed] [Google Scholar]
- Livak KJ, and Schmittgen TD (2001). Analysis of relative gene expression data using real-time quantitative PCR and the 2(-Delta Delta C(T)) Method. Methods 25, 402–408. [DOI] [PubMed] [Google Scholar]
- Lodhi IJ, Yin L, Jensen-Urstad AP, Funai K, Coleman T, Baird JH, El Ramahi MK, Razani B, Song H, Fu-Hsu F, et al. (2012). Inhibiting adipose tissue lipogenesis reprograms thermogenesis and PPARγ activation to decrease diet-induced obesity. Cell Metab 16, 189–201. [DOI] [PMC free article] [PubMed] [Google Scholar]
- Lv Y, Zhang SY, Liang X, Zhang H, Xu Z, Liu B, Xu MJ, Jiang C, Shang J, and Wang X (2016). Adrenomedullin 2 Enhances Beiging in White Adipose Tissue Directly in an Adipocyte-autonomous Manner and Indirectly through Activation of M2 Macrophages. J. Biol. Chem 291, 23390–23402. [DOI] [PMC free article] [PubMed] [Google Scholar]
- Marro BS, Legrain S, Ware BC, and Oldstone MB (2019). Macrophage IFN-I signaling promotes autoreactive T cell infiltration into islets in type 1 diabetes model. JCI Insight 4, e125067. [DOI] [PMC free article] [PubMed] [Google Scholar]
- Merrick D, Sakers A, Irgebay Z, Okada C, Calvert C, Morley MP, Percec I, and Seale P (2019). Identification of a mesenchymal progenitor cell hierarchy in adipose tissue. Science 364, eaav2501. [DOI] [PMC free article] [PubMed] [Google Scholar]
- Morley TS, Xia JY, and Scherer PE (2015). Selective enhancement of insulin sensitivity in the mature adipocyte is sufficient for systemic metabolic improvements. Nat. Commun 6, 7906. [DOI] [PMC free article] [PubMed] [Google Scholar]
- Nguyen KD, Qiu Y, Cui X, Goh YP, Mwangi J, David T, Mukundan L, Brombacher F, Locksley RM, and Chawla A (2011). Alternatively activated macrophages produce catecholamines to sustain adaptive thermogenesis. Nature 480, 104–108. [DOI] [PMC free article] [PubMed] [Google Scholar]
- Patsouris D, Qi P, Abdullahi A, Stanojcic M, Chen P, Parousis A, Amini-Nik S, and Jeschke MG (2015). Burn Induces Browning of the Subcutaneous White Adipose Tissue in Mice and Humans. Cell Rep 13, 1538–1544. [DOI] [PMC free article] [PubMed] [Google Scholar]
- Pellegrinelli V, Peirce VJ, Howard L, Virtue S, Türei D, Senzacqua M, Frontini A, Dalley JW, Horton AR, Bidault G, et al. (2018). Adipocyte-secreted BMP8b mediates adrenergic-induced remodeling of the neurovascular network in adipose tissue. Nat. Commun 9, 4974. [DOI] [PMC free article] [PubMed] [Google Scholar]
- Pfeifer A (2015). NRG4: an endocrine link between brown adipose tissue and liver. Cell Metab 21, 13–14. [DOI] [PubMed] [Google Scholar]
- Pirzgalska RM, Seixas E, Seidman JS, Link VM, Sánchez NM, Mahú I, Mendes R, Gres V, Kubasova N, Morris I, et al. (2017). Sympathetic neuron-associated macrophages contribute to obesity by importing and metabolizing norepinephrine. Nat. Med 23, 1309–1318. [DOI] [PMC free article] [PubMed] [Google Scholar]
- Qiu Y, Nguyen KD, Odegaard JI, Cui X, Tian X, Locksley RM, Pal-miter RD, and Chawla A (2014). Eosinophils and type 2 cytokine signaling in macrophages orchestrate development of functional beige fat. Cell 157, 1292–1308. [DOI] [PMC free article] [PubMed] [Google Scholar]
- Rajbhandari P, Arneson D, Hart SK, Ahn IS, Diamante G, Santos LC, Zaghari N, Feng AC, Thomas BJ, Vergnes L, et al. (2019). Single cell analysis reveals immune cell-adipocyte crosstalk regulating the transcription of thermogenic adipocytes. eLife 8, e49501. [DOI] [PMC free article] [PubMed] [Google Scholar]
- Reverte-Salisa L, Sanyal A, and Pfeifer A (2019). Role of cAMP and cGMP Signaling in Brown Fat. Handb. Exp. Pharmacol 251, 161–182. [DOI] [PubMed] [Google Scholar]
- Rondini EA, and Granneman JG (2020). Single cell approaches to address adipose tissue stromal cell heterogeneity. Biochem. J 477, 583–600. [DOI] [PMC free article] [PubMed] [Google Scholar]
- Rosell M, Kaforou M, Frontini A, Okolo A, Chan YW, Nikolopoulou E, Millership S, Fenech ME, MacIntyre D, Turner JO, et al. (2014). Brown and white adipose tissues: intrinsic differences in gene expression and response to cold exposure in mice. Am. J. Physiol. Endocrinol. Metab 306, E945–E964. [DOI] [PMC free article] [PubMed] [Google Scholar]
- Rosen ED, and Spiegelman BM (2006). Adipocytes as regulators of energy balance and glucose homeostasis. Nature 444, 847–853. [DOI] [PMC free article] [PubMed] [Google Scholar]
- Saito M, Okamatsu-Ogura Y, Matsushita M, Watanabe K, Yoneshiro T, Nio-Kobayashi J, Iwanaga T, Miyagawa M, Kameya T, Nakada K, et al. (2009). High incidence of metabolically active brown adipose tissue in healthy adult humans: effects of cold exposure and adiposity. Diabetes 58, 1526–1531. [DOI] [PMC free article] [PubMed] [Google Scholar]
- Scheele C, and Wolfrum C (2020). Brown Adipose Crosstalk in Tissue Plasticity and Human Metabolism. Endocr. Rev 41, 41. [DOI] [PMC free article] [PubMed] [Google Scholar]
- Schmittgen TD, and Livak KJ (2008). Analyzing real-time PCR data by the comparative C(T) method. Nat. Protoc 3, 1101–1108. [DOI] [PubMed] [Google Scholar]
- Shan B, Wang X, Wu Y, Xu C, Xia Z, Dai J, Shao M, Zhao F, He S, Yang L, et al. (2017). The metabolic ER stress sensor IRE1α suppresses alternative activation of macrophages and impairs energy expenditure in obesity. Nat. Immunol 18, 519–529. [DOI] [PubMed] [Google Scholar]
- Shi H, Song CK, Giordano A, Cinti S, and Bartness TJ (2005). Sensory or sympathetic white adipose tissue denervation differentially affects depot growth and cellularity. Am. J. Physiol. Regul. Integr. Comp. Physiol 288, R1028–R1037. [DOI] [PubMed] [Google Scholar]
- Suárez-Zamorano N, Fabbiano S, Chevalier C, Stojanović O, Colin DJ, Stevanović A, Veyrat-Durebex C, Tarallo V, Rigo D, Germain S, et al. (2015). Microbiota depletion promotes browning of white adipose tissue and reduces obesity. Nat. Med 21, 1497–1501. [DOI] [PMC free article] [PubMed] [Google Scholar]
- van Marken Lichtenbelt WD, Vanhommerig JW, Smulders NM, Drossaerts JM, Kemerink GJ, Bouvy ND, Schrauwen P, and Teule GJ (2009). Cold-activated brown adipose tissue in healthy men. N. Engl. J. Med 360, 1500–1508. [DOI] [PubMed] [Google Scholar]
- van Rooijen N, and Hendrikx E (2010). Liposomes for specific depletion of macrophages from organs and tissues. Methods Mol. Biol 605, 189–203. [DOI] [PubMed] [Google Scholar]
- Van Rooijen N, and Sanders A (1994). Liposome mediated depletion of macrophages: mechanism of action, preparation of liposomes and applications. J. Immunol. Methods 174, 83–93. [DOI] [PubMed] [Google Scholar]
- Vargovic P, Manz G, and Kvetnansky R (2016). Continuous cold exposure induces an anti-inflammatory response in mesenteric adipose tissue associated with catecholamine production and thermogenin expression in rats. Endocr. Regul 50, 137–144. [DOI] [PubMed] [Google Scholar]
- Vaughan CH, Zarebidaki E, Ehlen JC, and Bartness TJ (2014). Analysis and measurement of the sympathetic and sensory innervation of white and brown adipose tissue. Methods Enzymol 537, 199–225. [DOI] [PMC free article] [PubMed] [Google Scholar]
- Villarroya F, Cereijo R, Villarroya J, and Giralt M (2017). Brown adipose tissue as a secretory organ. Nat. Rev. Endocrinol 13, 26–35. [DOI] [PubMed] [Google Scholar]
- Villarroya F, Cereijo R, Villarroya J, Gavaldà-Navarro A, and Giralt M (2018). Toward an Understanding of How Immune Cells Control Brown and Beige Adipobiology. Cell Metab 27, 954–961. [DOI] [PubMed] [Google Scholar]
- Villarroya J, Cereijo R, Gavaldà-Navarro A, Peyrou M, Giralt M, and Villarroya F (2019). New insights into the secretory functions of brown adipose tissue. J. Endocrinol 243, R19–R27. [DOI] [PubMed] [Google Scholar]
- Wang GX, Zhao XY, Meng ZX, Kern M, Dietrich A, Chen Z, Cozacov Z, Zhou D, Okunade AL, Su X, et al. (2014). The brown fat-enriched secreted factor Nrg4 preserves metabolic homeostasis through attenuation of hepatic lipogenesis. Nat. Med 20, 1436–1443. [DOI] [PMC free article] [PubMed] [Google Scholar]
- Weinstock A, Brown EJ, Garabedian ML, Pena S, Sharma M, Lafaille J, Moore KJ, and Fisher EA (2019). Single-Cell RNA Sequencing of Visceral Adipose Tissue Leukocytes Reveals that Caloric Restriction Following Obesity Promotes the Accumulation of a Distinct Macrophage Population with Features of Phagocytic Cells. Immunometabolism 1, e190008. [DOI] [PMC free article] [PubMed] [Google Scholar]
- Wu J, Boström P, Sparks LM, Ye L, Choi JH, Giang AH, Khandekar M, Virtanen KA, Nuutila P, Schaart G, et al. (2012). Beige adipocytes are a distinct type of thermogenic fat cell in mouse and human. Cell 150, 366–376. [DOI] [PMC free article] [PubMed] [Google Scholar]
- Yang H, and Yang L (2016). Targeting cAMP/PKA pathway for glycemic control and type 2 diabetes therapy. J. Mol. Endocrinol 57, R93–R108. [DOI] [PubMed] [Google Scholar]
- Zeisberger SM, Odermatt B, Marty C, Zehnder-Fjällman AH, Ballmer-Hofer K, and Schwendener RA (2006). Clodronate-liposome-mediated depletion of tumour-associated macrophages: a new and highly effective anti-angiogenic therapy approach. Br. J. Cancer 95, 272–281. [DOI] [PMC free article] [PubMed] [Google Scholar]
- Zhao H, Shang Q, Pan Z, Bai Y, Li Z, Zhang H, Zhang Q, Guo C, Zhang L, and Wang Q (2018). Exosomes From Adipose-Derived Stem Cells Attenuate Adipose Inflammation and Obesity Through Polarizing M2 Macrophages and Beiging in White Adipose Tissue. Diabetes 67, 235–247. [DOI] [PubMed] [Google Scholar]
Associated Data
This section collects any data citations, data availability statements, or supplementary materials included in this article.
Supplementary Materials
Data Availability Statement
The single-cell RNA sequencing data generated in this study have been deposited in GEO (https://www.ncbi.nlm.nih.gov/geo/) with accession number: GSE154047.