Abstract
目的
观察绿原酸(chlorogenic acid,CGA)对高脂饲料诱导的肥胖(diet-induced-obesity,DIO)大鼠糖耐量及其曲线特征的作用, 为开发利用CGA早期预防和延缓糖尿病的发生提供依据.
方法
46只雄性Sprague-Dawley(SD)大鼠随机选择8只作为普通饲料组(normal control group,CON), 其余大鼠饲喂高脂饲料.4周后按标准筛选高脂诱导的肥胖大鼠24只并随机分为高脂饲料组(high fat diet group,HFD),50%(质量分数)CGA组和98%(质量分数)CGA组,每组8只,分别给予磷酸缓冲盐溶液(phosphate buffer saline,PBS),50%CGA和98%CGA灌胃8周,每周检测体质量,每4周进行一次口服糖耐量试验(oral glucose tolerance test,OGTT),实验期末检测空腹胰岛素及胰岛素释放,计算稳态模型胰岛素抵抗指数(homeostasis model assessment insulin resistance,HOMA-IR)和内脏脂肪百分比,苏木精和伊红(hematoxylin and eosin,HE)染色检测胰腺组织病理变化.
结果
CGA干预前,与CON组相比,HFD组OGTT第120分时(OGTT-120min)血糖值(P<0.05)和葡萄糖曲线下面积(area under curve-glucose,AUC-G)(P<0.05)均显著升高;干预4周后葡萄糖峰值时间延迟(P<0.05);干预8周 HOMA-IR指数显著升高且OGTT-0min,OGTT-30min,OGTT-60min,OGTT-120min胰岛素水平和胰岛素曲线下面积(area under curve-insulin,AUC-I)显著升高(P<0.05), 胰腺胰岛显著增生(P<0.05).与HFD组相比,干预4周末,50%CGA和98%CGA组大鼠糖耐量及其葡萄糖峰值时间均无显著变化;干预8周后,50%CGA组大鼠OGTT-60min,OGTT-120min血糖值,HOMA-IR指数,OGTT-0min,OGTT-30min,OGTT-120min血清胰岛素水平显著降低(P<0.05);98%CGA组大鼠OGTT-60min,OGTT-120min血糖值,HOMA-IR指数,OGTT-0min,OGTT-120min血清胰岛素水平显著降低(P<0.05);50%和98%CGA组大鼠的葡萄糖峰值时间均显著前移(P<0.05), 胰岛异常增生改善(P<0.05).
结论
OGTT葡萄糖峰值时间延迟是DIO大鼠糖耐量异常表现之一,50%和98%CGA均可改善DIO大鼠的糖耐量和葡萄糖峰值时间延迟.
Keywords: 绿原酸, 肥胖, 糖耐量异常, OGTT葡萄糖峰值时间
Abstract
Objective
To observe the effect of chlorogenic acid (chlorogenic acid,CGA) on the glucose tolerance and its curve characteristics in high fat diet-induced obesity (diet-induced-obesity,DIO) rats, so as to provide scientific grounds for the development and utilization of CGA in early prevention and reversal of prediabetes.
Methods
Eight of forty-six male Sprague-Dawley rats were randomly selected as the normal diet group (CON group), and the rest were fed with high-fat diet. After 4 weeks, 24 high-fat-induced obese rats were screened according to the criteria and then randomly divided into high fat diet group (HFD group), 50% CGA group and 98% CGA group. The CGA groups received intragastric administrations of 50% CGA and 98% CGA orally via a gavage needle once a day for 8 weeks, respectively, while the CON and HFD groups received a carrier solution (phosphate buffer saline, PBS). Their body weights were measured weekly and oral glucose tolerance test (OGTT) was performed every 4 weeks. Fasting insulin and insulin release were measured at the end of the study. Meanwhile, HOMA-IR and visceral fat percentage were calculated. Histopathological examination by hematoxylin and eosin staining method were evaluated in the pancreatic tissues.
Results
Before the intervention of chlorogenic acid, blood glucose levels 120 min after glucose loading (P<0.05) and AUC-G (P<0.05) were increased in the HFD group when compared with the CON group, and the time to glucose peak was delayed after 4 weeks of chlorogenic acid intervention (P<0.05). After 8 weeks of intervention, the HOMA-IR index, the insulin levels at 0 min, 30 min, 60 min, and 120 min after glucose loading and AUC-I increased (P<0.05), and the histopathological examination showed obvious hyperplasia of pancreatic islets (P<0.05). Compared with the HFD group, there was no significant change in glucose tolerance and glucose peak time in 50%CGA and 98%CGA groups at the end of 4 weeks of intervention. How-ever, after 8 weeks of intervention, OGTT-60min,OGTT-120min blood glucose (P<0.05) were lower, HOMA-IR index and OGTT-0min, OGTT-120min serum insulin level decreased (P<0.05), the time to glucose peak shifted to an earlier timepoint (P<0.05), abnormal islet hyperplasia attenuated (P<0.05) in 50% CGA and 98% CGA groups. Also, the OGTT-30min serum insulin level was decreased (P<0.05) in 50% CGA group.
Conclusion
Delay in time to glucose peak during the OGTT was one of the manifestations of impaired glucose tolerance in DIO rats, and 50% and 98% CGA could improve the glucose tolerance and delay in glucose peak time.
Keywords: Chlorogenic acid, Obesity, Impaired glucose tolerance, Oral glucose tolerance test glucose peak time
目前,糖尿病已成为世界好发性疾病,中国成年人糖尿病患病率为10.9%,糖尿病前期患病率为35.7%[1],如不干预,进一步发展为糖尿病的风险高达 89.9%,并增加心血管患病率与全因死亡率[2].糖尿病前期包括空腹血糖受损(impaired fasting glucose,IFG)和糖耐量异常(impaired glucose tolerance,IGT).IGT比IFG能更灵敏地反映糖尿病前期糖代谢紊乱状况,目前临床通过检测2 h糖耐量筛查IGT,约40%的2型糖尿病(type 2 diabetes mellitus,T2DM)患者在基线时2 h糖耐量正常[3].流行病学研究表明,与空腹血糖和餐后两小时血糖相比,口服糖耐量试验(oral glucose tolerance test,OGTT)曲线特征可能会更好地预测未来发生糖尿病的风险.OGTT曲线的葡萄糖峰值时间和峰值大小[4],曲线形状[5],OGTT第120分时(OGTT-120min)血糖与空腹血糖之间的关系[6]和胰岛素浓度模式[7]包含了多种代谢相关信息,这些特征与糖耐量,胰岛素敏感性,胰腺β细胞功能和T2DM的发病风险相关,OGTT曲线的葡萄糖峰值时间的稳定性最好[8].在健康人群和T2DM患者中,葡萄糖峰值时间延迟(>OGTT-30min)提示胰岛素敏感性[4]和分泌降低[9],是IGT和β细胞功能下降的独立预测指标[10,11,12].IGT是T2DM发生和发展过程中的可逆阶段,早期识别和积极的生活方式干预可以成功地延缓或预防T2DM的进展[13].因此,寻找可以有效防治IGT的方法对糖尿病防治具有重要的意义.
绿原酸(chlorogenic acid,CGA)是一种多酚类化合物,由肉桂酸和奎尼酸形成的酯,最常见的形式是 5-咖啡酰奎宁酸(5-CQA), 广泛存在于植物和食物中,特别是金银花,杜仲,咖啡中富含CGA.研究显示,CGA(生咖啡豆提取物)可以降低肥胖IGT患者的体质量,空腹血糖和胰岛素分泌,增加胰岛素敏感性[14].CGA还可改善肥胖C57BL/6小鼠高胰岛素血症和胰岛素抵抗指数[15],降低db/db小鼠糖尿病晚期口服糖耐量15 min时的葡萄糖峰值[16].含CGA的咖啡提取物对大鼠糖耐量曲线下面积也有一定的改善作用[17].本研究旨在采用金银花来源的不同纯度的CGA,通过高脂饮食诱导建立肥胖大鼠(diet-induced-obesity,DIO)模型,探讨CGA对DIO大鼠糖耐量及其曲线特征变化的影响,为开发利用CGA早期预防或延缓糖尿病发生提供依据.
1. 材料与方法
1.1. DIO大鼠模型的建立
46只SPF级5周龄雄性Sprague-Dawley (SD)大鼠,体质量140~160 g(购自北京维通利华有限公司,实验动物生产许可证号:SCXK(京)2016-0010,使用许可证号:SYXK(京)2016-0041).饲养在SPF级环境中,恒温恒湿[温度(25±2) ℃,湿度55%±10%], 12 h光照-黑暗循环,自由采食饮水.适应性喂养1周后, 按体质量区组化随机分组法分为普通饲料组(CON组,n=8)和高脂饲料组(n=38), 2只/笼.CON组给予能量密度为3.49 kcal/g(供能比:脂肪13%,蛋白质27%,碳水化合物60%)的普通饲料(购自北京科澳协力饲料有限公司);高脂饲料组给予能量密度为 4.73 kcal/g(供能比:脂肪45%,蛋白质20%,碳水化合物35%)的高脂饲料(购自Research Diets,D12541).高脂组大鼠自由采食,CON组根据高脂组大鼠进食量高值定量给予普通饲料.喂养4周后,高脂组大鼠依据体质量高于CON组体质量均值[体质量(397.2±57.2) g]10%的标准[18]筛选出DIO大鼠[体质量(465.3±37.3) g]24只.
本研究开始前已经北京大学生物医学伦理委员会动物伦理分会审查批准(LA2017002).
1.2. 实验分组与处理
将24只DIO大鼠随机分为高脂饲料组(HFD组,n=8),50%(质量分数)绿原酸组(50%CGA组,n=8)和98%(质量分数)绿原酸组(98%CGA组,n=8), 持续高脂饲料喂养;CON组持续普通饲料喂养.CGA组分别灌胃给予50%和98%CGA的溶液(金银花提取物,购自山东禾本堂生物科技有限公司), 剂量80 mg/kg,用0.1 mol/L的磷酸缓冲盐溶液(phosphate buffer saline,PBS)配制为浓度30 g/L,现配现用,1次/d,共8周.CON组和HFD组均给予等量的PBS(pH=7.4).
1.3. 观察指标与方法
1.3.1 体质量和体脂肪 实验期间每周称体质量和进食量.CGA干预8周末,大鼠禁食过夜,称质量后经2%(质量分数)戊巴比妥纳(0.3 mL每100 g)腹腔注射麻醉,测体长(鼻尖至肛门的距离),计算Lee's指数[Lee's指数= ].大鼠处死后剥离肾周及附睾脂肪组织,称质量,计算内脏脂肪百分比[(双侧肾周脂肪质量+附睾脂肪质量)/体质量×100%].
1.3.2 糖耐量及稳态模型胰岛素抵抗指数 在CGA干预前,干预4周末,干预8周末进行OGTT.大鼠禁食过夜,灌胃给予50%葡萄糖溶液(2 g/kg), 剪尾采血,血糖仪(ACCU-CHEK Advantage,Roche,DE)测定OGTT-0min,OGTT-15min,OGTT-30min,OGTT-60min和OGTT-120min的血糖,根据梯形公式计算葡萄糖曲线下面积(area under curve-glucose,AUC-G)[19];同时对大鼠进行眼内眦取血,ELISA法(Millipore,EZRMI-13K)检测OGTT-0min,OGTT-30min,OGTT-60min及OGTT-120min血清胰岛素,并计算胰岛素曲线下面积(area under curve-insulin,AUC-I)和稳态模型胰岛素抵抗指数(homeostasis model assessment insulin resistance,HOMA-IR), HOMA-IR=FBG(mmol/L)×FINS(μU/L)/22.5(FBG:fasting blood glucose,空腹血糖;FINS:fasting insulin,空腹胰岛素).
1.3.3 OGTT葡萄糖曲线的形状特征 葡萄糖峰值时间是OGTT葡萄糖曲线特征之一,与不同代谢风险和T2DM的未来风险有关,其定义为OGTT曲线上出现的第一个波峰的时间点(OGTT-15min,OGTT-30min,OGTT-60min,OGTT-90min或OGTT-120min), 其中葡萄糖波动阈值设为0.25 mmol/L(4.5 mg/dL), 避免由于实验不精确而导致的错误分类[20].糖耐量正常人群中,多数在OGTT-30min内血糖达到最大值[9],且研究显示,正常大鼠的葡萄糖峰值时间一般在OGTT-30min之前[21],因此本研究把血糖峰值时间分≤ OGTT-30min和> OGTT-30min两类.
1.3.4 胰腺病理检查 CGA干预8周末,2%(质量分数)戊巴比妥麻醉处死大鼠后取胰腺组织用甲醛固定,制备胰腺石蜡切片,HE染色,在光学显微镜下计数每个样本10个10倍视野内的胰岛数目,并拍照.
1.4. 统计学分析
采用SPSS25.0软件,正态分布的计量资料以x±s表示,两组(CON组与HFD组)间比较采用独立样本t检验,多组(HFD组,50%CGA组和98%CGA组)间比较采用单因素方差分析;非正态分布的计量资料以中位数(最小值,最大值)表示,两组(CON组与HFD组)间比较采用独立样本Mann-Whitney U 秩和检验,多组(HFD组,50%CGA组和98%CGA组)间比较采用Kruskal-Wallis检验.分类计数资料采用卡方检验(Fisher精确检验),P<0.05 认为差异具有统计学意义.
2. 结果
2.1. CGA对DIO大鼠体质量,体脂肪的影响
CGA干预8周末,HFD组大鼠体质量(t=-7.222,P<0.001),Lee's指数(t=-7.433,P<0.001)和内脏脂肪百分比(t=-10.154,P<0.001)均显著高于CON组(表1).与HFD组相比,50%CGA组和98%CGA组大鼠的体质量(F=0.388,P=1.000,P=1.000),Lee's指数(F=0.501,P=1.000,P=1.000)和内脏脂肪百分比(F=1.885,P=1.000,P=0.298)均降低,但差异无统计学意义(表1).两个CGA组间大鼠体质量,内脏脂肪百分比和Lee's指数差异均无统计学意义.
1.
CGA对DIO大鼠体质量,Lee's指数和内脏脂肪百分比的影响(x±s)
Effects of CGA on body weight Lee's index and visceral fat percentage in DIO rats(x±s)
| Items | n | Body weight/g | Lee's index | Visceral fat percentage/% |
| CON, normal control group; HFD, high fat diet group; CGA, chlorogenic acid. *P < 0.05, compared with the CON group. | ||||
| CON | 8 | 498.9±29.3 | 26.9±0.5 | 3.0±0.4 |
| HFD | 8 | 674.4±62.2* | 29.1±0.7* | 9.0±1.6* |
| 50%CGA | 8 | 649.1±50.3 | 28.8±0.6 | 8.9±2.6 |
| 98%CGA | 8 | 655.0±66.3 | 29.1±0.8 | 7.2±2.0 |
2.2. CGA对DIO大鼠糖耐量的影响(图1)
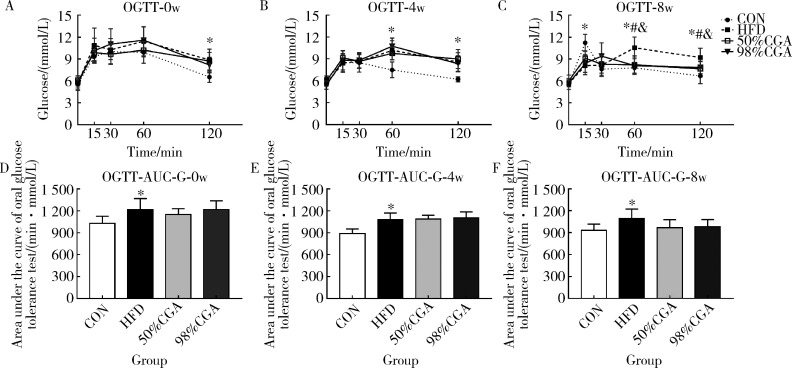
与CON组相比,CGA干预前,HFD组大鼠OGTT-120min血糖(t=-4.046,P=0.001)和AUC-G(t=-2.979,P=0.010)升高(图1A,1D),干预4周末OGTT-60min(t=-4.426,P=0.001),OGTT-120min血糖(t=-5.138,P<0.001)和AUC-G(t=-4.969,P<0.001)均升高(图1B,1E).干预8周末OGTT-60min(t=-4.606,P<0.001),OGTT-120min血糖(t=-4.412,P=0.001)和AUC-G(t=-3.090,P=0.008)均升高(表2,图1C,1F),OGTT-15min血糖(t=5.201,P<0.001)显著降低,OGTT-0min血糖无明显变化.与HFD组相比,CGA干预4周末,50%CGA和98%CGA组大鼠OGTT-60min,OGTT-120min血糖和AUC-G均无明显变化(图1B,1E);干预8周末,50%CGA和98%CGA组的OGTT-60min(F=8.526,P=0.007,P=0.004)和OGTT-120min(F=5.379,P=0.020,P=0.046)血糖值降低,AUC-G均无显著变化(F=3.237,P=0.094,P=0.149,表2,图1C,1F);此外,50%CGA和98% CGA组之间OGTT各时间点血糖和AUC-G差异均无统计学意义(P>0.05,图1).
1.
CGA对DIO大鼠糖耐量的影响
Effect of CGA on glucose tolerance in DIO rats
n=8. CON, normal control group; HFD, high fat diet group; CGA, chlorogenic acid; AUC-G, area under curve-glucose; OGTT, oral glucose tolerance test. A to F, changes in the AUC-G and the OGTT curve of DIO rats before CGA intervention and after CGA intervention at 4 and 8 weeks. * P<0.05,compared with the CON group;# P<0.05,50%CGA group compared with the HFD group;& P< 0.05,98%CGA group compared with the HFD group.
2.3. CGA对DIO大鼠OGTT葡萄糖峰值时间的影响
CGA干预4周末,与CON组(≤30 min,8只;>30 min,0只)相比,HFD组大鼠OGTT葡萄糖峰值时间(≤30 min,3只;>30 min,5只)显著延迟(Fisher 精确检验,P=0.026,图1B).与HFD组相比,干预4周末, 50%CGA和98%CGA组大鼠葡萄糖峰值时间(两组均为:≤30 min,3只;>30 min,5只)均无显著变化(Fisher 精确检验,P=1.000,P=1.000,图1B).CGA干预8周末,与CON组(≤30 min,8只;>30 min,0只)相比,HFD组大鼠OGTT葡萄糖峰值时间(≤30 min,2只;>30 min,6只)显著延迟(Fisher 精确检验,P=0.007,图1C), 50%CGA组大鼠葡萄糖峰值时间(≤30 min,8只;>30 min,0只)显著前移(Fisher 精确检验,P=0.007,图1C);98%CGA组大鼠葡萄糖峰值时间(≤30 min,7只;>30 min,1只)显著前移(Fisher 精确检验,P=0.041,图1C).两个CGA组间大鼠葡萄糖峰值时间差异无统计学意义(Fisher 精确检验,P=1.000,图1C).
2.4. CGA对DIO大鼠的血清胰岛素水平和HOMA-IR的影响
CGA干预8周末,与CON组相比,HFD组DIO大鼠OGTT-0min,OGTT-30min,OGTT-60min和OGTT-120min的血清胰岛素均显著升高(t=-3.903,P=0.003;t=-3.369,P=0.007;t=-2.799,P<0.019;t=-6.077,P<0.000,图2A), 同时AUC-I升高(t=-4.967,P=0.001,图2B), HOMA-IR也升高[8.15(1.82,19.39) vs. 24.29(16.95,34.36), z=-2.562,P=0.010].与HFD组相比,50%CGA组OGTT-0min,OGTT-30min,OGTT-120min的血清胰岛素水平(F=9.928,P=0.015;F=5.159,P=0.044;F=5.050,P=0.041)显著降低(图2A);HOMA-IR也显著降低[24.29(16.95,34.36) vs. 11.63(5.67,14.66),P=0.031];AUC-I降低,但差异无统计学意义(F=2.923,P=0.198,图2B);98%CGA组大鼠OGTT-0min(F=9.928,P=0.004),OGTT-120min(F=5.050,P=0.047)的血清胰岛素水平显著降低(图2A),OGTT-30min(F=5.159,P=0.058)的血清胰岛素水平和AUC-I(F=2.923,P=0.163,图2B)降低,但差异无统计学意义;HOMA-IR显著降低[24.29(16.95,34.36) vs. 5.66(3.89,24.41),P=0.004].
2.
CGA对DIO大鼠OGTT胰岛素分泌的影响
Effect of CGA on insulin secretion of OGTT in DIO rats
n=6. A,insulin release test of DIO rats;B,area under curve-insulin,AUC-I. * P<0.05,CON group compared with the HFD group;# P < 0.05,50%CGA group compared with HFD group;& P < 0.05, 98%CGA group compared with HFD group.
2.5. CGA对DIO大鼠胰腺胰岛的影响
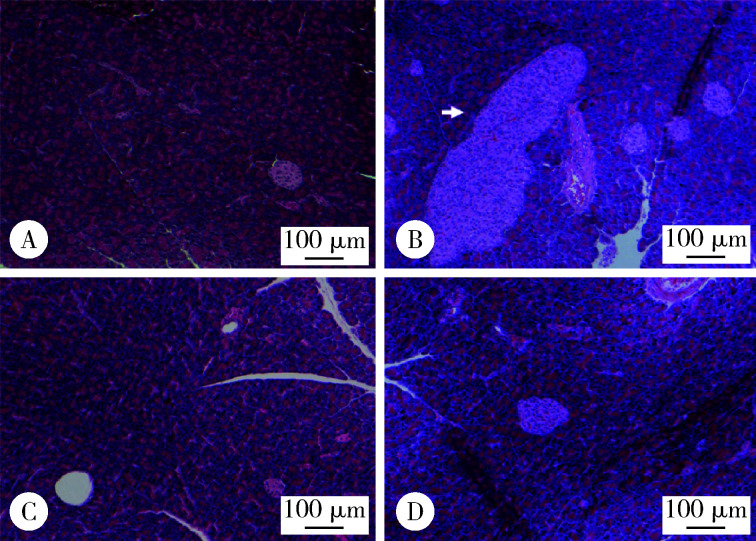
胰腺病理结果显示,CGA干预8周末,与CON组[14(2,18)]相比,HFD组胰腺可见胰岛数目增多[18(14,26), z =-2.857,P=0.004],大小不一,形态不规整(图3A和3B);与HFD组大鼠相比,50%CGA[15(8,22),P=0.032]和98%CGA[11(4,22),P=0.004]胰岛数目异常增多减轻(图3C和3D),两个CGA组间胰岛数目差异无统计学意义.
3.
DIO大鼠胰腺病理学变化(HE ×100)
Pathological changes of pancreas in DIO rats(HE ×100)
A,CON group;B,HFD group;C,50%CGA group;D,98%CGA group. Scale bars = 100 μm. White arrow: abnormally enlarged islet.
3. 讨论
本研究高脂饲料喂养4周后,DIO大鼠OGTT-120min血糖和AUC-G升高,12周后糖耐量异常加重,OGTT葡萄糖峰值时间延迟(>OGTT-30min),胰岛异常增生,血清胰岛素水平升高,出现胰岛素抵抗,分别给予50%CGA和98%CGA干预8周,可以降低DIO大鼠OGTT-60min,OGTT-120min的血糖值,改善葡萄糖峰值时间.
本研究3组DIO大鼠的进食量差异无统计学意义(数据未显示), 说明CGA可能不会抑制DIO大鼠的食物摄入.给予CGA 8周后,DIO大鼠的体质量和内脏脂肪百分比有所下降,50%CGA组内脏脂肪百分比下降1.1%,98%CGA组下降20.2%,表明98%CGA对内脏脂肪有一定的改善作用.
CGA干预前,HFD组DIO大鼠OGTT-120min血糖和AUC-G升高,表明SD大鼠摄入脂肪供能比为45%的高脂饲料4~5周后可表现出糖耐量异常.继续高脂饲料喂养8周,HFD组大鼠的胰岛代偿性增生,OGTT-0min,OGTT-30min,OGTT-60min和OGTT-120min血清胰岛素均升高,而OGTT-120min,OGTT-60min血糖和AUC-G仍处于升高水平,表明DIO大鼠出现胰岛素抵抗.此外,与CON组相比,HFD组大鼠空腹血糖未出现明显变化,表明相较于IGT,用FPG筛查糖尿病的敏感性较低[22].给予50%和98%CGA干预8周后,DIO大鼠的OGTT-60min,OGTT-120min血糖和HOMA-IR降低,胰岛增生减弱,提示CGA可以改善DIO大鼠糖耐量可能与CGA抑制胰岛增生,改善高胰岛素血症和胰岛素抵抗有关.98%CGA主要是单一成分CGA,而50%CGA只有一半CGA,50%CGA改善DIO大鼠糖耐量除了CGA作用,可能也与其他生物活性成分有关,这尚待进一步研究.
葡萄糖峰值时间>OGTT-30min时间点是糖尿病前期和β细胞功能降低的独立指标.本研究发现,CGA可以改善DIO大鼠OGTT葡萄糖峰值时间.在高脂饲料喂养8周末, HFD组DIO大鼠出现葡萄糖峰值时间延迟(>OGTT-30min), 并持续到实验终止,伴随AUC-G,血清胰岛素和HOMA-IR的升高,表明葡萄糖峰值时间>OGTT-30min时间点与OGTT期间较差的代谢特征相关.50%和98%CGA干预4周对葡萄糖峰值未见影响,干预8周后可以显著改善葡萄糖峰值时间的延迟,与OGTT期间的其他代谢参数得到改善的结果一致,提示两种纯度的CGA均可改善高脂诱导的糖耐量异常曲线特征,保护β细胞功能.有关CGA改善葡萄糖峰值时间延迟的机制有待进一步研究.
综上所述,本研究发现两种不同浓度的CGA(金银花提取物)可以改善高脂饲料诱导的SD大鼠糖耐量异常和OGTT曲线葡萄糖峰值时间延迟,对开发利用金银花提取物早期预防和延缓糖尿病的发生可能具有重要意义.
(志谢:感谢北京大学医学部实验动物科学部和北京大学第三医院科研楼的各位老师为本研究提供的帮助!)
Funding Statement
国家重点研发计划(2016YFD0400603)
Supported by National Key Research and Development Program of China(2016 YFD0400603)
References
- 1.Wang L, Gao P, Zhang M, et al. Prevalence and ethnic pattern of diabetes and prediabetes in China in 2013. JAMA. 2017;317(24):2515–2523. doi: 10.1001/jama.2017.7596. [DOI] [PMC free article] [PubMed] [Google Scholar]
- 2.Li G, Zhang P, Wang J, et al. Cardiovascular mortality, all-cause mortality, and diabetes incidence after lifestyle intervention for people with impaired glucose tolerance in the da qing diabetes prevention study: a 23-year follow-up study. Lancet Diabetes Endocrinol. 2014;2(6):474–480. doi: 10.1016/S2213-8587(14)70057-9. [DOI] [PubMed] [Google Scholar]
- 3.Unwin N, Shaw J, Zimmet P, et al. Impaired glucose tolerance and impaired fasting glycaemia: the current status on definition and intervention. Diabet Med. 2002;19(9):708–723. doi: 10.1046/j.1464-5491.2002.00835.x. [DOI] [PubMed] [Google Scholar]
- 4.Hulman A, Witte DR, Vistisen D, et al. Pathophysiological characteristics underlying different glucose response curves: a latent class trajectory analysis from the prospective EGIR-RISC study. Diabetes Care. 2018;41(8):1740–1748. doi: 10.2337/dc18-0279. [DOI] [PubMed] [Google Scholar]
- 5.Tura A, Morbiducci U, Sbrignadello S, et al. Shape of glucose, insulin, C-peptide curves during a 3-h oral glucose tolerance test: any relationship with the degree of glucose tolerance. Am J Physiol Regul Integr Comp Physiol. 2011;300(4):R941–R948. doi: 10.1152/ajpregu.00650.2010. [DOI] [PubMed] [Google Scholar]
- 6.Abdul-Ghani MA, Williams K, Defronzo R, et al. Risk of progression to type 2 diabetes based on relationship between postload plasma glucose and fasting plasma glucose. Diabetes Care. 2006;29(7):1613–1618. doi: 10.2337/dc05-1711. [DOI] [PubMed] [Google Scholar]
- 7.Hayashi T, Boyko EJ, Sato KK, et al. Patterns of insulin concentration during the OGTT predict the risk of type 2 diabetes in Japanese Americans. Diabetes Care. 2013;36(5):1229–1235. doi: 10.2337/dc12-0246. [DOI] [PMC free article] [PubMed] [Google Scholar]
- 8.Kramer CK, Vuksan V, Choi H, et al. Emerging parameters of the insulin and glucose response on the oral glucose tolerance test: reproducibility and implications for glucose homeostasis in individuals with and without diabetes. Diabetes Res Clin Pract. 2014;105(1):88–95. doi: 10.1016/j.diabres.2014.04.023. [DOI] [PubMed] [Google Scholar]
- 9.Wang X, Zhao X, Zhou R, et al. Delay in glucose peak time during the oral glucose tolerance test as an indicator of insulin resistance and insulin secretion in type 2 diabetes patients. J Diabetes Investig. 2018;9(6):1288–1295. doi: 10.1111/jdi.12834. [DOI] [PMC free article] [PubMed] [Google Scholar]
- 10.Kramer CK, Ye C, Hanley AJ, et al. Delayed timing of post-challenge peak blood glucose predicts declining beta cell function and worsening glucose tolerance over time: insight from the first year postpartum. Diabetologia. 2015;58(6):1354–1362. doi: 10.1007/s00125-015-3551-6. [DOI] [PubMed] [Google Scholar]
- 11.Kanauchi M, Kimura K, Kanauchi K, et al. Beta-cell function and insulin sensitivity contribute to the shape of plasma glucose curve during an oral glucose tolerance test in non-diabetic individuals. Int J Clin Pract. 2005;59(4):427–432. doi: 10.1111/j.1368-5031.2005.00422.x. [DOI] [PubMed] [Google Scholar]
- 12.Chung ST, Ha J, Onuzuruike AU, et al. Time to glucose peak during an oral glucose tolerance test identifies prediabetes risk. Clin Endocrinol (Oxf) 2017;87(5):484–491. doi: 10.1111/cen.13416. [DOI] [PMC free article] [PubMed] [Google Scholar]
- 13.Li G, Zhang P, Wang J, et al. The long-term effect of lifestyle interventions to prevent diabetes in the China da qing diabetes prevention study: a 20-year follow-up study. Lancet. 2008;371(9626):1783–1789. doi: 10.1016/S0140-6736(08)60766-7. [DOI] [PubMed] [Google Scholar]
- 14.Zuniga LY. Aceves-de LMM, Gonzalez-Ortiz M, et al. Effect of chlorogenic acid administration on glycemic control, insulin secretion, and insulin sensitivity in patients with impaired glucose tolerance. J Med Food. 2018;21(5):469–473. doi: 10.1089/jmf.2017.0110. [DOI] [PubMed] [Google Scholar]
- 15.Ma Y, Gao M, Liu D. Chlorogenic acid improves high fat diet-induced hepatic steatosis and insulin resistance in mice. Pharm Res. 2015;32(4):1200–1209. doi: 10.1007/s11095-014-1526-9. [DOI] [PMC free article] [PubMed] [Google Scholar]
- 16.Jin S, Chang C, Zhang L, et al. Chlorogenic acid improves late diabetes through adiponectin receptor signaling pathways in db/db mice. PLoS One. 2015;10(4):e120842. doi: 10.1371/journal.pone.0120842. [DOI] [PMC free article] [PubMed] [Google Scholar]
- 17.Panchal SK, Poudyal H, Waanders J, et al. Coffee extract attenuates changes in cardiovascular and hepatic structure and function without decreasing obesity in high-carbohydrate, high-fat diet-fed male rats. J Nutr. 2012;142(4):690–697. doi: 10.3945/jn.111.153577. [DOI] [PubMed] [Google Scholar]
- 18.Hariri N, Thibault L. High-fat diet-induced obesity in animal models. Nutr Res Rev. 2010;23(2):270–299. doi: 10.1017/S0954422410000168. [DOI] [PubMed] [Google Scholar]
- 19.Le Floch JP, Escuyer P, Baudin E, et al. Blood glucose area under the curve. Methodological aspects. Diabetes Care. 1990;13(2):172–175. doi: 10.2337/diacare.13.2.172. [DOI] [PubMed] [Google Scholar]
- 20.Tschritter O, Fritsche A, Shirkavand F, et al. Assessing the shape of the glucose curve during an oral glucose tolerance test. Diabetes Care. 2003;26(4):1026–1033. doi: 10.2337/diacare.26.4.1026. [DOI] [PubMed] [Google Scholar]
- 21.Wong SK, Chin KY, Suhaimi FH, et al. The effects of a modified high-carbohydrate high-fat diet on metabolic syndrome parameters in male rats. Exp Clin Endocrinol Diabetes. 2018;126(4):205–212. doi: 10.1055/s-0043-119352. [DOI] [PubMed] [Google Scholar]
- 22.Joung KH, Ju SH, Kim JM, et al. Clinical implications of using post-challenge plasma glucose levels for early diagnosis of type 2 diabetes mellitus in older individuals. Diabetes Metab J. 2018;42(2):147–154. doi: 10.4093/dmj.2018.42.2.147. [DOI] [PMC free article] [PubMed] [Google Scholar]


