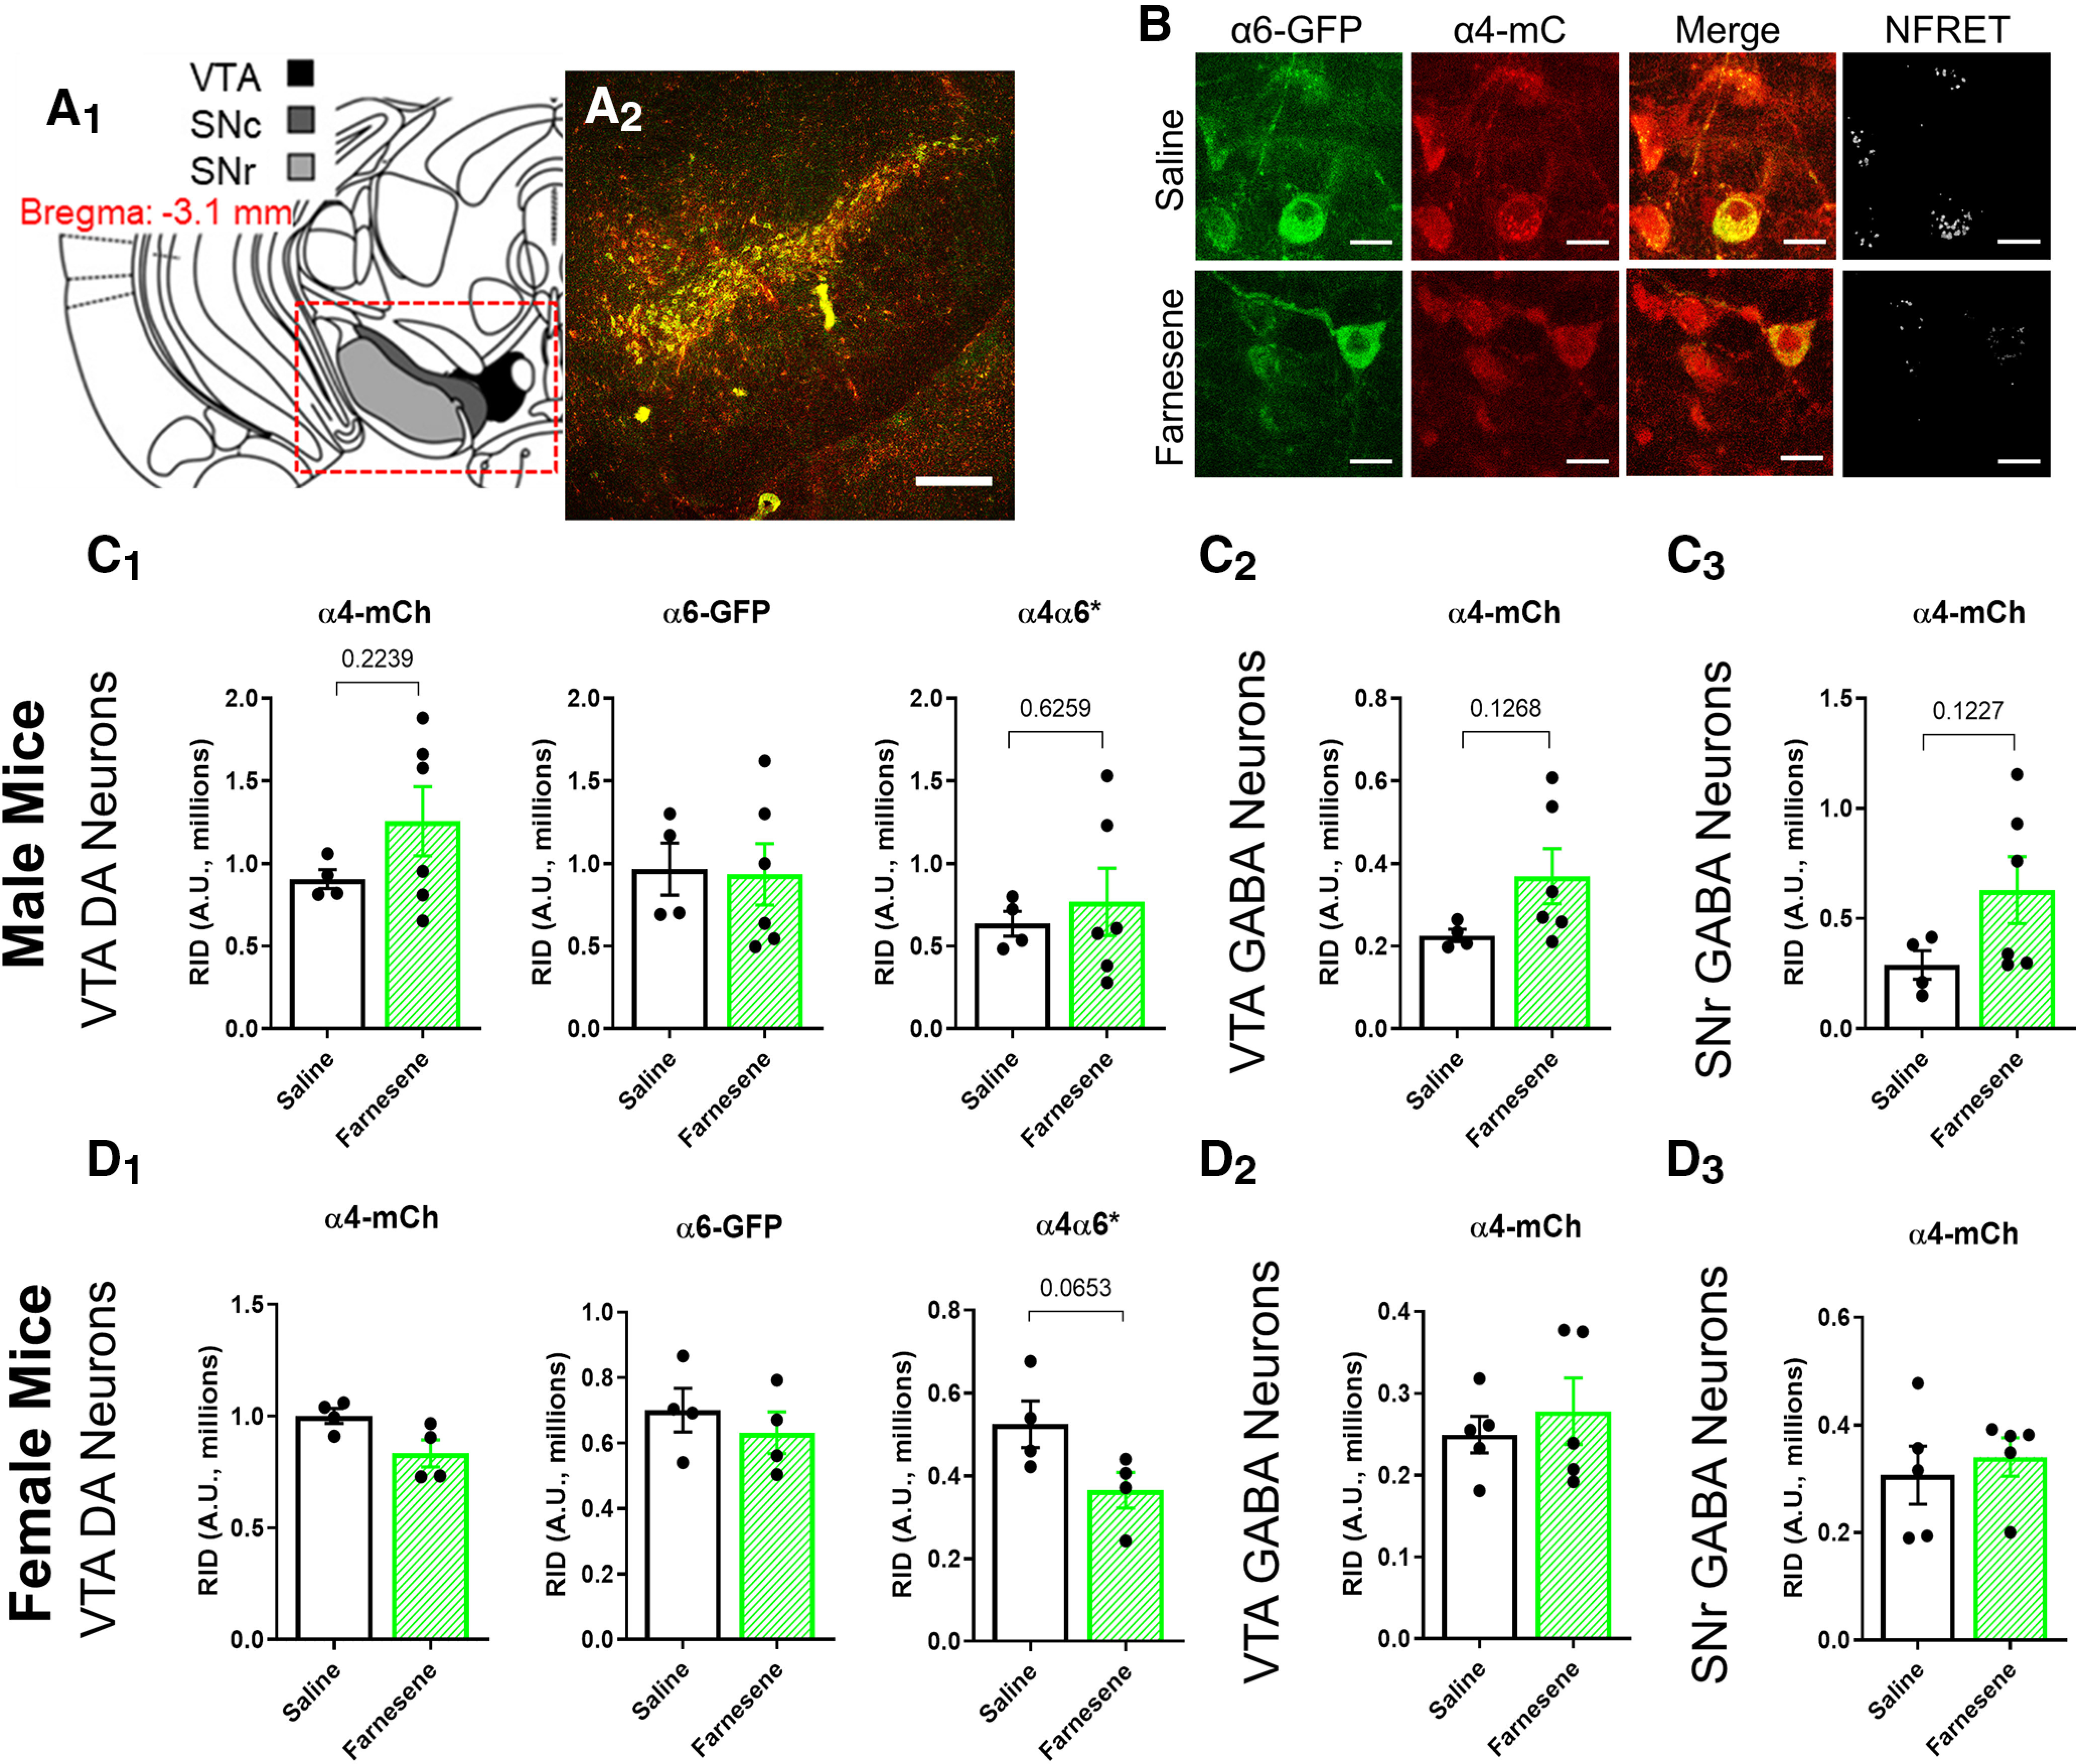
Figure 3.

Farnesene treatment has no effect on nAChR number in the midbrain. A1, Schematic of target mouse brain region (bregma −3.1 mm). A2, Sample 10× image of a mouse coronal brain section at approximately bregma −3.1 mm. Scale bar, 250 μm. B, Sample images of saline and farnesene treated VTA dopamine neurons. Scale bar, 15 μm. C, D, RID of α4*, α6*, and α4α6* nAChRs of VTA dopamine neurons (C1, D1), α4* nAChRs of VTA GABA neurons (C2, D2), and α4* nAChRs of SNr GABA neurons (C3, D3) in saline-treated and farnesene-treated (0.1 mg/kg) male (C) and female (D) mice. All data are mean ± SEM. Unpaired t test. Dots indicate the RID values from individual mice.
