Abstract
Carbon dots (CDs) were synthesized by a microwave-mediated method and separated by size exclusion chromatography into three different size fractions. There was no correlation of the size with photoluminescence (PL) emission wavelength, which shows that the PL mechanism is not quantum-size dependent. UV/vis absorption and diffuse reflectance spectroscopies showed that the light absorption properties as well as the band gap of the CDs changed with the size of the particle. The combination of FTIR and XPS measurements revealed the composition on the surface of each fraction. The three CDs fractions were separately used in the photocatalytic degradation of organic dyes under simulated sunlight irradiation. The catalytic activity of the as-prepared CDs was found to increase as the size of the particles decreased. Complete degradation of both rhodamine B (RhB) and methylene blue (MB) was achieved in 150 min by the 2-nm CDs. The scavenger studies showed that the holes and superoxide radicals are the main species involved in the photocatalytic degradation of the dye by the 2-nm CDs. These CDs displayed high stability in the degradation of organic dyes for multiple cycles. The 2-nm CDs displayed promising photocatalytic degradation of p-nitrophenol (PNP) . These results demonstrate for the first time the application of bare carbon dots in the degradation of environmental contaminants.
Keywords: Photocatalysis, Carbon dots, Organic compound degradation, ROS, Photoluminescence
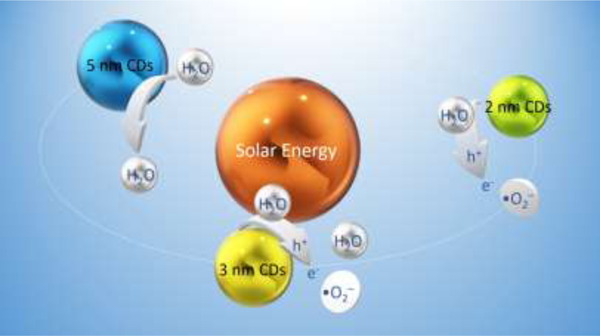
Graphical Abstract
1. Introduction
Environmental protection and energy crisis are two critical issues brought by the rapid growth of population and increasing daily demand. To avoid the implications of these issues, while considering the sustainability in the development, new resources are being widely explored such as solar energy. For this, photoactive materials are drawing much attention due to the unlimited sunlight energy and potential application as a catalyst for hydrogen generation via water splitting and for pollutants degradation [1, 2]. Since hydrogen is considered as a renewable and sustainable energy resource, photocatalysis has become one promising solution to solve both issues.
Since the discovery of TiO2 as the photocatalyst by Honda and Fujishima in 1972, in the past 40 years [3], much efforts have been devoted to developing photocatalysts that act efficiently under visible light irradiation. To date, there are varieties of photocatalyst including metal oxides such as TiO2 [4], Fe2O3 [5], ZnO [6], ZnS [7], BiVO4 [8], metal chalcogenides, for example, CdS and MoS2 [9], and nitrides, especially graphitic carbon nitrides [10]. However, the majority of photocatalysts contain metals, which poses a risk of secondary pollution to water bodies after the degradation of the contaminants. In addition, sulfides are not stable and photocorrosion is easy to occur [11]. Even though oxides are stable in aqueous solution and low cost, most of them usually possess large band gap [12]. Therefore, the development of nontoxic, stable and efficient photocatalysts is desirable for applications such as the photocatalytic water splitting and the photocatalytic degradation of pollutant.
Carbon dots (CDs), as a new family member of carbon-based nanomaterials, have been widely synthesized with various methods, such as pyrolysis within autoclave [13], hydrothermal/solvothermal reaction with refluxing [14], fast microwave-assisted synthesis[15], laser ablation [16], and ultrasonication with high frequency [17]. Due to their ultra-small size, this class of nanomaterials exhibits unique properties that are distinctively different from their bulk counterpart. Because of their high photoluminescence (PL), good biocompatibility, water dispersity, low toxicity, abundant electron donors and acceptors, and controlled surface state [18], CDs are becoming promising materials in various fields including engineering [19], drug delivery [20, 21], bioimaging [22, 23], sensing [24, 25], catalysis [26], and energy conversion and storage [27–29].
In addition, carbon dots exhibit tunable fluorescent quantum yield (QY) based on the starting precursors [30], preparation methods [31], and post-treatment [16]. For instance, the highest QY value to date has reached 93.3% when CDs were prepare with citric and tris-(hydroxymethyl)aminomethane (Tris) through a microwave-mediated route [32]. Besides the success in the enhancement of QY, the mechanism of the PL of CDs is one of the most disputed topics [33]. The explanation of the mechanism resonates among two main causes, namely the size effect and surface state [34], which is inspired by traditional quantum dots even though the size effect is not often used to explain the PL mechanism of CDs. The surface state comprises of the functional groups on the surface of CDs nanoparticles as well as the energy traps, which determine the emission of CDs by the generation and transition of excitons [35]. Considering CDs are semiconductors, the excitons generate electrons and holes [36]. When CDs are excited, the electrons in the valence band transit to the conduction band. By vibrational relaxation, the electrons will move to the energy levels caused by surface states of CDs. However, the introduction of oxygen and nitrogen elements and related chemical bonds will produce impurity levels in the surface states, which leads to the narrowing of band gap between the surface states and valence band [37]. Consequently, the fluorescence emission is generated along the electrons transition from these energy levels to the valence band. Due to the single or multiple band gaps between the valence band and surface states, the emission exhibits uniform or various PL wavelengths, which explains why some CDs exhibit excitation wavelength-independent or -dependent PL [38]. This whole process is illustrated in Scheme 1.
Scheme 1.
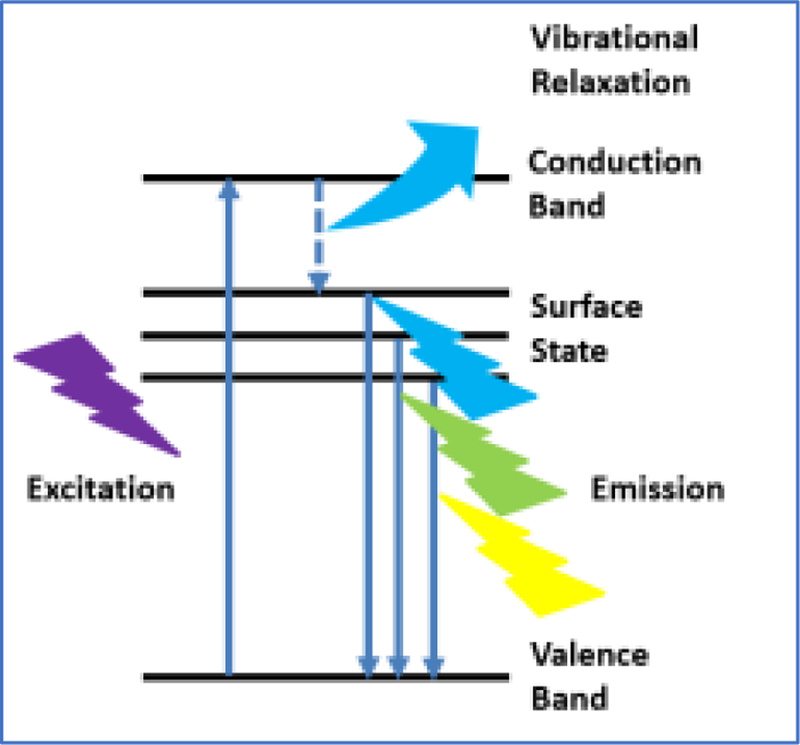
The illustration of electron transition of CDs upon excitation.
Since CDs are photoluminescent semiconductors with a specific energy band gap between the valence and the conduction bands [39], they have the potential to drive photocatalytic redox reactions. For instance, these properties make CDs a good candidate for photocatalytic water splitting into hydrogen and oxygen [40]. Furthermore, the photocatalytic redox activity of CDs was utilized in vivo to generate reactive oxygen species (ROS) to cause the death of hypoxic tumor cells [41]. However, though photocatalytic water splitting is promising for hydrogen generation and photodynamic therapy, it has been challenging to design photocatalysts with efficient solar to hydrogen conversion due to the recombination of the electron/hole pairs and the fast backward reactions [42]. In addition, most traditional photocatalysts, such as TiO2 and ZnO can only utilize UV light with band gaps greater than 3.0 eV [3]. Therefore, the development of stable photocatalyst that absorb in the visible light with narrow band gap is very much sought. Carbon-based materials such as graphitic carbon nitride (g-C3N4) has emerged as a promising photocatalyst with a band gap of 2.7 eV that is situated for visible light reactions [43]. Therefore, considering the similar polymeric structure of CDs as g-C3N4, and the abundant electron donors and acceptors on CDs, the photocatalytic properties of CDs should be investigated. Recently, CDs have been integrated in heterostructures to enhance the activity of various photocatalysts [44, 45] and they are able to play manifold roles in heterogeneous photocatalysis. For example, they are photoelectron mediator and acceptor, photosensitizer, reducing agent, and they can enhance adsorption capacity [46, 47]. Furthermore, there are many advantages that facilitate the application of CDs as photocatalyst. First, they are well-dispersed in water, which yields a homogeneous phase to efficiently absorb water on their surface [48]. Additionally, CDs are non-toxic; they will not contaminate the body of water or have adverse effect on human health. However, even though CDs have been utilized to enhance the photocatalytic activity of various metal oxide nanomaterials such as Fe2O3 [49], TiO2 [50], ZnO [51], SnS2 [52], and BiOBr [53], there are fewer studies on the photocatalytic properties of bare CDs, especially on the photocatalytic dye degradation [54]. Otherwise, the photocatalytic activity of bare CDs is usually negligible [55].
Herein, in this study, we focus on the study of the photocatalytic activity of the bare CDs as well as the influence of size on the photocatalytic performance. The CDs were synthesized via a microwave-assisted reaction of citric acid as carbon precursor and 1,2- phenylenediamine as nitrogen dopant. After purification by size exclusion chromatography, we obtained three CDs fractions with different sizes. These CDs demonstrated size dependent photocatalytic activity in the degradation of organic dyes. The mechanism of the dye degradation was analyzed using various charge-carrier scavengers from the viewpoint of generation of superoxide and hydroxide radicals. The stability test was conducted to reveal the effectiveness of CDs in the long term of dye degradation. The CDs were employed in the photocatalytic degradation of, p-nitrophenol (PNP), one of the most hazardous refractory pollutants with high stability and solubility in water [56], to demonstrate their application for various environmental contaminates.
2. Experimental
2.1. Materials
Citric acid (99.5–100%) was purchased from VWR (West Chester, PA, USA). 1,2- phenylenediamine flakes (99.5%), rhodamine B (RhB), methylene blue (MB) and IPA (isopropanol alcohol) were obtained from Sigma-Aldrich (St. Louis, MO, USA). Benzoquinone (98+%) and p-nitrophenol (PNP) (99%) were bought from Alfa Aesar (Haverhill, MA, USA). EDTA (disodium ethylenediaminetetraacetic acid) was procured from J.T. Baker Chemical Co. (Phillipsburg, NJ, USA). The distilled water used was purified using a Modulab 2020 water purification system acquired from Continental Water System Corporation (San Antonio, TX, USA). The water had a pH of 6.62 ± 0.3 at 25 ± 0.5 °C with a resistivity of 18 MΩ·cm and surface tension of 72.6 mN·m−1. The SEC was performed using GE Healthcare Sephacryl S-300 (Uppsala, Sweden) as the matrix. The Whatman® qualitative filter paper, Grade 3 (diameter: 70 mm) were bought from GE Healthcare Life Sciences. Argon gas was bought from Airgas (Miami, FL, USA). All chemicals were used without further treatment.
2.2. Methods
The UV/Vis absorption spectra of three CDs fractions were obtained by using a Cary 100 UV/Vis spectrophotometer and a 1cm optical cell. A Fluorolog (Horiba Jobin Yvon) spectrometer was used to record the fluorescence emission spectra of sample with a slit width of 5 nm used for both excitation and emission. As for the determination of fluorescence quantum yield, a Varian Cary Eclipse spectrometer was used to record the fluorescence spectra of samples and standards. Fourier-transform infrared (FTIR) spectroscopy data were obtained with a PerkinElmer FTIR (Frontier) spectrometer by using the attenuated total reflection (ATR) technique with air as background. XPS data was acquired using a Perkin-Elmer PHI 560 system with a double-pass cylindrical mirror analyzer operated using a Mg Kα anode with a hʋ = 1253.6 eV photon energy operated at 250 Watts and 13 kV. Zeta potential measurements were made by using a nano series Malvern Zetasizer. AFM images were obtained with an Agilent 5420 atomic force microscope by using the tapping mode. TEM was performed by using a JEOL 1200X TEM.
2.3. Synthesis and Purification of CDs
To prepare the long emission wavelength CDs, 0.02 g citric acid and 0.28 g 1,2- phenylenediamine were dissolved in 10 mL deionized H2O. Subsequently, the mixture was placed in a crucible and heated in a microwave oven for 7 min under 700 W until all the water was evaporated. The remaining black powder was dispersed in deionized water and the solution exhibited blue PL under UV lamp. After purification by filtration and SEC, three photoluminescent eluents were collected, which indicated three CDs fractions. The synthesis of CDs and three CDs fractions are shown in Fig. 1a and b, respectively.
Fig. 1.
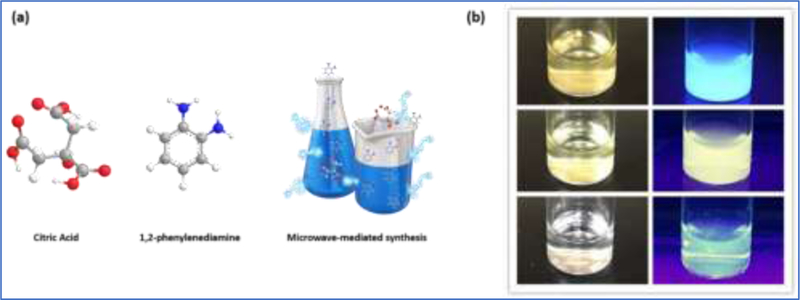
(a) The precursors and microwave-mediated synthesis of CDs. (b) The aqueous solutions of three CDs fractions with a concentration of 0.1 mg/mL (top-down: fraction 1, 2 and 3) after purification. (The left column is under regular light; the right column is under the UV light at 365 nm).
2.4. Photocatalytic evaluation of CDs
First, 3 mg of each CDs fraction was mixed with 200 µL RhB (10 mg/L) aqueous solution and 3.8 m L deionized water in a 4-mL UV/vis cuvette. After 2-min ultrasonication to completely disperse CDs fraction in deionized water, the cuvette was placed in front of a solar simulator (Oriel Instruments, Newport Corporation) with high power mercury-xenon light source (310 W) with vigorous stirring at 200 rpm. Similar procedure was implemented with MB and PNP. However, in order to keep the UV/vis absorption below 1 to have a high light transmittance, the amount of MB should be readjusted. After the pilot experiment, 3 mg of each CDs fraction was mixed with 1 mL MB (10 mg/L) aqueous solution and 3 mL deionized water. The rest of the procedure remained the same. Then the UV/vis spectroscopy was performed on the aqueous solution of dyes (RhB or MB) and CDs fractions (1, 2 or 3). The UV/vis absorption of the reaction was recorded every 10- min of irradiation interval. For PNP degradation, 3 mg of CDs fraction 3 was mixed with 1 mL (0.02 g/L) PNP aqueous solution and 3 mL deionized water. This very same procedure was repeated as needed.
3. Results and discussion
3.1. Characterization
Various techniques were applied to reveal the optical, structural, morphological, and electric properties of CDs. UV/vis absorption spectrophotometry was applied to illustrate the conjugated structures including C=C, C=N, and C=O. In Fig. S1a, we can observe peaks at 242, 272 and 324 nm for C=C, C=N, and C=O, respectively in fraction 1 [57, 58]. Additionally, there is a peak at 390 nm in the lower-energy region, which might be attributed to the absorption cross section of NO2 [59]. In Fig. S1b, we can observe peaks at 258, 280 and 323 nm for C=C, C=N, and C=O, respectively, in fraction 2. However, the peak in the lower-energy region was shifted to longer wavelength (417 nm), which could be ascribed to longer conjugated structures. In Fig. S1c shows peaks for C=C (250 nm), C=N (271 nm), C=O (341 nm) in fraction 3 and a similar peak in the lower-energy region at 417 nm.
The fluorescence emission spectra recorded the versatile PL behaviors of three CDs fractions. From the spectrum in Fig. 2a, we can observe that the emission of fraction 1 is independent of excitation wavelength. In addition, the maximum excitation and emission wavelengths of fraction 1 is 375 and 438 nm, respectively, which explains the blue PL as shown in Fig. 1b. In Fig. 2b, the emission is also excitation-independent, and the maximum excitation and emission wavelengths are 400 and 565 nm, respectively, which confirms the yellow PL of fraction 2. On the other hand, fraction 3 (Fig. 2c) displayed more than one emission peaks. For instance, when excited at 350 nm, fraction 3 shows emission peaks at 370, 391, and 414 nm. These peaks are excitation-dependent, which is a typical feature of CDs. However, since the wavelength of excitation is 365 nm in Fig. 1b, the emission wavelength is around 500 nm, which corresponds to green PL that was observed. Surface state-controlled PL is commonly attributed to the origin of CDs’ PL. Based on the excitation independent nature of fractions 1 and 2, we expect they should possess a uniform and defect free surface state. Based on the excitation dependent PL of fraction 3, we hypothesize there might be an abundance of defects in the atomic lattice of CDs, which causes the excitation dependence and the random trend of PL color in fractions 1–3, which has been confirmed later by XPS measurement. Accordingly, the fluorescence quantum yield (QY) of fraction 1, 2 and 3 was calculated according to Equation S1 to be 39.2 %, 4.3 %, and 5.1 %, respectively. The QY of fraction 1 and 3 was measured with quinine sulfate dissolved in 0.05 M H2SO4 aqueous solution as standard solution with the QY of 55 %. However, according to the degree of overlap in the emission spectra of standard solution and sample, fraction 2 was measured with tris(bipyridine)ruthenium (II) chloride in H2O as the standard solution with the QY of 2.8%. In comparison to fraction 1, the lower QY of fraction 2 and 3 might result from the aggregation-caused quenching [60], which is indicated by the low zeta potential values of −17.2 and −10.7 mV for fraction 2 and 3, respectively. The absolute value of zeta potential decreases from −20.5 and −10.7 mV for fraction 3, which indicates the tendency of aggregation increases as the size of the CD decreases.
Fig. 2.
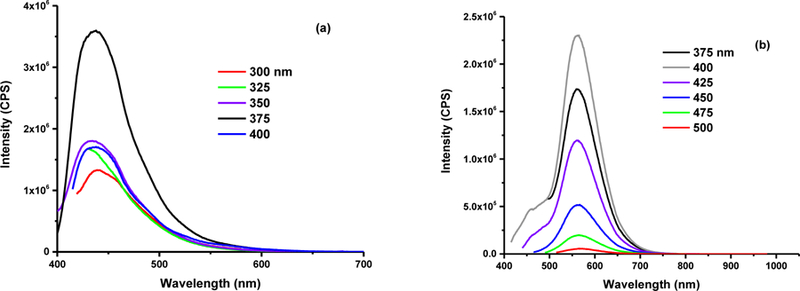
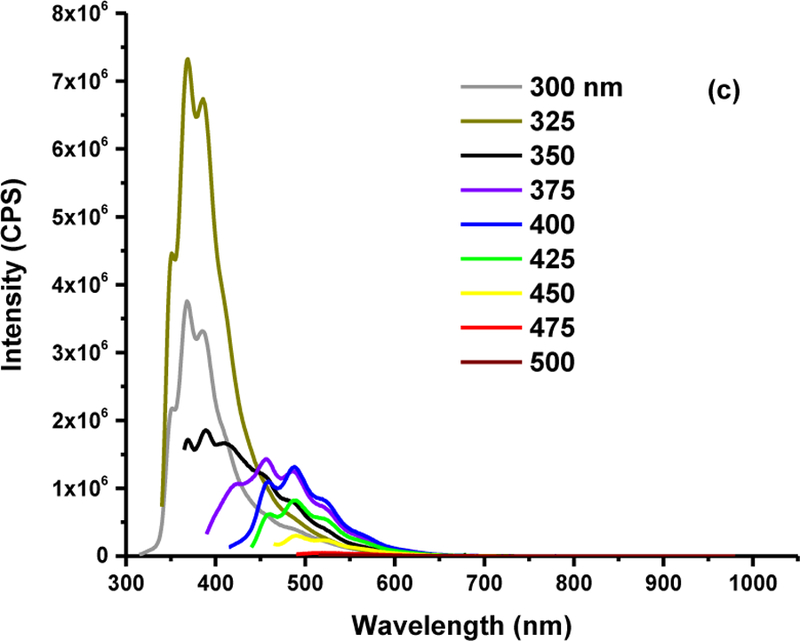
The fluorescence spectra of fraction 1 (a), 2 (b) and 3 (c). The concentration of fraction 1,2 and 3 is 0.000192, 0.056 and 0.25 mg/mL, respectively.
ATR-FTIR measurements were conducted to analyze the functional groups of the three fractions. As displayed in Fig. 3, all the three fractions have N-H or O-H (3341–3058 cm−1), C=C or C=N (1635 cm−1) and C=O (1896 cm−1) groups. This suggests that the three fractions are similar regarding the chemical composition. This is consistent with UV/vis absorption spectra results in Fig. S1 that show the presence of C=C, C=N and C=O in the conjugated structures. Note that the N-H and O-H groups enhance the water dispersity of the CDs. Nonetheless, the stability of fraction 3 colloidal solution is better than that of fraction 2, while fraction 2 is better than fraction 1. This observation could be explained by the carbonization degree of fraction 1 > fraction 2 > fraction 3, which is demonstrated by the C content shown in Table S1 in the supporting information. Therefore, even though the three fractions share similar functional groups, the surface states and properties may vary depending on the relative abundance of each functional group and the elemental composition at the top-most (~100 Å) surface layers.
Fig. 3.
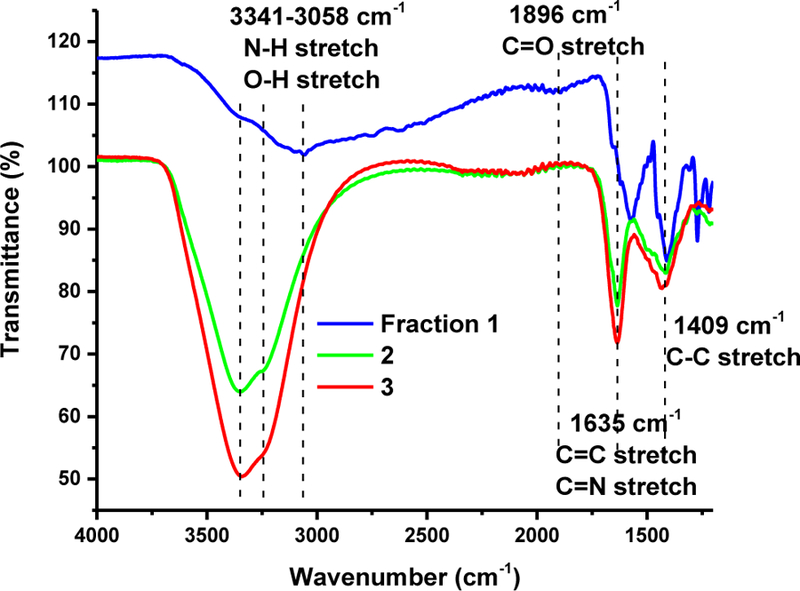
The FTIR spectra of fraction 1, 2 and 3 in solid state with air as background.
To corroborate this theory, we conducted XPS analysis to study the surface composition of each CDs fraction. Atom mole fraction results (with fwhm and % deconvoluted peak areas in parentheses) are summarized in Table S1 in the supporting information. Fig. 4 shows the XPS stackplots for the C 1s, N 1s and O 1s core levels of the CDs fractions 1 (a), 2 (b), and 3 (c). The C 1s core level BE at 288.3 eV observed in all fractions denoted carboxylic acid [61]. The O-H and C=O groups have been elucidated by the FTIR (Fig. 3) and UV/Vis absorption (Fig. S1) spectra. There was no noticeable trend in compositional change in the C 1s levels between various fractions. The N 1s core levels for all samples show a BE peak center at 399.1 eV consistent with an imine (C=N) group within a ring system [62], which was confirmed by the UV/vis spectra (Fig. S1) and FTIR spectra (Fig. 3). Noteworthy is the fact that there are two observable O 1s oxidation states that varied in relative quantity between the fractions. The O 1s core levels for all fractions show BE peak centers at 530.9 and 532.7 eV, consistent with acetate-like O atoms [63] and an O-containing polymeric structure [64], respectively. This result matches the C=O revealed in the FTIR data.
Fig. 4.

XPS core levels of O 1s, N 1s and C 1s orbitals of fraction 1 (a), fraction 2 (b), and fraction 3 (c), of the CDs.
From integrated peak area analysis of the deconvoluted oxidation states (Table S1 in the supporting information) in the XPS spectra, the following self-consistent trends were observed. The lower O 1s BE state decreased in the descending order: a (48.4%) > b (27.5%) > c (12.5%). Simultaneously, a decrease in overall atomic % N was observed in the descending order: a (1.6%) > b (1.0%) > c (0.7%). A decrease in overall atomic % C was observed in the descending order: a (87.1%) > b (78.5%) > c (66.1%). There was also a decrease in the amide –COOH oxidation state as denoted in the relative integrated peak areas in the C 1s level at BE = 288.3 eV in the descending order: a (16.0%) > b (11.1%) > c (7.8%).
As Observed from the AFM images (Fig. 5), the three fractions exhibited different sizes as we previously expected from the CD separation through the SEC. The size of fraction 1, 2 and 3 is estimated around 5, 3 and 2 nm, respectively, according to Fig. 5a, b and c). The average particle size of each fraction has been confirmed by the TEM images shown in Fig. 5d, e and f. From the histograms of TEM images, we can observe the size of fraction 1, 2 and 3 is 4.48±1.38, 3.61±0.92 and 2.24±0.45 nm, respectively. The combination of AFM and TEM data revealed the typical spherical CDs morphology with narrow size distribution. In addition, the random PL color of CDs fractions in a size gradient revealed that the quantum size effect is not controlling the PL mechanism of these CDs fractions. This is consistent with the CDs reported by Cao et al., [65].
Fig. 5.
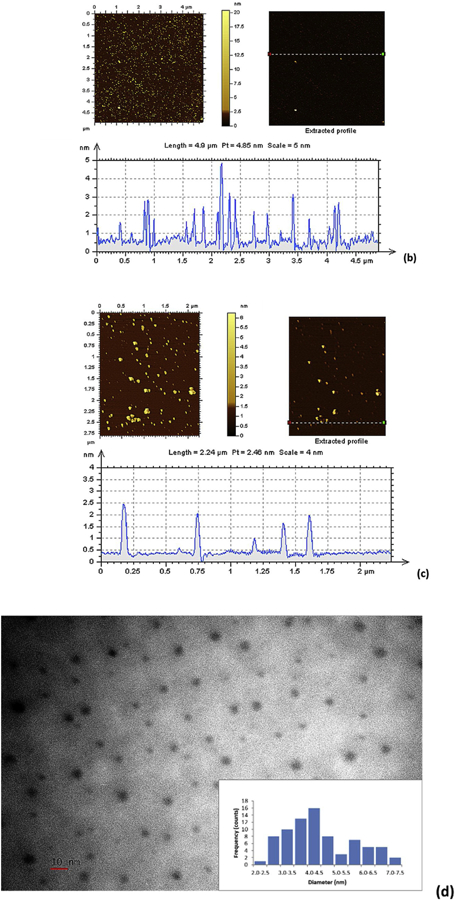
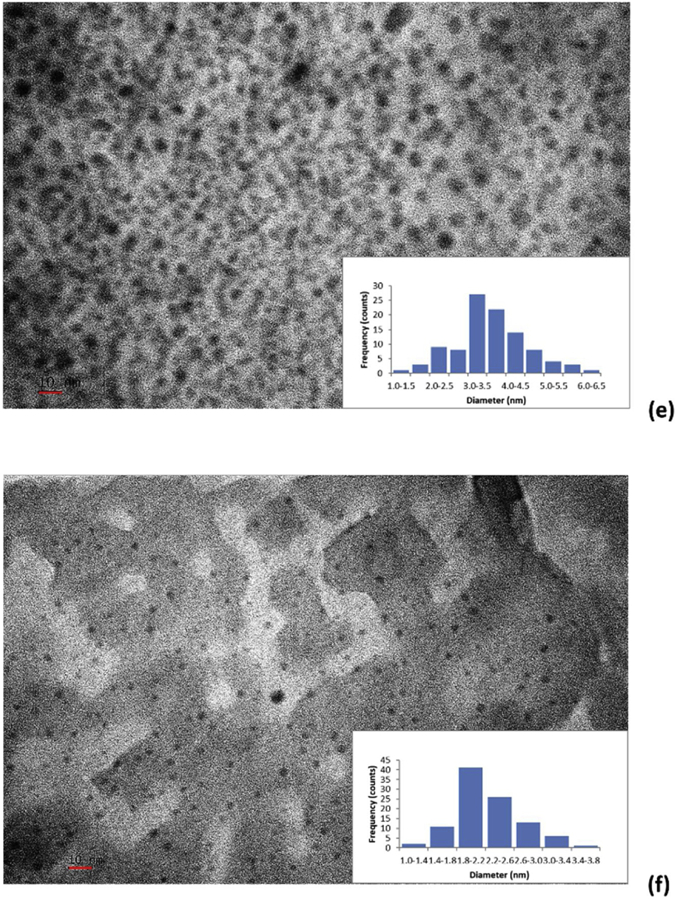
The AFM images of fraction 1 (a), 2 (b) and 3 (c); the TEM images of fraction 1 (d), 2 (e) and 3 (f). The scale bars represent 10 nm.
3.2. Photocatalytic dye degradation
In order to explore the photocatalytic activity of the as-prepared CDs, considering the negative zeta potential of CDs fractions, positively-charged organic dyes were selected for photocatalytic dye degradation. Therefore, the degradation of RhB and MB was conducted in presence of 0.75 mg/mL of CDs under simulated sunlight. Neither RhB or MB was degraded in the presence of fraction 1 (Fig. S2a and b). As the size of CDs decrease to 3 nm in fraction 2, partial degradation of MB was noticed only in the first 20 min (Fig. S2d). On the other hand, no significant degradation of RhB was found for reactions catalyzed with fraction 2 (Fig. S2c). On the contrary, the 2-nm CDs of fraction 3 demonstrated significant degradation of RhB and MB, which was both completed in 150 min (Fig. S2e and f). As presented in Fig. 6a, fraction 3 exhibited substantial photocatalytic activity in the degradation of both RhB and MB. Within 60 min, RhB and MB naturally degraded by 20 and 60%, respectively. With the addition of fraction 3, within the same time, the degradation of both dyes was observed at dye absorption peaks at 554 and 664 nm to increase up to 50 and 90%, respectively. The pseudo-first order reaction rate constants were 1.3×10⁻² and 3.6×10⁻² min−1, which exhibited the excellent photocatalytic activity in contrast to most previously reported bare carbon dots. For instance, Yang et al. showed CDs/TNS and CDs/P25 composites showed enhanced photocatalytic activity in the degradation of RhB, but there was no dye degradation in the presence of CDs alone [66]. Furthermore, Huang et al. mentioned the reaction rate constant for their nitrogen-doped CDs was 5.1×10⁻⁴ min−1 while for TiO2, a widely used photocatalyst, it was 1.5×10⁻² min−1 [67]. It suggests the obtained bare CDs with smallest size could be considered as a promising alternative for the common photocatalyst to achieve homogeneous photocatalysis. In addition, in order to illustrate the importance of surface modification to CDs in terms of photocatalysis, Kang et al. compared the CDs and N-doped CDs in the degradation of methyl orange (MO) (a negatively charge dye model) [17]. As a result, 90% MO degraded within 120 min, which benefited from the presence of N-doped CDs. In comparison, bare CDs exhibited lower efficiency and the MO degradation only occurred in 30% with 120 min. Compared to their N-doped CDs, even though the efficiency of our CDs fraction 3 is similar, there was no need of further surface modification, which further shows the advantage of the synthetic approach of CDs fraction 3. Additionally, the wavelength-dependent activity of fraction 3 was conducted with a UV cut off filter (λ<420 nm). As displayed in Fig. 6b the rate of RhB degradation decreased (k = 2.5×10⁻³ min−1) compared to the one without filter (k = 1.3×10⁻² min−1). This comparison demonstrates that the photocatalytic activity of the as-prepared CDs is driven by visible light.
Fig. 6.
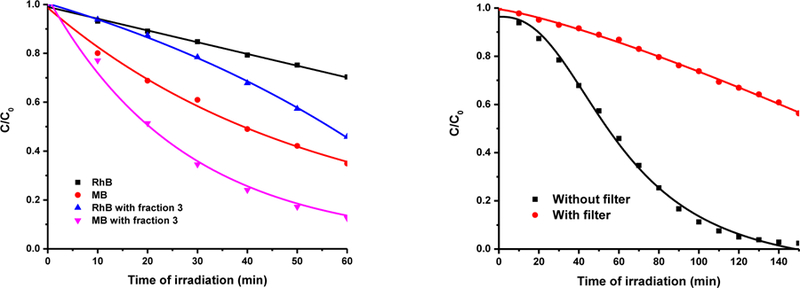
(a) Photocatalytic degradation of RhB and MB as a function of irradiation time; (b) Wavelength- dependent activity test of fraction 3 in the RhB degradation w/o filter. The concentration of fraction 3 is 0.75 mg/mL.
The significant difference in the activity among various CDs fractions as well as fraction 3 in the presence and absence of filter can be explained in light of band gap energy exhibited by each material as measured by diffuse reflectance spectroscopy (Fig. 7). As displayed in Fig. S3, no semiconductor properties were noticed for fraction 1. On the other hand, band gap energies were calculated for fraction 2 and 3 from the spectra in Fig. 7a and b to be 2.36 and 2.04 eV, respectively. Just as revealed by the XPS, fraction 3 has higher content of O in terms of overall atoms, the band gap [37], and result in the narrow band gap of fraction 3. Also, the band gap of fraction 3 is 2.04 eV, which reveals the absorption band edge at around 550 nm and it confirms the photocatalytic capability of fraction 3 under the visible light irradiation. According to these values, the as-prepared CDs of fraction 2 and 3 can be considered as direct semiconductors with narrow band gap that is well-suited for homogeneous photocatalytic degradation reactions. In addition, based on the ratio of C and O overall atomic content of each fraction (F1, 8:1; F2, 4:1, F3, 2:1), it is hypothesized that the stability of the C-O bond has the following order (F3<F2<F1), which contributes to the higher photoactivity of fraction 2 and 3.
Fig. 7.
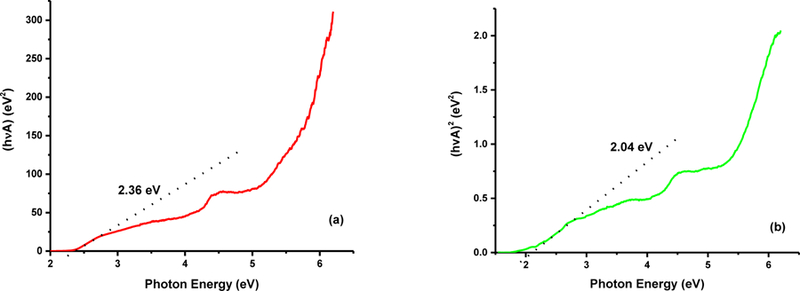
Diffuse reflectance spectroscopy measurement. Plot of (αhʋ)2 vs. photon energy for all the three CDs fractions. F2 (a) and F3 (b).
To further investigate this hypothesis and probe the mechanism of the reaction, the photocatalytic degradation of RhB and MB by CDs (fraction 3) was conducted in the presence of various charged radical scavengers and analyzed with the pseudo-first order reaction rate constant obtained from the RhB absorption peak at 554 nm.
First, the photocatalytic degradation of RhB was conducted in presence of EDTA to scavenge the holes. It is generally accepted that photocatalytic reactions are initiated by photochemically generated electrons (e−) and holes (h+) [68]. As it is observed from Fig. S4, RhB and MB, especially RhB, have little degradation in the natural state. However, Fig. 8 and S5a showed significant decrease of the dye degradation rate constant in presence of EDTA indicating the mechanism of oxidization of the organic dyes by the holes.
Fig. 8.
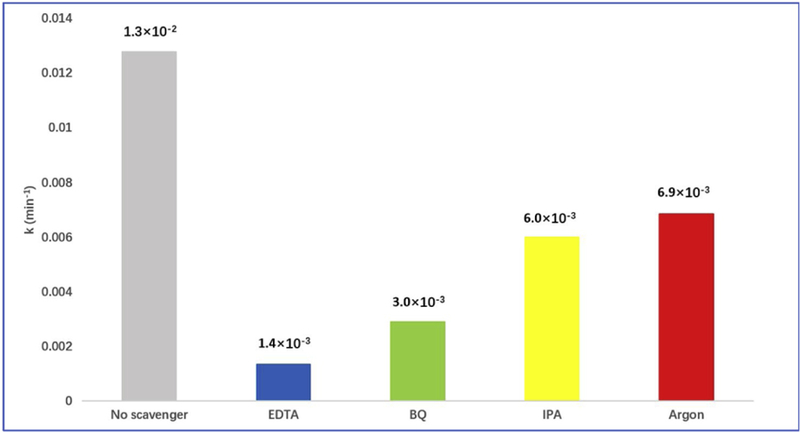
Photocatalytic degradation rate constants of RhB in the presence of EDTA, BQ, IPA, argon and no scavenger by fraction 3
In addition, the second mechanism is the generation of ROS (reactive oxygen species) such as superoxide anions and hydroxyl radicals. To examine the presence of such species, benzoquinone (BQ) and isopropyl alcohol (IPA) that had been verified as excellent scavengers [68, 69], were employed to scavenge •O2− and •OH, respectively. The comparison in Fig. 8 and S5, demonstrates that the addition of BQ significantly inhibited the photocatalytic degradation of RhB. This indicates that electrons from the conduction band of the CDs are donated to the dissolved molecular oxygen to generate •O2–, which oxidize the RhB. On the other hand, no appreciable change was noticed in the degradation rate of RhB in presence of IPA, which indicates that the oxidation of water by the hole is not impossible. To further elucidate this hypothesis, we used argon gas to flush away oxygen originally dissolved in water for 1 hour and insulate the system from oxygen from the environment by using a balloon filled with argon gas. The dye degradation was inhibited compared with the aerobic reaction, which suggested the oxygen dissolved in water also played a certain role in the dye degradation. Another external factor that should be considered is the electrostatic adsorption of dyes onto CDs. Therefore, the adsorption of RhB was performed in dark and the results are recorded in the UV/vis spectrum in Fig. S6. It was noticed that the absorbance of RhB slightly increased in the first 20 min due to the stirring-initiated desorption. However, after 20 min, no remarkable change in the absorbance was noticed until 60 min. This indicates minimal effect of the electrostatic adsorption on the degradation of the organic compounds. Furthermore, it has been found that RhB molecules can also be excited under visible light irradiation to form RhB* radicals [70]. In this case, these radicals can be adsorbed onto the surface of CDs and transfer electrons from/to the conduction/valence bands. In addition, the electrons can activate O2 to form •O2−, which also enhances RhB degradation and the overall photocatalytic efficiency of CDs. Thus, the RhB degradation mechanism might not be only dependent on the holes and superoxide radical anions generated at the valence and conduction bands, respectively, but also related to the self-photosensitization of RhB molecules, which is illustrated in Fig. 9.
Fig. 9.
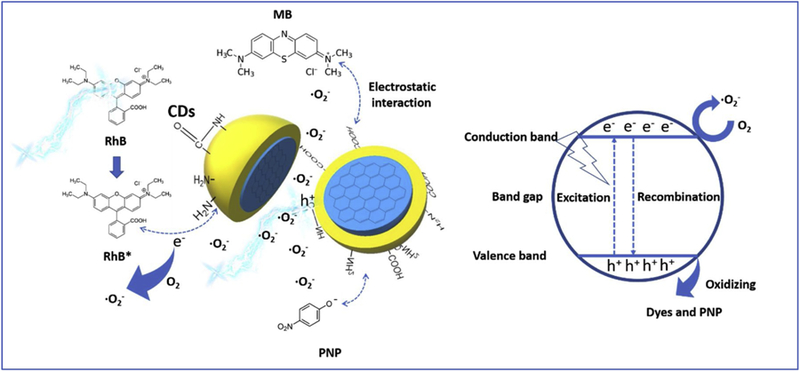
Schematic diagram of the interaction between CDs and dyes in the photocatalytic dye degradation.
In addition, fraction 3 of CDs was employed in the degradation of PNP, one of the most hazardous organic pollutants. To avoid the interference of self-degradation of PNP caused by the UV light, a >420 nm cut off filter was applied to allow only visible light irradiation of the PNP aqueous sample in presence of the 2-nm CDs. Under the visible light irradiation, no significant degradation of PNP was noticed in absence of the CDs (Fig. S7a). However, the degradation of PNP in presence of the 2-nm CDs occurred shown in Fig. 10a and the degradation rate constant was 2.16×10⁻³, which was measured based on Fig. 10b. It is noteworthy that the PNP displayed red shift from 313 to 402 nm upon mixing with the 2- nm CDs. This was attributed to the change in the pH from 7.5 to 9.5 that was measured after adding the CDs. Therefore, the rate constant was calculated using the absorbance at 402 nm. Furthermore, Fig. 10b demonstrated that within 150 min, PNP only degraded 30 % and the reason is the same as the result shown in Fig. 6b. However, upon the removal of the filter to utilize the full spectrum including UV light, within the same time, PNP degraded 70 % (Fig. S7b) and the rate constant can be enhanced up to 6.17×10⁻³.
Fig. 10.
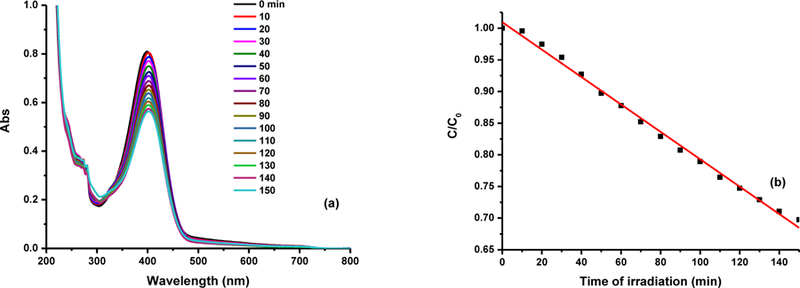
(a) PNP degradation in presence of CDs (fraction 3) using the filter; (b) the measurement of degradation reaction rate constant. The concentration of fraction 3 is 0.75 mg/mL.
3.3. Photocatalyst stability test
Fraction 3 was tested for its stability after the dye degradation lasted for 150 min. In order to completely remove the residues of RhB, the same solution containing fraction 3 was exposed to the solar simulator for 1 h. Subsequently, we added another fresh 20 µL RhB to the solution, which was irradiated by the solar simulator. The UV/vis spectrum was recorded each 30 min until the peak at 554 nm disappeared. The whole process was repeated four times. Fig. 11 shows the degradation of RhB over time. There is no significant decrease in the photocatalytic activity of the CDs of fraction 3 and can be reused for another degradation cycle, which reveals good stability. After four cycles of dye degradation experiment, fraction 3 was characterized by UV/vis and fluorescence spectroscopy measurement and the results were presented in the supporting information as Fig. S8. We observe no obvious differences in activity after multiple uses of the photocatalyst, which again confirms the stability of fraction 3 as the photocatalyst.
Fig. 11.
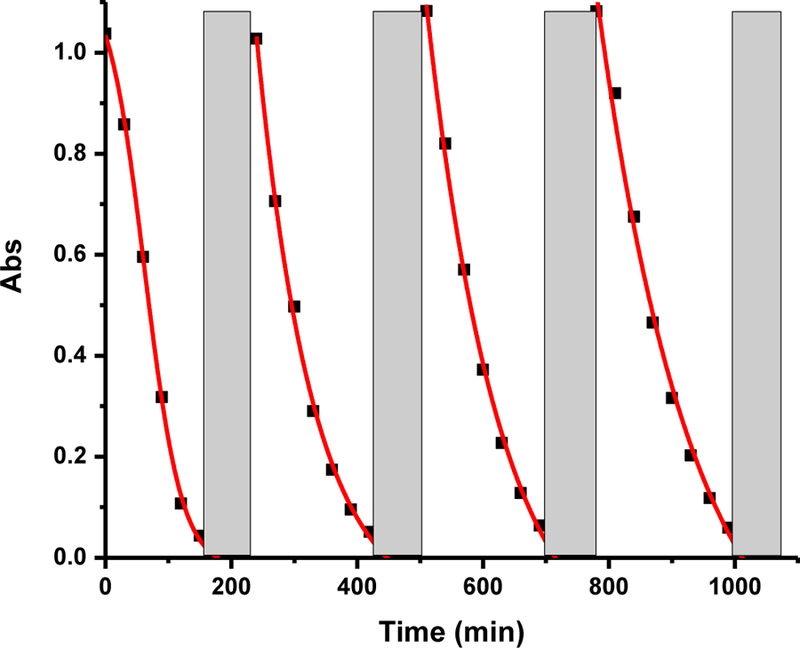
The stability test of fraction 3 with RhB degradation over time. The grey square represents 1 hour of exposure to sunlight. The concentration of fraction 3 is 0.75 mg/mL.
4. Conclusions
A microwave-assisted approach was adopted to create tunable sized CDs that showed unique photoluminescent (PL) behavior, structural properties, and photocatalytic activity and stability. However, there was not a trend between size of CDs and the PL color (wavelength). This shows the PL mechanism of CDs cannot be explained by quantum confinement. The diffuse reflectance spectroscopy analysis indicated semiconductor (fraction 3) properties with a narrow band gap of 2.04 eV. The size of the CDs demonstrated significant effect on their photocatalytic activity in the degradation of organic dyes. The 2- nm CDs showed substantial degradation of RhB and MB under simulated sunlight irradiation. The mechanism of the dye degradation was analyzed by using sacrificial scavengers and argon protection, separately. We observed the photocatalytic dye degradation catalyzed by the 2-nm CDs is mainly attributed to the oxidation of the dye by the holes and superoxide radical anions. Fraction 3 was applied to degrade other organic pollutants such as p-nitrophenol and it showed 70% degradation upon irradiation by full spectrum. Also, fraction 3 demonstrated good stability as a photocatalyst for multiple cycles of dye degradation. The study, for the first time, reports a size-dependent photocatalytic dye degradation of CDs, showing a comparable result to those of many metal-containing photocatalysts. These results point out the potential of bare CDs with smaller size as excellent photocatalysts in the pollutant degradation, important for future environmental protection.
Supplementary Material
Highlights.
Bare CDs were first studied for the size-dependent photocatalytic degradation of dyes.
CDs in the smallest size (2 nm) exhibits a narrow band gap of 2.04 eV, the best photocatalytic capability and excellent stability.
2-nm CDs showed promising application of bare CDs in the photocatalytic degradation of p-nitrophenol (70% within 150 min).
The main mechanism of the photocatalytic degradation of organic compounds due to the hole in valence bands of CDs and the generated superoxide anion radicals.
There was no correlation of the size of CDs with PL emission wavelengths, which shows that the PL mechanism of such CDs is not quantum size dependent.
Acknowledgments
We gratefully acknowledge the support of the National Science Foundation under Grant 011298 and National Institute of Health under Grant 009887. Elsayed M. Zahran acknowledge support from Ball State University.
Footnotes
Publisher's Disclaimer: This is a PDF file of an unedited manuscript that has been accepted for publication. As a service to our customers we are providing this early version of the manuscript. The manuscript will undergo copyediting, typesetting, and review of the resulting proof before it is published in its final citable form. Please note that during the production process errors may be discovered which could affect the content, and all legal disclaimers that apply to the journal pertain.
References
- [1].Marco V, Evgenia K, D.I. A., J.M. P., George B, Andreas S-O, S.W. A., The role of size and dimerization of decorating plasmonic silver nanoparticles on the photoelectrochemical solar water splitting performance of BiVO4 photoanodes, ChemNanoMat, 2 (2016) 739–747. [Google Scholar]
- [2].Rajamanickam D, Shanthi M, Photocatalytic degradation of an organic pollutant by zinc oxide – solar process, Arab. J. Chem, 9 (2016) S1858–S1868. [Google Scholar]
- [3].Fujishima A, Honda K, Electrochemical photolysis of water at a semiconductor electrode, Nature, 238 (1972) 37–38. [DOI] [PubMed] [Google Scholar]
- [4].Haro M, Abargues R, Herraiz-Cardona I, Martínez-Pastor J, Giménez S, Plasmonic versus catalytic effect of gold nanoparticles on mesoporous TiO2 electrodes for water splitting, Electrochim. Acta, 144 (2014) 64–70. [Google Scholar]
- [5].Hung W-H, Chien T-M, Tseng C-M, Enhanced photocatalytic water splitting by plasmonic TiO2– Fe2O3 cocatalyst under visible light irradiation, J. Phys. Chem. C, 118 (2014) 12676–12681. [Google Scholar]
- [6].Chen X, Wu Z, Liu D, Gao Z, Preparation of ZnO photocatalyst for the efficient and rapid photocatalytic degradation of Azo dyes, Nanoscale Res. Lett, 12 (2017) 143–152. [DOI] [PMC free article] [PubMed] [Google Scholar]
- [7].Wang J, Lim Y-F, Wei Ho G, Carbon-ensemble-manipulated ZnS heterostructures for enhanced photocatalytic H2 evolution, Nanoscale, 6 (2014) 9673–9680. [DOI] [PubMed] [Google Scholar]
- [8].Saison T, Chemin N, Chanéac C, Durupthy O, Mariey L, Maugé F, Brezová V, Jolivet J-P, New insights into BiVO4 properties as visible light photocatalyst, J. Phys. Chem. C, 119 (2015) 12967–12977. [Google Scholar]
- [9].Li G-S, Zhang D-Q, Yu JC, A new visible-light photocatalyst: CdS quantum dots embedded mesoporous TiO2, Environ. Sci. Technol, 43 (2009) 7079–7085. [DOI] [PubMed] [Google Scholar]
- [10].Naseri A, Samadi M, Pourjavadi A, Moshfegh AZ, Ramakrishna S, Graphitic carbon nitride (g- C3N4)-based photocatalysts for solar hydrogen generation: recent advances and future development directions, J. Mater. Chem. A, 5 (2017) 23406–23433. [Google Scholar]
- [11].Sachsenhauser M, Walczak K, Hampel PA, Stutzmann M, Sharp ID, Garrido JA, Suppression of photoanodic surface oxidation of n-type 6H-SiC electrodes in aqueous electrolytes, Langmuir, 32 (2016) 1637–1644. [DOI] [PubMed] [Google Scholar]
- [12].Jafari T, Moharreri E, Amin A, Miao R, Song W, Suib S, Photocatalytic water splitting—The untamed dream: A review of recent advances, Molecules, 21 (2016) 900–928. [DOI] [PMC free article] [PubMed] [Google Scholar]
- [13].Wang B, Wang S, Wang Y, Lv Y, Wu H, Ma X, Tan M, Highly fluorescent carbon dots for visible sensing of doxorubicin release based on efficient nanosurface energy transfer, Biotechno. Lett, 38 (2016) 191–201. [DOI] [PubMed] [Google Scholar]
- [14].Zhou Y, Desserre A, Sharma SK, Li S, Marksberry MH, Chusuei CC, Blackwelder PL, Leblanc RM, Gel-like carbon dots: Characterization and their potential applications, ChemPhysChem, 18 (2017) 890–897. [DOI] [PubMed] [Google Scholar]
- [15].Wang X, Qu K, Xu B, Ren J, Qu X, Microwave assisted one-step green synthesis of cell-permeable multicolor photoluminescent carbon dots without surface passivation reagents, J. Mater. Chem, 21 (2011) 2445–2450. [Google Scholar]
- [16].Sun Y-P, Zhou B, Lin Y, Wang W, Fernando KAS, Pathak P, Meziani MJ, Harruff BA, Wang X, Wang H, Luo PG, Yang H, Kose ME, Chen B, Veca LM, Xie S-Y, Quantum-sized carbon dots for bright and colorful photoluminescence, J. Am. Chem. Soc, 128 (2006) 7756–7757. [DOI] [PubMed] [Google Scholar]
- [17].Ma Z, Ming H, Huang H, Liu Y, Kang Z, One-step ultrasonic synthesis of fluorescent N-doped carbon dots from glucose and their visible-light sensitive photocatalytic ability, New J. Chem, 36 (2012) 861–864. [Google Scholar]
- [18].Wang Y, Hu A, Carbon quantum dots: synthesis, properties and applications, J. Mater. Chem. C, 2 (2014) 6921–6939. [Google Scholar]
- [19].Zhou Y, Mintz K, Oztan C, Hettiarachchi S, Peng Z, Seven E, Liyanage P, De La Torre S, Celik E, Leblanc R, Embedding carbon dots in superabsorbent polymers for additive manufacturing, Polymers, 10 (2018) 921–932. [DOI] [PMC free article] [PubMed] [Google Scholar]
- [20].Zhou Y, Peng Z, Seven ES, Leblanc RM, Crossing the blood-brain barrier with nanoparticles, J. Control. Release, 270 (2018) 290–303. [DOI] [PubMed] [Google Scholar]
- [21].Mintz KJ, Mercado G, Zhou Y, Ji Y, Hettiarachchi SD, Liyanage PY, Pandey RR, Chusuei CC, Dallman J, Leblanc RM, Tryptophan carbon dots and their ability to cross the blood-brain barrier, Colloids Surf. B, 176 (2019) 488–493. [DOI] [PMC free article] [PubMed] [Google Scholar]
- [22].Song Y, Zhu S, Yang B, Bioimaging based on fluorescent carbon dots, RSC Adv, 4 (2014) 27184–27200. [Google Scholar]
- [23].Peng Z, Miyanji EH, Zhou Y, Pardo J, Hettiarachchi SD, Li S, Blackwelder PL, Skromne I, Leblanc RM, Carbon dots: promising biomaterials for bone-specific imaging and drug delivery, Nanoscale, 9 (2017) 17533–17543. [DOI] [PMC free article] [PubMed] [Google Scholar]
- [24].Campos BB, Contreras-Cáceres R, Bandosz TJ, Jiménez-Jiménez J, Rodríguez-Castellón E, Esteves da Silva JCG, Algarra M, Carbon dots as fluorescent sensor for detection of explosive nitrocompounds, Carbon, 106 (2016) 171–178. [Google Scholar]
- [25].Mintz K, Waidely E, Zhou Y, Peng Z, Al-Youbi AO, Bashammakh AS, El-Shahawi MS, Leblanc RM, Carbon dots and gold nanoparticles based immunoassay for detection of alpha-L-fucosidase, Anal. Chim. Acta, 1041 (2018) 114–121. [DOI] [PubMed] [Google Scholar]
- [26].Zhijie Z, Tingting Z, Xiaoming L, Jiayue X, Haibo Z, Progress of carbon quantum dots in photocatalysis applications, Part. Part. Syst. Char, 33 (2016) 457–472. [Google Scholar]
- [27].Cao L, Sahu S, Anilkumar P, Bunker CE, Xu J, Fernando KAS, Wang P, Guliants EA, Tackett KN, Sun Y-P, Carbon nanoparticles as visible-light photocatalysts for efficient CO2 conversion and beyond, J. Am. Chem. Soc, 133 (2011) 4754–4757. [DOI] [PubMed] [Google Scholar]
- [28].Wang J, Ng YH, Lim Y-F, Ho GW, Vegetable-extracted carbon dots and their nanocomposites for enhanced photocatalytic H2 production, RSC Adv, 4 (2014) 44117–44123. [Google Scholar]
- [29].Celik E, Oztan C, Zhou Y, LeBlanc R, Genc O, Ballikaya S, Enhancement of thermoelectric figure of merit of Bi2Te3 using carbon dots, (2018) V06BT08A039. [Google Scholar]
- [30].Sahu S, Behera B, Maiti TK, Mohapatra S, Simple one-step synthesis of highly luminescent carbon dots from orange juice: application as excellent bio-imaging agents, Chem. Commun, 48 (2012) 8835–8837. [DOI] [PubMed] [Google Scholar]
- [31].Chae A, Choi Y, Jo S, Nur’aeni P Paoprasert SY Park I In, Microwave-assisted synthesis of fluorescent carbon quantum dots from an A2/B3 monomer set, RSC Adv, 7 (2017) 12663–12669. [Google Scholar]
- [32].Zheng C, An X, Gong J, Novel pH sensitive N-doped carbon dots with both long fluorescence lifetime and high quantum yield, RSC Adv, 5 (2015) 32319–32322. [Google Scholar]
- [33].Rodrigues J, Pereira SO, Soreto Teixeira S, Zhou Y, Peng Z, Liyanage PY, Leblanc RM, Barros-Timmons AMMV, Costa LC, Costa FM, Monteiro T, Insights into the photoluminescence properties of gellike carbon quantum dots embedded in poly(methyl methacrylate) polymer, Mater. Today Comm, 18 (2019) 32–38. [Google Scholar]
- [34].Zhu S, Song Y, Zhao X, Shao J, Zhang J, Yang B, The photoluminescence mechanism in carbon dots (graphene quantum dots, carbon nanodots, and polymer dots): current state and future perspective, Nano Res, 8 (2015) 355–381. [Google Scholar]
- [35].Han L, Liu SG, Dong JX, Liang JY, Li LJ, Li NB, Luo HQ, Facile synthesis of multicolor photoluminescent polymer carbon dots with surface-state energy gap-controlled emission, J. Mater. Chem. C, 5 (2017) 10785–10793. [Google Scholar]
- [36].Takanabe K, Photocatalytic water splitting: Quantitative approaches toward photocatalyst by design, ACS Catalysis, 7 (2017) 8006–8022. [Google Scholar]
- [37].Yu J, Liu C, Yuan K, Lu Z, Cheng Y, Li L, Zhang X, Jin P, Meng F, Liu H, Luminescence mechanism of carbon dots by tailoring functional groups for sensing Fe3+ ions, Nanomaterials, 8 (2018) 233–244. [DOI] [PMC free article] [PubMed] [Google Scholar]
- [38].Li X, Zhang S, Kulinich SA, Liu Y, Zeng H, Engineering surface states of carbon dots to achieve controllable luminescence for solid-luminescent composites and sensitive Be2+ detection, Sci. Rep, 4 (2014) 4976–4983. [Google Scholar]
- [39].Yuan F, Wang Z, Li X, Li Y, Tan Z.a., Fan L, Yang S , Bright multicolor bandgap fluorescent carbon quantum dots for electroluminescent light‐Emitting diodes, Adv. Mater, 29 (2017) 1604436–1604441. [DOI] [PubMed] [Google Scholar]
- [40].Reza Gholipour M, Dinh C-T, Beland F, Do T-O, Nanocomposite heterojunctions as sunlight-driven photocatalysts for hydrogen production from water splitting, Nanoscale, 7 (2015) 8187–8208. [DOI] [PubMed] [Google Scholar]
- [41].Zheng D-W, Li B, Li C-X, Fan J-X, Lei Q, Li C, Xu Z, Zhang X-Z, Carbon-dot-decorated carbon nitride nanoparticles for enhanced photodynamic therapy against hypoxic tumor via water splitting, ACS Nano, 10 (2016) 8715–8722. [DOI] [PubMed] [Google Scholar]
- [42].Ni M, Leung MKH, Leung DYC, Sumathy K, A review and recent developments in photocatalytic water-splitting using TiO2 for hydrogen production, Renew. Sust. Energ. Rev, 11 (2007) 401–425. [Google Scholar]
- [43].Wang X, Maeda K, Thomas A, Takanabe K, Xin G, Carlsson JM, Domen K, Antonietti M, A metal-free polymeric photocatalyst for hydrogen production from water under visible light, Nat. Mater, 8 (2008) 76–80. [DOI] [PubMed] [Google Scholar]
- [44].Wang R, Lu K-Q, Zhang F, Tang Z-R, Xu Y-J, 3D carbon quantum dots/graphene aerogel as a metal-free catalyst for enhanced photosensitization efficiency, Appl. Catal., B, 233 (2018) 11–18. [Google Scholar]
- [45].Zhang N, Yang M-Q, Liu S, Sun Y, Xu Y-J, Waltzing with the versatile platform of graphene to synthesize composite photocatalysts, Chem. Rev, 115 (2015) 10307–10377. [DOI] [PubMed] [Google Scholar]
- [46].Lu K-Q, Quan Q, Zhang N, Xu Y-J, Multifarious roles of carbon quantum dots in heterogeneous photocatalysis, J. Energy Chem, 25 (2016) 927–935. [Google Scholar]
- [47].Wang R, Lu K-Q, Tang Z-R Xu Y-J, Recent progress in carbon quantum dots: synthesis, properties and applications in photocatalysis, J. Mater. Chem. A, 5 (2017) 3717–3734. [Google Scholar]
- [48].Liu H, Li Z, Sun Y, Geng X, Hu Y, Meng H, Ge J, Qu L, Synthesis of luminescent carbon dots with ultrahigh quantum yield and inherent folate receptor-positive cancer cell targetability, Sci. Rep, 8 (2018) 1086–1093. [DOI] [PMC free article] [PubMed] [Google Scholar]
- [49].Zhang H, Ming H, Lian S, Huang H, Li H, Zhang L, Liu Y, Kang Z, Lee S-T, Fe2O3/carbon quantum dots complex photocatalysts and their enhanced photocatalytic activity under visible light, Dalton Trans, 40 (2011) 10822–10825. [DOI] [PubMed] [Google Scholar]
- [50].Yu H, Zhao Y, Zhou C, Shang L, Peng Y, Cao Y, Wu L-Z, Tung C-H, Zhang T, Carbon quantum dots/TiO2 composites for efficient photocatalytic hydrogen evolution, J. Mater. Chem. A, 2 (2014) 3344–3351. [Google Scholar]
- [51].Muthulingam S, Bae KB, Khan R, Lee I-H, Uthirakumar P, Carbon quantum dots decorated N- doped ZnO: Synthesis and enhanced photocatalytic activity on UV, visible and daylight sources with suppressed photocorrosion, J. Environ. Chem. Eng, 4 (2016) 1148–1155. [Google Scholar]
- [52].Cheng Z, Wang F, Shifa TA, Liu K, Huang Y, Liu Q, Jiang C, He J, Carbon dots decorated vertical SnS2 nanosheets for efficient photocatalytic oxygen evolution, Appl. Phys. Lett, 109 (2016) 053905–053909. [Google Scholar]
- [53].Zhang Y, Park M, Kim HY, Ding B, Park S-J, A facile ultrasonic-assisted fabrication of nitrogen-doped carbon dots/BiOBr up-conversion nanocomposites for visible light photocatalytic enhancements, Sci. Rep, 7 (2017) 45086–45097. [DOI] [PMC free article] [PubMed] [Google Scholar]
- [54].Yang P, Zhao J, Zhang L, Li L, Zhu Z, Intramolecular hydrogen bonds quench photoluminescence and enhance photocatalytic activity of carbon nanodots, Chem. Eur. J, 21 (2015) 8561–8568. [DOI] [PubMed] [Google Scholar]
- [55].Haitao L, Xiaodie H, Zhenhui K, Hui H, Yang L, Jinglin L, Suoyuan L, T.C.H. A., Xiaobao Y, Shuit-Tong L, Water-soluble fluorescent carbon quantum dots and photocatalyst design, Angew. Chem. Int. Ed, 49 (2010) 4430–4434. [DOI] [PubMed] [Google Scholar]
- [56].Chen Y, Sun F, Huang Z, Chen H, Zhuang Z, Pan Z, Long J, Gu F, Photochemical fabrication of SnO2 dense layers on reduced graphene oxide sheets for application in photocatalytic degradation of p-nitrophenol, Appl. Catal., B, 215 (2017) 8–17. [Google Scholar]
- [57].Gao Z, Wang X, Chang J, Wu D, Wang L, Liu X, Xu F, Guo Y, Jiang K, Fluorescent carbon quantum dots, capacitance and catalysis active porous carbon microspheres from beer, RSC Adv, 5 (2015) 48665–48674. [Google Scholar]
- [58].Yiqun Z, L.P. Y., G.D. L., Zhili P, M.K. J., H.S. D., P.R. R., C.C. C., B.P. L., L.R. M., Photoluminescent carbon dots: A mixture of heterogeneous fractions, ChemPhysChem, 19 (2018) 1–10. [DOI] [PubMed] [Google Scholar]
- [59].Vandaele AC, Hermans C, Simon PC, Van Roozendael M, Guilmot JM, Carleer M, Colin R, Fourier transform measurement of NO2 absorption cross-section in the visible range at room temperature, J. Atmos. Chem, 25 (1996) 289–305. [Google Scholar]
- [60].Zhou D, Li D, Jing P, Zhai Y, Shen D, Qu S, Rogach AL, Conquering aggregation-induced solid- state luminescence quenching of carbon dots through a carbon dots-triggered silica gelation process, Chem. Mater, 29 (2017) 1779–1787. [Google Scholar]
- [61].Nag S, Begley DJ. Blood-brain barrier, exchange of metabolites and gases. In: Kalimo H, editor. Cerebrovascular diseases Basel:ISN Neuropath Press; 2005. p. 22–9. [Google Scholar]
- [62].Tooru Y, An x-ray photoelectron spectroscopic study of several ligands in coordination compounds, Bull. Chem. Soc. Jpn, 53 (1980) 1327–1330. [Google Scholar]
- [63].Wagner CD, Zatko DA, Raymond RH, Use of the oxygen KLL Auger lines in identification of surface chemical states by electron spectroscopy for chemical analysis, Anal. Chem, 52 (1980) 1445–1451. [Google Scholar]
- [64].High resolution XPS of organic polymers: The scienta ESCA300 database (Beamson, G.; Briggs, D.), J. Chem. Educ, 70 (1993) A25–A25. [Google Scholar]
- [65].Hu S, Tian R, Wu L, Zhao Q, Yang J, Liu J, Cao S, Chemical regulation of carbon quantum dots from synthesis to photocatalytic activity, Asian J. Chem, 8 (2013) 1035–1041. [DOI] [PubMed] [Google Scholar]
- [66].Han M, Zhu S, Lu S, Song Y, Feng T, Tao S, Liu J, Yang B, Recent progress on the photocatalysis of carbon dots: Classification, mechanism and applications, Nano Today, 19 (2018) 201–218. [Google Scholar]
- [67].Zhang Y-Q, Ma D-K, Zhang Y-G, Chen W, Huang S-M, N-doped carbon quantum dots for TiO2- based photocatalysts and dye-sensitized solar cells, Nano Energy, 2 (2013) 545–552. [Google Scholar]
- [68].Pálmai M, Zahran EM, Angaramo S, Bálint S, Pászti Z, Knecht MR, Bachas LG, Pd-decorated m-BiVO4/BiOBr ternary composite with dual heterojunction for enhanced photocatalytic activity, J. Mater. Chem. A, 5 (2017) 529–534. [Google Scholar]
- [69].Zhang Y, Zhang N, Tang Z-R, Xu Y-J, Identification of Bi2WO6 as a highly selective visible-light photocatalyst toward oxidation of glycerol to dihydroxyacetone in water, Chem. Sci, 4 (2013) 1820–1824. [Google Scholar]
- [70].Yuan L, Yang M-Q, Xu Y-J, Tuning the surface charge of graphene for self-assembly synthesis of a SnNb2O6 nanosheet–graphene (2D–2D) nanocomposite with enhanced visible light photoactivity, Nanoscale, 6 (2014) 6335–6345. [DOI] [PubMed] [Google Scholar]
Associated Data
This section collects any data citations, data availability statements, or supplementary materials included in this article.


