

Abstract
Sarcopenia is a complex polygenic disease, and its molecular mechanism is still unclear. Whole lean body mass (WLBM) is a heritable trait predicting sarcopenia. To identify genomic loci underlying, we performed a whole‐exome sequencing (WES) of WLBM variation with high sequencing depth (more than 40*) in 101 Chinese subjects. We then replicated in the major findings in the large‐scale UK Biobank (UKB) cohort (N = 217,822) for WLBM. The results of four single‐nucleotide polymorphisms (SNPs) were significant both in the discovery stage and replication stage: SNP rs740681 (discovery p = 1.66 × 10⁻⁶, replication p = .05), rs2272303 (discovery p = 3.20 × 10⁻⁴, replication p = 3.10 × 10⁻⁴), rs11170413 (discovery p = 3.99 × 10⁻⁴, replication p = 2.90 × 10⁻⁴), and rs2272302 (discovery p = 9.13 × 10⁻⁴, replication p = 3.10 × 10⁻⁴). We combined p values of the significant SNPs. Functional annotations highlighted two candidate genes, including FZR1 and SOAT2, that may exert pleiotropic effects to the development of body mass. Our findings provide useful insights that further enhance our understanding of genetic interplay in sarcopenia.
Keywords: Sarcopenia, single‐nucleotide polymorphism (SNP), whole lean body mass (WLBM), whole‐exome sequencing (WES)
1. INTRODUCTION
Sarcopenia was defined as age‐related loss of skeletal muscle mass and function, which was associated with a range of other diseases and health problems such as osteoporosis, obesity, and increased mortality (Brzeszczyńska et al., 2017; Cederholm & Morley, 2015; Chen et al., 2014; Fielding et al., 2011; Hayashi, Abe, Fujita, Okai, & Ohira, 2018; Joglekar, Nau, & Mezhir, 2015; Monaco, Castiglioni, Monaco, & Tappero, 2017; Valter, Andrea, Massimiliano, & Marco, 2014); 13%–24% of the elderly white people under 70 years old have sarcopenia, and prevalence is high as 50% or more among those aged 80 years old or older (Baumgartner et al., 1998). The decline in the contractility of lean mass also leads to a decrease in the load on bones, which makes the bones in a state of disuse for a long time, and is easy to induce osteoporosis (Buckwalter, 1995). The diagnosis of sarcopenia is based on an assessment of skeletal muscle mass and/or muscle strength, as well as muscle functions (Zembroń‐Łacny, Dziubek, Rogowski, Skorupka, & Dąbrowska, 2014). Skeletal muscle is under strong genetic control, with heritability estimates of 30%–85% for muscle strength and 50%–80% for muscle mass (Arden & Spector, 2010; Thomis et al., 2004). Whole lean body mass (WLBM) is composed of skeletal muscle (60%), viscera, and some other connective tissues (Vandewoude, Alish, Sauer, & Hegazi, 2012; Wolfe, 2006), with heritability over 50% (Hsu et al., 2012), which is a heritable trait predicting sarcopenia. WLBM can be measured accurately by dual‐energy X‐ray absorptiometry (DXA). Compared to other measurements, DXA is a simple, easy‐to‐use, approachable method with a low dose of radiation and a high degree of precision and accuracy, especially in determining the composition of the body at all local and random sites.
Bone and muscle have persistent paracrine crosstalk throughout life, and they both respond to paracrine and endocrine stimuli in common. A decrease in muscle contraction leads to a decrease in bone load, which leads to a loss of skeletal integrity. Osteoblasts and muscle cells share a common mesenchymal precursor during embryonic development (Hsu et al., 2012). Based on the biological information of the interaction between bone mineral density (BMD) and LM, it is predicted that there may be shared genetic background underlying both traits, that is, pleiotropic genes. Besides, sarcopenia and obesity interact and influence each other on physiological and behavioral levels (Roubenoff, 2000). According to the inconsistent definitions of sarcopenic obesity and studies with different populations, the prevalence of sarcopenic obesity was estimated to be 4%–12% (Cauley, (2015). Both sarcopenia and obesity have high genetic susceptibility, so there may be pleiotropic loci to influence the risks of both diseases.
In the present study, aiming to achieve a better understanding of the genetic etiology of sarcopenia, we conducted a genome‐wide association study of WLBM using the 101 Chinese subjects as discovery sample and a follow‐up replication study in the UK Biobank (UKB) sample. In addition, we conducted a serious of bioinformatic analysis including cis‐eQTL analysis, to explore the functional relevance of the identified genes including FZR1 (OMIM 603,619) and SOAT2 (OMIM 601,311).
2. MATERIALS AND METHODS
2.1. Subjects
The discovery sample consists of 101 unrelated Chinese adults, collected from more than 2000 random subjects in the form of extreme sampling, including 51 low hip BMD individuals (BMD < 0.785 g/cm2)and 50 high hip BMD individuals (Hip BMD > 0.98 g/cm2). All subjects were Han Chinese residents living in the vicinity of the central and western China, Changsha, and Xi'an, and their neighboring areas. All individuals with chronic diseases of vital organs, severe endocrine diseases, severe metabolic diseases, and severe nutritional diseases are not included in the research project. Individuals whose long‐term medication may affect bone mass, bone structure, or metabolism or muscle development were not included in the study.
We replicated the pleiotropic single‐nucleotide polymorphisms (SNPs) identified in the present study by the UKB cohort. In brief, the UKB cohort is a large prospective cohort study of ~500,000 participants from across the United Kingdom, aged between 40 and 69 at recruitment. Ethics approval for the UKB study was obtained from the North West Centre for Research Ethics Committee (11/NW/0382), and informed consent was obtained from all participants. This study used the data requested under the UKB application number 41,542, which was covered by the general ethical approval for the UKB study.
2.2. Phenotype measurements and modeling
All subjects completed a structured questionnaire including lifestyle, medical history, family information, anthropometric variables, etc.
In the discovery sample, WLBM and fat body mass (FBM) were measured with a Hologic QDR 4,500 W DXA scanner (Hologic Inc.). Body weight was measured in light clothing on a calibrated balance beam scale. Height was obtained using a calibrated stadiometer. Covariates (including gender, age, age2, height, height2, FBM, and the first five principal components derived from genome‐wide genotype data) were screened for significance with the step‐wise linear regression model implemented in the SPSS software. The WLBM was adjusted through significant covariates, and the residuals were normalized by inverse quantiles of standard normal distribution.
In the replication sample, body composition was quantified by bioelectrical impedance approach. WLBM was approximated by the sum of fat‐free mass at whole body. Phenotype modeling of WLBM was similar with that in the discovery samples. The difference is the phenotype in UKB was mandatorily adjusted by the top 10 principal components to adjust the potential population structure. Association was again examined by the linear regression model.
2.3. Genotyping
In whole‐exome sequencing (WES), the qualified genomic DNA subjects were randomly fragmented by ultrasonoscope (Covaris S2). The size of the library fragments is mainly distributed between 250 and 300 bp. Adapters were ligated to both ends of the resulting fragments. After extraction, we amplified DNA by ligation‐mediated PCR (LM‐PCR), purified, and hybridized to the NimbleGen 2.1M human exome array for enrichment. Non‐hybridized fragments were then washed out. Both non‐captured and captured LM‐PCR products were subjected to quantitative PCR to estimate the magnitude of enrichment. Each captured library was then loaded onto Hiseq2000 platform. High‐throughput sequencing was performed for each captured library to ensure that each subjects met the desired average sequencing depth (40× coverage). Raw image files were processed by Illumina base‐calling software 1.7 for base‐calling with default parameters. The sequences of each individual were generated as 90 bp pair‐end reads. With the criteria that quality score of consensus genotype is at least 20, about 20 M reads passed the quality control (QC) in each subject.
Genome‐wide genotypes for all subjects were available at 784,256 genotyped autosome markers, and were imputed into UK10K haplotype, 1,000 Genomes project phase 3, and Haplotype Reference Consortium (HRC) reference panels. All the included subjects are those who self‐reported as white (data field 21,000). Subjects who had a self‐reported gender inconsistent with the genetic gender, who were genotyped but not imputed, or who withdraw their consents were removed. A set of unrelated subjects were then sampled for subsequent analysis with KING (Manichaikul et al., 2010), based on the genome‐wide genotyped variants.
2.4. Genotype quality control
We followed strict genotype QC procedure at both individual and SNP levels. At the individual level, sex compatibility was checked by imputing sex from X‐chromosome genotype data with PLINK (Purcell et al., 2007); individuals of unclear sex or of inconsistent with reported sex were removed. At the SNP level, the SNP that violates the Hardy–Weinberg equilibrium (p value < 1.0 × 10⁻⁵) was removed. At the same time, the SNP with the Mendel error is set to the missing value.
2.5. Population stratification
To monitor and correct for potential population stratification effects, we adopted a principal component analysis (PCA)‐based correction for the detection of the discovery sample. PCA was applied to each individual sample (Zhang, Li, Pei, Liu, & Deng, 2009), and no population outliers were observed.
2.6. Meta‐analysis
Fisher's method, also known as Fisher's combined probability test, is a technique for data fusion or "meta‐analysis" (analysis of analyses). It was developed by and named for Ronald Fisher. Significant genes found in the discovery subjects were further replicated in the replication subjects. Fisher's method was then used to analyze two gene‐based association signals jointly. Specifically, Fisher's method was statistically calculated as:
where p 1 and p 2 refer to two gene‐level p‐values. Under the null hypothesis of no association, this statistic approximately follows the Chi‐square distribution with 4 degrees of freedom. Note that, Fisher's method is always valid regardless of whether the directions of two effect sizes are consistent.
2.7. Functional annotation
Functional annotation of the discovered SNPs was performed using the bioinformatics software HaploReg (Ward & Kellis, 2012). The HaploReg database provides functional information for non‐coded SNPs with multiple functional areas. The functional categories include conservation sites, DNase hypersensitivity sites (DHS), transcription factor binding sites (TFBS), promoter sites, enhancer sites, and others. We annotated these significant SNPs and their neighbor SNPs with strong linkage disequilibrium (LD) pattern (r 2 > .8).
To investigate the association between the identified SNP polymorphisms and the nearby gene expressions, we used the Genotype‐Tissue Expression (GTEx) Portal project dataset (Lonsdale et al., 2013; Westra et al., 2013a) and the Westra et al.'s study (Westra et al., 2013a) to perform cis‐eQTL analysis. The GTEx project collected and RNA‐sequenced multiple human tissues (up to 11,614) from donors who were also densely genotyped, and analyzed associations between SNPs and global RNA expression within individual tissues. We downloaded the summary results of skeletal muscle tissue from the GTEx website (V7) (https://www.gtexportal.org/home/). The Westra et al.'s study performed the largest expression quantitative trait locus (eQTL) meta‐analysis so far reported in non‐transformed peripheral blood samples of 5,311 individuals, with replication in 2,775 individuals (Westra et al., 2013b). We obtained cis‐eQTL results from the research website (http://www.genenetwork.nl/bloodeqtlbrowser/). Cis‐regulation refers to a potential functional genomic variation within or near a gene that significantly affects gene expression of a particular gene.
For candidate genes, we annotated them by constructing gene interaction networks with STRING (Szklarczyk et al., 2015). STRING uses information based on gene co‐expression, text‐mining, and others, to construct gene interactive networks.
2.8. Mouse model survey
We surveyed mouse knockout models to evaluate muscle‐related phenotypic consequence of the identified candidate genes, including changes in LBM (p < .05). We primarily searched the International Mouse Phenotyping Consortium (IMPC) database via its web portal (http://www.mousephenotype.org/) (Dickinson et al., 2016).
3. RESULTS
The basic characteristics of the subjects used in discovery sample are summarized in Table 1.
Table 1.
Basic characteristics of the study subjects
| Discovery sample (101 Chinese) | ||
|---|---|---|
| Male | Female | |
| No. of subjects | 50 | 51 |
| Age | 29.32 (3.56) | 28.80 (4.70) |
| Height (cm) | 168.31 (5.38) | 158.16 (5.89) |
| Weight (kg) | 62.18 (9.78) | 52.74 (7.54) |
| Fat body mass (kg) | 16.10(5.20) | 26.94(5.37) |
| Lean body mass (kg) | 51.26 (6.96) | 38.03 (4.79) |
WES generates 332,246 SNPs that are included in the SNP‐based association test in the discovery samples. The Bonferroni correction is used to declare the genome‐wide significance level (GWS, 0.05/332,246 = 1.5 × 10⁻⁷). No SNPs achieved GWS. The most significant SNP is rs740681 (p = 1.66 × 10⁻⁶). rs740681 is at 19p13.3; previous studies have reported that 19p13.3 was associated with LBM rs7249081 (2 × 10–14) and rs546547223 (5 × 10⁻⁶) (Hübel et al., 2019; Tachmazidou et al., 2017).
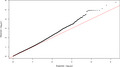
After adjusting phenotypes by PCA in each individual study, the genomic control inflation factor of the meta‐analysis was 1.142, implying limited effect of potential population stratification. A logarithmic quantile–quantile (QQ) plot of the adjusted test statistics shows a marked deviation in the tail of the distribution, implying the possible existence of true associations (Figure 1).
Figure 1.

QQ plot. Logarithmic quantile–quantile (QQ) plot of the discovery sample
We replicated the suggestive SNPs (p < 1.0 × 10⁻³) in the UKB sample. Four SNPs were significant (p ≤ .05) in the UKB sample (Table 2). The effect direction at the SNP is consistent with that in the discovery stage for phenotypes. The main association results of the consistent SNP are listed in Table 2.
Table 2.
Significant association results for SNPs
| Discovery (N up to 101) | Replication (N up to 217,822) | P combined | ||||||||||
|---|---|---|---|---|---|---|---|---|---|---|---|---|
| Beta | SE | P | Beta | SE | P | |||||||
| SNP | Chr | Pos | Band | EA/OA | Gene | |||||||
| rs740681 | 19 | 3,533,276 | 19p13.3 | G/A | FZR1 | 4,220 | 819.3 | 1.66 × 10⁻⁶ | 0.00435 | 0.000224 | 0.05 | 1.24 × 10⁻⁵ |
| rs2272303 | 12 | 53,105,721 | 12q13.13 | A/G | SOAT2 | −5514 | 1,412 | 3.20 × 10⁻⁴ | −0.0096 | 0.0027 | 3.10 × 10⁻⁴ | 1.46 × 10⁻⁵ |
| rs11170413 | 12 | 53,105,750 | 12q13.13 | A/G | SOAT2 | −5476 | 1,430 | 3.99 × 10⁻⁴ | −0.0097 | 0.0027 | 2.90 × 10⁻⁴ | 1.67 × 10⁻⁵ |
| rs2272302 | 12 | 53,105,703 | 12q13.13 | C/G | SOAT2 | −4933 | 1,387 | 9.13 × 10⁻⁴ | −0.0096 | 0.0027 | 3.10 × 10⁻⁴ | 3.67 × 10⁻⁵ |
rs740681 is located in the FZR1 (discovery p = 1.66 × 10⁻⁶, replication p = .05), rs2272303, rs11170413, and rs2272302 are located in the SOAT2 (discovery p = 3.99 × 10⁻⁴, 2.90 × 10⁻⁴, and 9.13 × 10⁻⁴, respectively; replication p = 3.10 × 10⁻⁴, 2.90 × 10⁻⁴, and 3.10 × 10⁻⁴, respectively).
Meta‐analysis p‐values are ranging from 1.24 × 10⁻⁵ to 3.67 × 10⁻⁵.
Manhattan plot of the discovery cohort is displayed in Figure 2. Regional plot of the genes FZR1 and SOAT2 are drawn by LocusZoom (Figure 3a,b, respectively).
Figure 2.
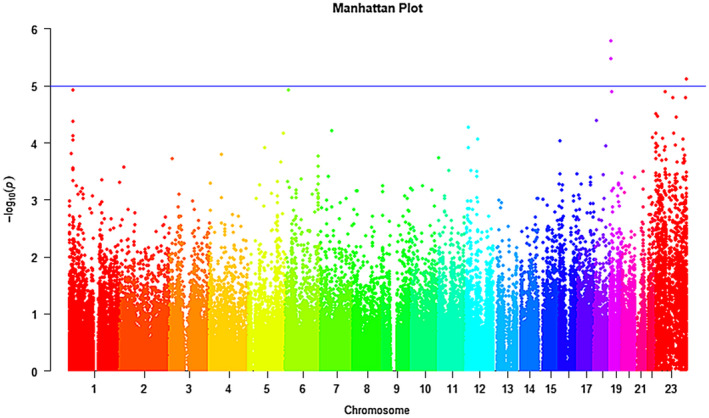
Manhattan plot of the discovery sample
Figure 3.
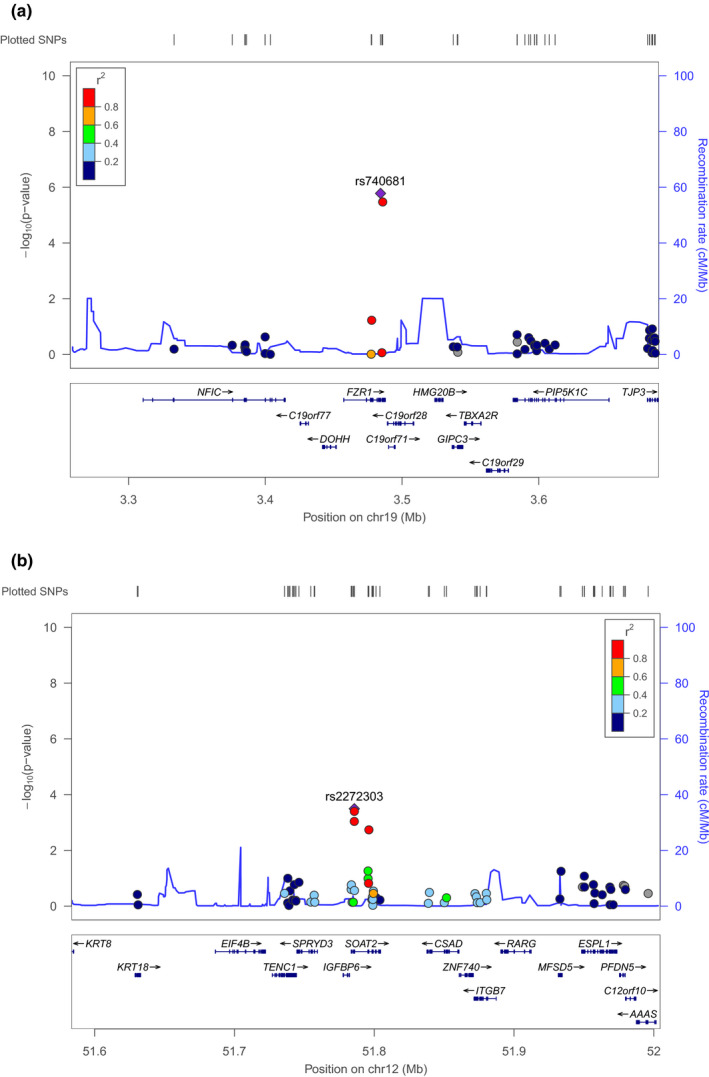
Regional plots. Regional plots of the discovery samples around genes FZR1 (a) and SOAT2 (b) are presented
3.1. Functional annotation
We annotated each of the four replicated SNPs and their neighbor SNPs (LD r 2 ≥ 0.8) with HaploReg. rs740681 is an intron INDEL variant in FZR1. It has no neighbor variant with strong LD structure. rs2272303, rs11170413, and rs2272302 are mapping to a loci: 12q13.13. The leading SNP rs1117041 has 11 SNPs in strong LD pattern, and one SNP rs2272296 has the enhancer activity marked by H3K4me1 histone mark in skeletal muscle myoblast cells, which is also significant at the discovery stage (p = 1.83 × 10⁻³).
From the skeletal muscle tissue summary results downloaded from the GTEx website (V7), we found that rs740681 shows an eQTL signal with DOHH in skeletal muscle (p = 1.80 × 10⁻¹⁴, Figure 4a). rs1170413, rs2272303, and rs2272302 show a cis‐eQTL signal with SOAT2 in Muscle‐Skeletal (p = 1.50 × 10⁻⁵, Figure 4b‐d).
Figure 4.
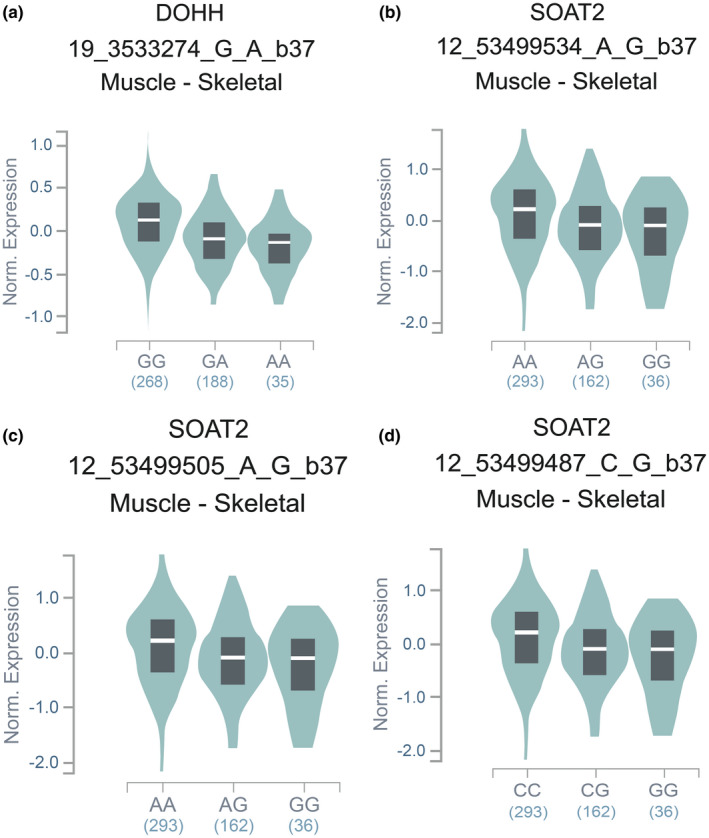
Represents an expression quantitative trait locus (eQTL) for seven significant SNPs expression in Muscle‐Skeletal from the GTEx eQTL Browser. The Y‐axis is the rank‐normalized gene expression. rs740681 shows an eQTL signal with DOHH in Muscle‐Skeletal (p = 1.80 × 10⁻¹⁴, (a)). rs1170413, rs2272303, and rs2272302 show a cis‐eQTL signal with SOAT2 in Muscle‐Skeletal (p = 1.50 × 10⁻⁵, (b) (c) (d))
In the study of peripheral blood by Westra et al, rs2272302 shows a cis‐eQTL signal with gene ITGB7 (p = 1.22 × 10⁻¹⁷).
Gene–gene interaction network analysis of FZR1 connected them to muscle‐related genes such as MYOD1, MYOG, and so on (Figure 5).
Figure 5.
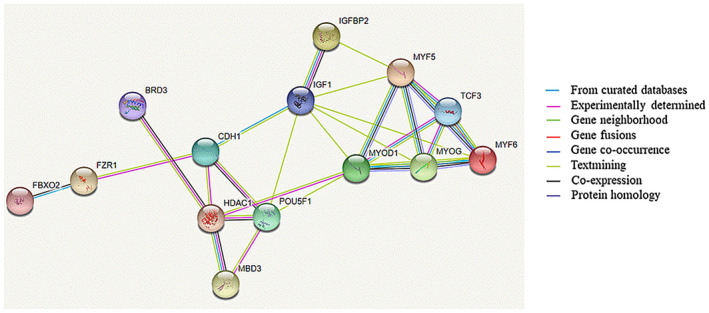
Protein–protein interactions (PPI) network of FZR1 connected them to muscle‐related genes such as MYOD1, MYOG, and so on. Proteins in the interaction network were represented with nodes, while the interaction between any two proteins therein was represented with an edge. Line color indicates the type of interaction evidence including known interactions, predicted interactions, and other. These interactions contain direct (physical) and indirect (functional) interactions, derived from numerous sources such as experimental repositories and computational prediction methods. The figure was plotted by STRING
Two genes have DXA scan results in the IMPC database. Heterozygous FZR1‐deficiency mice have increased bone mineral content (p = .01).
4. DISCUSSION
In this study, we have performed WES study in 101 unrelated Chinese samples and replicated in two GWAS analyses. Combining the evidence from both the discovery and the replication samples, we have identified novel sarcopenia risk genes.
Previous studies implicate the ubiquitin‐proteasome system (UPS) in myogenic differentiation through regulating cell cycle progression and modulating myogenic factors such as MYOD and MYF5 (Li, Wu, & Wan, 2007). Certain ubiquitin protein ligases regulate muscle differentiation, such as SKP1‐CUL1‐F‐box protein (SCF) and anaphase‐promoting complex (APC), which have been suggested to govern terminal muscle differentiation. SCF have been suggested to govern MYOD protein degradation, while APC has been suggested to control MYF5 proteolysis during the lineage of muscle differentiation (Gardrat, Montel, Raymond, & Azanza, 1997; Lindon, Albagli, Domeyne, Montarras, & Pinset, 2000; Tintignac et al., 2005).
FZR1 (fizzy and cell division cycle 20 related 1) is a substrate‐specific adapter for the anaphase promotion complex/cyclosome (APC/C) E3 ubiquitin‐protein ligase complex and activation of APC/C in anaphase and late stage. The APC/C remains active in degrading substrates to ensure that positive regulators of the cell cycle do not accumulate prematurely. FZR1 and CDH1 (cadherin 1) share the CDH1 symbol. CDH1 is sometimes used as an abbreviation for “CDC20 homolog 1”, which is an alternate name for the FZR1. CDH1 is expressed in skeletal muscle cells (Gieffers, Peters, Kramer, Dotti, & Peters, 1999; Wan & Kirschner, 2001; Yoshiyuki, Judith, Takahiko, Shirin, & Azad, 2004). Results suggest that multiple CDH1 may temporally and spatially regulate APC activity both within and outside of the cell cycle. CDH1 may affect muscle cells (Wenqi, George, & Yong, 2007). CDH1‐APC is an important ubiquitin E3 ligase that regulates muscle differentiation by coordinating cell cycle progression and initiating a myogenic differentiation program.
SOAT2 (sterol O‐acyltransferase 2) is a member of a small family of acyl coenzyme A: cholesterol acyltransferases. The gene encodes a membrane‐bound enzyme localized in the endoplasmic reticulum that produces intracellular cholesterol esters from long‐chain fatty acyl COA and cholesterol. The cholesterol esters are then stored as cytoplasmic lipid droplets inside the cell. Several alternatively spliced transcript variants of this gene have been described, but their full‐length nature is not known. It biased expression in small intestine (RPKM 4.5), duodenum. The gene has been found to be a major regulator of cholesterol metabolism and absorption factor Buhman et al., 2000). Impaired absorption of cholesterol is associated with high body mass index (BMI) and obesity (Miettinen & Gylling, 2000; Simonen, Gylling, Howard, & Miettinen, 2000).
Conclusion: By performing WES, we identified novel sarcopenia risk variants that may play roles in skeletal muscle metabolism. Our findings may provide useful information for understanding the mechanisms of sarcopenia.
CONFLICT OF INTEREST
The authors declare that they have no conflict of interest.
AUTHOR CONTRIBUTIONS
Conceived and designed the experiments: H.W.D. and J.Y.W. Performed the experiments: S.R., L.Z., and X.H. Analyzed the data: L.Z., X.H, Z.X.J., Y.X.Z., Y.L., G.S.G Q.T., and Y.H.Z. Literature search: X.H., Y.X.Z., B.L.L, and Y.L., Wrote the paper: S.R., X.H., J.Y.W., and H.W.D. All authors reviewed and approved the manuscript.
ETHICS APPROVAL AND CONSENT TO PARTICIPATE
The study was approved by the Institutional Review Boards of Creighton University, University of Missouri‐Kansas City. Before entering the study, signed informed consent documents were obtained from all the participants.
CONSENT FOR PUBLICATION
No applicable.
ACKNOWLEDGMENTS
We appreciate all the volunteers who participated in this study.
Ran S, He X, Jiang Z‐X, et al. Whole‐exome sequencing and genome‐wide association studies identify novel sarcopenia risk genes in Han Chinese. Mol Genet Genomic Med. 2020;8:e1267 10.1002/mgg3.1267
Shu Ran and Xiao He have contributed equally to this work.
On behalf of all authors, the corresponding author states that there is no conflict of interest.
Funding information
The study was partially supported by startup fund from University of Shanghai for Science and Technology and Shanghai Leading Academic Discipline Project (S30501). The investigators of this work were partially supported by grants from NIH (R01AG026564, RC2DE020756, R01AR057049, R01AR050496, and R03TW008221), a SCOR (Specialized Center of Research) grant (P50AR055081) supported by National Institute of Arthritis and Musculoskeletal and Skin Diseases (NIAMS) and the Office of Research on Women's Health (ORWH), the Edward G. Schlieder Endowment and the Franklin D. Dickson/Missouri Endowment, the National Natural Science Foundation of China (31301092 to Y.L., 31571291 to L.Z., 31501026 to Y.F.P.), and the Natural Science Foundation of Jiangsu Province (BK20150323 to Y.F.P.).
Contributor Information
Jing‐Yu Wang, Email: wangran294@sohu.com.
Hong‐Wen Deng, Email: hdeng2@tulane.edu.
DATA AVAILABILITY STATEMENT
The datasets used and/or analyzed during the current study are available from the corresponding author on reasonable request.
REFERENCES
- Arden, N. K. , & Spector, T. D. (2010). Genetic influences on muscle strength, lean body mass, and bone mineral density: A twin study. Journal of Bone & Mineral Research the Official Journal of the American Society for Bone & Mineral Research, 12(12), 2076–2081. [DOI] [PubMed] [Google Scholar]
- Baumgartner, R. N. , Koehler, K. M. , Gallagher, D. , Romero, L. , Heymsfield, S. B. , Ross, R. R. et al (1998). Epidemiology of sarcopenia among the elderly in New Mexico. American Journal of Epidemiology, 147(8), 755–763. 10.1093/oxfordjournals.aje.a009520 [DOI] [PubMed] [Google Scholar]
- Brzeszczyńska, J. , Meyer, A. , Mcgregor, R. , Schilb, A. , Degen, S. , & Tadini, V. et al (2017). Alterations in the in vitro and in vivo regulation of muscle regeneration in healthy ageing and the influence of sarcopenia. J Cachexia Sarcopenia Muscle, 9(1), 93–105. 10.1002/jcsm.12252 [DOI] [PMC free article] [PubMed] [Google Scholar]
- Buckwalter, J. A. (1995). Osteoarthritis and articular cartilage use, disuse, and abuse: Experimental studies. Journal of Rheumatology Supplement, 43(43), 13–15. [PubMed] [Google Scholar]
- Buhman, K. K. , Accad, M. , Novak, S. , Choi, R. S. , Wong, J. S. , Hamilton, R. L. , … Farese, R. V. (2000). Resistance to diet‐induced hypercholesterolemia and gallstone formation in ACAT2‐deficient mice. Nature Medicine, 6(12), 1341–1347. 10.1038/82153 [DOI] [PubMed] [Google Scholar]
- Cauley, J. A. (2015). An overview of sarcopenic obesity. Journal of Clinical Densitometry, 18(4), 499–505. 10.1016/j.jocd.2015.04.013 [DOI] [PubMed] [Google Scholar]
- Cederholm, T. , & Morley, J. E. (2015). Sarcopenia: The new definitions. Current Opinion in Clinical Nutrition and Metabolic Care, 18(1), 1–4. 10.1097/MCO.0000000000000119 [DOI] [PubMed] [Google Scholar]
- Chen, L. K. , Liu, L. K. , Woo, J. , Assantachai, P. , Auyeung, T. W. , Bahyah, K. S. et al (2014). Sarcopenia in Asia: Consensus report of the Asian Working Group for Sarcopenia. Journal of the American Medical Directors Association, 15(2), 95–101. 10.1016/j.jamda.2013.11.025 [DOI] [PubMed] [Google Scholar]
- Dickinson, M. E. , Flenniken, A. M. , Ji, X. , Teboul, L. , Wong, M. D. , White, J. K. et al (2016). High‐throughput discovery of novel developmental phenotypes. Nature, 537(7621), 508–514. 10.1038/nature19356 [DOI] [PMC free article] [PubMed] [Google Scholar]
- Fielding, R. A. , Vellas, B. , Evans, W. J. , Bhasin, S. , Morley, J. E. , Newman, A. B. et al (2011). Sarcopenia: An undiagnosed condition in older adults. current consensus definition: Prevalence, etiology, and consequences. international working group on sarcopenia. Journal of the American Medical Directors Association, 12(4), 249–256. 10.1016/j.jamda.2011.01.003 [DOI] [PMC free article] [PubMed] [Google Scholar]
- Gardrat, F. , Montel, V. , Raymond, J. , & Azanza, J. L. (1997). Proteasome and myogenesis. Molecular Biology Reports, 24(1–2), 77. [DOI] [PubMed] [Google Scholar]
- Gieffers, C. , Peters, B. H. , Kramer, E. R. , Dotti, C. G. , & Peters, J. M. (1999). Expression of the CDH1‐associated form of the anaphase‐promoting complex in postmitotic neurons. Proceedings of the National Academy of Sciences of the United States of America, 96(20), 11317–11322. 10.1073/pnas.96.20.11317 [DOI] [PMC free article] [PubMed] [Google Scholar]
- Hayashi, M. , Abe, K. , Fujita, M. , Okai, K. , & Ohira, H. (2018). Association between sarcopenia and osteoporosis in chronic liver disease. Hepatology Research, 48(11), 893–904. 10.1111/hepr.13192 [DOI] [PubMed] [Google Scholar]
- Hsu, F. C. , Lenchik, L. , Nicklas, B. J. , Lohman, K. , Register, T. C. , Mychaleckyj, J. et al (2012). Heritability of body composition measured by DXA in the diabetes heart study. Obesity Research, 13(2), 312–319. 10.1038/oby.2005.42 [DOI] [PubMed] [Google Scholar]
- Hübel, C. , Gaspar, H. A. , Coleman, J. R. , Finucane, H. , Purves, K. L. , Hanscombe, K. B. et al (2019). Genomics of body fat percentage may contribute to sex bias in anorexia nervosa. American Journal of Medical Genetics Part B: Neuropsychiatric Genetics, 180(6), 428–438. 10.1002/ajmg.b.32709 [DOI] [PMC free article] [PubMed] [Google Scholar]
- Joglekar, S. , Nau, P. N. , & Mezhir, J. J. (2015). The impact of sarcopenia on survival and complications in surgical oncology: A review of the current literature‐Author response. Journal of Surgical Oncology, 112(5):503–509. 10.1002/jso.24025 [DOI] [PMC free article] [PubMed] [Google Scholar]
- Li, W. , Wu, G. , & Wan, Y. (2007). The dual effects of Cdh1/APC in myogenesis. The FASEB Journal, 21(13), 3606–3617. 10.1096/fj.07-8159com [DOI] [PubMed] [Google Scholar]
- Lindon, C. , Albagli, O. , Domeyne, P. , Montarras, D. , & Pinset, C. (2000). Constitutive instability of muscle regulatory factor Myf5 is distinct from its mitosis‐specific disappearance, which requires a D‐box‐like motif overlapping the basic domain. Molecular & Cellular Biology, 20(23), 8923 10.1128/MCB.20.23.8923-8932.2000 [DOI] [PMC free article] [PubMed] [Google Scholar]
- Lonsdale, J. , Thomas, J. , Salvatore, M. , Phillips, R. , Lo, E. , Shad, S. et al (2013). The Genotype‐Tissue Expression (GTEx) project. Nature Genetics, 45, 580 10.1038/ng.2653 [DOI] [PMC free article] [PubMed] [Google Scholar]
- Manichaikul, A. , Mychaleckyj, J. C. , Rich, S. S. , Daly, K. , Sale, M. , & Chen, W.‐M. (2010). Robust relationship inference in genome‐wide association studies. Bioinformatics, 26(22), 2867–2873. 10.1093/bioinformatics/btq559 [DOI] [PMC free article] [PubMed] [Google Scholar]
- Miettinen, T. A. , & Gylling, H. (2000). Cholesterol absorption efficiency and sterol metabolism in obesity. Atherosclerosis, 153(1), 241–248. 10.1016/S0021-9150(00)00404-4 [DOI] [PubMed] [Google Scholar]
- Monaco, M. D. , Castiglioni, C. , Monaco, R. D. , & Tappero, R. (2017). Association between low lean mass and low bone mineral density in 653 women with hip fracture: Does the definition of low lean mass matter? Aging Clinical & Experimental Research, 29(6), 1–6. 10.1007/s40520-017-0724-9 [DOI] [PubMed] [Google Scholar]
- Purcell, S. , Neale, B. , Todd‐Brown, K. , Thomas, L. , Ferreira, M. A. , Bender, D. et al (2007). PLINK: A tool set for whole‐genome association and population‐based linkage analyses. The American Journal of Human Genetics, 81(3), 559–575. 10.1086/519795 [DOI] [PMC free article] [PubMed] [Google Scholar]
- Roubenoff, R. (2000). Sarcopenic obesity: Does muscle loss cause fat gain?: Lessons from rheumatoid arthritis and osteoarthritisa. Annals of the New York Academy of Sciences, 904(1), 553–557. 10.1111/j.1749-6632.2000.tb06515.x [DOI] [PubMed] [Google Scholar]
- Simonen, P. , Gylling, H. , Howard, A. N. , & Miettinen, T. A. (2000). Introducing a new component of the metabolic syndrome: Low cholesterol absorption. American Journal of Clinical Nutrition, 72(1), 82 10.1093/ajcn/72.1.82 [DOI] [PubMed] [Google Scholar]
- Szklarczyk, D. , Franceschini, A. , Wyder, S. , Forslund, K. , Heller, D. , Huerta‐Cepas, J. , … von Mering, C. (2015). STRING v10: Protein–protein interaction networks, integrated over the tree of life. Nucleic Acids Research, 43(D1), D447–D452. 10.1093/nar/gku1003 [DOI] [PMC free article] [PubMed] [Google Scholar]
- Tachmazidou, I. , Süveges, D. , Min, J. L. , Ritchie, G. R. , Steinberg, J. , Walter, K. et al (2017). Whole‐genome sequencing coupled to imputation discovers genetic signals for anthropometric traits. The American Journal of Human Genetics, 100(6), 865–884. 10.1016/j.ajhg.2017.04.014 [DOI] [PMC free article] [PubMed] [Google Scholar]
- Thomis, M. A. I. , Huygens, W. , Heuninckx, S. , Chagnon, M. , Maes, H. H. M. , Claessens, A. L. et al (2004). Exploration of myostatin polymorphisms and the angiotensin‐converting enzyme insertion/deletion genotype in responses of human muscle to strength training. European Journal of Applied Physiology, 92(3), 267–274. 10.1007/s00421-004-1093-6 [DOI] [PubMed] [Google Scholar]
- Tintignac, L. A. , Julie, L. , Sabrina, B. , Valentina, S. , Marie Pierre, L. , & Leibovitch, S. A. (2005). Degradation of MyoD mediated by the SCF (MAFbx) ubiquitin ligase. Journal of Biological Chemistry, 280(4), 2847–2856. 10.1074/jbc.M411346200 [DOI] [PubMed] [Google Scholar]
- Valter, S. , Andrea, B. , Massimiliano, M. , & Marco, P. (2014). Clinical definition of sarcopenia. Clinical Cases in Mineral and Bone Metabolism, 11(3), 177–180. [PMC free article] [PubMed] [Google Scholar]
- Vandewoude, M. F. , Alish, C. J. , Sauer, A. C. , & Hegazi, R. A. (2012). Malnutrition‐sarcopenia syndrome: Is this the future of nutrition screening and assessment for older adults? Journal of Aging Research, 2012, 1–8. 10.1155/2012/651570 [DOI] [PMC free article] [PubMed] [Google Scholar]
- Wan, Y. , & Kirschner, M. W. (2001). Identification of multiple CDH1 homologues in vertebrates conferring different substrate specificities. Proceedings of the National Academy of Sciences of the United States of America, 98(23), 13066–13071. 10.1073/pnas.231487598 [DOI] [PMC free article] [PubMed] [Google Scholar]
- Ward, L. D. , & Kellis, M. (2012). HaploReg: A resource for exploring chromatin states, conservation, and regulatory motif alterations within sets of genetically linked variants. Nucleic Acids Research, 40(D1), D930–D934. 10.1093/nar/gkr917 [DOI] [PMC free article] [PubMed] [Google Scholar]
- Wenqi, L. , George, W. , & Yong, W. (2007). The dual effects of Cdh1/APC in myogenesis. The FASEB Journal, 21(13), 3606–3617. 10.1096/fj.07-8159com [DOI] [PubMed] [Google Scholar]
- Westra, H. J. , Peters, M. J. , Esko, T. , Yaghootkar, H. , Schurmann, C. , & Kettunen, J. et al (2013). Systematic identification of trans eQTLs as putative drivers of known disease associations. Nature Genetics, 45(10), 1238–U195. 10.1038/ng.2756 [DOI] [PMC free article] [PubMed] [Google Scholar]
- Westra, H. J. , Peters, M. J. , Esko, T. , Yaghootkar, H. , Schurmann, C. , Kettunen, J. et al (2013). Systematic identification of trans‐eQTLs as putative drivers of known disease associations. Nature Genetics, 45(10), 1238–U195. 10.1038/ng.2756 [DOI] [PMC free article] [PubMed] [Google Scholar]
- Wolfe, R. R. (2006). The underappreciated role of muscle in health and disease. American Journal of Clinical Nutrition, 84(3), 475 10.1093/ajcn/84.3.475 [DOI] [PubMed] [Google Scholar]
- Yoshiyuki, K. , Judith, S. , Takahiko, M. , Shirin, B. , & Azad, B. (2004). Cdh1‐APC controls axonal growth and patterning in the mammalian brain. Science, 303(5660), 1026–30. 10.1126/science.1093712 [DOI] [PubMed] [Google Scholar]
- Zembroń‐Łacny, A. , Dziubek, W. , Rogowski, Ł. , Skorupka, E. , & Dąbrowska, G. (2014) Sarcopenia: Monitoring, molecular mechanisms, and physical intervention. Physiological Research, 63(6),683. [DOI] [PubMed] [Google Scholar]
- Zhang, L. , Li, J. , Pei, Y. F. , Liu, Y. , & Deng, H. W. (2009). Tests of association for quantitative traits in nuclear families using principal components to correct for population stratification. Annals of Human Genetics, 73(Pt 6), 601–13. 10.1111/j.1469-1809.2009.00539.x [DOI] [PMC free article] [PubMed] [Google Scholar]
Associated Data
This section collects any data citations, data availability statements, or supplementary materials included in this article.
Data Availability Statement
The datasets used and/or analyzed during the current study are available from the corresponding author on reasonable request.