

Abstract
Given the palpable fear generated by the threat of COVID‐19 pandemic and the bearish sentiments of stock investors, this study represents one of the first efforts towards testing the effect of COVID‐19 on the stock market returns‐inflation relationship. Specifically, the study investigates the stock market returns–inflation nexus by controlling for the effect of COVID‐19 pandemic in Nigeria from February 27, 2020 to April 30, 2020. Using the estimation procedures based on the generalized autoregressive conditional heteroskedasticity type models (GARCH (1,1), the GJR‐GARCH), and the accounting innovation tests, our results show that COVID‐19 increases volatility and distorts the positive relationship between inflation and stock market returns, which tends to negate the Fisher's hypothesis. In addition, the results reveal that the negative effects of COVID‐19 on the market returns and its disruption to the stock market returns—inflation relationship may not die away rapidly considering that the duration of the pandemic is unknown. Further, these findings are validated by the innovation accounting tests. Therefore, the study presents to policymakers the consequences of COVID‐19 and the urgent need to strengthen the market through collaborative efforts.
1. INTRODUCTION
The outbreak of the novel coronavirus (SARS‐CoV‐2) code named COVID‐19, which started in Wuhan, the capital of Hubei Province in the People's Republic of China around December 2019 has become a global pandemic, expanding rapidly across the planet with infection cases and confirmed death rates nearing five million and four hundred thousand respectively as at May18, 2020 (World Health Organization (WHO), 2020). Apart from the palpable fear that the COVID‐19 pandemic has created around the world, it has disrupted global economic activities in a manner that has never been seen since the 1918 influenza pandemic. Over a third of the global population is currently under some forms of lockdown, border closures, and extensive flight cancellations creating extreme disruptions to business and tourism (Ayittey, Ayittey, Chiwero, Kamasah, & Dzuvor, 2020). The economic consequences of the novel coronavirus include interruptions to global supply and demand chains and corresponding local food shortages, depressed asset prices, and extreme uncertainty for both multinational and local businesses (Yousef, 2020).
Of particular importance regarding the economic impact of COVID 19 is the effect of COVID‐19 pandemic on stock market volatility in the presence of bubble prices (inflation). This is because, as the uncertainties triggered by the pandemic continues, the effectiveness of policy measures coupled with negative investors sentiments and rising prices are likely to affect long‐term investment decisions. Regarding inflationary pressures, however, the Fisher (1930) hypothesis otherwise known as the “Fisher effect” states that the expected nominal stock market returns should be equal to expected inflation plus the real rate of return. In effect, the hypothesis elucidates that equity stocks represent claims against real assets of a business; and as such, may serve as a hedge against inflation (Sokpo, Iorember, & Usar, 2018). If this assertion holds, then investors could sell their financial assets in exchange for real assets when the expected rise in inflation is pronounced. In such a situation, Ioannides, Katrakilidis, and Lake (2005) posits that nominal stock prices should fully reflect expected inflation and the relationship between these two variables should be positively correlated ex‐ante. In the view of Lawal (2016), the argument of stock market returns serving as a hedge against inflation may also mean that investors are fully compensated for the rise in the general price level through corresponding increases in nominal stock market returns and thus, the real returns remain unchanged.
However, it was not too long that divergent opinions emerged challenging the Fisher hypothesis. In the 1970s, investors found that the Fisher theory faltered in the short and intermediate terms, as stock market returns were negatively related to inflation (Sharpe, 2002). Also, empirical studies by Bodie (1976), Nelson (1976), Fama and Schwert (1997), and Modigliani and Cohn (1979) all adduced empirical evidence to show an inverse relationship between stock market returns and inflation. In 1981, Fama came up with a counter‐theory known as the Proxy Hypothesis. The Proxy hypothesis commonly known as the generalized Fama proxy hypothesis argued that the assertion of a positive relationship between stock market returns and inflation was spurious, suggesting that stock market returns do not hedge against inflation.
The literature on the nexus between stock market returns and inflation is well documented. Most recently, Alqaralleh (2020) in a study on the nexus between stock market returns and inflation for the G7 countries; revisited evidence based on nonlinear ARDL, established that expansionary period increase stock market returns more than contractionary period, thereby supporting the Fisher effect. Also supporting the Fisher hypothesis, Kwofie and Ansah (2018) examined the effect of inflation on stock market returns in Ghana and found a positive long‐run relationship between inflation and stock market returns. Other studies that support the Fisher effect include Li, Balcilar, Gupta, and Chang (2016) for China and India; Kumuduni and Jameel (2016) for Colombia; Omay, Yuksel, and Yuksel (2015) for a sample of 52 countries; Mireku, Sarkodie, and Poku (2013) for Ghana; Acaravci, Acaravci, and Ozturk (2011) for Turkey; and Omotor (2010), Ibrahim and Agbaje (2013) and Olufisayo (2013) for Nigeria.
Regarding the generalized Fama proxy hypothesis on the assertion that stock market returns do not hedge against inflation, Singh and Padmakumari (2020) examine the reaction of stock market returns to the inflation announcement using time series data for India from 2012 to 2018 and found an inverse relationship between stock market returns and inflation. Similarly, other empirical studies that affirmed the Fama proxy hypothesis include Sokpo et al. (2018), Emeka and Aham (2016), Uwubanmwen and Eghosa (2015) for Nigeria; Otieno, Ngugi, and Wawire (2017) for Kenya; Silva (2016) for Sri‐Lanka; Adusei (2014) for Ghana; and Yeh and Chi (2009)) for OCED countries.
Interestingly, none of these studies controlled for any kind of pneumatic diseases such as the novel COVID‐19 pandemic or any other pandemic in recent history even though, a pandemic disease creates global health and economic crisis with disruptions on both supply and demand, the collapse of oil price, drop in the country's real GDP, causing panic trading and triggering market‐wide circuit breakers.
Arising from the above and given the palpable fear generated by the threat of COVID‐19 pandemic, this study represents one of the first efforts towards testing the effect of COVID‐19 on the stock market returns‐inflation relationship. That is, to determine whether stock market returns hedge against inflation or not in the era of the COVID‐19 pandemic? Specifically, the study aims to revisit the stock market returns—inflation relationship, controlling for the effect of COVID‐19 pandemic in Nigeria using the Generalized Autoregressive Conditional Heteroskedasticity type models (Standard GARCH and GJR‐GARCH), and the Accounting Innovation tests.
The rest of the paper is structured as follows: Section 2 focuses on data generation and method of the analysis. Section 3 discusses the empirical results and Section 4 concludes the study with policy recommendations.
2. DATA AND METHODOLOGY
2.1. Data
The data used in this study include: cases of COVID‐19 infections in Nigeria extracted from the daily situation reports published by the Nigeria Center for Disease Control (NCDC) (2020) and recorded on the WHO (2020) portal; daily stock market returns (SMR) computed from the All Share Index (ASI) data published by the Nigerian Stock Exchange (NSE) (see Equation 1); daily inflation rate (INF) decomposed from the monthly inflation rate reported by the National Bureau of Statistics (NBS). Our sample covers the period between February 27, 2020 and April 30, 2020 (64 observations) due to data availability. The February 27, 2020 base is adopted because it was the date the index case of COVI9‐19 was announced in Nigeria, while April 30, 2020 is the date for latest available inflation data in Nigeria released by the NBS.
| (1) |
where SMR denotes stock market returns, ASI denotes all shares index, t denotes time period.
2.2. Model specification and justification
Financial time series such as the stock market returns have three features that make modeling and analysis with it different from other normal time series. These include; volatility clustering, leptokurtic distribution, and leverage effect. For example, during a financial shock or crisis such as the one triggered by COVID‐19, the leverage effect (or the asymmetric quality of financial time series data) is accentuated, thereby making it impossible to model volatility by normal means, rather, time‐varying volatility models such as the ARCH or GARCH type models are used (Rastogi, 2014; Yousef, 2020). The approach of incorporating the time‐varying nature of volatility using the ARCH process was first suggested by Engle (1982). Further, the GARCH type models (GARCH, EGARCH, GJR‐GARCH, and TGARCH) were developed by Bollerslev (1986) Glosten, Jagannathan, and Runkle (1993), Franses and Dick (1996) and Franses and Dick (2000) to overcome some of the limitations of ARCH models, such as overfitting and breach of the non‐negativity constraint. To this effect, the GARCH family of models has become the standard method for modeling volatility in financial time series. This study, therefore, employs the standard GARCH—GARCH (1,1) and the GJR‐GARCH model. The GARCH (1,1) model is asymmetric model, often used as the starting point for a volatility analysis. The GJR‐GARCH on the other hand is an asymmetric model, believed to have the best fit among the competing family of the GARCH models. It has higher precision and forecasting power compared to the vanilla GARCH and others as well. It also measures the leverage or asymmetric effect which is a stylized fact of stock market returns. The general specification of the GJR‐GARCH model with inflation and COVID‐19 in the variance equation is as follows:
| (2) |
where δ is the asymmetry or leverage effect parameter, and when δ > 0, and significant; there is asymmetry or leverage effect, and negative shocks (bad news) will increase the volatility of the stock market returns more than good news. But if δ = 0, the model collapses to GARCH (1,1) indicating that there is no leverage effect. The coefficients γ 1 , λ 1 and represent the ARCH (recent news) and GARCH (old news) effects respectively. In addition, a higher value of λ 1 the GARCH coefficient implies that it will take a long time for shocks to conditional variance to dissipate or die off, suggesting that volatility is persistent. Also, if the sum of the ARCH and GARCH effects (γ 1 + λ 1) is close to 1, or relatively high, then a ‘shock’ at time t will persist, which indicates a condition known as “long memory” or persistent of the conditional variance.
Furthermore, we apply the accounting innovation tests described in and Usman, Alola, and Sarkodie (2020) and Usman, Olanipekun, Iorember, and Abu‐Goodman (2020) which consist of impulse response functions (IRFs) and forecast error variance decomposition (FEVD) to analyze the response of both stock market returns and inflation to COVID‐19 shocks to capture the short‐run dynamics of the variables.
3. RESULTS AND DISCUSSIONS
3.1. Descriptive statistics
Table 1 presents information on descriptive statistics and correlation matrix for stock market returns (SMR), coronavirus (COVID‐19), and inflation (INF). The results of the standard deviations in the descriptive statistics show that SMR and COVID‐19 are the most volatile variables compared to INF because their values are farther away from the mean. The results also show that the highest number of COVID‐19 infection cases recorded during the study period was 204. The results of the correlation matrix show a slightly strong and statistically significant correlation between SMR and INF and between INF and COVID‐19, while the correlation between SMR and COVID‐19 is weak but statistically significant. This finding excludes the risk of multicollinearity among the variables; hence, we conclude that there is no multicollinearity in the model. Figure 1 shows the time plot of the variables over the period of the study. Figure 1 further buttresses the volatile nature of SMR and COVID‐19 over time while INF rises steadily over time. Further, Figure 2 illustrates the growth rate of COVID‐19 and SMR and displays evidence of fluctuations in the variables over the study period. The initial wide negative fluctuation of SMR reflects investors’ bearish sentiments from February 27 on the announcement of the index case and the uncertainty over the impact of the regulatory and fiscal responses to the COVID‐19 pandemic.
TABLE 1.
Descriptive statistics and correlation matrix
| Descriptive Statistics | |||
|---|---|---|---|
| SMR | INF | COVID19 | |
| Mean | −0.330605 | 12.29875 | 33.43478 |
| Std. Dev. | 1.590511 | 0.047623 | 53.63235 |
| Maximum | 2.971815 | 12.38405 | 204.0000 |
| Minimum | −5.032939 | 12.22293 | 0.000000 |
| Correlation Matrix | |||
| SMR | 1 | ||
| INF | 0.514830 | 1 | |
| (0.0000) | |||
| COVID‐19 | 0.228431 | 0.679791 | 1 |
| (0.0000) | (0.0000) | ||
Source: Authors’ computation.
FIGURE 1.
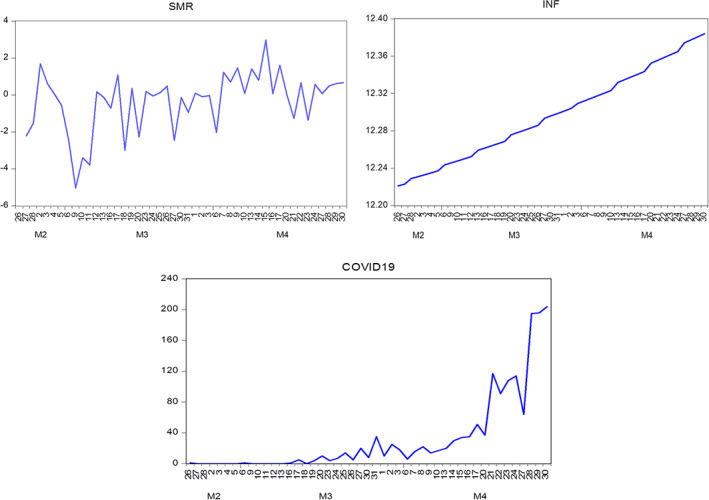
Time plot of SMR, INF, and COVID‐19 over the study period
FIGURE 2.
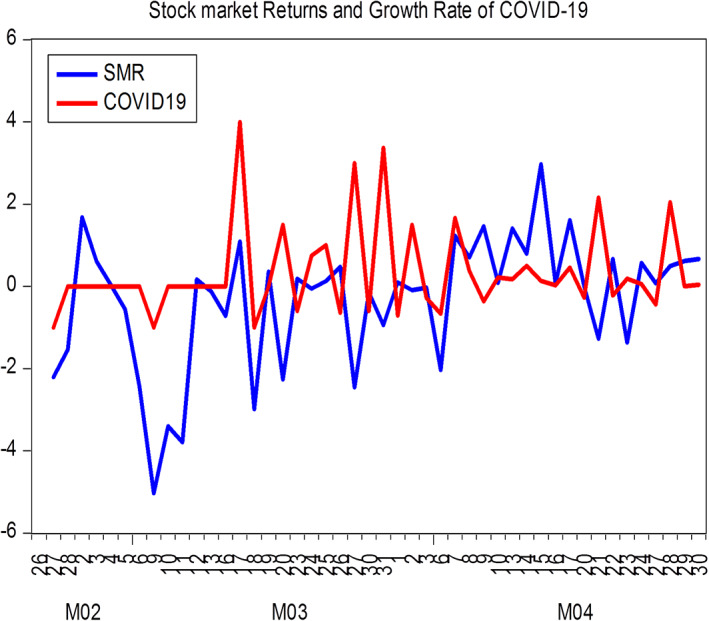
Trend analysis of stock market returns and growth rate of COVID‐19
3.2. Econometric analysis
Precursory to the application of the GARCH type models, we checked for unit root properties of the variables and establish that all the variables (SMR, INF, and COVID‐19) are stationary at both I(0) and I(1) processes. Similarly, we tested for the presence or otherwise of heteroskedasticity in the stock market returns series using the autoregressive conditional heteroskedasticity (ARCH) or ARCH effect as a pre‐requisite for using the volatility modeling approach. The result of the ARCH‐LM test as evidence in Table 2 indicates that the stock market returns series is highly volatile since the null hypothesis of no ARCH effect is rejected at 5% level of significance. This finding, therefore, permits the application of the GARCH family of models which include the standard GARCH (GARCH 1,1) and the GJR‐GARCH models for the purpose of this study.
TABLE 2.
Results of unit root and ARCH effect tests
| ADF in Levels | ADF in First Difference | ARCH Effect | |||
|---|---|---|---|---|---|
| Test Statistic | 5% CV | Test Statistic | 5% CV | LM | |
| SMR | −3.7863** | −2.9350 | −5.6012** | −2.9369 | 4.7364** |
| INF | −4.8977** | −2.9350 | −6.2890** | −2.9369 | ‐ |
| COVID_19 | −2.9764*** | −2.9350 | −4.7785** | −2.9369 | ‐ |
Note: ** indicates significance at 5% level of significance. CV implies critical values and LM stands for Lagrange multiplier.
Consequent to the results of the ARCH‐LM test which warrants the application of the GARCH type models, we proceed to estimate the mean and conditional equations of the standard GARCH (1,1) model with INF and COVID‐19 as the conditional variance regressors. The results are presented in Table 3. As expected, the results indicate that both the ARCH effect and the GARCH effect representing recent and past news respectively are statistically significant at a 5% level. This implies that both recent and past news have a significant impact on stock market returns volatility. In addition, the sum of the ARCH [γ(ARCH effect)] and GARCH [λ(GARCH effect)] effects is close to unity which suggests that the current shocks to the market returns triggered by COVID‐19 may not die off speedily but rather persist for a while considering that the duration of the pandemic is unknown. That is to say that, the stock market volatility may continue even after the scourge of the dreaded coronavirus as the bearish sentiments are expected to last a little longer.
TABLE 3.
Results of GARCH (1,1) with inflation and COVID‐19
| Coefficient | p value | |
|---|---|---|
| Conditional mean equation | ||
| μ | .5909*** | .0073 |
| Conditional variance equation | ||
| ω | .9621** | .0717 |
| γ(ARCH effect) | .2486** | .0349 |
| λ(GARCH effect) | .6213** | .0294 |
| γ + λ (Persistence) | .8699 | |
| INF | .8712** | .0286 |
| COVID‐19 | .4693*** | .0034 |
Note: *** and ** indicate 1 and 5% level of significance.
Further, the results in Table 3 indicate a positive and statistically significant impact of INF and COVID‐19 on SMRs volatility. This suggests that both INF and COVID‐19 have increased the impact of SMR volatility as investors scramble to adjust their portfolios to reflect the potential damage of the ‘virus’ to the global economy and asset prices.
Furthermore, it is observed that a shock to the stock market produces a disproportionate impact. That is, market downturns are followed by higher volatility, a scenario known as leverage effect. Leverage or asymmetric effect exists if bad news produces higher stock market volatility than good news. Since GARCH (1,1) model do not account for the leverage effect, it is imperative to consider a model that accounts for the leverage effect in the stock market volatility, hence we estimate the GJR‐GARCH (1,1) model to ascertain the leverage effect and the results are presented in Table 4. Just like the results of the GARCH (1,1) model, the asymmetric GARCH results show that INF and COVID‐19 significantly fuel stocks market returns volatility, and there is long‐memory as to the effect of the shock. Regarding the leverage effect which is the basic reason for applying the GJR‐GARCH test, the results show that the coefficient of the leverage effect is positive and statistically significant at a 5% level, which suggests the presence of leverage or an asymmetric effect. That is, a negative shock such as the current COVID‐19 pandemic and the associated INF increases SMR volatility more than a positive shock. This further shows that COVID‐19 distorts the positive relationship between stock market returns and inflation as postulated by the Fisher hypothesis but rather aligns with the Fama proxy hypothesis. This finding is consistent with the findings of Yousef (2020) which establishes that COVID‐19 increases SMR volatility across the three stocks markets (S&P500, Dow Jones, and Nasdaq) in the United States of America.
TABLE 4.
Results of GJR‐GARCH with inflation and COVID‐19
| Coefficient | p value | |
|---|---|---|
| Conditional mean equation | ||
| μ | .3027** | .0390 |
| Conditional variance equation | ||
| ω | 1.0372** | .0362 |
| δ (Leverage effect) | .5199* | .0480 |
| γ(ARCH effect) | .2671** | .0244 |
| λ(GARCH effect) | .7129*** | .0001 |
| γ + λ (Persistence) | .9799 | |
| INF | .7185** | .022 |
| COVID‐19 | .1833** | .005 |
Note: ***, ** and * indicate 1, 5 and 10% level of significance.
Table 5 presents the estimates of the VAR model. Even though the interpretations of the estimates of VAR may not be meaningful because of the theoretical nature of this model, the study relies on the forecast error variance decompositions and impulse response functions for insightful interpretation as suggested by Sim (1980) in Balcilar, Roubaud, Usman, and Wohar (2020). Based on the estimated results, the study finds positive and negative effects among the variables with evidence of statistical significance. The results of the impulse response functions (IRFs) display in Figure 3 reveal the responses of SMR to own innovation shock, INF shock, and COVID‐19 shock using a 95% confidence interval. These responses are estimated based on the period of 10 days, which are robust enough to assess the full effects of INF and COVID‐19 on the Nigeria SMR. The results show that SMR responds positively to an increase in its own innovation shock and the response is statistically significant up to the second horizon; after which it becomes insignificant. The study further observes that the response converges to its equilibrium value after the seven horizons. More so, the response of SMR to INF shock is negative and insignificant. The response becomes ineffective and neutral after five horizons. Finally, the study finds that SMR responds to COVID‐19 shock negatively over the study period. This response is ineffective during periods of first and second horizons; after which it becomes effective. The negative impact of COVID 19 on the SMR justifies the fact that it is difficult to predict with certainty the magnitude of its impact on the Nigerian economy as market analyst expects the pandemic to last longer as already established in both the GARCH(1,1) and GJR‐GARCH results.
TABLE 5.
Estimates of the VAR model
| Equations | |||||
|---|---|---|---|---|---|
| Variables | SMR | INF | COVID‐19 | ||
| SMR t − 1 |
0.0977 (0.1604) |
0.0003 (0.0002) |
0.0134 (2.3247) |
||
| SMR t − 2 |
0.2709 (0.1602) |
−0.0002 (0.0002) |
0.1018 (2.322) |
||
| INF t − 1 |
−86.156 (117.31) |
0.8315*** (0.1617) |
4,578.2*** (1700.3) |
||
| INF t − 2 |
100.11 (119.14) |
0.1843 (0.1643) |
−4,458.2*** (1726.9) |
||
| COVID19 t − 1 |
0.0018 (0.0097) |
−5.34E‐1 (1.3E‐05) |
0.5634*** (0.1405) |
||
| COVID19 t − 2 |
−0.0092 (0.0109) |
−3.22E‐1 (1.5E‐05) |
0.4688 (0.1583) |
||
| Constant |
−171.17 (118.37) |
−0.1909 (0.1632) |
−1,486.2 (1715.7) |
||
| R squared | 0.2669 | 0.9983 | 0.8684 | ||
| Adj. R squared | 0.1479 | 0.9981 | 0.8470 | ||
| F statistic | 2.2448 | 3,699.3 | 40.680 | ||
| Akaike AIC | 3.7494 | −9.4240 | 9.0969 | ||
| Schwarz SC | 4.0333 | −9.1402 | 9.3807 | ||
Note: *** denotes significance 1% while standard errors are presented in parentheses.
FIGURE 3.
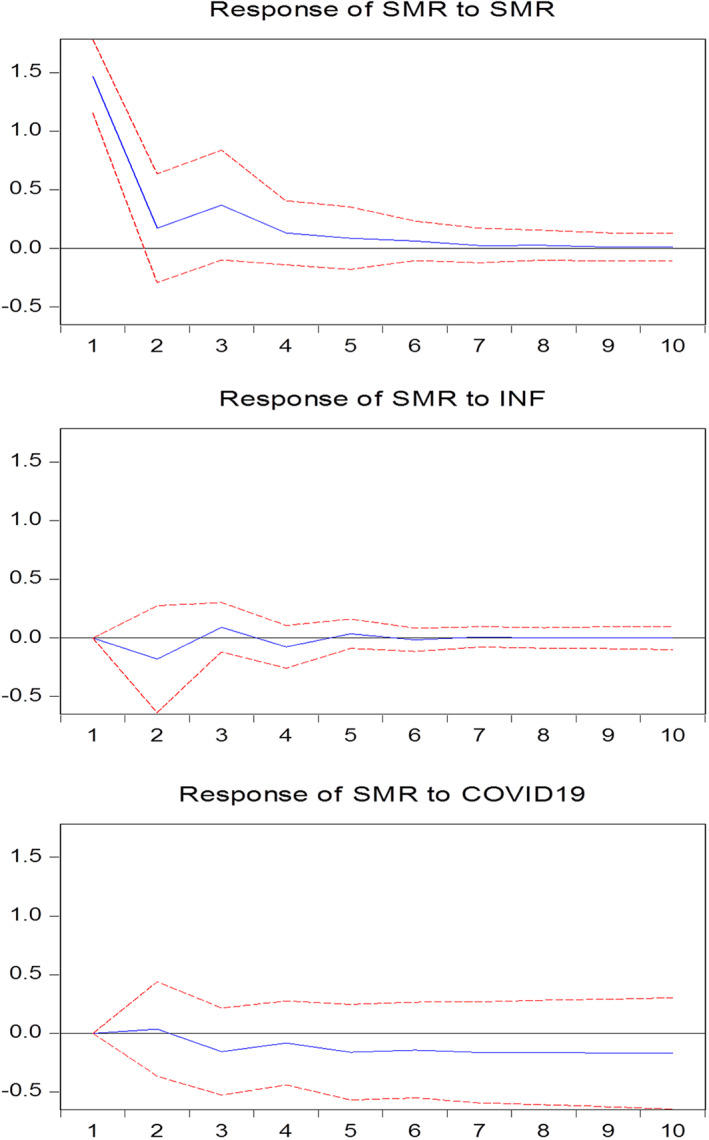
Impulse response function to inflation and COVID‐19 shocks
Further, the estimated results of the forecast error variance decomposition (FEVD) are displayed in Table 6. It shows that the contribution of SMR to own shock is 90.88%. This is followed by the contributions from COVID‐19 of 7.27%, and INF of 1.85% to the SMR forecast error variance decomposition. For INF, we find that the contribution to own shock is the largest with 92.32%, followed by COVID‐19 with 6.10% and lastly SMR with 1.58%. Finally, we observe that the contribution of COVID‐19 to own shock is 93.48% (which is the largest), followed by contributions from INF and SMR shocks of 5.94 and 0.58% respectively.
TABLE 6.
Forecast error variance decomposition
| Variance Decomposition of SMR | ||||
| Period | S.E. | SMR | INF | COVID19 |
| 1 | 1.467142 | 100.0000 | 0.000000 | 0.000000 |
| 2 | 1.488827 | 98.48509 | 1.453872 | 0.061035 |
| 3 | 1.544952 | 97.22563 | 1.697149 | 1.077224 |
| 4 | 1.554762 | 96.74465 | 1.911476 | 1.343871 |
| 5 | 1.565955 | 95.68395 | 1.939331 | 2.376720 |
| 6 | 1.573773 | 94.90944 | 1.928798 | 3.161764 |
| 7 | 1.582349 | 93.91087 | 1.911692 | 4.177437 |
| 8 | 1.590923 | 92.93157 | 1.891146 | 5.177285 |
| 9 | 1.599759 | 91.91422 | 1.870342 | 6.215438 |
| 10 | 1.608886 | 90.88101 | 1.849205 | 7.269787 |
| Variance Decomposition of INF | ||||
| Period | S.E. | SMR | INF | COVID19 |
| 1 | 0.002023 | 3.398823 | 96.60118 | 0.000000 |
| 2 | 0.002631 | 2.090842 | 97.73218 | 0.176974 |
| 3 | 0.003138 | 2.236676 | 97.40600 | 0.357329 |
| 4 | 0.003617 | 1.881154 | 97.23571 | 0.883140 |
| 5 | 0.004025 | 1.820253 | 96.78938 | 1.390365 |
| 6 | 0.004424 | 1.751342 | 96.13105 | 2.117608 |
| 7 | 0.004792 | 1.699011 | 95.37614 | 2.924850 |
| 8 | 0.005150 | 1.661148 | 94.46663 | 3.872221 |
| 9 | 0.005495 | 1.618547 | 93.45207 | 4.929385 |
| 10 | 0.005832 | 1.580026 | 92.32030 | 6.099678 |
| Variance Decomposition of COVID19 | ||||
| Period | S.E. | SMR | INF | COVID19 |
| 1 | 21.26473 | 0.035684 | 4.788704 | 95.17561 |
| 2 | 25.18841 | 0.602702 | 10.02927 | 89.36803 |
| 3 | 29.75137 | 0.522268 | 7.198011 | 92.27972 |
| 4 | 33.19393 | 0.770548 | 6.831580 | 92.39787 |
| 5 | 36.42628 | 0.641762 | 6.203465 | 93.15477 |
| 6 | 39.42475 | 0.655470 | 5.907505 | 93.43702 |
| 7 | 42.21288 | 0.608397 | 5.803977 | 93.58763 |
| 8 | 44.87181 | 0.596150 | 5.755608 | 93.64824 |
| 9 | 47.39188 | 0.582533 | 5.827666 | 93.58980 |
| 10 | 49.80896 | 0.575407 | 5.941861 | 93.48273 |
| Cholesky ordering: SMR INF COVID19 | ||||
4. CONCLUSION AND RECOMMENDATIONS
The study examines the nexus between stock market returns and inflation rate in Nigeria by accounting for the effect of the novel coronavirus (COVID‐19). The study sets out to determine whether stock market returns hedge against inflation as espoused by the Fisher (1930) hypothesis or as the reverse as established by the Fama (1981) proxy hypothesis. The study deploys the GARCH (1,1) and GJR‐GARCH as well as the accounting innovation tests on daily data from February 27, 2020 to April 30, 2020 covering the date the COVID‐19 index case was announced in Nigeria to the latest date (month) of inflation rate data. The results of the GARCH (1,1) and the GJR‐GARCH models divulge that both inflation rate and COVID‐19 cases increase stock market returns volatility. The findings of the GJR‐GARCH model as reflected in the leverage effect further establishes that the negative shock accentuated by the rising number of COVID‐19 infection cases increases volatility and distorts the positive relationship between inflation and stock market returns, implying a negation of the Fisher hypothesis and aligning with the Fama Proxy Hypothesis. More so, the results of the impulse response and the forecast error variance decomposition indicates that stock market returns responds negatively to COVID‐19 shock over the study period. The effectiveness of the response is however progressive with the passage of time, which suggests that the negative effects of COVID‐19 on the market returns and its disruption to the stock market returns—inflation relationship is one that would not die away rapidly considering that the duration of the pandemic is unknown.
The study therefore recommends the need for the fiscal and regulatory authorities to strengthen collaboration on policy measures that will stabilize and reposition the stock market to continue in its critical role of galvanizing funds for investment and stimulating growth. Some of these measures may include: activating business continuity plans and health precautionary measures to ensure that trading activities continued seamless remotely without exposing staff and traders to threat of the pandemic; issuing guidance to capital market operators and other stakeholders on the operations of the stock market activities during the pandemic, sustained monitoring of the capital market activities to ensure that high ethical standards are maintained; ensuring that relevant information continues to flow into the market space through reliable and transparent medium such as official websites, electronic and social media platforms to enable investors make informed investment decisions. In addition, the study recommends expansion of intervention measures to cover sectors such as Transportation (Aviation Sector), Hospitality and Tourism, Construction, Entertainment given that the trading activities of companies listed in these sectors on the Nigerian Stock Exchange contributes to its daily market performance (All Share Index) and Stock Market Returns.
Biographies
Gylych Jelilov is an Associate Professor of Economics at Nile University of Nigeria, Abuja. He holds a PhD in Economics and conducts research in Macro and Micro Economics, Development Economics, Public Policy, Energy economics, Renewable Energy, Environmental Economics as well as Macroeconomic modeling. He is well published in reputable scientific journals including African Development Review, Journal of Public Affairs, Energy Journal amongst others.
Paul Terhemba Iorember is a PhD Scholar in Economics from the University of Jos, Nigeria. He does research in Macroeconomics, Energy finance, Renewable Energy, Environmental Economics, International Finance, Applied Econometrics, as well as Macroeconomic modeling (Macroeconometric modeling and Computable General Equilibrium Modeling). He is well published in reputable scientific journals including African Development Review; Environmental Science and Pollution Research; Journal of Public Affairs; International Journal of Strategic Energy and Environmental Planning; American Journal of Economics, African Journal of Economic Review amongst others.
Ojonugwa Usman holds a PhD in Economics from Eastern Mediterranean University, North Cyprus. He researches in International Economics and Finance, Open Economy Macroeconomics, Energy and Environmental Economics, Corporate Governance and Applied Econometrics. He has published scientific research papers in reputable journals including Current Issues in Tourism, Journal of Environmental Management, Environmental Science and Pollution Research, Science of the total environment, African Development Review, Romanian Journal of Economic Forecasting, The World Economy, Journal of Public Affairs, amongst others.
Paul M. Yua holds a PhD in Banking and Finance from Nnamdi Azikiwe University Akwa, Nigeria. He researches in Banking and Finance, Capital and Money markets, Risk Management, Corporate Finance, Supervision and Regulation. He is well published in reputable Finance and Economic Journals.
Jelilov G, Iorember PT, Usman O, Yua PM. Testing the nexus between stock market returns and inflation in Nigeria: Does the effect of COVID‐19 pandemic matter? J Public Affairs. 2020;20:e2289. 10.1002/pa.2289
REFERENCES
- Acaravci, S. K. , Acaravci, A. , & Ozturk, I. (2011). Stock returns and inflation nexus in Turkey: Evidence from ARDL bounds testing approach. Economic Computation and Economic Cybernetics Sstudies and Research/Academy of Economic Studies, 45(3), 1–13. [Google Scholar]
- Adusei, M. (2014). The inflation‐stock market nexus: Evidence from Ghana stock exchange. Journal of Economics and International Finance, 6(2), 38–46. [Google Scholar]
- Alqaralleh, H. (2020). Stock return‐inflation nexus; revisited evidence based on nonlinear ARDL. Journal of Applied Economics, 23(1), 66–74. [Google Scholar]
- Ayittey, F. K. , Ayittey, M. K. , Chiwero, N. B. , Kamasah, J. S. , & Dzuvor, C. (2020). Economic impacts of Wuhan 2019‐nCoV on China and the world. Journal of Medical Virology, 92, 473–475. 10.1002/jmv.25706 [DOI] [PMC free article] [PubMed] [Google Scholar]
- Balcilar, M. , Roubaud, D. , Usman, O. , & Wohar, M. (2020). Testing the Asymmetric Effects of Exchange Rate Pass‐Through in BRICS Countries: Does the state of the economy matter?. The World Economy, 1–46. 10.1111/twec.12990. [DOI] [Google Scholar]
- Bodie, Z. (1976). Common stocks as a hedge against inflation. Journal of Finance, 31, 459–470. [Google Scholar]
- Bollerslev, T. (1986). Generalized autoregressive conditional heteroscedasticity. Journal of Econometrics, 31, 307–327. [Google Scholar]
- Emeka, N. , & Aham, K. V. (2016). Exchange rate and inflation and stock Price volatility: Evidence from Nigeria, 1986–2012. Journal of Applied Finance & Banking, 6(6), 57–70. [Google Scholar]
- Engle, R. F. (1982). Autoregressive conditional heteroscedasticity with estimates of the variance of United Kingdom inflation. Econometrica, 50(4), 987–1007. [Google Scholar]
- Fama, E. (1981). Stock returns, real activity, inflation and money. American Economic Review, 71(4), 545–565. [Google Scholar]
- Fama, E. F. , & Schwert, G. W. (1997). Stock market returns and inflation. Journal of Financial Economics, 5, 115–146. [Google Scholar]
- Fisher, I. (1930). The Theory of Interest Rate. New York, NY: McMillan. [Google Scholar]
- Franses, P. H. , & Dick, V. (1996). Forecasting stock market volatility using (non‐linear) GARCH models. Journal of Forecasting, 15(3), 229–235. [Google Scholar]
- Franses, P. H. , & Dick, V. (2000). Non‐linear time series models in empirical finance. New York, NY: Cambridge University Press. [Google Scholar]
- Glosten, L. R. , Jagannathan, R. , & Runkle, D. E. (1993). On the relation between the expected value and the volatility of the nominal excess return on stocks. Journal of Finance, 48, 1779–1801. [Google Scholar]
- Ibrahim, T. M. , & Agbaje, O. M. (2013). The relationship between stock return and inflation in Nigeria. European Scientific Journal, 9(4), 146–157. [Google Scholar]
- Ioannides, D. , Katrakilidis C. and Lake A. (2005). The relationship between stock market returns and inflation: An econometric investigation using Greek data. Thessaloniki, Greece, 910–916, Available at: http://conferences.telecomnbretagne.eu/asmda2005/IMG/pdf/proceedings/910.pdf [Google Scholar]
- Kumuduni Hemamala, R.K. , & Jameel, A.L.M. , (2016). Relationship between inflation and stock market return: Special reference to the Colombo stock exchange (CSE), Sri Lanka. 5thAnnual International Research Conference.Paper presented at 5th Annual International Research Conference, (40–48). [Google Scholar]
- Kwofie, C. , & Ansah, R. K. (2018). A study of the effect of inflation and exchange rate on stock market returns in Ghana. International Journal of Mathematics and Mathematical Sciences., 2018, 1–8. 10.1155/2018/7016792 [DOI] [Google Scholar]
- Lawal, E. O. (2016). Inflation and stock market returns in Nigeria: An empirical analysis. Journal of Research in Humanities and Social Sciences, 4(11), 50–56. [Google Scholar]
- Li, X. L. , Balcilar, M. , Gupta, R. , & Chang, T. (2016). The causal relationship between economic policy uncertainty and stock returns in China and India: Evidence from a bootstrap rolling window approach. Emerging Markets Finance and Trade, 52(3), 674–689. [Google Scholar]
- Mireku, K. , Sarkodie, K. , & Poku, K. (2013). Effect of macroeconomic factors on stock prices in Ghana: A vector error correction model approach. International Journal of Academic Research in Accounting, Finance and Management Sciences, 3(2), 32–43. [Google Scholar]
- Modigliani, F. , & Cohn, R. A. (1979). Inflation, rational valuation, and the market. Financial Analysts Journal, 35, 24–44. [Google Scholar]
- Nelson, C. R. (1976). Inflation and rates of return on common stocks. Journal of Finance, 31, 471–483. [Google Scholar]
- Nigeria Center for Disease Control (NCDC ) (2020). An update of COVID‐19 outbreak in Nigeria, Abuja, Nigeria: Nigeria Center for Disease Control (NCDC). Available at: https://ncdc.gov.ng/diseases/sitreps/?cat=14&name=An%20update%20of%20COVID‐19%20outbreak%20in%20Nigeria [Google Scholar]
- Olufisayo, A. O. (2013). Stock prices and inflation: Evidence from Nigeria. American Journal of Economics, 3(6), 260–267. [Google Scholar]
- Omay, T. , Yuksel, A. , & Yuksel, A. (2015). An empirical examination of the generalized fisher effect using cross‐sectional correlation robust tests for panel cointegration. Journal of International Financial Markets, Institutions and Money, 35, 18–29. [Google Scholar]
- Omotor, D. G. (2010). Relationship between inflation and stock market returns: Evidence from Nigeria. CBN Journal of Applied Statistics, 1(1), 1–15. [Google Scholar]
- Otieno, D. A. , Ngugi, R. W. , & Wawire, N. H. (2017). The global financial crisis, inflation rate and stock market returns in Kenya. European Scientific Journal, 13(19), 191–210. [Google Scholar]
- Rastogi, S. (2014). The financial crisis of 2008 and stock market volatility—analysis and impact on emerging economies pre and post crisis. Afro‐Asian Journal of Finance and Accounting, 4(4), 443–459. [Google Scholar]
- Sharpe, S. A. (2002). Re‐examining stock valuation and inflation: The implications of analysts’ earnings forecasts. The Review of Economics and Statistics, 84, 632–648. [Google Scholar]
- Silva, N. L. C. (2016). Effect of inflation on stock prices: Evidence from Sri‐Lanka. International Journal of Scientific and Engineering Research, 7(4), 1278–1279. [Google Scholar]
- Sims, C. (1980). Macroeconomics and Reality. Econometrica, 48, 1–48. [Google Scholar]
- Singh, G. , & Padmakumari, L. (2020). Stock market reaction to inflation announcement in the Indian stock market: A sectoral analysis. Cogent Economics and Finance, 8(1), 1–22. 10.1080/23322039.2020.1723827 [DOI] [Google Scholar]
- Sokpo, J. T. , Iorember, P. T. , & Usar, T. (2018). Inflation and stock market returns volatility: Evidence from the Nigerian stock exchange 1995Q1‐2016Q4: An E‐GARCH approach. International Journal of Econometrics and Financial Management, 5(2), 69–76. [Google Scholar]
- Usman, O. , Alola, A. A. , & Sarkodie, S. A. (2020). Assessment of the role of renewable energy consumption and trade policy on environmental degradation using innovation accounting: Evidence from the US. Renewable Energy, 150, 266–277. [Google Scholar]
- Usman, O. , Olanipekun, I. O. , Iorember, P. T. , & Abu‐Goodman, M. (2020). Modelling environmental degradation in South Africa: The effects of energy consumption, democracy, and globalization using innovation accounting tests. Environmental Science and Pollution Research, 27(8), 8334–8349. [DOI] [PubMed] [Google Scholar]
- Uwubanmwen, A. , & Eghosa, I. L. (2015). Inflation rate and stock returns: Evidence from the Nigerian stock market. International Journal of Business and Social Sciences, 6(11), 155–167. [Google Scholar]
- World Health Organization (WHO) (2020). Coronavirus Disease (COVID‐19) Dashboard. Available at: https://covid19.who.int/?gclid=CjwKCAjwxLH3BRApEiwAqX9arURAZiLP3UMMKE-RHX5i_WFXjfIoAM0U21i8B4tB7sEEKRMQIoVdPRoC12cQAvD_BwE.
- Yeh, C. C. , & Chi, C. F. (2009). The co‐movement and long‐run relationship between inflation and stock returns: Evidence from 12 OECD countries. Journal of Economics and Management, 5(2), 167–186. [Google Scholar]
- Yousef, I. (2020). The impact of coronavirus on stock market volatility, Jordan: University of Petra. Available at: https://www.researchgate.net/profile/Ibrahim_Yousef2/publication/341134119_The_Impact_of_Coronavirus_on_Stock_Market_Volatility/links/5eb05646299bf18b9594f1b8/The‐Impact‐of‐Coronavirus‐on‐Stock‐Market‐Volatility.pdf [Google Scholar]