Abstract
Background
A novel coronavirus called SARS‐Cov‐2, which shared 82% similarity of genome sequence with SARS‐CoV, was found in Wuhan in late December of 2019, causing an epidemic outbreak of novel coronavirus‐induced pneumonia with dramatically increasing number of cases. Several organs are vulnerable to COVID‐19 infection. Acute kidney injury (AKI) was reported in parts of case‐studies reporting characteristics of COVID‐19 patients. This study aimed at analyzing the potential route of SARS‐Cov‐2 entry and mechanism at cellular level.
Method
Single‐cell RNA sequencing (scRNA‐seq) technology was used to obtain evidence of potential route and ACE2 expressing cell in renal system for underlying pathogenesis of kidney injury caused by COVID‐19. The whole process was performed under R with Seurat packages. Canonical marker genes were used to annotate different types of cells.
Results
Ten different clusters were identified and ACE2 was mainly expressed in proximal tubule and glomerular parietal epithelial cells. From Gene Ontology (GO) & KEGG enrichment analysis, imbalance of ACE2 expression, renin‐angiotensin system (RAS) activation, and neutrophil‐related processes were the main issue of COVID‐19 leading kidney injury.
Conclusion
Our study provided the cellular evidence that SARS‐Cov‐2 invaded human kidney tissue via proximal convoluted tubule, proximal tubule, proximal straight tubule cells, and glomerular parietal cells by means of ACE2‐related pathway and used their cellular protease TMPRSS2 for priming.
Keywords: ACE2, COVID‐19, kidney, SARS‐Cov‐2, scRNA‐seq
Several organs are vulnerable to potential infection of COVID‐19 except lung, such as liver, digestive system, reproductive system and urinary system, and SARS‐CoV‐2 was separated from patients’ urine. Consequently, we hypothesized that COVID‐19 might invade human kidney causing renal injury, and this is the first study investigating the potential route of COVID‐19 leading kidney injury.

1. INTRODUCTION
In late December of 2019, a novel coronavirus was found in Wuhan (Chen et al., 2020), causing an epidemic outbreak of novel coronavirus‐induced pneumonia with dramatically increasing number of cases, 76,396 confirmed and 2,348 fatalities in China till 22nd February (She et al., 2020). It has been reported that there was 82% similarity of genome sequence between the SARS‐CoV and the novel coronavirus, which was named after SARS‐Cov‐2 by WHO (Chan et al., 2020; Van de Werf et al., 2012). This theory might indicate that SARS‐Cov‐2 infected human being via the same pathway as SARS‐CoV, ACE2 (OMIM # 300335), and using cellular protease TMPRSS2 (OMIM #602060) for priming (Hoffmann et al., 2020).
Apart from acute respiratory distress syndrome (ARDS) due to lung infection, other organs were revealed the potential risk of different human organs vulnerable to SARS‐Cov‐2 infection, such as lung, heart, digestive tract, and male reproductive system (Chai et al., 2020; Wang & Xu, 2020; Zhang et al., 2020; Zou et al., 2020). From a recent 138 hospitalized patients’ study, five acute kidney injury (AKI) (5/138, 3.6%) cases were reported, which might be caused by entry of SARS‐Cov‐2 through ACE2 receptor resulting in kidney injury (Wang et al., 2020). Although previous studies (Mizuiri & Ohashi, 2015) had reported ACE2 is expressed mainly in proximal tubules and glomeruli with the function of synthesis of inactive angiotensin 1–9 (Ang 1–9) from Angiotensin I (Ang I) and catabolism of Ang II to produce angiotensin 1–7 (And 1–7), which reduces vasoconstriction, water retention, salt intake, cell proliferation, reactive oxygen stress, and renoprotective effect. However, as the functional complexity of these structures appears to be associated with different cell types, the expression level, and function of ACE2 in different cell types of human kidney is still unclear.
According to the study reporting kidney injury cases, direct effect of virus was suspected (Wang et al., 2020), and Academician Nanshan, Zhong, leader of high‐level steering team dealing with outbreak of COVID‐19 in China, declared that virus of COVID‐19, SARS‐Cov‐2, was separated from patients’ urine sample (Le, Knoedler, & Roberge, 2020). However, the potential route of SARS‐Cov‐2 entry and mechanism of kidney injury base on cellular level is unclear. Consequently, we hypothesize that SARS‐Cov‐2 may enter kidney by ACE2‐related pathway leading kidney injury. In this study, based on public databases, single‐cell RNA sequencing (scRNA‐seq) technology was used to obtain evidences of potential route of SARS‐Cov‐2 entry and underlying pathogenesis of kidney injury in COVID‐19 patients.
2. MATERIALS AND METHODS
2.1. Ethical compliance
This study does not include any participant or animal subjects so that the ethical compliance is not applicable.
2.2. Data sources
Gene expression matrix of normal human kidney were obtained from Gene Expression Omnibus (https://www.ncbi.nlm.nih.gov/geo/). scRNA‐seq raw data were obtained from Liao et al. (2020) (GSE131685), containing 23,366 high‐quality cells from three normal human kidney samples.
2.3. scRNA‐seq data processing and quality control
Whole process was performed under R (version 3.6.2) and the raw data of gene expression matrix was converted into Seurat object via the Seurat package of R (version 3.1.3). Average was acquired in the situation of duplicated gene expressions and low‐quality cells which had either expressed genes less than 200 or higher than 2500, or mitochondrial gene expression exceeded 30% were excluded for following analysis. Then, we visualized the relationships between the percentage of mitochondrial genes and mRNA reads, and between the number of mRNAs and the reads of mRNA. After that, remaining gene expression matrices were normalized and top 2,000 variable genes were selected for downstream analysis.
2.4. Principal component analysis (PCA) and dimensional reduction
Seurat CellCycleScoring function was administered to diminish the error in cell clustering since different phases of cell may interfere the following procedure and cell clustering results. All data were scaled to weight for downstream analysis and RunPCA function was used to determine PCs. By the visualization of JackStraw plot and Elbow plot, top 20 PCs were selected, and RunHarmony was adopted to eliminating batch effect as much as possible. RunUMAP as well as FindNeighbors function with harmony reduction was chosen and FindClusters with resolution of 0.25 was performed to identify different clusters.
2.5. Annotation of clusters and identification of ACE2 expression
Marker genes were found via FindAllMarkers function with threshold of 0.25 and annotation was performed based on the canonical marker genes provided by previous studies (Chabardès‐Garonne et al., 2003; Chen, Cheung, Shi, Zhou, & Lu, 2018; Habuka et al., 2014; Lee, Chou, & Knepper, 2015; Nakagawa et al., 2002; Park et al., 2018; Shankland, Smeets, Pippin, & Moeller, 2014; Young et al., 2018). After cell type identification, violin plot as well as feature plot were visualized to identify the ACE2 expression in each cluster. Also, human protein atlas of ACE2 was accessed in order to acquire more evidence ascertaining the expression level of ACE2 in kidney cells (https://www.proteinatlas.org/). In addition, co‐expression analysis was performed with normalized cluster matrices data. Pearson's correlation test was administered between each gene in single‐cell transcriptome and ACE2. Significantly top 200 ACE2 co‐expressed genes (p value <0.05) were collected for following downstream Gene Ontology (GO) as well as Kyoto Encyclopedia of Genes and Genomes (KEGG) enrichment analysis (p value <0.05), with the corresponding databases of Carlson M (2019). org.Hs.eg.db, and STRINGI, respectively.
3. RESULTS
3.1. Identification of cell types
After quality control and data normalization among three human kidney samples (baseline characteristics of three samples are documented in Table S1) (Liao et al., 2020), a total of 17,528 RNA features and 23,367 cells were retained for downstream analysis (detail of initial sequencing data is shown in Figure S1). Uniform Manifold Approximation and Projection (UMAP) was used for dimensional reduction for 23,367 high‐quality cells and 10 different clusters were obtained eventually (Figure 1a). In order to reduce interference of cell clustering due to diverse phase in a cell cycle, CellCycleScoring function was used and visualization of no bias induced by cell cycle genes was observed (Figure 1b). According to differential expressed genes in each cluster (Table S2) and canonical marker genes provided by Liao et al. (Table S3), 10 clusters were annotated as proximal convoluted tubule cells, proximal tubule cells, proximal straight tubule cells, glomerular parietal epithelial cells, NK‐T cells, monocytes, distal tubule cells, collecting duct principal cells, B cells, and collecting duct intercalated cells, respectively.
Figure 1.
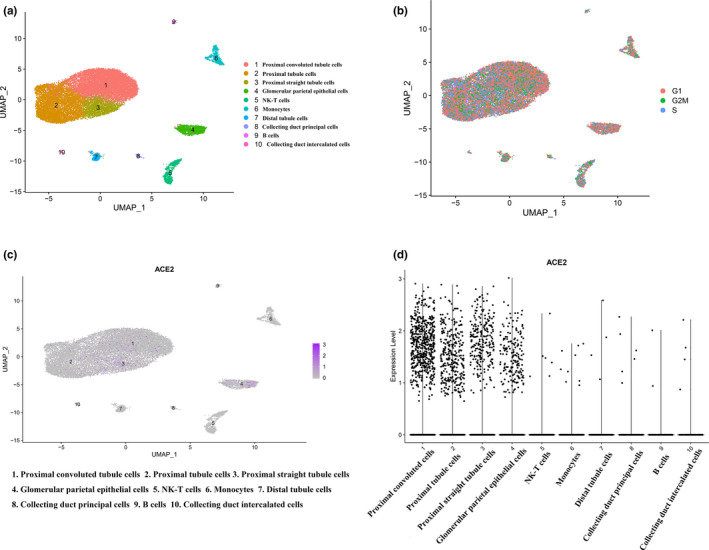
Results from scRNA‐seq analysis. (a) Uniform manifold approximation and projection (UMAP) plot of samples revealing the different clusters of renal cells. (b) UMAP plot indicating different cluster with demonstration of different cell cycles. (c) Expression of ACE2 in different clusters of cells. (d) Violin plot showing the ACE2 expression in different clusters of cells. scRNA, single‐cell RNA sequencing
3.2. Specific expression of ACE2
ACE2 expression level in each cluster was identified by violin plot as well as scatter plot with reduction of UMAP, revealing that ACE2 was predominantly expressed in proximal convoluted tubule cells, proximal tubule cells, proximal straight tubule cells, and glomerular parietal epithelial cells, respectively (Figure 1c,d). The human protein atlas of ACE2 in kidney cells indicated that a majority of ACE2 expression located in proximal convoluted and straight cells (Figure 2). As we discussed in introduction, SARS‐Cov‐2 entered human body via ACE2‐related pathway using cellular protease TMPRSS2 for priming (Hoffmann et al., 2020). We additionally determined the expressing level of TMPRSS2 in each cell cluster and, it was mainly expressed in cluster one to four and seven to eight (Figure S2), which are proximal convoluted tubule, proximal tubule, proximal straight tubule cells and glomerular parietal epithelial cells, distal tubule cells, and collecting duct principal cells, respectively. Therefore, with the intersection of ACE2 expressing level in each cell clusters and corroborative evidence from human protein atlas of ACE2, it furtherly provided substantial evidence to ascertain the potential entry pathway of SARS‐Cov‐2 by invading proximal tubule cells as well as glomerular parietal epithelial cells and, it gave a latent theory of SARS‐Cov‐2 replicating within these cells by using cellular protease TMPRSS2 for priming.
Figure 2.
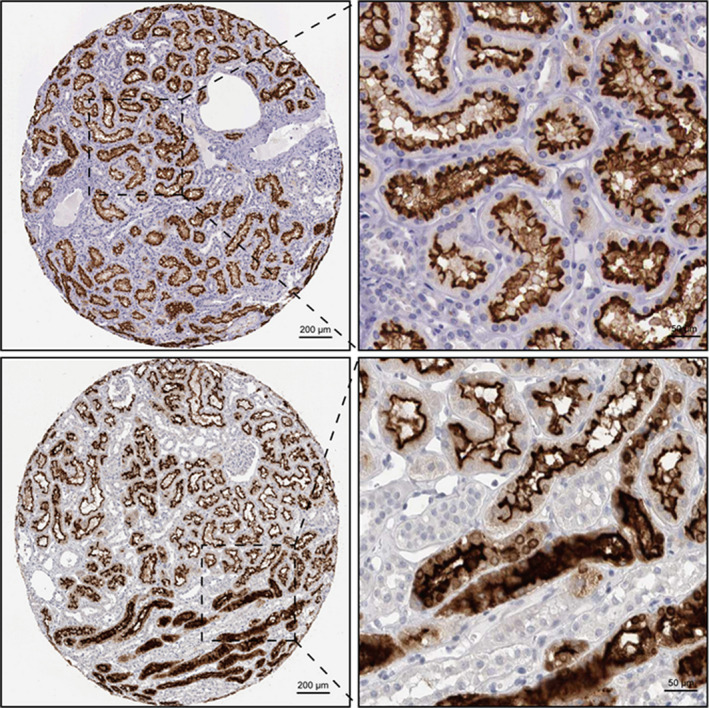
Human protein atlas showing the expression level of ACE2. (Shade of brown indicates the expression level: darker indicates high‐level expression and lighter indicates low level expression)
3.3. GO & KEGG analysis of ACE2 co‐expression genes
Pearson's correlation test was administered between ACE2 and cluster one to four to obtain significantly positive or negative co‐expressed genes (p value <0.05). Top 200 positive and negative co‐expressed genes (top 50 is listed in Table 1) were selected to downstream GO and KEGG analysis (Complete ACE2 co‐expressed genes are documented in Table S4).
Table 1.
Positive and negative co‐expression gene of ACE2
| Cluster 1 (+) | Cluster (−) | Cluster 2 (+) | Cluster 2 (−) | Cluster 3 (+) | Cluster 3 (−) | Cluster 4 (+) | Cluster 4(−) |
|---|---|---|---|---|---|---|---|
| TMBIM6 | RPS29 | MTRNR2L1 | RPL21 | FAM118A | GSTP1 | GPRIN2 | EIF1 |
| CLDN2 | RPL21 | PSAP | MT1H | THSD4 | MT1E | SAPCD1‐AS1 | HLA‐B |
| DPEP1 | RPS27 | MTRNR2L10 | RPL41 | SLC22A7 | TMSB10 | GAB1 | B2M |
| NAT8 | RPL41 | MTRNR2L8 | RPS27 | GLYATL1 | ACTG1 | TTLL7 | RPL18 |
| HSP90B1 | RPL12 | TMBIM6 | RPS29 | DCXR | KIFC3 | STS | ARHGDIB |
| SLC27A2 | RPS26 | EPCAM | RPL12 | ABHD14A | NEAT1 | MFSD2A | RPL4 |
| ITM2B | RPS4Y1 | MTRNR2L6 | RPL39 | BTG2 | ITGAV | EPDR1 | TMSB4X |
| MTRNR2L1 | FXYD2 | SLC3A1 | MT1G | NRSN2‐AS1 | CHMP4A | FARP2 | RPS3 |
| SPINT2 | MT1G | GAL3ST1 | RPL26 | ASPHD2 | WFDC2 | C9orf116 | RPL41 |
| APOM | RPL26 | CDH16 | MT1F | NAT8 | MYL6 | LINC00526 | HLA‐A |
| CLTRN | MT1H | MTRNR2L11 | ATP5F1E | MYH8 | PTPN1 | SPTBN4 | EVL |
| SLC22A6 | UQCRQ | SLC27A2 | POLR2L | CYP4A11 | MBD4 | SBSPON | TRBC2 |
| CYBA | S100A1 | PTH1R | MT2A | AZGP1 | POLR2J3 | ENPP7 | |
| TMED10 | UQCR11 | GMFG | COX7C | MSRB1 | SOX4 | SH3BGRL2 | |
| GADD45A | RARRES3 | APOM | RPS4Y1 | PCK1 | GPAT4 | MGAM | |
| STARD9 | MIF | ATP1A1 | IFITM3 | MTRNR2L1 | CGNL1 | ST6GALNAC3 | |
| TPT1 | FABP3 | PLG | FXYD2 | DEPDC1 | LRRFIP1 | NFASC | |
| FOLR1 | S100A11 | ERRFI1 | UBA52 | F11‐AS1 | IFITM3 | KLHL29 | |
| RTN4 | NDUFA13 | SLC22A6 | RPL31 | RBP4 | PPP1R14B | EMILIN1 | |
| SLC3A1 | DAB2 | BHMT | MT1E | GSTA2 | PSMD12 | TANC1 | |
| SLC13A3 | SVIP | CYBA | RPS26 | GSTA5 | TAX1BP3 | PLA2R1 | |
| CTBP1‐AS | RPL39 | SLC22A11 | NDUFB1 | SMIM24 | ABHD11 | PARD3B | |
| MTRNR2L8 | ATP5ME | PCK1 | UQCR11 | CARMN | AC124319.1 | COL4A3 | |
| CUBN | RPL31 | AZGP1 | MIR4458HG | ACVR1 | RABIF | MYRIP | |
| PSAP | PSME1 | PCP2 | TMSB10 | AKR7A3 | CITED4 | TNNC1 | |
| SERPINI1 | RPS8 | CYP4F2 | RPS2 | MIOX | EPS15 | RBP1 | |
| AQP1 | SYF2 | GRK4 | RPS15A | RTN4 | MIEN1 | PLOD2 | |
| FAM151A | NDUFA1 | ADAMTSL5 | SKP1 | MTRNR2L10 | THBS1 | APOD | |
| GGH | PCP4 | DDC | PPDPF | GPT | RDH11 | BASP1 | |
| ATP1A1 | POLR2L | FBXL6 | PDCD5 | GADD45A | ARHGAP35 | SPOCK1 | |
| SLC6A19 | RPL36A | CES2 | RPLP2 | ARHGAP24 | GOLGA2 | LRP11 | |
| SLC22A2 | RPL37A | IWS1 | APEX1 | RGN | WDR83 | MAGI2 | |
| C18orf54 | ATP5MF | ATP6V0B | CCDC58 | ARFGEF3 | EXOSC7 | BGN | |
| SMIM24 | COX7C | ADIRF | MACROD1 | ALDH2 | MBNL1 | WT1 | |
| TMEM59 | NDUFA3 | MEPCE | SULT1A1 | MPC1 | BNC2 | CDC42EP2 | |
| NACA2 | OST4 | PDIA3 | NME1 | ATP1B1 | NKAIN4 | ZNF385A | |
| CDHR2 | NIPSNAP2 | ASAH1 | IL32 | SEC14L2 | RNPC3 | DCN | |
| FN3K | MICOS10 | MTRNR2L12 | RPS19 | EHMT2‐AS1 | C3 | RHBDF1 | |
| GOLGA8A | TOMM5 | NAT8 | MTLN | FMO5 | EIF4A3 | VASN | |
| PLXNA3 | HSPA1B | AGT | RPL19 | GGH | YPEL3 | ZNF423 | |
| AUP1 | DCDC2 | IRX5 | RPS28 | SLC39A5 | SNX6 | TPPP3 | |
| SLC3A2 | OXT | ZNF786 | RPL23A | TMEM176B | POLR2L | CA10 | |
| APOE | RPL17 | PTN | PSMA2 | CERCAM | ZSCAN16‐AS1 | NPHS1 | |
| SARAF | WFDC2 | ABHD14A | S100A1 | RNF165 | MT‐ND4 |
CLIP3 |
|
| SPP1 | ATP5MPL | SPINT2 | CAPG | GC | ANXA4 | CXADR | |
| AZGP1 | DYNC1I2 | SEC23IP | AC026462.3 | PLCH2 | VPS35 | UACA | |
| CD63 | MT1E | FN3K | EIF3J | ADIRF | BNIP2 | CDK2AP1 | |
| AMN | AL359555.4 | DHRS7B | PCP4 | TEX51 | RAB6A | PPP1R14C | |
| MAGEE1 | S100A10 | ZBTB8A | NOB1 | EPHA1‐AS1 | MIR29B2CHG | HAAO | |
| MTRNR2L10 | RGS14 | IMPDH1 | ATP5ME | EXTL3‐AS1 | PAFAH1B3 | CDC42BPB |
Top 50 genes of each (Total co‐expression genes could be checked in supplementary file).
“+” indicates positive co‐expressed genes of ACE2.
“−” indicates negative co‐expressed genes of ACE2.
Regarding to cluster 1, proximal convoluted tubule cells, material transportation processes (e.g. CLN3 [OMIM #607042], SLC7A2 [OMIM #601872], SLC2A6 [OMIM #606813], NPC2 [OMIM #601015]), transportation‐related activity, and cellular components (e.g. PCYOX1 [OMIM #610995], TIMM23B [OMIM #605034], SLC2A6, SLC9A3 [OMIM #182307]), and neutrophil‐mediated immunity (e.g. METTL7A [OMIM #618338], DYNLL1 [OMIM #601562], S100P [OMIM #600614], CST3 [OMIM #604312]) were enriched in positive co‐expressed GO analysis (Figure 3a) and, renin‐angiotensin system (RAS) was revealed significance in KEGG pathway analysis (Figure 3c). For negative co‐expressed genes, viral transcription and expression, mRNA catabolic processes (e.g. RPS29 [OMIM #603633], RPL21 [OMIM #603636], RPS27 [OMIM #603702], RPL41 [OMIM #613315]) were enriched in GO analysis (Figure 3b), and ribosome as well as oxidative phosphorylation pathway were enriched in KEGG analysis (Figure 3d).
Figure 3.
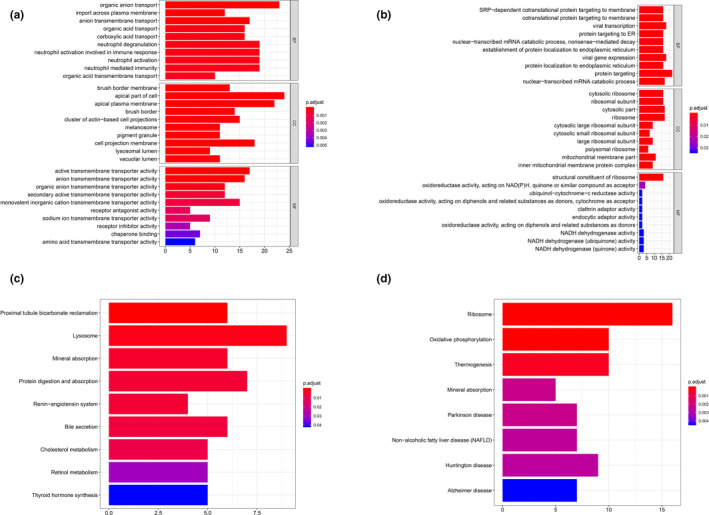
GO & KEGG analysis of cluster 1. (a) GO analysis of positive top 200 co‐expression genes of ACE2 in cluster 1. (b) GO analysis of negative co‐expression genes of ACE2 in cluster 1. (c) KEGG analysis of positive top 200 co‐expression genes of ACE2 in cluster 1. (d) KEGG analysis of negative top 200 co‐expression genes of ACE2 in cluster 1. GO, Gene Ontology
In cluster 2, proximal tubule cells, except material transportation enriched biological processes as cluster 1, neutrophil activation, immune‐related responses and degranulation (e.g. MLEC [OMIM #613802], CTSH [OMIM #116820], PRCP [OMIM #176785], UNC13D [OMIM #608897]) were enriched for positive co‐expression GO terms (Figure 4a), and lysosome‐related pathway was shown in KEGG analysis (Figure 4c). Contrarily, in negative co‐expression enrichment, viral gene transcription, expression, and translational initiation were dominant in GO analysis (e.g. RPL21, RPL41, RPS27, RPS29) (Figure 4b), while in KEGG analysis, ribosome‐related pathway was enriched (Figure 4d).
Figure 4.
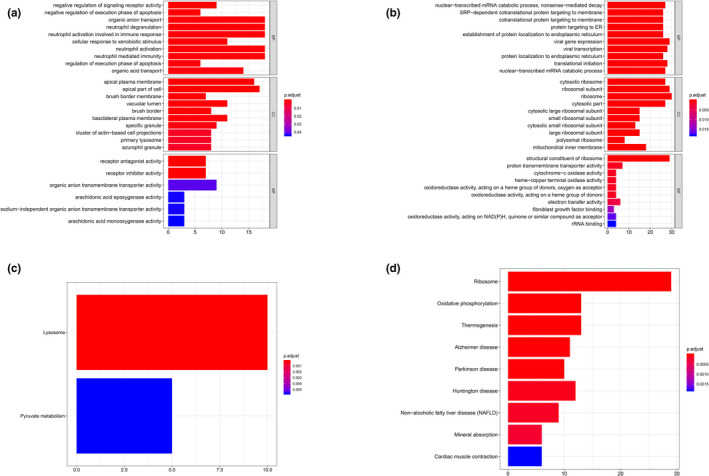
GO & KEGG analysis of cluster 2. (a) GO analysis of positive top 200 co‐expression genes of ACE2 in cluster 2. (b) GO analysis of negative co‐expression genes of ACE2 in cluster 2. (c) KEGG analysis of positive top 200 co‐expression genes of ACE2 in cluster 2. (d) KEGG analysis of negative top 200 co‐expression genes of ACE2 in cluster 2. GO, Gene Ontology
When it comes to proximal straight tubule cells of cluster 3, material catabolic and metabolic process (e.g. AGXT2 [OMIM #612471], ASRGL1 [OMIM #609212], HPD [OMIM #609695], HYAL1 [OMIM #607071]) were predominantly enriched GO terms in top 200 positive co‐expressed genes (Figure 5a) with peroxisome proliferators‐activated receptors (PPAR) signaling pathway KEGG analysis shown in Figure 5c. Nevertheless, for negative co‐expressed genes, RNA‐related catabolic processes and regulation (e.g. PSMD12 [OMIM #604450], EXOSC7 [OMIM #606488], EIF4A3 [OMIM #608546], PSMD13 [OMIM #603481]) were mainly enriched for GO terms (Figure 5b) while there was no significant KEGG pathway could be obtained.
Figure 5.
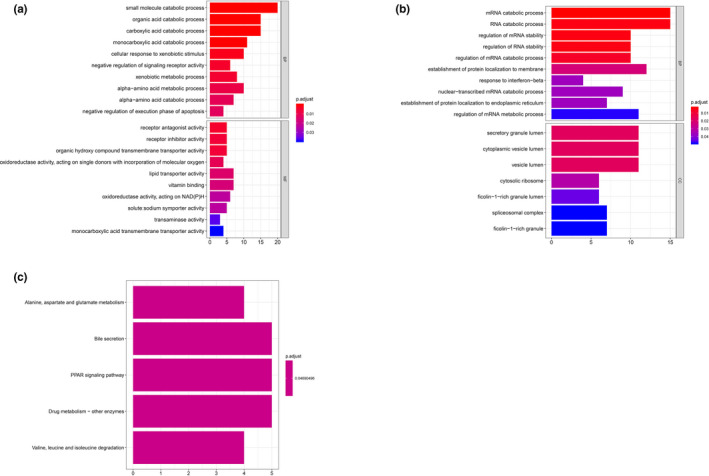
GO & KEGG analysis of cluster 3. (a) GO analysis of positive top 200 co‐expression genes of ACE2 in cluster 3. (b) GO analysis of negative co‐expression genes of ACE2 in cluster 3. (c) KEGG analysis of positive top 200 co‐expression genes of ACE2 in cluster 3. (d) KEGG analysis of negative top 200 co‐expression genes of ACE2 in cluster 3. GO, Gene Ontology
For glomerular parietal epithelial cells of cluster 4, renal cell differentiation, urogenital system development, and extracellular structure organization (e.g. CDKN1C [OMIM #600856], BMP7 [OMIM #112267], MME [OMIM #120520], LAMA5 [OMIM #601033])‐related GO terms were enriched among positive co‐expressed genes (Figure 6a) and, protein digestion as well as absorption pathway were enriched for KEGG‐related analysis (Figure 6c). Conversely, among negative co‐expressed genes GO analysis, translational‐related processes and antigen presentation processes (e.g. EIF1 [OMIM #300186], RPL18 [OMIM #604179], HLA‐B [OMIM #142830], B2 M [OMIM #109700], HLA‐A [OMIM #142800]) were enriched GO terms (Figure 6b), while ribosome and viral infection‐related pathways were enriched in KEGG analysis (Figure 6d).
Figure 6.
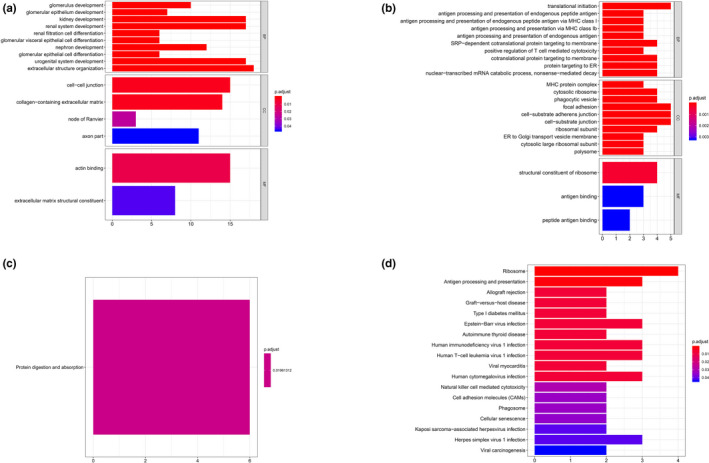
GO & KEGG analysis of cluster 4. (a) GO analysis of positive top 200 co‐expression genes of ACE2 in cluster 4. (b) GO analysis of negative co‐expression genes of ACE2 in cluster 4. (c) KEGG analysis of positive top 200 co‐expression genes of ACE2 in cluster 4. (d) KEGG analysis of negative top 200 co‐expression genes of ACE2 in cluster 4. GO, Gene Ontology
4. DISCUSSION
According to previous study (Chiu, 2003; Yeung et al., 2016), two categories of coronavirus, SARS‐CoV and MERS‐CoV had been reported to damaged kidney through immunocompromise and induced apoptosis of renal cells. Although the exact evidence for kidney injury caused by COVID‐19 has not been estimated, several infected patients’ studies revealed the potential risk of kidney vulnerable to be damaged due to SARS‐Cov‐2 virus direct effect. Wang et al. (2020) reported five AKI cases in total of 138 patients, Huang et al. (2020) reported three AKI cases which were all in intensive condition, Guan et al. (2020) reported six AKI patients among total of 1,099 patients, and three patients with creatinine level greater than 133 μmol/L, indicating suspecting kidney injury, in total of 62 patients outside Wuhan were reported by Xu et al. (2020). Hypothesis of virus direct effect resulting in kidney damage was suspected within the abovementioned case‐studies and, more importantly, based on our study results of scRNA‐seq in human kidney, potential route for COVID‐19 leading kidney damage via ACE2 was estimated.
ACE2 participates in the synthesis and catabolism of Ang II that induces inflammation, cell growth, mitogenesis, apoptosis, and regulates the gene expression of bioactive substances, all of which might exacerbate to renal tissue injury. Moreover, ACE2 inhibition was reported to be associated with increasing albumin excretion and worsen glomerular injury (Soler, Wysocki, & Batlle, 2008), which was confirmed by an experimental study using exogenous human recombinant ACE2 to slow the progression of chronic kidney disease by reducing in albumin excretion (Oudit et al., 2010). As we known, catabolism of Ang II to produce Ang 1–7 is the main function of ACE2, while renal damage or disorder may happen with increasing Ang II (Ruiz‐Ortega et al., 2006). Thus, the imbalance expression level of ACE2 accelerates the renal damage.
Furthermore, RAS could be a potential pathway influencing on renal injury progression via mitogen‐active protein kinase (MAPK)‐mediated apoptosis, NF‐κB‐mediated inflammation, and redox imbalance promoting oxidative stress (Gnudi, Coward, & Long, 2016; Newsholme, Cruzat, Keane, Carlessi, & de Bittencourt, 2016; Sharma, Anders, & Gaikwad, 2019). A literature speculated that compromised kidney perfusion and altered intrarenal hemodynamics balance attributed to systemic and intrarenal RAS activation may be the critical pathogenic factors (Matejovic et al., 2016). From our GO & KEGG analysis, RAS was a significant pathway in ACE2 co‐expressed gene enrichment, which might indicate one of the potential mechanisms of COVID‐19 damage to kidney. Interestingly, neutrophil‐mediated immunity was detected in almost positive co‐expressed genes analysis. SARS‐Cov‐2 invasion to kidney via ACE2 may interfere immunity response, which was a underlying mechanism similar to SARS‐CoV damage to kidney by immunocompromise (Chiu, 2003). Glomerulus was also a potential target for SARS‐Cov‐2 according to our scRNA‐seq data, and the GO enrichment of glomerulus was associated with development, such as glomerulus development, nephron development, even though kidney development, which may be a pathogenic factor for the exacerbation of patient kidney's status.
To the best of our knowledge, no specific medication could be used to against COVID‐19 but symptomatic treatment would be the predominant strategy. Occurrence of AKI is the most frequent renal‐related complication in COVID‐19 patients, which increases the risk factor for mortality. From above discussion, dealing with ACE2 expression imbalance and RAS activation would be the main issues. Recombinant ACE2 was reported to be effective in slowing the progression of kidney disease by reducing albumin excretion and modulating RAS depressor arm (AT2R, ACE2, Ang 1–7) by ACE2 activator or AT2R agonist might protect the kidney from renal injury (Oudit et al., 2010; Sharma, Malek, Mulay, & Gaikwad, 2019), which may provide potential clues for clinicians encountering COVID‐19 patients, especially complicated with kidney injury. However, the abovementioned mechanism of kidney injury in COVID‐19 infection should be verified in experiment under precise experimental design.
5. CONCLUSION
This study speculated that SARS‐Cov‐2 invaded proximal convoluted tubule, proximal tubule, proximal straight tubule cells, and glomerular parietal epithelial cells by means of ACE2 receptor and damaging kidney tissue through ACE2 imbalance and RAS activation, which offers substantial clues for clinical practice dealing with renal‐related complications caused by COVID‐19.
CONFLICT OF INTEREST
All authors declared no conflicts of interest to disclose.
AUTHOR CONTRIBUTIONS
The detailed contributions of each authors are listed as followed: Qiyu He: conceptualization, methodology, data analysis, manuscript writing. Tsz Ngai Mok: methodology, data analysis, manuscript writing. Liang Yun: investigation. Chengbo He: technical support of data processing. Jieruo Li: supervision, conceptualization, professional suggestion and revision. Jinghua Pan: supervision, conceptualization, professional suggestion and revision.
Supporting information
Fig S1
Fig S2
Table S1
Table S2
Table S3
Table S4
ACKNOWLEDGMENT
There is no other technical or financial support that should be acknowledged and all participants of this study have been included in the authors list.
He Q, Mok TN, Yun L, He C, Li J, Pan J. Single‐cell RNA sequencing analysis of human kidney reveals the presence of ACE2 receptor: A potential pathway of COVID‐19 infection. Mol Genet Genomic Med. 2020;8:e1442 10.1002/mgg3.1442
Qiyu He, Tsz N. Mok, Jieruo Li and Jinghua Pan have contributed equally to this research.
Contributor Information
Jieruo Li, Email: ilorugaie@163.com.
Jinghua Pan, Email: huajanve@foxmail.com.
REFERENCES
- Chabardès‐Garonne, D. , Mejéan, A. , Aude, J. C. , Cheval, L. , Di Stefano, A. , Gaillard, M. C. , … Elalouf, J. M. (2003). A panoramic view of gene expression in the human kidney. Proceedings of the National Academy of Sciences of the United States of America, 100(23), 13710–13715. 10.1073/pnas.2234604100 [DOI] [PMC free article] [PubMed] [Google Scholar]
- Chai, X. , Hu, L. , Zhang, Y. , Han, W. , Lu, Z. , Ke, A. , Lan, F. (2020). Specific ACE2 expression in cholangiocytes may cause liver damage after 2019‐nCoV infection. bioRxiv. 10.1101/2020.02.03.931766 [DOI] [Google Scholar]
- Chan, J.‐F.‐W. , Kok, K.‐H. , Zhu, Z. , Chu, H. , To, K.‐K.‐W. , Yuan, S. , & Yuen, K.‐Y. (2020). Genomic characterization of the 2019 novel human‐pathogenic coronavirus isolated from a patient with atypical pneumonia after visiting Wuhan. Emerging Microbes & Infections, 9(1), 221–236. 10.1080/22221751.2020.1719902 [DOI] [PMC free article] [PubMed] [Google Scholar]
- Chen, J. , Cheung, F. , Shi, R. , Zhou, H. , & Lu, W. (2018). PBMC fixation and processing for Chromium single‐cell RNA sequencing. Journal of Translational Medicine, 16(1), 198 10.1186/s12967-018-1578-4 [DOI] [PMC free article] [PubMed] [Google Scholar]
- Chen, N. , Zhou, M. , Dong, X. , Qu, J. , Gong, F. , Han, Y. , … Zhang, L. (2020). Epidemiological and clinical characteristics of 99 cases of 2019 novel coronavirus pneumonia in Wuhan, China: A descriptive study. Lancet, 395(10223), 507–513. 10.1016/s0140-6736(20)30211-7 [DOI] [PMC free article] [PubMed] [Google Scholar]
- Chiu, M. C. (2003). Suggested management of immunocompromized kidney patients suffering from SARS. Pediatric Nephrology (Berlin, Germany), 18(12), 1204–1205. 10.1007/s00467-003-1325-8 [DOI] [PMC free article] [PubMed] [Google Scholar]
- Gnudi, L. , Coward, R. J. M. , & Long, D. A. (2016). Diabetic nephropathy: Perspective on novel molecular mechanisms. Trends in Endocrinology and Metabolism, 27(11), 820–830. 10.1016/j.tem.2016.07.002 [DOI] [PubMed] [Google Scholar]
- Guan, W.‐J. , Ni, Z.‐Y. , Hu, Y. , Liang, W.‐H. , Ou, C.‐Q. , He, J.‐X. , Zhong, N.‐S. (2020). Clinical characteristics of 2019 novel coronavirus infection in China. medRxiv. 10.1101/2020.02.06.20020974 [DOI] [Google Scholar]
- Habuka, M. , Fagerberg, L. , Hallström, B. M. , Kampf, C. , Edlund, K. , Sivertsson, Å. , … Odeberg, J. (2014). The kidney transcriptome and proteome defined by transcriptomics and antibody‐based profiling. PLoS One, 9(12), e116125 10.1371/journal.pone.0116125 [DOI] [PMC free article] [PubMed] [Google Scholar]
- Hoffmann, M. , Kleine‐Weber, H. , Krüger, N. , Müller, M. , Drosten, C. , & Pöhlmann, S. (2020). The novel coronavirus 2019 (2019‐nCoV) uses the SARS‐coronavirus receptor ACE2 and the cellular protease TMPRSS2 for entry into target cells. bioRxiv. 10.1101/2020.01.31.929042 [DOI] [Google Scholar]
- Huang, C. , Wang, Y. , Li, X. , Ren, L. , Zhao, J. , Hu, Y. , … Cao, B. (2020). Clinical features of patients infected with 2019 novel coronavirus in Wuhan, China. The Lancet, 395(10223), 497–506. 10.1016/S0140-6736(20)30183-5 [DOI] [PMC free article] [PubMed] [Google Scholar]
- Le, B. , Knoedler, M. , & Roberge, G. (2020). Intraprostatic injection of tranexamic acid to control refractory bleeding while maintaining therapeutic anticoagulation. Urology Case Reports, 28, 100914 10.1016/j.eucr.2019.100914 [DOI] [PMC free article] [PubMed] [Google Scholar]
- Lee, J. W. , Chou, C. L. , & Knepper, M. A. (2015). Deep sequencing in microdissected renal tubules identifies nephron segment‐specific transcriptomes. Journal of the American Society of Nephrology, 26(11), 2669–2677. 10.1681/asn.2014111067 [DOI] [PMC free article] [PubMed] [Google Scholar]
- Liao, J. , Yu, Z. , Chen, Y. , Bao, M. , Zou, C. , Zhang, H. , … Mo, Z. (2020). Single‐cell RNA sequencing of human kidney. Scientific Data, 7(1), 4 10.1038/s41597-019-0351-8 [DOI] [PMC free article] [PubMed] [Google Scholar]
- Matejovic, M. , Ince, C. , Chawla, L. S. , Blantz, R. , Molitoris, B. A. , Rosner, M. H. , … Ronco, C. (2016). Renal hemodynamics in AKI. In search of new treatment targets. Journal of the American Society of Nephrology, 27(1), 49–58. 10.1681/asn.2015030234 [DOI] [PMC free article] [PubMed] [Google Scholar]
- Mizuiri, S. , & Ohashi, Y. (2015). ACE and ACE2 in kidney disease. World Journal of Nephrology, 4(1), 74–82. 10.5527/wjn.v4.i1.74 [DOI] [PMC free article] [PubMed] [Google Scholar]
- Nakagawa, J. , Ishikura, S. , Asami, J. , Isaji, T. , Usami, N. , Hara, A. , … Kitamura, K. (2002). Molecular characterization of mammalian dicarbonyl/L‐xylulose reductase and its localization in kidney. Journal of Biological Chemistry, 277(20), 17883–17891. 10.1074/jbc.M110703200 [DOI] [PubMed] [Google Scholar]
- Newsholme, P. , Cruzat, V. F. , Keane, K. N. , Carlessi, R. , & de Bittencourt, P. I. Jr. (2016). Molecular mechanisms of ROS production and oxidative stress in diabetes. The Biochemical Journal, 473(24), 4527–4550. 10.1042/bcj20160503c [DOI] [PubMed] [Google Scholar]
- Oudit, G. Y. , Liu, G. C. , Zhong, J. , Basu, R. , Chow, F. L. , Zhou, J. , … Scholey, J. W. (2010). Human recombinant ACE2 reduces the progression of diabetic nephropathy. Diabetes, 59(2), 529–538. 10.2337/db09-1218 [DOI] [PMC free article] [PubMed] [Google Scholar]
- Park, J. , Shrestha, R. , Qiu, C. , Kondo, A. , Huang, S. , Werth, M. , … Suszták, K. (2018). Single‐cell transcriptomics of the mouse kidney reveals potential cellular targets of kidney disease. Science, 360(6390), 758–763. [DOI] [PMC free article] [PubMed] [Google Scholar]
- Ruiz‐Ortega, M. , Ruperez, M. , Esteban, V. , Rodriguez‐Vita, J. , Sanchez‐Lopez, E. , Carvajal, G. , & Egido, J. (2006). Angiotensin II: A key factor in the inflammatory and fibrotic response in kidney diseases. Nephrology, Dialysis, Transplantation, 21(1), 16–20. 10.1093/ndt/gfi265 [DOI] [PubMed] [Google Scholar]
- Shankland, S. J. , Smeets, B. , Pippin, J. W. , & Moeller, M. J. (2014). The emergence of the glomerular parietal epithelial cell. Nature Reviews Nephrology, 10(3), 158–173. 10.1038/nrneph.2014.1 [DOI] [PubMed] [Google Scholar]
- Sharma, N. , Anders, H. J. , & Gaikwad, A. B. (2019). Fiend and friend in the renin angiotensin system: An insight on acute kidney injury. Biomedicine & Pharmacotherapy, 110, 764–774. 10.1016/j.biopha.2018.12.018 [DOI] [PubMed] [Google Scholar]
- Sharma, N. , Malek, V. , Mulay, S. R. , & Gaikwad, A. B. (2019). Angiotensin II type 2 receptor and angiotensin‐converting enzyme 2 mediate ischemic renal injury in diabetic and non‐diabetic rats. Life Sciences, 235, 116796 10.1016/j.lfs.2019.116796 [DOI] [PubMed] [Google Scholar]
- She, J. , Jiang, J. , Ye, L. , Hu, L. , Bai, C. , & Song, Y. (2020). 2019 novel coronavirus of pneumonia in Wuhan, China: emerging attack and management strategies. Clinical and Translational Medicine, 9(1), 19 10.1186/s40169-020-00271-z [DOI] [PMC free article] [PubMed] [Google Scholar]
- Soler, M. J. , Wysocki, J. , & Batlle, D. (2008). Angiotensin‐converting enzyme 2 and the kidney. Experimental Physiology, 93(5), 549–556. 10.1113/expphysiol.2007.041350 [DOI] [PubMed] [Google Scholar]
- Van de Werf, F. , Brueckmann, M. , Connolly, S. J. , Friedman, J. , Granger, C. B. , Härtter, S. , … Noack, H. (2012). A comparison of dabigatran etexilate with warfarin in patients with mechanical heart valves: The Randomized, phase II study to evaluate the safety and pharmacokinetics of oral dabigatran etexilate in patients after heart valve replacement (RE‐ALIGN). American Heart Journal, 163(6), 931–937.e931. 10.1016/j.ahj.2012.03.011 [DOI] [PubMed] [Google Scholar]
- Wang, D. , Hu, B. , Hu, C. , Zhu, F. , Liu, X. , Zhang, J. , … Peng, Z. (2020). Clinical Characteristics of 138 Hospitalized Patients With 2019 Novel Coronavirus–Infected Pneumonia in Wuhan, China. JAMA. 10.1001/jama.2020.1585 [DOI] [PMC free article] [PubMed] [Google Scholar]
- Wang, Z. & Xu, X. (2020). scRNA‐seq profiling of human testes reveals the presence of ACE2 receptor, a target for SARS‐CoV‐2 infection, in spermatogonia, leydig and sertoli cells. Cells. Preprints 2020, 10.20944/preprints202002.0299.v1 [DOI] [PMC free article] [PubMed] [Google Scholar]
- Xu, X. W. , Wu, X. X. , Jiang, X. G. , Xu, K. J. , Ying, L. J. , Ma, C. L. , … Li, L. J. (2020). Clinical findings in a group of patients infected with the 2019 novel coronavirus (SARS‐Cov‐2) outside of Wuhan, China: retrospective case series. BMJ, 368, m606 10.1136/bmj.m606 [DOI] [PMC free article] [PubMed] [Google Scholar]
- Yeung, M. L. , Yao, Y. , Jia, L. , Chan, J. F. , Chan, K. H. , Cheung, K. F. , … Yuen, K. Y. (2016). MERS coronavirus induces apoptosis in kidney and lung by upregulating Smad7 and FGF2. Nature Microbiology, 1, 16004 10.1038/nmicrobiol.2016.4 [DOI] [PMC free article] [PubMed] [Google Scholar]
- Young, M. D. , Mitchell, T. J. , Braga, F. A. V. , Tran, M. G. , Stewart, B. J. , Ferdinand, J. R. , … Loudon, K. W. (2018). Single‐cell transcriptomes from human kidneys reveal the cellular identity of renal tumors. Science, 361(6402), 594–599. [DOI] [PMC free article] [PubMed] [Google Scholar]
- Zhang, H. , Kang, Z. , Gong, H. , Xu, D. , Wang, J. , Li, Z. , Xu, H. (2020). The digestive system is a potential route of 2019‐nCov infection: a bioinformatics analysis based on single‐cell transcriptomes. bioRxiv. 10.1101/2020.01.30.927806 [DOI] [Google Scholar]
- Zou, X. , Chen, K. , Zou, J. , Han, P. , Hao, J. , & Han, Z. (2020). The single‐cell RNA‐seq data analysis on the receptor ACE2 expression reveals the potential risk of different human organs vulnerable to Wuhan 2019‐nCoV infection. Frontiers of Medicine. 10.1007/s11684-020-0754-0 [DOI] [PMC free article] [PubMed] [Google Scholar]
Associated Data
This section collects any data citations, data availability statements, or supplementary materials included in this article.
Supplementary Materials
Fig S1
Fig S2
Table S1
Table S2
Table S3
Table S4


