

Abstract
Following the announcement of the first coronavirus disease 2019 (COVID‐19) case on 11 March 2020 in Turkey, we aimed to report the coinfection rates, and the clinical, laboratory, radiological distinctive features of viral pneumonia caused by viruses other than severe acute respiratory syndrome coronavirus 2 (SARS‐CoV‐2). A cross‐sectional study was conducted between 18 and 31 March 2020. COVID‐19 suspected cases admitted to pandemic policlinic, who had nasopharyngeal swab specimens tested for both SARS‐CoV‐2 and other respiratory viral pathogens, were included. Among 112 patients, SARS‐CoV‐2 was detected in 34 patients (30%). Among the non–SARS‐CoV‐2 viruses (n = 25, 22%), metapneumovirus (n = 10) was the most frequent agent. There were two coinfections with SARS‐CoV‐2. Sputum was less in the SARS‐CoV‐2 group (P = .003). The leukocyte, lymphocyte, and thrombocyte count and C‐reactive protein levels were the lowest in the SARS‐CoV‐2 group (P < .001, P = .04, P < .001, P = .007, respectively). Peripheral involvement (80% vs 20%; P ≤ .001), pure ground‐glass opacity (65% vs 33%; P = .04), apicobasal gradient (60% vs 40%; P = .08), involvement of greater than or equal to three lobes (80% vs 40%; odds ratio: 6.0; 95% confidence interval: 1.33‐27.05; P = .02), and consolidation with accompanying ground‐glass opacity (4% vs 33%; P = .031) were more common in SARS‐CoV‐2 group. Some clinical, laboratory, and radiological findings may help in the differential diagnosis of non–SARS‐CoV‐2 viruses from COVID‐19. However, coinfections may occur, and a non–SARS‐CoV‐2 pathogen positivity does not exclude accompanying COVID‐19.
Keywords: COVID‐19, non–SARS‐CoV‐2 viruses, SARS‐CoV‐2, viral pneumonia
Highlights
Non SARS‐CoV‐2 viruses have some clinical, laboratory and radiological distinctive parameters from SARS CoV‐2. However, it should always be considered that co‐infections may develop in the clinical course of COVID‐19.
1. INTRODUCTION
On 31 December 2019, China announced a novel coronavirus, soon named as severe acute respiratory syndrome coronavirus 2 (SARS‐CoV‐2) by the International Committee on Taxonomy of Viruses (ICTV), as the causative agent of these clusters of unknown pneumonia, 1 , 2 which eventually evolved to a worldwide pandemic. 3
The spectrum of SARS‐CoV‐2‐originated human disease named as coronavirus disease 2019 (COVID‐19) changes from little to no symptoms to severe pneumonia and acute respiratory distress syndrome. 4 Gastrointestinal, cardiovascular, and musculoskeletal involvement may also occur; however, the most common presentation is respiratory symptoms like cough, shortness of breath, and fever. Nevertheless, these symptoms are highly nonspecific and may arise due to any respiratory pathogens of bacteria or viruses. 5 Such respiratory pathogens include influenza, respiratory syncytial virus (RSV), and other previously known human coronaviruses like alphacoronaviruses 229E and NL63, the betacoronaviruses OC43 and HKU1, as well as atypical bacteria. They may also cause mild respiratory symptoms and severe pneumonia. 6
On 11 March 2020, the first patient with COVID‐19 was reported in Turkey. During the following weeks, patients were evaluated according to the national definition of COVID‐19, anyone with respiratory system symptoms and/or fever and history of travel abroad or contact with a confirmed COVID‐19 patient within the previous 14 days, were accepted as a probable COVID‐19 case. Respiratory tract specimens were collected and a diagnostic algorithm including SARS‐CoV‐2 real‐time polymerase chain reaction (RT‐PCR) was performed. On 18 March 2020, the first COVID‐19 patient was determined by a positive RT‐PCR test for SARS‐CoV‐2 and typical symptoms in our hospital. In the meantime, other respiratory pathogens continued to be detected by the syndromic multiplex PCR assay in patients admitted to the hospital.
Reports from China demonstrated that the coinfection of SARS‐CoV‐2 with other respiratory pathogens were rare. 7 The confirmation of non–SARS‐CoV‐2 viruses may aid in the differential diagnosis of COVID‐19. The Centers for Disease Control and Prevention also encourages testing for other respiratory pathogens in the diagnostic work of suspected COVID‐19 cases. 8
Under these conditions, it was aimed to report the coinfection rates, the prevalence, clinical, laboratory, and radiological characteristics of non–SARS‐CoV‐2 respiratory pathogens in a teaching hospital organized as a pandemic hospital immediately at the beginning of the pandemic in Turkey.
2. METHODS
In this cross‐sectional study between 18 and 31 March, 112 COVID‐19 suspected cases were evaluated. Probable COVID‐19 case was defined as patients with respiratory system symptoms and/or fever and history of travel to abroad or contact with a confirmed COVID‐19 patient within the previous 14 days or severe pneumonia needing hospitalization, according to the Republic of Turkey Ministry of Health guidelines, version 11 March (https://covid19bilgi.saglik.gov.tr/tr/covid-19-rehberi.html). Demographic and laboratory data such as complete blood count, C‐reactive protein (CRP), and procalcitonin were searched and recorded from the electronic records of the hospital database after obtaining necessary permissions and ethical approval (No: 2020/11‐33; 1 June 2020). Patients with nasopharyngeal swab specimens tested for SARS‐CoV‐2 and other respiratory pathogens were included.
2.1. Diagnostic tests
The diagnostic testing included, upon sample receipt, a rapid molecular test for the most common respiratory pathogens as well as SARS‐CoV‐2 testing based on the protocol released by the World Health Organization. 9
2.2. Molecular assays for respiratory pathogens
Nucleic acid extraction was performed by EZ‐1 virus mini kit using EZ‐1Advanced XL platform (Qiagen). A syndromic panel‐based multiplex RT‐PCR assay was used for amplification and detection of the following human pathogens: influenza A virus, influenza B virus, rhinovirus, coronaviruses (NL63, 229E, OC43, HKU1), parainfluenza viruses (1‐4), metapneumoviruses (A/B), bocavirus, RSVs (A/B), adenovirus, enterovirus, parechovirus, and Mycoplasma pneumonia (FTD Respiratory Pathogens 21; Fast Track Diagnostics, Luxembourg). The assay was performed on the RotorGene Q 5plex HRM.
2.3. Severe acute respiratory syndrome coronavirus 2
SARS‐CoV‐2 RNA was tested by a one‐step real‐time RT‐PCR assay targeting viral RdRp (Biospeedy SARS CoV‐2 qPCR Detection Kit, Bioeksen, Turkey) provided by MoH. The test was performed on the RotorGene Q 5plex HRM. Human RNase P gene amplification was used as an internal control.
2.4. Chest computerized tomography image acquisition and interpretation
A 64‐channel multidetector CT scanner (Brilliance; Philips Medical Systems) was used with an imaging protocol as follows: 120 kVp, 80 mA, slice thickness 1 mm, and high‐spatial‐frequency reconstruction algorithm (bone algorithm), without intravenous contrast medium. Chest computerized tomography (CT) images of all patients in axial and coronal reformate slices were evaluated by 14 years of an experienced board‐certified radiologist.
All scans were reviewed for the presence and characteristics of pulmonary infiltrates. Ground‐glass opacification was defined as hazy, increased lung attenuation with preservation of the bronchial and vascular margins, and consolidation was defined as opacification with obscuration of the margins of vessels and airway walls. 10 The location of the infiltration (the right upper, middle, right lower, left upper or left lower lobes, or any combination of these), the distribution of the infiltration (peripheral, bronchocentric, central, diffuse, centrilobular, paramediastinal, or any combination of these), and the presence of an apicobasal gradient in the distribution of the infiltration were recorded. Presence of irregular reticulations, cavitation, and vascular dilatation within the infiltration; the presence of crazy paving sign, reversed halo sign, tree‐in‐bud sign, airway changes (bronchial dilatation, bronchial wall thickening, endobronchial secretions), pleural effusion, pleural thickening, and lymphadenopathy were evaluated. A size cut‐off of 15 mm short‐axis diameter was used for subcarinal lymph nodes and a 10 mm short‐axis diameter was used for others. CT images were also evaluated for accompanying pulmonary pathologies such as emphysema, bronchiectasis, interstitial fibrosis, pulmonary edema, and malignancy.
For CT diagnosis of COVID‐19‐associated pneumonia, CT scans were classified according to Radiological Society of North America (RSNA) expert consensus statement on reporting chest CT findings related to COVID‐19 as follows: (a) negative for pneumonia, (b) typical appearance, (c) atypical appearance, and (d) indeterminate appearance. 11
2.5. Statistical analyses
Data were analyzed with SPSS software (Statistical Package for the Social Sciences, version 22.0; SSPS Inc, Chicago, IL). Mean and standard deviation or median and minimum‐maximum values were used according to the distribution of the data. For parametric evaluations, one‐way analysis of variance was performed. Categorical data were evaluated using χ 2 or Fisher's exact test. P < .05 was considered significant.
3. RESULTS
A total of 1035 patients were admitted to pandemic policlinic, and 112 (11%) patients were evaluated by nasopharyngeal swabs for both SARS‐CoV‐2 and other common viral pathogens within the given period. The mean age was 45.21 ± 16.79, and 58 (52%) were men. Thirty‐nine (35%) were managed outside the hospital, 67 (60%) were hospitalized to ward, and 6 (5%) to intensive care. The initial diagnosis was upper respiratory tract infection in 37 (33%) and pneumonia in 72 (63%) of the patients, and four (4%) patients had no symptoms and/or laboratory and radiological findings. Forty‐one (37%) of the patients had comorbidity, hypertension as the most common one (n = 25, 22%). Six patients (5%) presented with severe pneumonia and all lost their lives. Among the patients who did not survive, two had metapneumovirus, one rhinovirus, and three SARS‐CoV‐2.
Age, sex, and accompanying comorbidities were not different among the non–SARS‐CoV‐2, non–SARS‐CoV‐2‐detected, and nonidentified etiology groups. Approximately one‐third of COVID‐19 patients defined a contact history. COVID‐19 patients presented with pneumonia and were hospitalized more. In contrast, non–SARS‐CoV‐2 viral agents, especially metapneumovirus was associated with severe pneumonia and mortality. The demographic characteristics of the study population are presented in Table 1.
Table 1.
Demographic characteristics of the patients according to the nasopharyngeal swab molecular assay results
| SARS‐CoV‐2, n = 34 (30.35)a | Non‐SARS‐CoV‐2, n = 25 (22.32) | No viral pathogen, n = 53 (47.32)b | P | |
|---|---|---|---|---|
| Age, mean ± SD | 50.38 ± 16.22 | 45.68 ± 18.11 | 41.68 ± 15.91 | .060 |
| Sex (M), n (%) | 18 (52.9) | 15 (60.0) | 25 (47.2) | .564 |
| Presentation, n (%) | .008 | |||
| URTI (n = 37) | 5 (15.2) | 8 (32.0) | 28 (48.0) | |
| Pneumonia (n = 72) | 28 (84.8) | 17 (68.0) | 26 (52.0) | |
| Admission clinic, n (%) | <.001 | |||
| Outpatient | 3 (8.8) | 8 (32.0) | 28 (52.8) | |
| Medical ward | 28 (82.4) | 14 (56.0) | 15 (47.2) | |
| ICU | 3 (8.8) | 3 (12.0) | … | |
| Comorbidity, n (%), (41, 36.6) | 12 (25.3) | 13 (31.7) | 16 (39.0) | .172 |
| HT (25, 22.3) | 9 (26.5) | 9 (36.0) | 7 (13.2) | |
| DM (14, 12.5) | 2 (5.9) | 3 (12.0) | 9 (17.0) | |
| Asthma (7, 6.3) | 3 (8.8) | 1 (4.0) | 3 (5.7) | |
| COPD (6, 5.4) | 1 (2.9) | 3 (12.0) | 2 (3.8) | |
| Malignancy (5, 4.5) | 1 (2.9) | 1 (4.0) | 3 (5.7) | |
| History of COVID‐19 contact, n (%) | 13 (38.2) | 4 (16.0) | 8 (15.1) | .050 |
| Exitus, n (%), (6, 5.4) | 3 (8.8) | 3 (12.0) | … |
Abbreviations: COPD, chronic obstructive pulmonary disease; COVID‐19, coronavirus disease 2019; DM, diabetes mellitus; HT, hypertension; ICU, intensive care unit; M, male; SARS‐CoV‐2, severe acute respiratory syndrome coronavirus 2; SD, standard deviation; URTI, upper respiratory tract infection.
Two patients positive for both SARS‐CoV‐2 and non–SARS‐CoV‐2 were included in the SARS‐CoV‐2 group.
Four patients positive for Mycoplasma pneumonia were included in no viral pathogen group.
Among the detected respiratory viral pathogens, metapneumovirus (n = 10) and rhinovirus (n = 9) were the most frequent agents, each with one accompanying coinfection by other non–SARS‐CoV‐2 viral pathogens in single patients. There were also two coinfections with SARS‐CoV‐2, with adenovirus and Cor NL63 reaching a total coinfection rate as four out of 59 (7%) (Table 2).
Table 2.
Respiratory pathogens detected in nasopharyngeal swabs of the patients
| Respiratory pathogens | N (%) |
|---|---|
| None | 49 (43) |
| SARS‐CoV‐2 | 34 (30) |
| Metapneumovirus | 9 (8) |
| Rhinovirus | 8 (7) |
| Adenovirus | 2 (2) |
| RSV A/B | 3 (4) |
| Influenza B | 1 (1) |
| Mycoplasma pneumoniae | 4 (4) |
| Coinfections | |
| Metapneumovirus + RSV A/B | 1 (1) |
| Rhinovirus + adenovirus | 1 (1) |
| SARS‐CoV‐2 + Cor NL63 | 1 (1) |
| SARS‐CoV‐2 + adenovirus | 1 (1) |
Abbreviations: Cor, coronavirus; RSV, respiratory syncytial virus; SARS‐CoV‐2, severe acute respiratory syndrome coronavirus 2.
The most common clinical symptom was cough in the whole study population. There was no significant difference in symptoms among the groups except sputum, which was the least in the SARS‐CoV‐2 group (P = .003). The vital signs were similar in all groups and there was no difference between the groups in terms of heart rate, fever, and blood pressure. However, mean peripheral oxygen saturation (SpO2) of non–SARS‐CoV‐2 was lower than both SARS‐CoV‐2 and no viral pathogen groups. When laboratory data were analyzed, leukocyte, lymphocyte, and thrombocyte counts were significantly lower in the SARS‐CoV‐2 group (P < .001, P = .04, and P < .001, respectively). More than half of the patients in all groups had high CRP values; however, among all groups, CRP values were the lowest in the SARS‐CoV‐2 group (P = .007). Procalcitonin values were also high in two‐thirds of all groups, but lowest in the unidentified etiology group (P = .02).
Chest CT was normal in 27 (24%), typical for COVID‐19 pneumonia in 25 (22%), atypical in 17 (15%), and intermediate in nine (8%) patients. When the indeterminate CT diagnosis group was combined with the atypical for the COVID‐19 group, three patients had a false (−) diagnosis and eight patients had a false (+) diagnosis. One of the patients with a false (+) diagnosis had non–SARS viral pneumonia. When the indeterminate group was combined with the typical for COVID‐19 group, one patient had a false (−) diagnosis and 15 patients had a false (+) diagnosis. Four patients with a false (+) diagnosis were proven to have non–SARS viral pneumonia (Table 3).
Table 3.
Chest computed tomography diagnosis of the patients according to nasopharyngeal swab molecular assay results
| SARS‐CoV‐2 (n = 20)a | Non‐SARS‐CoV‐2 (n = 15) | No viral pathogen (n = 16)b | P | |
|---|---|---|---|---|
| Option 1 | <.001 | |||
| Typical for COVID‐19 | 17 (85) | 1 (5) | 7 (44) | |
| Atypical and indeterminate for COVID‐19 | 3 (15) | 14 (95) | 9 (56) | |
| Option 2 | <.001 | |||
| Typical and indeterminate for COVID‐19 | 19 (95) | 4 (27) | 11 (69) | |
| Atypical for COVID‐19 | 1 (5) | 11 (73) | 5 (31) |
Abbreviations: COVID‐19, coronavirus disease 2019; SARS‐CoV‐2, severe acute respiratory syndrome coronavirus 2.
One patient positive for both SARS‐CoV‐2 and non–SARS‐CoV‐2 was included in the SARS‐CoV‐2 group.
Three patients positive for Mycoplasma pneumonia were included in no viral pathogen group.
When chest CT findings in SARS‐CoV‐2 and non–SARS‐CoV‐2 groups were analyzed, right (80% vs 67%) and left lower lobes (80% vs 60%) were more commonly involved. Peripheral involvement (80% vs 20%; P < .001) and pure ground‐glass opacity (65% vs 33%; P = .04) were significantly more common in SARS‐CoV‐2‐positive group. More than three lobes involvement was two times more in SARS‐CoV‐2 (80%) than non–SARS‐CoV‐2 (40%) group (relative risk: 2.0, 95% CI: 1.04‐3.86, P = .379; OR: 6.0, 95% CI: 1.33‐27.05, P = .02). Although the presence of an apicobasal gradient was more common in SARS‐CoV‐2 patients (60% vs 40%) there was no significant difference between the groups (P = .080). Consolidation with accompanying ground‐glass opacity was significantly more common (4% vs 33%) in the non–SARS‐CoV‐2 positive group (P = .03) (Table 4).
Table 4.
Chest computed tomography findings in SARS‐CoV‐2 and non–SARS‐CoV‐2 groups
| SARS‐CoV‐2 (n = 20)a | Non‐SARS‐CoV‐2 (n = 15) | P | |
|---|---|---|---|
| Single‐lobe involvement | 4 (20) | 5 (33) | N/A |
| Two‐lobe involvement | 1 (5) | 1 (7) | N/A |
| Three‐lobe involvement | 1 (5) | 3 (20) | N/A |
| More than three‐lobe involvement | 16 (80) | 6 (40) | .039 |
| Apicobasal gradient | 14 (70) | 6 (40) | .080 |
| Peripheral involvement | 16 (80) | 3 (20) | <.001 |
| Ground‐glass opacity | 15 (75) | 6 (40) | .043 |
| Consolidation > ground‐glass opacity | 1 (5) | 6 (40) | .031 |
Abbreviations: N/A, not available; SARS‐CoV‐2, severe acute respiratory syndrome coronavirus 2.
One patient positive for both SARS‐CoV‐2 and non‐SARS‐CoV‐2 were included in the SARS‐CoV‐2 group.
Radiological assessments for the more frequently identified non–SARS‐CoV‐2 pathogens (both metapneumovirus and rhinovirus) were compatible with indeterminate or atypical for COVID‐19 disease. This was also similar to mycoplasma cases. Among the distinctive characteristics of pneumonic infiltration in SARS‐CoV‐2 and the most commonly identified non–SARS‐CoV‐2 pathogens, reticulation was more in SARS‐CoV‐2 (n = 10) than metapneumovirus (n = 2) and rhinovirus (n = 3), bronchial dilatation (n = 3) and vascular enlargement (n = 1) signs were positive only in SARS‐CoV‐2 patients. Neither bronchial dilatation nor vascular enlargement was detected in metapneumovirus and rhinovirus pneumonia. In contrast, atypical COVID‐19 pneumonia findings such as bronchial thickening and tree‐in‐bud were only positive in metapneumovirus (n = 3, n = 2) and rhinovirus (n = 4, n = 1) (Figures 1, 2 and S1‐3).
Figure 1.
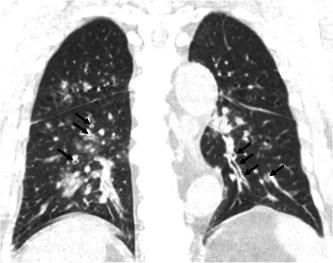
Coronal reformat image of chest computed tomography of a 74‐year‐old female patient with metapneumovirus pneumonia demonstrates peribronchial thickening (arrows)
Figure 2.

Axial reformat image of chest computed tomography of a 74‐year‐old female patient with metapneumovirus pneumonia demonstrates multiple centrilobular nodules, some with a tree‐in‐bud type configuration (circle)
4. DISCUSSION
The differential diagnosis of community‐acquired pneumonia is challenging, especially when respiratory viral pathogens are also circulating in the community. 12 In this study, features of viral pneumonia and the coinfection rates were investigated at the very early stage of the pandemic during the seasonal respiratory pathogens period in a single‐center pandemic hospital in Turkey. Although SARS‐CoV‐2 detection had priority, non–SARS‐CoV‐2 viral agents were identified fairly high (n = 25, 22%). The coinfection rate was 7%. Pneumonia was the clinical presentation for most of the patients irrespective of the etiology. Age, sex, and accompanying comorbidities were not different among the non–SARS‐CoV‐2, non–SARS‐CoV‐2‐detected, and nonidentified etiology groups. Approximately one‐third of the COVID‐19 patients defined a contact history. COVID‐19 patients presented with pneumonia and were hospitalized more. In contrast, non–SARS‐CoV‐2 viral agents, especially metapneumovirus could also be associated with severe pneumonia and mortality. COVID‐19 patients' lymphocyte count and CRP were lower and chest CT was helpful in the diagnostic workup.
Four (7%) coinfections were detected: two in SARS‐CoV‐2‐positive patients with adenovirus and another coronavirus and two in the non–SARS‐CoV‐2 group. The coinfection rates were reported between 0% and 20.7% in different studies. 5 , 7 , 13 One study including 1206 patients showed that 9.5% of the study population was positive for SARS‐CoV‐2 and 26.1% for other viruses. 13 In this cohort, the coinfection rates were fairly low; however, SARS‐CoV‐2 was the most frequently observed pathogen (30%) when compared with non–SARS‐CoV‐2 agents (22%). This might be due to the study period when the case rates were rapidly increasing. Metapneumovirus and rhinovirus were the most commonly identified agents, although influenza was expected to occur more during this period.
COVID‐19 is usually mild or moderate (81%), however, severe (14%) and critical illness (5%) have also been reported. 14 Patients who have mild signs and symptoms generally recover at home, however, moderate or severe cases are hospitalized for observational and supportive care. 15 In this study, most of the COVID‐19 patients presented with pneumonia and hospitalized significantly more than other groups. This might be due to understanding the nature of a new agent and observing the clinical progress. However, severe pneumonia and death rate was higher in the non–SARS‐CoV‐2 group.
Clinical signs and symptoms alone are inaccurate for the etiological diagnosis of pneumonia. 16 The most common symptoms include cough, fever, sore throat, malaise, and myalgia. All previously defined symptoms were investigated in COVID‐19 and no difference was observed among the groups. Cough and fever were the most common symptoms in all groups. However, sputum, which was not included in the clinical signs of COVID‐19 in any definition, was the only identifiable symptom from other etiologies of pneumonia.
The vital signs were also similar in all groups except SpO2, which was the lowest in the non–SARS‐CoV‐2 group. This might be related to mild COVID‐19 presentation. In the laboratory data, leukocyte, lymphocyte, and thrombocyte count values were significantly lower in the SARS‐CoV‐2 group. Normal leukocyte counts, leukopenia, lymphopenia (80%+), and thrombocytopenia have been reported in COVID‐19. 17 More than half (73%) of the COVID‐19 patients had increased CRP values; however, among all groups, CRP was the lowest in the SARS‐CoV‐2 group, while procalcitonin was lowest in the unidentified etiology group. This might be due to mild inflammation at the beginning of SARS‐CoV‐2 and noninfectious etiologies in the unidentified etiology group. Elevated CRP, low or normal procalcitonin levels were defined as the inflammatory markers in COVID‐19. 18 These results were compatible with the previous findings and we suggest that lymphopenia might be used to distinguish COVID‐19 from other etiologies.
The sensitivity and specificity of chest CT in COVID‐19 pneumonia have been reported as 60% to 98% and 25% to 53%, respectively. 19 As the widespread use of CT imaging caused increased recognition of uncommon presentations of the disease, indeterminate CT diagnosis had reached a considerable number. The uncertainty in the management of these patients is still present. In this study, indeterminate CT diagnosis group was combined with atypical and typical for COVID‐19 groups and analyzed for two options each to suggest better management of the indeterminate group. When the indeterminate CT diagnosis group was combined with the atypical for the COVID‐19 group, the number of false‐negative patients for SARS‐CoV‐2 was more (n = 3) concerning the combination of indeterminate group and typical for COVID‐19 group (n = 1), in the cost of increased false‐positive results (n = 15). Therefore, we suggest to include indeterminate CT findings in the typical group in order not to misdiagnose COVID‐19 during the peak stage of the pandemic. The decision on indeterminate CT findings might be made case by case considering the course of the pandemic.
In addition to the difficulty of decision‐making for the indeterminate group, it is reported that typical chest CT findings of COVID‐19 pneumonia may overlap with many other infections (notably viral pneumonia) and noninfectious diseases (particularly organizing pneumonia). 20 However, the RSNA declared that CT was successful in diagnosing COVID‐19 pneumonia and distinguishing it from the other viral causes. 11 Similarly, in this study, among 25 patients in typical for COVID‐19 group, 17 were positive for SARS‐CoV‐2 while only one was positive for non–SARS‐CoV‐2 agents. Besides, among 17 patients in atypical for COVID‐19 group, 11 were positive for non–SARS‐CoV‐2, while only one was positive for SARS‐CoV‐2. Following the report by RSNA, the results of this study demonstrate that chest CT is successful in distinguishing COVID‐19 pneumonia from other viral pneumonia. However, for the group in which the etiology was not identified, false positivity (7 out of 25) and false negativity (5 out of 17) rates were high and CT did not help distinguish COVID‐19 pneumonia. This result shows us that COVID‐19 is more prone to resemble nonviral cases of pneumonia rather than viral pneumonia.
In addition to the classification of RSNA on chest CT findings related to COVID‐19, some clues in the differential diagnosis of pathogens that cause viral pneumonia were described previously in the literature. Viral pneumonia due to human metapneumovirus and rhinovirus have been described to show airway‐centric distribution, with areas of tree‐in‐bud opacity and bronchial wall thickening. 21 These findings were also recognized in non–SARS‐CoV‐2 pneumonia.
As consolidation obscures the reticular pattern underneath, reticulations were significantly more common in the SARS‐CoV‐2 group, which more commonly presents with ground‐glass opacity. Among the other features seen in pneumonic infiltration of COVID‐19, bronchial dilation and vascular enlargement were identified in a total of four patients in SARS‐CoV‐2 (n = 34). Despite the small sample size of the study, it is a remarkable finding that none of the patients in the non–SARS‐CoV‐2 group had these findings.
In this study, it was also demonstrated that the anatomic distribution of lung lesions may also help to distinguish COVID‐19 from other viral cases of pneumonia. As reported in the literature, COVID‐19 most commonly affects the lower zones (55%), peripheral parts (87%), and multifocal areas (55%) and the disease is generally quite extensive, with all five lobes being affected in 39% of patients. 7 , 22 , 23 All of these characteristics were more common in SARS‐CoV‐2 than the non–SARS‐CoV‐2 group of this study. Although there were no significant differences between SARS‐CoV‐2 and non–SARS‐CoV‐2 groups, the presence of an apicobasal gradient and involvement of the lower lobes may help differential diagnosis of COVID‐19. Especially, COVID‐19 should be considered rather than other viral cases of pneumonia if more than three lobes are involved. However, only peripheral involvement was significant in the study. This result is attributed to the small sample size of this study.
4.1. Limitations
This is a single‐center study, with a small number of the study population. Another major limitation of this study was that other reasons for respiratory symptoms/pneumonia in the viral pathogen‐negative group was not recorded. This is partly due to the limited number of specimen collections for not overwhelming the laboratory capacities, and partly to the low rates of bacterial culture positivity even outside the pandemic.
5. CONCLUSION
Viral pneumonia caused by non–SARS‐CoV‐2 pathogens may also be present during the seasonal respiratory pathogen period. Especially, metapneumovirus could be associated with severe pneumonia and mortality. Some clinical, laboratory, and especially radiological findings may aid in the differential diagnosis of non–SARS‐CoV‐2 pathogens from COVID‐19. However, coinfections may occur, and it should be considered that a non–SARS‐CoV‐2 pathogen does not exclude accompanying COVID‐19.
CONFLICT OF INTERESTS
The authors declare that there are no conflict of interests.
AUTHOR CONTRIBUTIONS
Literature search, study design, data collection, analysis of data, manuscript preparation, review of manuscript: AOA; data collection, analysis of data, review of manuscript: IG; literature search, study design, analysis of data, manuscript preparation, review of manuscript: NSG and VAO; literature search, data collection, review of manuscript: GOS and AAS; data collection, review of manuscript: KCT, OOEK, ANZ, and MS.
Supporting information
Supporting information
Supporting information
Supporting information
Supporting information
Alpaydin AO, Gezer NS, Simsek GO, et al. Clinical and radiological diagnosis of non–SARS‐CoV‐2 viruses in the era of COVID‐19 pandemic. J Med Virol. 2021;93:1119–1125. 10.1002/jmv.26410
DATA AVAILABILITY STATEMENT
The data that support the findings of this study are available from the corresponding author upon reasonable request.
REFERENCES
- 1. World Health Organization (WHO) . Pneumonia of unknown cause—China. Geneva: WHO; 2020. https://www.who.int/csr/don/05-january-2020-pneumonia-of-unkown-cause-china/en/ [Google Scholar]
- 2. World Health Organization (WHO) . Novel coronavirus—China. Geneva: WHO; 2020. https://www.who.int/csr/don/12-January-2020-novel-coronavirus-china/en/ [Google Scholar]
- 3. Zhou P, Yang XL, Wang XG, et al. A pneumonia outbreak associated with a new coronavirus of probable bat origin. Nature. 2020;579:270‐273. [DOI] [PMC free article] [PubMed] [Google Scholar]
- 4. Centers for Disease Control and Prevention (CDC) . Coronavirus disease 2019 (COVID‐19). Atlanta: CDC; 2020. https://www.cdc.gov/coronavirus/2019-ncov/about/symptoms
- 5. Bordi L, Nicastri E, Scorzolini L, et al. Differential diagnosis of illness in patients under investigation for the novel coronavirus (SARS‐CoV‐2), Italy, February 2020. Euro Surveill. 2020;25(8):2000170. 10.2807/1560-7917.ES.2020.25.8.2000170 [DOI] [PMC free article] [PubMed] [Google Scholar]
- 6. Cui J, Li F, Shi ZL. Origin and evolution of pathogenic coronaviruses. Nat Rev Microbiol. 2019;17(3):181‐192. 10.1038/s41579-018-0118-9 [DOI] [PMC free article] [PubMed] [Google Scholar]
- 7. Chen N, Zhou M, Dong X, et al. Epidemiological and clinical characteristics of 99 cases of 2019 novel coronavirus pneumonia in Wuhan, China: a descriptive study. Lancet. 2020;395(10223):507‐513. [DOI] [PMC free article] [PubMed] [Google Scholar]
- 8. Centers for Disease Control and Prevention . Evaluating and testing persons for coronavirus disease 2019 (COVID‐19); 2020. https://www.cdc.gov/coronavirus/2019-ncov/hcp/clinical-criteria.htm. Accessed March 20, 2020.
- 9. Corman VM, Landt O, Kaiser M, et al. Detection of 2019 novel coronavirus (2019‐nCoV) by real‐time RT‐PCR. Euro Surveill. 2020;25(3):2000045. [DOI] [PMC free article] [PubMed] [Google Scholar]
- 10. Rubin GD, Ryerson CJ, Haramati LB, et al. The role of chest imaging in patient management during the COVID‐19 pandemic: a multinational consensus statement from the Fleischner Society. Radiology. 2020;296:201365. [DOI] [PMC free article] [PubMed] [Google Scholar]
- 11. Simpson S, Kay FU, Abbara S, et al. Radiological Society of North America Expert Consensus Statement on Reporting Chest CT Findings Related to COVID‐19. Endorsed by the Society of Thoracic Radiology, the American College of Radiology, and RSNA. J Thorac Imaging. 2020;35:219‐227. 10.1097/RTI.0000000000000524 [DOI] [PMC free article] [PubMed] [Google Scholar]
- 12. Murdoch R. How recent advances in molecular tests could impact the diagnosis of pneumonia. Expert Rev Mol Diagn. 2016;16(5):533‐540. [DOI] [PMC free article] [PubMed] [Google Scholar]
- 13. Kim D, Quinn J, Pinsky B, Shah NH, Brown I. Rates of co‐infection between SARS‐COV‐2 and other respiratory pathogens. JAMA. 2020;323(20):2085‐2086. [DOI] [PMC free article] [PubMed] [Google Scholar]
- 14. Wu Z, McGoogan JM. Characteristics of and important lessons from the coronavirus disease 2019 (COVID‐19) outbreak in China: summary of a report of 72 314 cases from the Chinese Center for Disease Control and Prevention. JAMA. 2020;323(13):1239‐1242. 10.1001/jama.2020.2648 [DOI] [PubMed] [Google Scholar]
- 15. Gandhi RT, Lynch JB, Del Rio C. Mild or moderate COVID‐19. N Engl J Med. 2020. 10.1056/NEJMcp2009249 [DOI] [PubMed] [Google Scholar]
- 16. Metlay JP, Waterer GW, Long AC, et al. Diagnosis and treatment of adults with community‐acquired pneumonia. An official clinical practice guideline of the American Thoracic Society and Infectious Diseases Society of America. Am J Respir Crit Care Med. 2019;200(7):e45‐e67. 10.1164/rccm.201908-1581ST. [DOI] [PMC free article] [PubMed] [Google Scholar]
- 17. Guan WJ, Ni ZY, Hu Y, et al. Clinical characteristics of coronavirus disease 2019 in China. N Engl J Med. 2020;382(18):1708‐1720. 10.1056/NEJMoa/2002032 [DOI] [PMC free article] [PubMed] [Google Scholar]
- 18. American Thoracic Society . Diagnosis and Management of COVID‐19 Disease. Am J Respir Crit Care Med . 2020;201:19‐22. [DOI] [PubMed] [Google Scholar]
- 19. GezeR NS. How to deal with COVID‐19 pandemic: a radiologic approach. Turk Thorac J. 2020;21(3):219‐220. [DOI] [PMC free article] [PubMed] [Google Scholar]
- 20. Güneyli S, Atçeken Z, Doğan H, Altınmakas E, Atasoy KÇ. Radiological approach to COVID‐19 pneumonia with an emphasis on chest CT. Diagn Interv Radiol. 2020;26:323‐332. 10.5152/dir.2020.20260 [DOI] [PMC free article] [PubMed] [Google Scholar]
- 21. Koo HJ, Lim S, Choe J, Choi SH, Sung H, Do KH. Radiographic and CT features of viral pneumonia. Radiographics. 2018;38(3):719‐739. [DOI] [PubMed] [Google Scholar]
- 22. Song F, Shi N, Shan F, et al. Emerging 2019 novel coronavirus (2019‐nCoV) pneumonia. Radiology. 2020;295:210‐217. [DOI] [PMC free article] [PubMed] [Google Scholar]
- 23. Gezer NS, Ergan B, Barış MM, et al. COVID‐19 S: A new proposal for diagnosis and structured reporting of COVID‐19 on computed tomography imaging. Diagn Interv Radiol. 2020;26:315‐322. 10.5152/dir.2020.20351 [DOI] [PMC free article] [PubMed] [Google Scholar]
Associated Data
This section collects any data citations, data availability statements, or supplementary materials included in this article.
Supplementary Materials
Supporting information
Supporting information
Supporting information
Supporting information
Data Availability Statement
The data that support the findings of this study are available from the corresponding author upon reasonable request.