

Abstract
Aim
To describe the effect of the stringent lockdown measures, introduced in the UK on 23 March 2020 to curtail the transmission of COVID‐19, on glycaemic control in people with type 1 diabetes using flash glucose monitoring.
Methods
We undertook an observational study of 572 individuals with type 1 diabetes for whom paired flash glucose monitoring data were available between early March and May 2020. The primary outcome was change in flash glucose monitoring variables. We also assessed clinical variables associated with change in glycaemic control.
Results
Percentage of time in range increased between March and May 2020 [median (interquartile range) 53 (41–64)% vs 56 (45–68)%; P < 0.001], with associated improvements in standard deviation of glucose (P <0.001) and estimated HbA1c (P <0.001). There was a small reduction in the number of individuals meeting the hypoglycaemia target of <5% per day (64% vs 58%; P = 0.004). Comparing changes in flash glucose monitoring data from March to May in 2019 with the same period in 2020 confirmed that these differences were confined to 2020. Socio‐economic deprivation was an independent predictor of a ≥5% reduction in time in range during lockdown (odds ratio 0.45 for people in the two most affluent Scottish Index of Multiple Deprivation quintiles; P <0.001).
Conclusions
Lockdown was not associated with a significant deterioration in glycaemic control in people with type 1 diabetes using flash glucose monitoring. However, socio‐economic deprivation appeared to increase the risk of decline in glycaemic control, which has implications for how support is focused in challenging times.
What's new?
The COVID‐19 pandemic is an unprecedented public health crisis and very little is known with respect to the effects of lockdown measures on glycaemic control.
Interruption to standard diabetes services, stress and major upheaval to lifestyle and daily routines could all conceivably impact on glucose control in type 1 diabetes.
We found no evidence of any clinically significant deterioration across a broad range of glycaemic variables in people with type 1 diabetes following the COVID‐19 lockdown.
If anything, some minor improvement was observed in percentage time in target glucose range (3.9–10 mmol/l) between March 2020 (pre‐lockdown) and May 2020 (7 weeks into lockdown).
Deterioration in time in range and estimated HbA1c during lockdown was more likely in people with higher levels of socio‐economic deprivation.
Even greater focus on support for people with type 1 diabetes and socio‐economic deprivation is important during the COVID‐19 pandemic.
1. INTRODUCTION
A novel coronavirus strain (COVID‐19) was identified as the cause of a severe acute respiratory distress syndrome (SARS‐CoV‐2), which emerged in Wuhan, China in December 2019. 1 In the following months, the virus rapidly spread across the world, with a marked increase in cases occurring in the UK from March 2020. In response to this, the UK government enacted a lockdown which included the closure of schools and all non‐essential business, effective from 23 March 2020 (when just over 6000 cases were confirmed). 2 The lockdown also included a directive to the population to ‘stay at home’ with the exception of essential work, food/medicine shopping and a single episode of daily exercise. Across the UK, diabetes services have generally cancelled all routine ‘face‐to‐face’ outpatient activity during the COVID‐19 crisis and, where possible, have delivered consultations ‘remotely’ by telephone and/or video calls. 3 It is conceivable that the major upheaval in diet, physical activity, daily routine and stress associated with COVID‐19, in addition to interruption in diabetes services, may have had a negative impact on glycaemic control in people with type 1 diabetes. To assess this, we interrogated our centre’s database to compare glycaemic variables in those with type 1 diabetes using flash glucose monitoring, both before and approximately 7 weeks after lockdown (whilst lockdown was still in place). In addition, we explored the clinical and demographic factors associated with decline in glycaemic control across this period.
2. PARTICIPANTS AND METHODS
2.1. Study design and participants
Approximately 3340 individuals with type 1 diabetes attend Royal Infirmary of Edinburgh and Western General Hospital (Edinburgh) diabetes clinics. A total of 1776 individuals
(i.e. approximately half of all people with type 1 diabetes attending our clinics) using flash glucose monitoring (FreeStyle Libre, Abbott, Witney, UK) have linked their glucose data to these clinics using the LibreView platform (libreview.com). Of 1776 LibreView users, we identified a cohort with glucose data uploaded within 7 days of 11 March 2020 (baseline) and again within 7 days of 14 May 2020 (follow‐up 7 weeks into lockdown). Only individuals with ≥75% flash glucose monitoring data captured were included (n = 572). An additional analysis, comparing change in glycaemic variables between March to May 2019 and March to May 2020, was possible in 271/572 people (i.e. paired data available for both 2019 and 2020).
2.2. Outcomes
The main study outcomes were assessment of flash glucose monitoring glycaemic variables between March 2020 and May 2020 (using 2‐week data capture), including average glucose, standard deviation of glucose, interquartile range of glucose, coefficient of variation glucose, number of low glucose events per 2‐week monitoring period, average low glucose event duration, percentage of time spent with glucose below 3.9 mmol/l, percentage of time spent with glucose in range of 3.9–10 mmol/l, percentage of time spent with glucose above 10 mmol/l, daily flash glucose monitoring scans, percentage of flash glucose monitoring data captured and estimated HbA1c. The percentage of individuals meeting the international consensus targets for time in range and time below range were also recorded. 4 In addition to this, we compared change across a range of glycaemic variables between March and May 2019 (non‐lockdown control period) and March and May 2020 (lockdown period). Clinical and demographic data including age, date of diabetes diagnosis, last clinic HbA1c value, method of insulin therapy (continuous subcutaneous insulin infusion or multiple daily injections), obesity (BMI > 30 kg/m2), smoking status and socio‐economic deprivation [Scottish Index of Multiple Deprivation (SIMD); simd.scot] were collected from SCI‐Diabetes. SIMD data were unavailable in 24 individuals. We also sought to identify independent predictors (clinical and demographic) of decline in glycaemic control following lockdown.
2.3. Statistical analysis
Data were mostly non‐normally distributed (as determined by Shapiro–Wilk test) and are presented as median and interquartile range (IQR). Paired data were analysed using the Wilcoxon signed‐rank test and unpaired data using the Mann–Whitney U‐test. Categorical data were analysed using the chi‐squared or McNemar test, when comparing paired repeated measurements. Logistic regression [odds ratios (ORs) and 95% CIs] was performed to identify independent predictors of deterioration in continuous glucose monitoring variables. No sample size calculation was performed. P values < 0.05 were taken to indicate statistical significance and no adjustment was made for multiplicity of statistical tests. All analyses were performed using rstudio version 1.0.153 (https://www.rstudio.com).
2.4. Ethics
The study was entirely observational (with no deviation from standard clinical care) and ethics approval was not required. Inclusion in our national clinic database system, SCI‐Diabetes (https://www.sci‐diabetes.scot.nhs.uk), includes permission to access data for audit purposes and individuals grant specific permission for clinic staff to access LibreView data when linking their devices to the clinic.
3. RESULTS
3.1. Participant characteristics
The median (IQR) age of the cohort was 39 (31–50) years, and the median (IQR) diabetes duration was 18 (9–27) years. Of 572 participants, 301 (53%) were men and 147 (26%) were continuous subcutaneous insulin infusion users. A total of 336 participants out of 548 (61%) belonged to the two least deprived quintiles of SIMD (4 and 5), 143/569 participants (25%) were obese and 41/569 (7.2%) were current smokers. The median (IQR) last clinic‐recorded HbA1c value was 60 (53–67) mmol/mol [7.6 (7.0–8.3)%].
3.2. Flash glucose monitoring variables between March and May 2020
There were statistically significant changes in all reported flash glucose monitoring variables, with the exception of coefficient of variation glucose, low glucose event duration and number of daily flash glucose monitoring scans (Table 1). The direction of all change in glycaemic variables following lockdown was broadly consistent with improved glycaemic control (Table 1 and Figure 1), although a small but statistically significant increase in low glucose events and percentage of time with glucose below 3.9 mmol/l was noted. A greater proportion of individuals met the time in range target and a smaller proportion met the hypoglycaemia target between March and May 2020 (Table 1).
TABLE 1.
Flash glucose monitoring data for the whole cohort in March and May 2020 (N = 572)
| March 2020 | May 2020 | Median difference | P comparing March 2020 and May 2020 | |
|---|---|---|---|---|
| Average glucose, mmol/l | 9.6 (8.5 to 10.9) | 9.3 (8.1 to 10.4) | –0.4 (–1.1 to 0.3) | <0.001 |
| sd glucose, mmol/l | 3.6 (3.0 to 4.3) | 3.5 (2.8 to 4.0) | –0.2 (–0.5 to 0.2) | <0.001 |
| IQR glucose, mmol/l | 5.0 (4.1 to 6.0) | 4.8 (3.9 to 5.8) | –0.2 (–0.8 to 0.4) | <0.001 |
| Coefficient of variation glucose, % | 37 (33 to 42) | 37 (33 to 42) | –0.1 (–3.2 to 2.9) | 0.420 |
| Low glucose events, number/14 days | 7 (3 to 12) | 7 (3 to 14) | 1 (–2 to 3) | 0.003 |
| Low glucose event duration, min | 90 (60 to 120) | 92 (65 to 127) | 3 (–26 to 34) | 0.061 |
| % time below target range: <3.9 mmol/l | 3 (1 to 6) | 3 (1 to 7) | 0 (–1 to 2) | 0.005 |
| % time in range: 3.9–10.0 mmol/l | 53 (41 to 64) | 56 (45 to 68) | 3 (–4 to 10) | <0.001 |
| % time above range: >10.mmol/l | 42 (29 to 56) | 39 (25 to 51) | –3 (–11 to 3) | <0.001 |
| Number of daily scans | 10 (7 to 15) | 10 (7 to 15) | 0 (–2 to 1) | 0.074 |
| % flash glucose monitoring data captured | 94 (90 to 97) | 93 (88 to 96) | –1 (–4 to 1) | <0.001 |
| Estimated HbA1c | <0.001 | |||
| mmol/mol | 61 (53 to 69) | 58 (50 to 66) | –2 (–7 to 2) | |
| % | 7.7 (7.0 to 8.5) | 7.5 (6.7 to 8.2) | –0.2 (–0.6 to 0.2) | |
| Time in range target met (>70%), n/N (%) | 93/572 (16) | 122/572 (21) | NA | 0.001 |
| Hypoglycaemia target met (<5%), n/N (%) | 365/572 (64) | 332/572 (58) | NA | 0.004 |
| Time in range and hypoglycaemia targets met, n/N (%) | 55/572 (9.6) | 65/572 (11) | NA | 0.261 |
Data are median (IQR), unless otherwise indicated.
Abbreviation: IQR, interquartile range.
FIGURE 1.
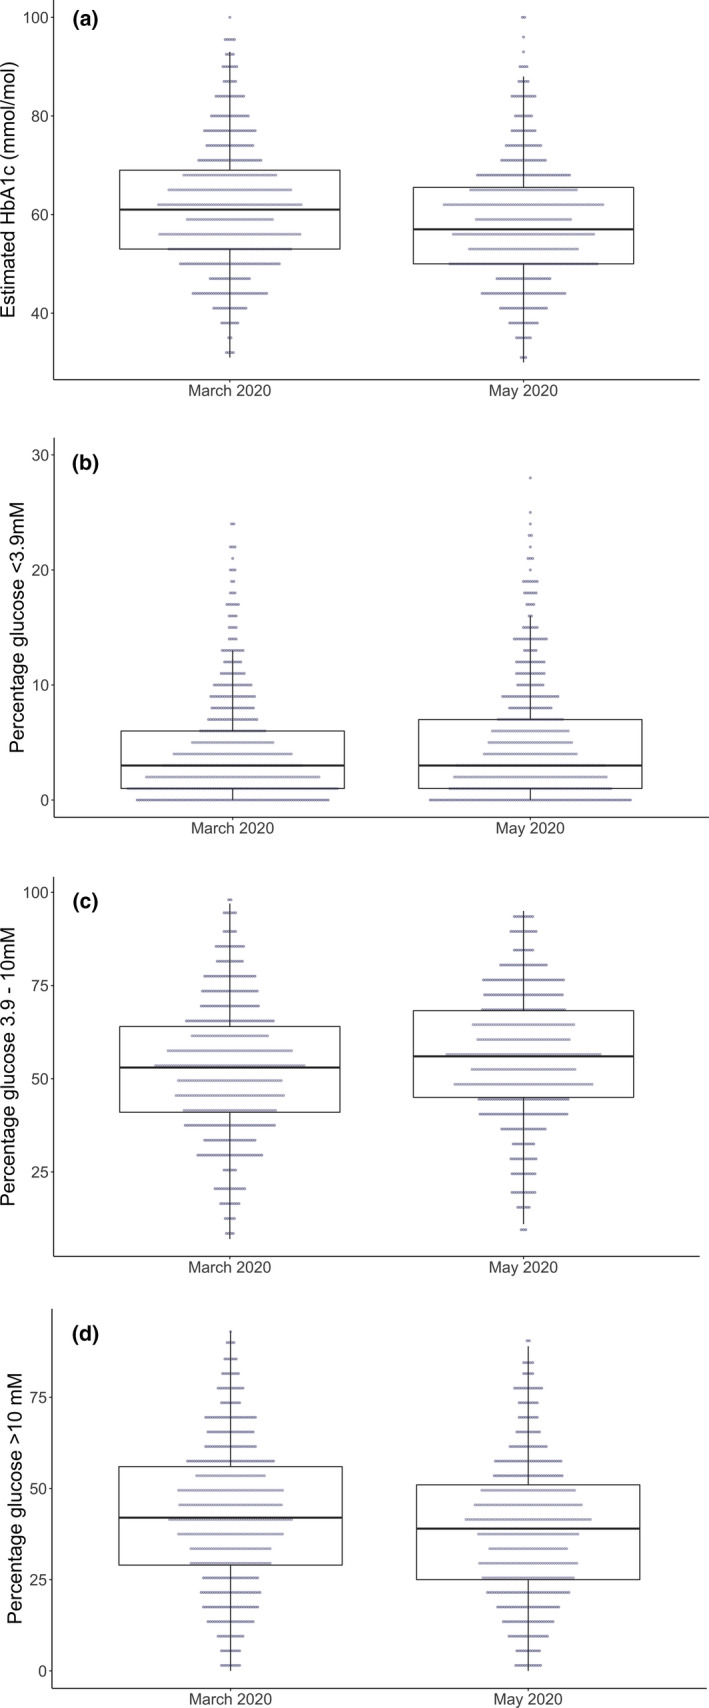
Change in (a) estimated HbA1c, (b) percentage glucose below range, (c) percentage glucose in range and (d) percentage glucose above range between March 2020 and May 2020
3.3. Comparison of 2019 and 2020
When comparing changes in flash glucose monitoring variables in the period March to May 2019 with the same period in 2020, there were modest but significant improvements in percentage of time in range, estimated HbA1c and standard deviation in 2020. There were statistically significant increases in low glucose events and percentage of time below range (Table 2).
TABLE 2.
Comparing flash glucose monitoring variables in March and May 2019 with those in March and May 2020 (cohort with paired 2019 and 2020 data, N = 271)
| March 2019 | May 2019 | March 2020 | May 2020 | Median difference 2019 | Median difference 2020 | P comparing change between 2019 and 2020 | |
|---|---|---|---|---|---|---|---|
| Average glucose*, mmol/l | 9.6 (8.6 to 11.0) | 9.7 (8.4 to 11.1 | 9.5 (8.5 to 10.7) | 9.2 (8.1 to 10.2) | 0.1 (–0.6 to 0.7) | –0.4 (‐1.0 to 0.2) | <0.001 |
| sd glucose*, mmol/l | 3.8 (3.2 to 4.5) | 3.8 (3.2 to 4.5) | 3.5 (3.0 to 4.1) | 3.3 (2.8 to 3.9) | 0.0 (–0.3 to 0.3) | –0.1 (‐0.5 to 0.2) | <0.001 |
| Coefficient of variation glucose* (%) | 39 (34 to 43) | 39 (34 to 44) | 36 (32 to 41) | 36 (32 to 41) | 0.1 (–2.7 to 2.9) | –0.1 (–3.4 to 3.2) | 0.382 |
| Low glucose events*, number/14 days | 8 (4 to 14) | 7 (3 to 14) | 6 (3 to 12) | 7 (3 to 15) | 0 (–4 to 2) | 1 (–2 to 4) | <0.001 |
| Low glucose event duration, min | 93 (65 to 124) | 86 (64 to 118) | 89 (60 to 120) | 86 (61 to 116) | 0 (–27 to 23) | 0 (–34 to 29) | 0.482 |
| % below range* | 4 (2 to 7) | 4 (2 to 7) | 3 (1 to 6) | 3 (1 to 7) | 0 (–2 to 2) | 0 (–1 to 2) | 0.031 |
| % in range* | 52 (40 to 63) | 51 (41 to 63) | 54 (44 to 64) | 58 (47 to 71) | 0 (–5 to 5) | 3 (–3 to 11) | <0.001 |
| % above range | 42 (30 to 57) | 43 (30 to 56) | 40 (30 to 53) | 37 (24 to 49) | 0 (–6 to 6) | –3 (–12 to 3) | <0.001 |
| Number of daily scans | 11 (8 to 15) | 10 (7 to 15) | 11 (7 to 16) | 11 (7 to 16) | 0 (–2 to 1) | 0 (‐2 to 1) | 0.086 |
| Estimated HbA1c * | –2 (–7 to 1) | <0.001 | |||||
| mmol/mol | 61 (53 to 69) | 61 (52 to 70) | 60 (53 to 68) | 57 (50 to 64) | 0 (–4 to 5) | –0.2 (0.6 to 0.1) | |
| % | 7.7 (7.0 to 8.5) | 7.7 (6.9 to 8.6) | 7.6 (7.0 to 8.4) | 7.4 (6.7 to 8.0) | 0 (–0.4 to 0.5) |
Data are median (interquartile range). P compares the median difference in 2019 (May to March 2019) and the median difference in 2020 (May to March 2020).
Significantly different baseline (i.e. comparing March 2019 vs March 2020).
3.4. Predictors of change in glycaemic variables during lockdown
Of 572 participants, 125 (22%) experienced a decrease in percentage of time in range of ≥5% during lockdown. The only statistically significant baseline associations in univariate analysis were lower estimated HbA1c, greater time in range and greater socio‐economic deprivation (Table 3). 61/212 (28.8%) of those in the three most deprived quintiles (SIMD 1 ‐ 3) experienced a decrease in percentage of time in range of ≥5%, compared to 60/336 (17.9%, P = 0.003) in the least deprived two quintiles (SIMD 4 & 5). Logistic regression analysis identified a lower risk in those belonging to the two SIMD quintiles with least deprivation [OR 0.45 (95% CI 0.29–0.70); P < 0.001] and a greater risk for those with higher percentage of time in range at baseline [OR 1.03 per % (95% CI 1.02–1.05); P < 0.001]. Socio‐economic deprivation was the only independent predictor of a ≥5‐mmol/mol (0.5%) increase in estimated HbA1c [which occurred in 89/572 participants (16%)], with a lower risk observed in those belonging to the two quintiles with least deprivation [OR 0.41 (95% CI 0.25–0.67); P < 0.001 (Table 4)]. A ≥5% increase in percentage of time spent below 3.9 mmol/l was observed in 63/572 participants (11%) and the only independent predictor was greater time in range at baseline [OR 1.02 per % (95% CI 1.01–1.04); P = 0.008 Table 4)].
TABLE 3.
Comparison of clinical characteristics and how these related to subsequent change in time in range between March and May 2020 (n = 572) in people in the Scottish Index of Multiple Deprivation quintiles 1 to 3 (most deprived) and those in quintiles 4 and 5 (least deprived)
| TIR fell by ≥5% between March and May 2020 (n = 125) | TIR did not fall by ≥5% between March and May 2020 (n = 447) | P | |
|---|---|---|---|
| Age, years | 38 (29–50) | 39 (31–50) | 0.735 |
| Age at diagnosis, years | 20 (13–31) | 20 (11–29) | 0.534 |
| Diabetes duration, years | 17 (9–25) | 18 (10–28) | 0.202 |
| Men, n (%) | 69 (55) | 232 (52) | 0.514 |
| Women, n (%) | 56 (45) | 215 (48) | |
| Baseline estimated HbA1c | <0.001 | ||
| mmol/mol | 57 (50–62) | 62 (53–70) | |
| % | 7.4 (6.7–7.8) | 7.8 (7.0–8.6) | |
| Baseline %TIR | 59 (51–71) | 51 (39–62) | <0.001 |
| Last clinic HbA1c value | 0.361 | ||
| mmol/mol | 59 (52–67) | 60 (53–68) | |
| % | 7.5 (6.9–8.3) | 7.6 (7.0–8.4) | |
| Continuous subcutaneous insulin infusion, n/N (%) | 29/125 (23) | 118/447 (26) | 0.469 |
| SIMD quintile categories (n = 548), n/N (%) |
1–3: 61/121 (50) 4 and 5: 60/121 (50) |
1–3: 151/427 (35) 4 and 5: 276/427 (65) |
0.003 |
| Obese, n/N (%) | 29/124 (23) | 114/445 (26) | 0.613 |
| Current smoker, n/N (%) | 9/123 (7.3) | 32/446 (7.2) | 0.956 |
Data are median (interquartile range). P compares those in whom TIR fell by ≥5% between March and May 2020 and those in whom this did not occur.
Abbreviations: SIMD, Scottish Index of Multiple Deprivation; TIR, time in range.
TABLE 4.
Logistic regression analysis of associations with reduction in time in range and increase in time below range between March and May 2020 (N = 539 included in models)
| TIR fell by ≥5% between March and May 2020 | TBR increased by ≥5% between March and May 2020 | |||||
|---|---|---|---|---|---|---|
| OR | 95% CI | P | OR | 95% CI | P | |
| % in range at baseline (per % change) | 1.01 | 1.00–1.02 | 0.189 | 1.02 | 1.01–1.04 | 0.008 |
| Multiple daily injections | 0.87 | 0.50–1.56 | 0.640 | 1.82 | 0.93–3.80 | 0.092 |
| Age (per year) | 1.00 | 0.98–1.02 | 0.896 | 1.00 | 0.98–1.03 | 0.959 |
| Diabetes duration (per year) | 0.99 | 0.97–1.01 | 0.357 | 1.02 | 1.00–1.04 | 0.120 |
| Male | 1.02 | 0.62–1.69 | 0.927 | 0.98 | 0.56–1.73 | 0.946 |
| SIMD quintile 4 or 5 (vs quintiles 1–3) | 0.41 | 0.25–0.67 | <0.001 | 1.20 | 0.68–2.18 | 0.530 |
| Obese | 0.88 | 0.49–1.54 | 0.670 | 0.94 | 0.47–1.75 | 0.844 |
| Ever smoked | 0.89 | 0.50–1.55 | 0.690 | 1.00 | 0.52–1.85 | 0.995 |
Abbreviations: SIMD, Scottish Index of Multiple Deprivation; TBR, time below range; TIR, time in range.
4. DISCUSSION
COVID‐19 has resulted in an unprecedented public health emergency and extreme disruption to the lives of people across the world. Whilst there are a number of reasons to suspect that lockdown conditions could have a deleterious effect on glycaemic control in people with type 1 diabetes, this was not observed in a large cohort of individuals using flash glucose monitoring. In fact, these data suggest that, overall, there has been a small but significant improvement in important metrics such as time in range and estimated HbA1c. Although we have also shown statistically significant increases in low glucose metrics, these were negligible and unlikely to be clinically relevant. Two recently reported smaller series have shown similar results, with no evident deterioration in glycaemic control during lockdown in Italy and Spain. 5 , 6 In fact, the Italian study showed that individuals who were not working during lockdown experienced improvements in key glucose metrics, consistent with the present findings. 5 This suggests that standardization of daily routine may have mediated some of the benefits observed.
It is perhaps unsurprising that individuals with higher levels of time in range and lower estimated HbA1c are at greater risk of subsequent deterioration, as this may simply reflect regression to the mean. Of potentially greater interest is the observation that higher levels of socio‐economic deprivation were a strong, independent predictor of deteriorating glycaemic control during lockdown. The negative impact of socio‐economic deprivation on glycaemic control is well recognized 7 and there are several plausible explanations as to why the COVID‐19 crisis may have exacerbated this effect. For example, socio‐economic deprivation may be disproportionately associated with poorer diet and reduced exercise during lockdown, as well as increased stress from childcare commitments and uncertainty around employment and income. Even greater challenges may exist for those not currently using modern glucose monitoring technologies and remote data‐sharing. These individuals tend to have higher levels of socio‐economic deprivation 8 and may be at greater risk of deteriorating glycaemic control in the midst of this crisis. Emerging evidence also suggests that socio‐economic deprivation and elevated HbA1c values are associated with adverse outcomes in individuals with COVID‐19. 9
A key strength of the present study is the cohort size, with the study representing the largest assessment of the effect of COVID‐19 lockdown on glycaemic control in type 1 diabetes. An observational study is the only possible method of addressing this research question but raises the possibility that changes observed are not directly attributable to lockdown. We sought to address this potential confounder by comparing changes across the same months (March to May) in both 2019 and 2020, with the former acting as a control. In doing so, we showed that our results are unlikely simply to represent seasonal variation in glycaemic control 10 or incremental improvement in glycaemic control with longer duration of flash glucose monitoring. Another potential criticism of the study is that it is not generalizable to the wider type 1 diabetes population. Flash glucose monitoring, even in the era of National Health Service funding, is skewed towards younger and more affluent individuals 8 and continuous subcutaneous insulin infusion users were also over‐represented in the present cohort. Our data were also limited to people with at least 75% data capture and therefore skewed towards more proactive flash glucose monitoring users. The reassuring findings from this study are likely to be generalizable to populations proactively using flash glucose monitoring, but not beyond this. This study was also limited to interstitial glucose monitoring metrics and we cannot comment on the psychological impact and other person‐centred outcomes, which may be equally important to people with diabetes during this crisis. The large sample size identified statistically significant differences in several flash glucose monitoring variables, the magnitude of which would not be considered to be clinically meaningful.
In conclusion, these data provide reassurance that people with type 1 diabetes using flash glucose monitoring have not, in general, experienced significant deterioration in glycaemic control during the COVID‐19 lockdown; however, the association between deteriorating control and socio‐economic deprivation, even in those using flash glucose monitoring, is concerning. This has important implications for service design to provide more effective support to those who require it most, particularly in challenging times.
COMPETING INTERESTS
F.W.G. and A.R.D. have received speaker fees from Abbott Diabetes Care.
Dover AR, Ritchie SA, McKnight JA, et al. Assessment of the effect of the COVID‐19 lockdown on glycaemic control in people with type 1 diabetes using flash glucose monitoring. Diabetic Medicine. 2021;38:e14374. 10.1111/dme.14374
REFERENCES
- 1. Zhu N, Zhang D, Wang W, et al. A Novel Coronavirus from Patients with Pneumonia in China, 2019. N Engl J Med. 2020;382:727 ‐ 733. [DOI] [PMC free article] [PubMed] [Google Scholar]
- 2. [Withdrawn] Guidance on social distancing for everyone in the UK [Internet]. GOV.UK. [cited 2020 May 17]. Available at https://www.gov.uk/government/publications/covid‐19‐guidance‐on‐social‐distancing‐and‐for‐vulnerable‐people/guidance‐on‐social‐distancing‐for‐everyone‐in‐the‐uk‐and‐protecting‐older‐people‐and‐vulnerable‐adults
- 3. Wake D, Gibb F, Kar P, et al. Remodelling Diabetes Services and Promoting Innovation in the Time of Covid‐19. Eur J Endocrinol. 2020; 10.1530/EJE-20-0377. Online ahead of print. [DOI] [PMC free article] [PubMed] [Google Scholar]
- 4. Battelino T, Danne T, Bergenstal RM, et al. Clinical Targets for Continuous Glucose Monitoring Data Interpretation: Recommendations From the International Consensus on Time in Range. Diabetes Care. 2019;42:1593 ‐ 1603. [DOI] [PMC free article] [PubMed] [Google Scholar]
- 5. Bonora BM, Boscari F, Avogaro A, Bruttomesso D, Fadini GP. Glycaemic Control Among People with Type 1 Diabetes During Lockdown for the SARS‐CoV‐2 Outbreak in Italy. Diabetes Ther. 2020;11:1 ‐ 11. [DOI] [PMC free article] [PubMed] [Google Scholar]
- 6. Beato‐Víbora PI. No deleterious effect of lockdown due to COVID‐19 pandemic on glycaemic control, measured by glucose monitoring, in adults with type 1 diabetes. Diabetes Technol Ther. 2020; 10.1089/dia.2020.0184. Online ahead of print. [DOI] [PubMed] [Google Scholar]
- 7. Mair C, Wulaningsih W, Jeyam A, et al. Glycaemic control trends in people with type 1 diabetes in Scotland 2004–2016. Diabetologia. 2019;62:1375 ‐ 1384. [DOI] [PMC free article] [PubMed] [Google Scholar]
- 8. Tyndall V, Stimson RH, Zammitt NN, et al. Marked improvement in HbA1c following commencement of flash glucose monitoring in people with type 1 diabetes. Diabetologia. 2019;62:1349 ‐ 1356. [DOI] [PMC free article] [PubMed] [Google Scholar]
- 9. Collaborative TO, Williamson E, Walker AJ, et al. OpenSAFELY: factors associated with COVID‐19‐related hospital death in the linked electronic health records of 17 million adult NHS patients. medRxiv. 2020 May 7;2020.05.06.20092999. 10.1038/s41586-020-2521-4 [DOI]
- 10. Nordfeldt S, Ludvigsson J. Seasonal variation of HbA1c in intensive treatment of children with type 1 diabetes. J Pediatr Endocrinol Metab. 2000;13:529 ‐ 535. [DOI] [PubMed] [Google Scholar]