

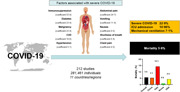
Abstract
Coronavirus disease 2019 (COVID‐19) has become a pandemic, but its reported characteristics and outcomes vary greatly amongst studies. We determined pooled estimates for clinical characteristics and outcomes in COVID‐19 patients including subgroups by disease severity (based on World Health Organization Interim Guidance Report or Infectious Disease Society of America/American Thoracic Society criteria) and by country/region. We searched Pubmed, Embase, Scopus, Cochrane, Chinese Medical Journal, and preprint databases from 1 January 2020 to 6 April 2020. Studies of laboratory‐confirmed COVID‐19 patients with relevant data were included. Two reviewers independently performed study selection and data extraction. From 6007 articles, 212 studies from 11 countries/regions involving 281 461 individuals were analyzed. Overall, mean age was 46.7 years, 51.8% were male, 22.9% had severe disease, and mortality was 5.6%. Underlying immunosuppression, diabetes, and malignancy were most strongly associated with severe COVID‐19 (coefficient = 53.9, 23.4, 23.4, respectively, all P < .0007), while older age, male gender, diabetes, and hypertension were also associated with higher mortality (coefficient = 0.05 per year, 5.1, 8.2, 6.99, respectively; P = .006‐.0002). Gastrointestinal (nausea, vomiting, abdominal pain) and respiratory symptoms (shortness of breath, chest pain) were associated with severe COVID‐19, while pneumonia and end‐organ failure were associated with mortality. COVID‐19 is associated with a severe disease course in about 23% and mortality in about 6% of infected persons. Individuals with comorbidities and clinical features associated with severity should be monitored closely, and preventive efforts should especially target those with diabetes, malignancy, and immunosuppression.
Keywords: clinical characteristics, COVID‐19, mortality, risk factors, severe
Highlights
-
1.
In this systematic review and meta‐analysis of 212 studies involving 281,461 individuals with COVID‐19 from 11 countries/regions, the overall mortality was 5.6%, and 22.9% had severe disease. Immunosuppression, diabetes, malignancy and abdominal pain were strongly associated with severe disease.
-
2.
Close to one‐quarter of individuals with COVID‐19 develop a severe disease course, and individuals with clinical features associated with severity should be monitored closely.
Abbreviations
- ARDS
adult respiratory distress syndrome
- ATS
American Thoracic Society
- CDC
Centers for Disease Control and Prevention
- CFR
case‐fatality rate
- COVID‐19
coronavirus disease 2019
- CT
computed tomography
- ECMO
extracorporeal membrane oxygenation
- IDSA
Infectious Disease Society of America
- MERS
Middle East Respiratory Syndrome
- NOS
Newcastle‐Ottawa scale
- PCR
polymerase chain reaction
- SARS‐CoV‐2
severe acute respiratory syndrome coronavirus 2
- WHO
World Health Organization
1. INTRODUCTION
On 11 March, the World Health Organization (WHO) declared the coronavirus disease 2019 (COVID‐19) outbreak caused by the severe acute respiratory syndrome coronavirus 2 (SARS‐CoV‐2) a pandemic. 1 Currently, the deadly COVID‐19 has no effective therapy or vaccine. In addition, the signs of having COVID‐19 are nonspecific or can be absent, adding challenges to disease control and prevention. 2 , 3 , 4 , 5 , 6 , 7 , 8 , 9 As COVID‐19 rapidly spreads, many available data sources were based on case series or small cohorts, limiting their conclusions.
The current pandemic has highlighted the marked variation in patient demographics, access to healthcare, healthcare infrastructure, and preparedness among regions, and these, in turn, have significantly impacted outcomes. 10 These factors are important for health policy, not only for the current pandemic but for future global events. Therefore, the aim of this systematic review and meta‐analysis aims was to elucidate regional variations in baseline clinical characteristics, presentation, and factors associated with outcomes in COVID‐19 patients including subgroup analysis by country/region and by disease severity.
2. METHODS
2.1. Search strategy and selection criteria
Following the Preferred Reporting Items for Systematic Reviews and Meta‐Analyses statement for the conduct of meta‐analyses of observational studies (http://www.prisma-statement.org/), two researchers independently performed the literature search, extracted the data and assessed for study quality. This study protocol was submitted for PROSPERO registration.
We searched Pubmed, Embase, Scopus, the Cochrane Library, the Chinese Medical Journal as well as the BioRxiv, MedRxiv, Preprints databases from 1 January 2020 to 6 April 2020 using search strategy developed in collaboration with an experienced medical librarian (JAB). Detailed search strategy and selection criteria are described in the Appendix Methods section. Briefly, for Pubmed, we used the search term (2019‐nCoV OR 2019‐nCoV OR COVID‐19 OR SARS‐CoV‐2 OR [wuhan AND coronavirus] AND 2019/12[PDAT]:2030[PDAT]). Original research articles were included if they fulfilled the following criteria: (a) laboratory‐confirmed COVID‐19 and (b) if the study provided information about clinical features and outcomes of COVID‐19. We excluded animal studies, review articles, and consensus documents. Exclusion criteria were as follows: (a) the study was a review article, letters to the editor, clinical trial, animal study, comments, consensus documents; (b) the study did not focus on patients with COVID‐19 or diagnosis was unclear. If the patients came from the same hospital with overlapping cases, we only selected the publication containing greatest number of cases.
We developed a case report form to screen and extract data and a specific database to house all study data. Quality assessment was performed using the Newcastle‐Ottawa scale (NOS) which comprised of three domains: selection, comparability, and outcome. 11 The risk of bias was assessed based on a total score of nine stars such that studies with seven to nine stars had a low risk of bias, four to six stars had a moderate risk of bias, and one to three stars were considered as a high risk of bias. Articles were initially screened by titles and abstract, followed by full article review to identify eligible studies. Discordant results were resolved by discussion between the two reviewers and/or by consulting a third senior researcher.
2.2. Statistical analysis
We used a random‐effects model to estimate pooled means or proportions of relevant COVID‐19 clinical characteristics and/or outcomes such as demographic data, medical history, exposure history, underlying comorbidities, symptoms, signs, laboratory findings (complete blood count, blood chemistry, coagulation test, liver and renal function, electrolytes) and chest computed tomography (CT) scans, complications (eg, adult respiratory distress syndrome), and death in the overall and selected populations. We assessed for heterogeneity using the Cochran Q‐statistic and I2‐statistic. Estimates with P value of less than .05 in Q‐statistic and I 2 ≥ 50% were considered to have significant heterogeneity. The following subgroup analyses were performed to determine the source of the observed heterogeneity: age, gender, country/region, sample size, and quality assessment score. We performed meta‐regression to assess factors associated with severe disease which is based on the WHO Interim Guidance Report criteria for severe pneumonia. 12 , 13 In addition, we identified studies that reported outcomes in special subgroups including the pediatric age group and pregnant women. However, the data from pediatric and pregnant individuals were included only in subgroup analysis and not in the main meta‐analysis or in the meta‐regression. We utilized Egger's test to assess for publication bias. As a sensitivity analysis, we performed analysis without data from preprints studies, low‐quality studies, or studies with less than 10 patients. In addition, to assess whether there is a relationship between one or more covariates with mortality proportion, the direction, and magnitude of the relationship, we performed meta‐regression with the dependent variable being the logit transformation of mortality proportion (formula: in (p/(1‐p) = intercept + coefficient × (the value of covariate). 14 A P value of less than .05 suggests the presence of statistically significant relationship between the covariate and mortality proportion, the positivity or negativity of the coefficient denotes the direction of the relationship, and the numerical value of the coefficient corresponds to the magnitude of the relationship. All statistical analyses were conducted using the meta‐packages in R statistical software (version 3.6.3).
3. RESULTS
A total of 6007 articles were retrieved and 5795 were excluded as per our exclusion criteria (Figure 1). We analyzed data from 212 studies conducted in 11 countries/regions (Mainland China: 180, United States: 8, South Korea: 6, Singapore: 3, Italy: 3, Taiwan: 3, UK: 2, Hong Kong: 2, Canada: 1, Japan: 1, Vietnam: 1, and more than one country/region 2). Of these 212 articles, 164 were peer‐reviewed publications, and 48 were in preprint form; 161 were in English, and 51 were in Chinese. The details of study characteristics for each of the included 212 studies are summarized in Table S1. A total of 188 studies were included in the overall analysis, while 258 studies that provided data exclusively for special populations (eg, pediatric, pregnant, severe COVID‐19 vs nonsevere COVID‐19) were included only in subgroup analyses (Figure 1). Some studies provided data for more than one analysis, hence the sum added up to be greater than 212.
Figure 1.
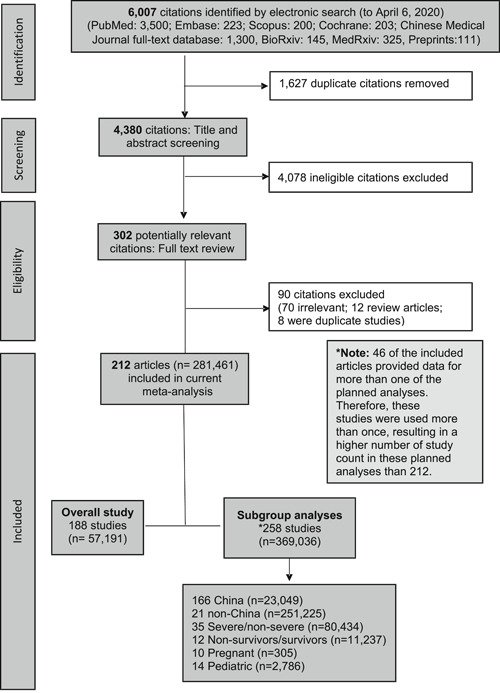
Flow chart of systematic literature search and screening for studies of COVID‐19. COVID‐19, coronavirus disease 2019
The quality assessment for each paper is included in Table S1. The average NOS score was 7, with 122 studies being of high quality, 90 of medium quality, and none of low quality.
3.1. Geographic distribution and demographic characteristics
The majority of study patients came from the United States (n = 223 862; 79.5%) followed by Mainland China (n = 24 605; 8.7%), Italy (n = 24 105; 8.6%), and South Korea (n = 7848; 2.8%). The individual study sample sizes ranged from 1 to 149 082 (Table S1).
The pooled mean age in the overall cohort was 46.7 years (95% confidence interval [CI]: 42.8‐50.5) using data from 88 studies (n = 8908) (Table 1) and was similar between patients from Mainland China and outside Mainland China (P = .1) (Table S2A), and within Mainland China between those from Hubei vs outside Hubei (P = .08) (Table S2B).
Table 1.
Demographic and clinical characteristics of COVID‐19 patients
| Number (N) of studies | Number (n) of study population | Valuea | 95% CI | |
|---|---|---|---|---|
| Demographics | ||||
| Mean age, y | 88 | 8908 | 46.7 | 42.8‐50.6 |
| Male (%) | 168 | 17 1689 | 51.9 | 50.4‐53.2 |
| Female (%) | 164 | 17 1034 | 48.95 | 47.5‐50.4 |
| Clinical presentation | ||||
| Onset | ||||
| Time from illness onset to first hospital admission, d | 26 | 3508 | 5.5 | 4.6‐6.4 |
| Incubation period, d | 7 | 746 | 5.3 | 4.5‐5.99 |
| General | ||||
| Fever (%) | 156 | 15 921 | 78.8 | 76.2‐81.3 |
| Chills (%) | 28 | 4430 | 15.7 | 12.3‐19.7 |
| Fatigue (%) | 99 | 13 680 | 32.2 | 28.0‐36.6 |
| Myalgia (%) | 78 | 10 728 | 21.3 | 18.1‐24.9 |
| Malaise (%) | 39 | 2526 | 37.9 | 29.5‐47.1 |
| Respiratory | ||||
| Cough (%) | 119 | 12 782 | 53.9 | 50.0‐57.7 |
| Expectoration (%) | 61 | 8748 | 24.2 | 21.0‐27.8 |
| Rhinorrhea (%) | 43 | 6072 | 7.5 | 5.7‐9.6 |
| Chest pain (%) | 32 | 3512 | 9.0 | 6.2‐13.1 |
| Shortness of breath (%) | 82 | 11 205 | 18.99 | 15.7‐22.8 |
| Gastrointestinal | ||||
| Vomiting (%) | 48 | 7484 | 4.7 | 3.8‐5.8 |
| Abdominal pain (%) | 23 | 3350 | 4.5 | 3.3‐6.2 |
| Diarrhea (%) | 94 | 12 149 | 9.5 | 7.8‐11.5 |
| Anorexia (%) | 30 | 3610 | 13.99 | 10.4‐18.5 |
| Nausea (%) | 38 | 5599 | 6.96 | 5.3‐9.1 |
| Neurological | ||||
| Dizziness (%) | 24 | 2350 | 9.4 | 7.1‐12.4 |
| Headache (%) | 76 | 12 382 | 9.7 | 8.3‐11.3 |
| Comorbidities | ||||
| Malignancy (%) | 47 | 8733 | 3.3 | 2.6‐4.3 |
| Chronic heart disease (%) | 52 | 82 217 | 7.9 | 4.9‐12.6 |
| Chronic renal disease (%) | 32 | 81 471 | 2.8 | 1.2‐6.1 |
| Chronic lung disease (%) | 30 | 78 691 | 4.0 | 2.3‐6.95 |
| Chronic liver disease (%) | 32 | 79 525 | 3.3 | 1.7‐6.3 |
| Diabetes (%) | 71 | 84 469 | 10.2 | 7.4‐13.9 |
| Hypertension (%) | 74 | 9937 | 19.4 | 17.3‐21.6 |
| Clinical course and outcomes | ||||
| Intensive care unit | 39 | 80 487 | 10.96 | 6.6‐17.6 |
| Mortality (%) | 86 | 52 808 | 5.6 | 4.2‐7.5 |
| Shock (%) | 13 | 2985 | 4.3 | 2.3‐7.9 |
| Mechanical ventilation (%) | 36 | 6152 | 7.1 | 4.5‐11.0 |
| Hepatic injury (%) | 13 | 77 331 | 7.9 | 2.6‐21.7 |
| Renal injury (%) | 17 | 77 679 | 3.6 | 1.2‐10.1 |
| Cardiac injury (%) | 10 | 1417 | 9.4 | 4.5‐18.8 |
Abbreviations: CI, confidence interval; COVID‐19, coronavirus disease 2019.
Value expressed as mean or %.
The overall pooled proportion of males was 51.8% (95% CI: 50.4‐53.2) (168 studies, Table 1) and was similar when stratified by within vs outside Mainland China, within Mainland China Hubei vs outside Hubei, and within Hubei Wuhan vs outside Wuhan (all P > .05) (Tables S2A and S2B).
3.2. Diagnosis method, incubation period, and mode of transmission
Of the 212 studies, 190 (89.6%) studies used polymerase chain reaction (PCR) alone to diagnose COVID‐19, one study (0.5%) used a serum antibody test alone, nine (4.3%) studies used a combination of chest CT and PCR tests, one study (0.5%) used a combination of chest CT and antibody tests, and one study (0.5%) used a combination of PCR, chest CT, and antibody tests. The remaining 10 (4.7%) studies did not specify how COVID‐19 was diagnosed. Studies from all countries apart from Mainland China relied on PCR alone to diagnose COVID‐19.
The pooled mean incubation period in the overall cohort was 5.3 days (95% CI: 4.5‐6.0) (seven studies, 746 patients, Table 1). The incubation period was shorter in studies outside Mainland China (4.0 days, 95% CI: 3.0‐5.1) vs 6.0 days (95% CI: 4.7‐7.3) in Mainland China (P = .02) (Table S2A). However, there was only one study that provided data for incubation period outside of Mainland China. Within Mainland China, there was no difference in the incubation period when stratified by Hubei vs outside Hubei (P = .4) (Table S2B).
A total of 161 studies (n = 17 648) provided data for mode of transmission. The most common mode of transmission was travel‐related (58.1%, 95% CI: 51.1‐64.8), followed by close contacts (43.1%, 95% CI: 37.2‐49.2), and finally community spread (27.4%, 95% CI: 18.4‐38.7).
3.3. Clinical symptoms, disease presentation, and course
The pooled mean time from illness onset to first hospitalization was 5.5 days (95% CI: 4.6‐6.4) (26 studies, 3508 patients, Table 1). This duration was shorter in studies outside Mainland China (3.3 days, 95% CI: 2.2‐4.5) compared to within Mainland China (5.7 days, 95% CI: 4.8‐6.7) (Table S2A) (P = .002). Within Mainland China, the time from illness onset to hospitalization was longer in Hubei province (7.5 days, 95% CI: 5.7‐9.2) compared with outside Hubei province (4.5 days, 95% CI: 3.8‐5.3) (P = .003) (Table S2B).
The most common symptom was fever (78.8%, 95% CI: 76.2‐81.3), followed by cough (53.9%, 95% CI: 50.0‐57.7) and malaise 37.9% (95% CI: 29.5‐47.1). In contrast to other respiratory viral infections, the proportion of individuals with rhinorrhea was low (7.5%, 95% CI, 5.7‐9.6). With regards to gastrointestinal symptoms, the proportion of individuals with diarrhea was 9.5% (95% CI: 7.8‐11.5), while abdominal pain and vomiting were less common (4.5%, 95% CI: 3.3‐6.2 and 4.7%, 95% CI: 3.8‐5.8, respectively).
The pooled proportion of patients admitted to intensive care unit (ICU) was 10.96% (95% CI: 6.6‐17.6) (39 studies, 80 487 patients, Figure 2A), without significant differences among the included countries/regions (P = .3) (Figure 2A). However, within Mainland China, there was a higher proportion of individuals admitted to ICU in Hubei province vs outside Hubei province (15.6%, 95% CI: 10.8‐21.95 vs 8.1%, 95% CI: 4.8‐13.4; P = .04) (Figure 2A and Table S2B); and within Hubei province, there were more patients admitted to ICU in Wuhan vs outside Wuhan (16.6%, 95% CI: 10.96‐24.3 vs 8.8%, 95% CI: 5.7‐13.1; P = .03).
Figure 2.
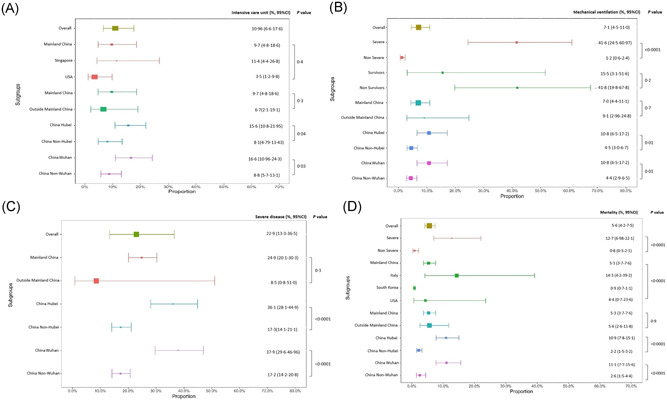
A, Proportion of COVID‐19 patients requiring intensive care unit. B, Proportion of COVID‐19 patients requiring mechanical ventilation. C, Proportion of COVID‐19 patients with severe disease. D, COVID‐19 mortality. COVID‐19, coronavirus disease 2019
The pooled proportion of patients that required mechanical ventilation from 36 studies (6152 patients) was 7.1% (95% CI: 4.5‐11.0) (Figure 2B and Table 1). Within Mainland China, this proportion was higher in Hubei province compared with outside Hubei (10.8%, 95% CI: 6.5‐17.2 vs 4.5%, 95% CI: 3.0‐6.7; P = .01) (Figure 2B and Table S2B). Within Hubei province, 10.8% (95% CI: 6.5‐17.2) of patients from Wuhan required mechanical ventilation compared to 4.4% (95% CI: 2.9‐6.5) in Hubei patients from outside Wuhan city (P = .01).
Overall, 22.9% (95% CI: 13.3‐36.5) of COVID‐19 patients had severe disease (35 studies, 79 170 patients) as defined by WHO Interim Guidance Report or Infectious Disease Society of America/American Thoracic Society criteria (Figure 2C), 12 , 13 with no statistically significant difference between Mainland China vs outside Mainland China patients (P = .3). However, within Mainland China, the proportion of severe disease within Hubei was higher than that outside of Hubei (36.1%, 95% CI: 28.1‐44.9 vs 17.3%, 95% CI: 14.1‐21.1; P < .0001).
3.4. Demographic characteristics and comorbidities
Individuals with severe disease were significantly older (60.4 years, 95% CI: 57.8‐63.1) compared to those without severe disease (44.6 years, 95% CI: 42.8‐46.3), P < .0001 (Table S3B). There were significantly more males in the severe group (60.8%, 95% CI: 57.2‐64.2) compared with the nonsevere group (47.6%, 95% CI: 44.9‐50.4), P < .0001. Compared to patients without severe disease, severe COVID‐19 patients were more likely to have hypertension (35.9%, 95% CI: 31.2‐40.7 vs 14.5%, 95% CI: 11.5‐18.1; P < .0001), diabetes (20.1%, 95% CI: 16.6‐24.2 vs 6.2%, 95% CI: 3.2‐11.9; P = .0005) as well as chronic renal disease (P = .01), chronic lung disease (P = .02), chronic heart disease (P = .002), and malignancy (P = .03).
3.5. Symptoms, signs, and laboratory characteristics
Shortness of breath was present in about half (48.96%, 95% CI: 39.3‐58.7) of severe cases compared with only 13.6% (95% CI: 9.8‐18.5) of nonsevere cases, P < .000 (Table S3B). Chills (P < .0001), abdominal pain (P = .01) and dizziness (P = .02) were also more common among those with severe disease.
Pooled mean AST (P < .0001), ALT (P = .006), urea (P = .02), C‐reactive protein (P < .0001), neutrophil count (P = .0007) and white blood cell count (P = .003) were higher in severe disease compared with nonsevere disease (Table S3C). Conversely, lymphocyte count was lower in severe disease (P < .0001).
In general, shock and organ injuries were more common in severe cases compared to nonsevere ones (26.5%, 95% CI: 15.95‐40.7 vs 1.2%, 95% CI: 0.4‐3.1; P < .000 for shock; 14.1%, 95% CI: 6.6‐27.8 vs 1.96%, 95% CI: 0.5‐7.5; P = .01 for cardiac injury).
3.6. Meta‐regression: factors associated with severe COVID‐19
Meta‐regression of multiple study‐level clinical and laboratory characteristics showed statistically significant correlation between several factors and disease severity (Table 2). The clinical characteristics strongly associated with severity were immunosuppression (coefficient: 53.9, 95% CI: 31.3‐76.4; P < .0001), abdominal pain (coefficient: 24.7, 95% CI: 17.4‐31.94; P < .0001), malignancy (coefficient 23.4, 95% CI: 9.9‐36.94; P = .0007) and diabetes (coefficient: 23.4, 95% CI: 14.99‐31.7; P < .0001). The complete list of variables analyzed by meta‐regression is found in Table S4A.
Table 2.
Significant factors associated with severe COVID‐19 illnessa
| Coefficient | 95% CI | P | |
|---|---|---|---|
| Diabetes | 23.4 | 14.99‐31.7 | <.0001 |
| Malignancy | 23.4 | 9.9‐36.9 | .0007 |
| Cerebrovascular disease | 19.6 | 2.6‐36.6 | .02 |
| Hypertension | 5.1 | 1.1‐9.1 | .01 |
| Immunosuppressed | 53.9 | 31.3‐76.4 | <.0001 |
| Time from illness onset to first hospital admission, d | 0.4 | 0.1‐0.6 | .0008 |
| Shortness of breath | 5.4 | 4.1‐6.7 | <.0001 |
| Vomiting | 11.4 | 0.2‐22.7 | .05 |
| Abdominal pain | 24.7 | 17.4‐31.9 | <.0001 |
| Fatigue | 1.7 | 0.3‐3.0 | .01 |
| Chest pain | 4.5 | 1.8‐7.1 | .001 |
| Nausea | 8.8 | 0.2‐17.4 | .05 |
| Respiratory failure | 1.4 | 0.6‐2.3 | .001 |
| Lymphocyte count, g/L | −2.2 | −4.3‐(−0.2) | .04 |
| Neutrophil count, g/L | 0.6 | 0.2‐0.9 | .0008 |
| Albumin, µmol/L | −0.2 | −0.3‐(−0.1) | .0009 |
| C‐reactive protein, mg/L | 0.02 | 0.01‐0.04 | .007 |
Abbreviations: ATS, American Thoracic Society; CI, confidence interval; COVID‐19, coronavirus disease 2019; IDSA, Infectious Disease Society of America; WHO, World Health Organization.
3.7. Mortality outcome
The overall pooled mortality was 5.6% (95% CI: 4.2‐7.5) (Figure 2D) using data from 86 studies and 52 808 patients (number of studies: Mainland China: 73, Italy: 3, United States: 3, Singapore: 2, South Korea 2, UK 1, Vietnam 1, Global 1).
Mortality varied significantly amongst individual countries/regions, 5.3% (95% CI: 3.7‐7.6) in Mainland China, 14.3% (95% CI: 4.2‐39.2) in Italy, 4.4% (95% CI: 0.7‐23.6) in United States, and 0.9% (95% CI: 0.7‐1.1) in South Korea, P < .0001. However, there was no significant mortality difference when stratified by Mainland China (5.3%, 95% CI: 3.7‐7.6) vs non‐Mainland China (5.6%, 95% CI: 2.6‐11.8), P = .90.
3.8. Clinical characteristics of COVID‐19 survivors vs nonsurvivors
Nonsurvivors were almost 20 years older (68.9 years, 95% CI: 66.8‐71.0) than survivors (50.7 years, 95% CI: 46.6‐54.8), P < .0001 (Table S3A), and there were no differences in the proportion of males (P = .3). Nonsurvivors compared to survivors were more likely to have hypertension (44.9%, 95% CI: 34.4‐55.8 vs 23.8%, 95% CI: 19.3‐29.0; P = .0003) and diabetes (24.8%, 95% CI: 18.7‐32.0 vs 13.9%, 95% CI: 10.5‐18.1; P = .003), as well as malignancy (P = .01), chronic heart disease (P = .003), chronic renal disease (P = .03), and chronic lung disease (P = .04). However, there were no significant differences between the nonsurvivor and survivor group in terms of presenting symptoms or organ injuries except for kidney injury (29.98%, 95% CI: 20.6‐41.5 vs 4.5%, 95% CI: 0.8‐21.7; P = .02) (Table S3A).
3.9. Meta‐regression: factors associated with COVID‐19 mortality
Meta‐regression of multiple study‐level clinical and laboratory characteristics showed statistically significant correlation between several clinical and laboratory factors and mortality (Table 3). Among baseline characteristics, age, male sex, hypertension, and diabetes were significantly associated with increased mortality. Clinical factors also significantly associated with mortality included pneumonia, kidney injury, shock, cardiac failure, and acute respiratory distress syndrome. Laboratory parameters significantly correlated with mortality included increased white cell count, neutrophil count, AST, ALT, creatinine, lactate dehydrogenase, procalcitonin, and C‐reactive protein (Table 3). Lymphocyte count and albumin were inversely correlated with mortality. The complete list of variables analyzed by meta‐regression is found in Table S4B.
Table 3.
Significant factors associated with COVID‐19 mortality
| Factors | Coefficient | 95% CI | P |
|---|---|---|---|
| Age | 0.05 | 0.02‐0.08 | .0005 |
| Male | 5.1 | 2.4‐7.9 | .0002 |
| Diabetes | 8.2 | 2.4‐13.99 | .006 |
| Hypertension | 6.99 | 3.3‐10.7 | .0002 |
| Shortness of breath | 2.8 | 1.0‐4.6 | .002 |
| Fever | 2.9 | 0.2‐5.7 | .04 |
| Cough | 2.1 | 0.2‐4.1 | .03 |
| Chills | 5.8 | 2.8‐8.9 | .0002 |
| Fatigue | 2.5 | 0.5‐4.5 | .01 |
| Malaise | 2.7 | 0.7‐4.8 | .0098 |
| Diarrhea | 3.4 | 0.01‐6.9 | .05 |
| Pneumonia | 11.7 | 5.9‐17.5 | <.0001 |
| Shock | 23.3 | 13.7‐32.9 | <.0001 |
| Kidney injury | 14.4 | 9.0‐19.8 | <.0001 |
| Cardiac failure | 6.2 | 2.3‐10.1 | .002 |
| Adult respiratory syndrome | 6.1 | 4.5‐7.6 | <.0001 |
| Respiratory failure | 2.5 | 0.4‐4.6 | .02 |
| Total white blood cell count, g/L | 0.3 | 0.07‐0.6 | .01 |
| Lymphocyte count, g/L | −2.1 | −3.3‐(−0.8) | .001 |
| Neutrophil count, g/L | 0.5 | 0.3‐0.8 | <.0001 |
| Alanine aminotransferase, U/L | 0.06 | 0.01‐0.10 | .01 |
| Aspartate aminotransferase, U/L | 0.03 | 0.01‐0.05 | .002 |
| Total bilirubin, µmol/L | 0.2 | 0.01‐0.4 | .04 |
| Albumin, g/L | −0.4 | −0.5‐(−0.2) | <.0001 |
| Creatinine, μmol/L | 0.03 | 0.01‐0.05 | .0006 |
| Lactate dehydrogenase, U/L | 0.01 | 0.00‐0.02 | .007 |
| Procalcitonin, ng/mL | 2.1 | 0.7‐3.5 | .004 |
| C‐reactive protein, mg/L | 0.04 | 0.02‐0.05 | <.0001 |
| Blood urea nitrogen, mmol/L | 0.4 | 0.09‐0.6 | .009 |
| Creatinine kinase, U/L | −0.02 | −0.03‐(−0.005) | .003 |
| Prothrombin time, s | 0.4 | 0.01‐0.8 | .04 |
| Antibiotic usage | 4.1 | 2.9‐5.4 | <.0001 |
| Corticosteroids usage | 4.3 | 2.6‐6.1 | <.0001 |
| Immunoglobulin | 3.6 | 0.7‐6.4 | .01 |
| Continuous renal replacement therapy | 18.7 | 5.4‐32.0 | .006 |
| Extracorporeal membrane oxygenation | 24.7 | 0.7‐48.6 | .04 |
| Intensive care unit | 5.1 | 3.0‐7.2 | <.0001 |
Abbreviations: CI, confidence interval; COVID‐19, coronavirus disease 2019.
3.10. Pediatrics
A total of 14 studies involving 2786 patients aged 0.55 to 18 years provided data for this analysis. The pooled mean age was 4.6 years (95% CI: 1.1‐12.8), and 50.3% (95% CI: 43.99‐56.7) were male. Twelve studies (296 individuals) provided data for mortality. The pooled mortality was 3.8% (95% CI: 1.8‐8.1), 8.1% (95% CI: 2.8‐21.3) required admission to ICU, and 5.99% (95% CI: 2.5‐13.7) required mechanical ventilation.
3.11. Pregnant women
Analysis of nine studies comprising of 305 pregnant COVID‐19 patients demonstrated a pooled proportion of patients requiring ICU admission of 6.9% (95% CI: 2.5‐18.0). The pooled proportion of preterm delivery was 26.8% (95% CI: 13.99‐45.2) and of fetal loss was 4.6% (95% CI: 1.9‐10.5). Finally, among a small sample of 43 patients from six studies, the pooled proportion of obstetric complications (eg, pre‐eclampsia, premature rupture of membranes, gestational hypertension) was 51.7 (95% CI: 36.9‐66.3).
Sensitivity analyses were performed for the clinical characteristics and outcomes of COVID‐19 individuals, excluding studies that were (a) in preprint form and (b) studies with less than 10 individuals (Table S5A‐C). The results from the sensitivity analyses yielded similar results to the main analyses. As all included studies were of at least moderate quality, sensitivity analyses excluding low‐quality studies were not performed.
There was considerable heterogeneity among the studies for the overall and subgroup results (all I 2 statistic >98.00). Egger's test was not suggestive of significant publication bias in the analysis for mortality (P = .6) but was significant in the analysis for severity (P < .001).
4. DISCUSSION
In this large and comprehensive systematic review and meta‐analyses involving 212 studies and 281,461 individuals from 11 countries/regions, we found that COVID‐19 patients had a mean age of about mid 40's, equally distributed among the sexes, and without significant demographic differences among the countries/regions analyzed. We estimated a severe disease rate of about 23% and a mortality of about 6%, with the main variation toward the highest severe disease rate for Wuhan, China (38%), and highest mortality for Italy (14%) followed by Wuhan and Hubei (about 11%). Among those with severe disease, the pooled mean age was 60 years and more than half (61%) were male. In addition, severe COVID‐19 patients were more likely to have existing comorbidities such as diabetes, malignancy, immunosuppression, and hypertension, highlighting the special need for disease prevention and control in these high‐risk populations.
The pooled mean time from the onset of symptoms to hospitalization was 5.48 days and was notably longer in Mainland China compared to outside of Mainland China (about 6 vs 3 days). Within Hubei province, the time to hospitalization was 7.5 days compared to 4.5 days outside of Hubei, which may be related to the overwhelmed healthcare resources closer to the epicenter of the outbreak. We also noted significant differences in ICU admission within China with utilization rates being about 16% to 17% in Wuhan compared to 8% to 9% outside of Wuhan and Hubei. Wuhan and Hubei also had two times higher rates of mechanical ventilation than outside these areas (about 11% vs 5%). Together, these data suggest the presence of delayed diagnosis and care leading to more severe disease at presentation likely due to the overwhelmed healthcare resources at the onset of this pandemic, which advocates for local preparedness to prevent severe disease progression and mortality.
With regards to presenting symptoms as potential predictors for disease progression, abdominal pain, an infrequent symptom, were notably strongly associated with severe COVID‐19 disease. Those who present with abdominal pain should be more closely monitored for rapid decompensation. Similarly, patients with low lymphocyte and albumin levels may have a more severe course of disease. We hypothesize that people at most risk for dying may be the ones that are malnourished, as reflected in low albumin. This hypothesis is probable especially when we look at countries such as the United States where clusters of COVID‐19 cases appearing in elderly nursing homes carry a disproportionate number of deaths. 15 Therefore, this is an area that needs further research especially as the world's population continues to age 16 and as the pandemic marches to resource‐limited regions where malnutrition may be more common.
Among children, the mortality was nearly 4%, with 8% requiring ICU admission and 6% requiring mechanical ventilation. This pooled data may be limited by the small numbers of included patients, and we note that only 1.8% of patients in a recent study were admitted to the ICU. 17 Similarly, the pooled data show that among pregnant individuals, 7% were admitted to the ICU, fetal loss occurred in 5%, and half develop obstetric related complications. However, our pooled data were based on only 43 patients drawn from six studies and should be interpreted with caution, but these findings warrant further investigation.
Our study is not without its limitations. Due to the lack of age group studies, we were unable to perform any subanalyses by age groups other than the pediatric population. As the proportion of individuals with mild or asymptomatic COVID‐19 infection may be much higher than expected, the pooled data we report is likely to be an over‐estimate as most of the data comes from hospital‐based studies. With the pandemic constantly evolving, a recent study was published after our study completion showing a 21% mortality in New York City. 18 Another limitation of our study is the fact that we included case reports to avoid missing potentially important data for this new pandemic, but case report data may bias towards the extremes or atypical. However, we performed sensitivity analyses that excluded studies with less than 10 patients and found similar results. Part of the differences in death rates among the different studies and countries/regions could also be attributed to how COVID‐19 deaths are reported. Some countries may only be reporting deaths that are felt to be a direct cause of COVID‐19 and not just deaths occurring in COVID‐19 patients. Therefore, a universal definition of which deaths should be reported needs to be developed. Nonetheless, these data are important for each respective country to determine their death rate in comparison to others when developing their own policies addressing COVID‐19. In addition, the majority of studies included in our meta‐analysis are hospital‐based and/or tertiary care center‐based studies, so our data may not be generalizable to affected patients outside of this setting, and further studies focusing on less severe community patients are needed. Last, as the pandemic spreads across the globe, additional data have become available for other regions not well represented in this study; therefore, more updated review and meta‐analysis providing data for more regions of the world are needed.
In conclusion, we provide a large systemic review and regarding the clinical features and associations with severe COVID‐19 disease. These data can inform healthcare providers and policy decision‐makers as to how best to identify and monitor patients at most risk for the development of severe COVID‐19 as well as to identify vulnerable populations where special measures to prevent COVID‐19 transmission may be needed.
AUTHOR CONTRIBUTIONS
Guarantor of article: Mindie H. Nguyen; study concept and study supervision: Mindie H. Nguyen; study design: Jie Li, Daniel Q. Huang, Ramsey Cheung, and Mindie H. Nguyen; manuscript drafting: Jie Li, Daniel Q. Huang, Linda Henry, Ramsey Cheung, Mindie H. Nguyen; manuscript edition and final approval: all authors; data analysis: Biyao Zou, Jie Li, Daniel Q. Huang, and Mindie H. Nguyen; data collection and/or data interpretation: all authors.
CONFLICT OF INTERESTS
Ramsey Cheung has received research support for Gilead Sciences. Mindie H. Nguyen has received research support from Gilead, BMS, and Janssen, and has served as an advisory board member or consultant for Dynavax, Gilead, Alnylam, BMS, Novartis, Spring Bank, and Janssen. Other authors have no disclosures.
Supporting information
Supporting information
Li J, Huang DQ, Zou B, et al. Epidemiology of COVID‐19: A systematic review and meta‐analysis of clinical characteristics, risk factors, and outcomes. J Med Virol. 2021;93:1449‐1458. 10.1002/jmv.26424
Jie Li and Daniel Q. Huang contributed equally to this article.
[Correction added after online publication on 10 September 2020: Duplicate table 4 has been removed completely]
DATA AVAILABILITY STATEMENT
The data that supports the findings of this study are available in the supplementary material of this article.
REFERENCES
- 1. Cucinotta D, Vanelli M. WHO declares COVID‐19 a pandemic. Acta bio‐medica: Atenei Parmensis. 2020;91:157‐60. [DOI] [PMC free article] [PubMed] [Google Scholar]
- 2. Young BE, Ong SWX, Kalimuddin S, et al. Epidemiologic features and clinical course of patients infected with SARS‐CoV‐2 in Singapore. JAMA. 2020;323(15):1488‐1494. [DOI] [PMC free article] [PubMed] [Google Scholar]
- 3. Guan W, Ni Z, Hu Y, et al. Clinical characteristics of coronavirus disease 2019 in China. N Engl J Med. 2020;382:1708‐1720. [DOI] [PMC free article] [PubMed] [Google Scholar]
- 4. Yang X, Yu Y, Xu J, et al. Clinical course and outcomes of critically ill patients with SARS‐CoV‐2 pneumonia in Wuhan, China: a single‐centered, retrospective, observational study. The Lancet Respir Med. 2020;8:475‐481. [DOI] [PMC free article] [PubMed] [Google Scholar]
- 5. Wang D, Hu B, Hu C, et al. Clinical characteristics of 138 hospitalized patients with 2019 novel coronavirus‐infected pneumonia in Wuhan, China. JAMA—J American Medical Association. 2020;323:1061. [DOI] [PMC free article] [PubMed] [Google Scholar]
- 6. Arentz M, Yim E, Klaff L, et al. Characteristics and outcomes of 21 critically Ill patients with COVID‐19 in Washington State. JAMA. 2020;323:1612. [DOI] [PMC free article] [PubMed] [Google Scholar]
- 7. Chung M, Bernheim A, Mei X, et al. CT imaging features of 2019 novel coronavirus (2019‐nCoV). Radiology. 2020;295:200230‐207. [DOI] [PMC free article] [PubMed] [Google Scholar]
- 8. Wang Y, Liu Y, Liu L, Wang X, Luo N, Ling L. Clinical outcome of 55 asymptomatic cases at the time of hospital admission infected with SARS‐coronavirus‐2 in Shenzhen, China. J Infect Dis. 2020;221(11):1770‐1774. [DOI] [PMC free article] [PubMed] [Google Scholar]
- 9. Mizumoto K, Chowell G. Estimating risk for death from 2019 novel coronavirus disease, China, January‐February 2020. Emerging Infect Dis. 2020;26:26‐1256. [DOI] [PMC free article] [PubMed] [Google Scholar]
- 10. Baloch S, Baloch MA, Zheng T, Pei X. The coronavirus disease 2019 (COVID‐19) pandemic. Tohoku J Exp Med. 2020;250(4):271‐278. 10.1620/tjem.250 [DOI] [PubMed] [Google Scholar]
- 11. Luchini C, Stubbs B, Solmi M, Veronese N. Assessing the quality of studies in meta‐analyses: advantages and limitations of the Newcastle Ottawa Scale. World J Meta‐Analysis. 2017;20175(4):80‐84. [Google Scholar]
- 12. Metlay JP, Waterer GW, Long AC, et al. Diagnosis and treatment of adults with community‐acquired pneumonia. An official clinical practice guideline of the American Thoracic Society and Infectious Diseases Society of America. Am J Respir Crit Care Med. 2019;200:e45‐e67. [DOI] [PMC free article] [PubMed] [Google Scholar]
- 13. World Health Organization . 2020. Clinical management of severe acute respiratory infection when COVID‐19 disease is suspected: interim guidance, 13 March 2020. World Health Organization. https://apps.who.int/iris/handle/10665/331446. License: CC BY‐NC‐SA 3.0 IGO
- 14. Borenstein M, Hedges LV, Higgins JPT, Rothstein HR, Introduction to Meta‐Analysis, p. 190. https://www.meta-analysis.com/downloads/Meta-analysis/Metaregression.pdf. Accessed July 8, 2020.
- 15. Barnett ML, Grabowski DC. Nursing Homes Are Ground Zero for COVID‐19 Pandemic. JAMA Health Forum, 2020. https://jamanetwork.com/Channels/health-forum/fullarticle/2763666 [DOI] [PubMed]
- 16. World population prospects . 2019. New York: United Nations; (https://population.un.org/wpp/). [Google Scholar]
- 17. Lu X, Zhang L, Du H, et al. SARS‐CoV‐2 infection in children. N Engl J Med. 2020;382:1663‐5. [DOI] [PMC free article] [PubMed] [Google Scholar]
- 18. Richardson S, Hirsch JS, Narasimhan M, et al. Presenting characteristics, comorbidities, and outcomes among 5700 patients hospitalized with COVID‐19 in the New York City Area. JAMA. 2020;323(20):2052‐2059. [DOI] [PMC free article] [PubMed] [Google Scholar]
Associated Data
This section collects any data citations, data availability statements, or supplementary materials included in this article.
Supplementary Materials
Supporting information
Data Availability Statement
The data that supports the findings of this study are available in the supplementary material of this article.