

Abstract
Objectives/Hypothesis
To investigate causative viruses in patients with postviral olfactory disorders (PVOD).
Study Design
Case‐control study.
Methods
One hundred fifty‐one consecutive patients diagnosed with PVOD were enrolled, and samples from 38 patients who visited the doctor within 3 months of symptom onset were collected and analyzed. Thirty‐two individuals who underwent surgery for nasal septal deviation during the same time period were collected as the control group. The Sniffin' Sticks psychophysical olfactory test was used to evaluate olfactory function. Olfactory cleft specimens were collected using nasopharyngeal flocked swabs (COPAN FLOQSwabs). Eighteen viruses were tested for with the Luminex xTAG RVP FAST v2 Assay Kit.
Results
Out of the 38 patients with PVOD, rhinoviruses were detected in 13 patients, and coronavirus OC43 was detected in one patient. The frequency of positive virus detection in the patients with anosmia was higher than in those with hyposmia (58.8% vs. 19.0%, P = 0.018). In control group, rhinovirus was identified in one patient (3.1%). Nasal obstruction was the most common symptom and was experienced by 71.0% of patients.
Conclusions
Rhinovirus and coronavirus are more commonly identified in PVOD. Our methods represent an approach to screen for viruses that may be involved in PVOD.
Level of Evidence
4 Laryngoscope, 131:158–164, 2021
Keywords: Olfaction disorders, multiplex polymerase chain reaction, respiratory tract infections, virus.
INTRODUCTION
A viral upper respiratory tract infection (URTI) is one of the most commonly identified causes of persistent olfactory disorders. These disorders are also referred to as postviral olfactory disorders (PVODs). 1 Data from several smell and taste centers have demonstrated that approximately 11% to 40% of olfactory disorders treated at hospitals are caused by URTI. 2 , 3 , 4 , 5 Recently, Vaira et al. 6 reported that olfactory dysfunction is common in COVID‐19 patients. In some patients, this minor and nonspecific symptomatology can represent the only manifestation, which suggests that identification of viruses of PVOD is crucial not only to understanding the etiological factors of PVODs, but also to diagnosis of unusual viral infections.
It is speculated that some particular viruses might contribute to olfactory dysfunction, because there is a strong temporal connection between the onset of the URTI and the development of olfactory disorders. Potential responsible viruses include influenza viruses, parainfluenza viruses, respiratory syncytial virus, coxsackievirus, adenoviruses, poliovirus, enteroviruses (EVs), and herpesviruses, all of which give rise to the common cold and/or neural symptoms. 7 Unfortunately, due to the absence of direct and indirect evidence, causative viruses have not yet been definitively identified. More than a decade ago, several studies have tried to find responsible viruses for PVODs based on epidemiological data or virus detection. 8 , 9 , 10 , 11 It remain controversial if influenza viruses and coronaviruses are the causes of PVOD based on epidemiological data. 10 , 11 As an example, parainfluenza virus type 3 is most likely to be a causative virus via detecting the virus in nasal discharge 8 or turbinate epithelial cells of patients with PVOD using polymerase chain reaction (PCR). 9 Because most patients suffering a post‐URTI olfactory loss present long after the insult, and because the methods used to detect viruses in the nasal cavity are complex, the causative viruses of PVOD remain unclear.
In this study, for the first time we simultaneously investigated multiple respiratory viruses in the nasal cavity and olfactory cleft in patients with PVOD using the xTAG respiratory viral panel (RVP) (Luminex, Austin, TX), a commercial virus detection platform.
MATERIALS AND METHODS
Participants
This study was performed in outpatient clinics in Beijing Anzhen Hospital of Capital Medical University after approval was obtained from the institutional ethics committee. All subjects provided informed consent for participation.
Between August 2012 and July 2015, 151 consecutive patients diagnosed with postviral olfactory dysfunction were enrolled in this study. Samples from 38 patients who met the inclusion and exclusion criteria were collected and analyzed. The inclusion criteria were as follows: chief complaint of olfactory dysfunction onset after URTI, olfactory dysfunction confirmed by a professional using a subjective olfactory test, no obstruction of the olfactory cleft on nasal endoscopy or radiograph, visited the outpatient clinic within 3 months after the onset of olfactory dysfunction, and >18 years of age. The exclusion criteria were as follows: allergic rhinitis or chronic rhinosinusitis, platelet or bleeding tendency, contracting another cold within 3 months, pregnant or lactating, obvious central nervous system disease, and refusal to sign complementary informed consent.
Thirty‐two individuals who underwent surgery for nasal septal deviation during the same time period were collected (23 men, nine women), ranging in age from 18 to 48years (mean = 29.4 years). The exclusion criteria were as same as above.
Olfactory Testing and Subjective Assessments of Nasal Symptoms
The Sniffin' Sticks test battery was used to evaluate patients' subjective olfactory sense. This battery consists of a perceptual threshold test (T), an odor discrimination test (D), and an odor identification test (I). 12 , 13 , 14 The TDI score, which corresponds to the sum of the results obtained for the threshold, discrimination, and identification measures, was calculated and used to represent olfactory function. The cutoff level of hyposmia is 24.9 in subjects younger than 15 years, 30.3 for those aged 16 to 35 years, 27.3 for those aged 36 to 55 years, and 19.6 for subjects older than 55 years. A TDI score of <15 indicates anosmia. 15
To collect the patients' cold symptoms, related medical history, and other demographic data, the patients enrolled were sent questionnaires that included questions about age, gender, family history, symptoms, medication history, time of disease onset, and hospitalization time. The symptom categories and items in the questionnaires included systemic, nasal, pharyngeal, and lower respiratory tract symptoms. 11
Specimen Collection and Preparation
During the first visit, nasal discharge and exfoliated cells were collected from one nasal cavity and olfactory cleft (the relatively larger one) of chosen patients using COPAN's patented nasopharyngeal flocked swabs (FLOQSwabs; COPAN, Murrieta, CA) under nasal endoscope without local anesthesia. Unlike traditional fiber wound swabs, FLOQSwabs have no internal absorbent core to disperse and entrap the specimen, and the entire sample stays close to the surface for fast and complete elution. The perpendicular nylon fibers serve as a soft brush and enable improved collection of cell samples. A disposable clean plastic tube was placed in the anterior nares to avoid contamination. After the samples were collected, the swabs were immediately put into UTM Viral Transport Media (COPAN), which is a viral transport medium for the collection, transport, maintenance, and long‐term frozen storage of viruses that is stable at room temperature. The samples were stored at −80°C for up to 6 months or until viral testing. Samples from the control group were obtained in the same way technically as the clinic patients after general anesthesia before starting the surgery.
Detection of Respiratory Viruses With the xTAG RVP
The xTAG Respiratory Viral Panel Fast v2 (RVP FAST v2; Luminex) was used to detect nucleic acids from multiple respiratory viruses in swabs collected from clinical patients. The first‐generation version was the first panel for the molecular detection of respiratory viruses that received Food and Drug Administration (FDA) approval. This multiplex PCR kit can simultaneously detect 18 common respiratory viruses and subtypes in a single working shift. The following virus types and subtypes are identified: influenza virus (IVs) A subtype H1; influenza A subtype H3; influenza A subtype 2009 H1N1; influenza B; respiratory syncytial virus (RSVs); coronavirus (CoV) subtype 229E; OC43; NL63; HKU1; parainfluenza virus (PIVs) 1, 2, and 3; human metapneumovirus (hMPV); enterovirus/rhinovirus (EVs/RVs); adenovirus (AdVs); and human bocavirus (HBoV). The limits of detection for each virus at 95% confidence range is available in Supporting Appendix S1.
First, viral nucleic acids were extracted using the QIAamp MinElute Virus Spin Kit (QIAGEN, Hilden, Germany). RVP FAST v2 testing was performed in accordance with the package insert. The testing was conducted by a single operator at each of the clinical sites. The data generated by the Luminex LX 200 were analyzed by the xTAG data analysis software to provide a report summarizing the viruses present in the sample.
Due to the design of the primers and the similarity between RVs and EVs, which are all members of the picornavirus family and consist of a small, non‐enveloped particle containing an RNA genome, the RVP FAST v2 cannot directly distinguish between these two types of viruses. Therefore, additional differentiation of RV/EV‐positive specimens was performed based on an in‐house reverse‐transcription PCR and VP4‐based phylogenetic analysis. 8 , 16 , 17 Briefly, EVP4 (nt 541–560, 5′‐CTACTTTGGGTGTCCGTGTT‐3) and OL68 (nt 1178–1197, 5′‐GGTAA[C/T]TTCCACCACCA[A/T/G/C]CC‐3′) were used as forward and reverse primers, respectively. The PCR products were separated by denaturing agarose gel electrophoresis, and then the purified amplicons were identified by sequence analysis.
Statistical Analysis
Each group was described with the median and quartiles, and differences were determined by analysis of variance using SPSS version 17.0 (IBM, Armonk, NY). Between‐group differences in detection rate were determined by Fisher exact test. A P value <.05 was considered significant.
RESULTS
The Demographic and Clinical Characteristics of PVOD
Over nearly 3 years, 151 patients (48 males, 103 females) visiting the outpatient clinic with a major complaint of olfactory dysfunction after a URTI were diagnosed with PVOD. One hundred thirteen patients were excluded from nasal sample collection based on the strict exclusion and inclusion criteria: 64 because their visit took place more than 3 months after the onset of olfactory dysfunction, 12 because of allergic rhinitis, nine because of chronic rhinosinusitis, 26 due to refusal to provide informed consent, and two due to the contraction of another cold within 3 months. Thus, 38 patients (14 males, 24 females) were enrolled in the study. The male‐to‐female ratio for patients was 1:1.71. The patients' median age was 50.1 years (range = 27–77 years), with no sex‐related differences (female patients: mean age = 48.5 years, male patients: mean age = 52.7 years, P = 0.432).
Regarding the severity of olfactory loss, 17 (45.7%) and 21 (54.3%) PVOD patients were identified as anosmic and hyposmic, respectively. Control group subjects were all normal for olfactory function.
According to the questionnaire items regarding cold symptoms, nasal obstruction was the most common symptom and was experienced by 71.0% of patients, whereas nasal cleft obstruction was not obvious through clinical observation. Parosmia appeared in 29.0% of the patients. The observation frequency of each item and symptom category are shown in Fig. 1. The monthly distribution of when the patients from the two groups presented is shown in Fig. 2.
Fig. 1.
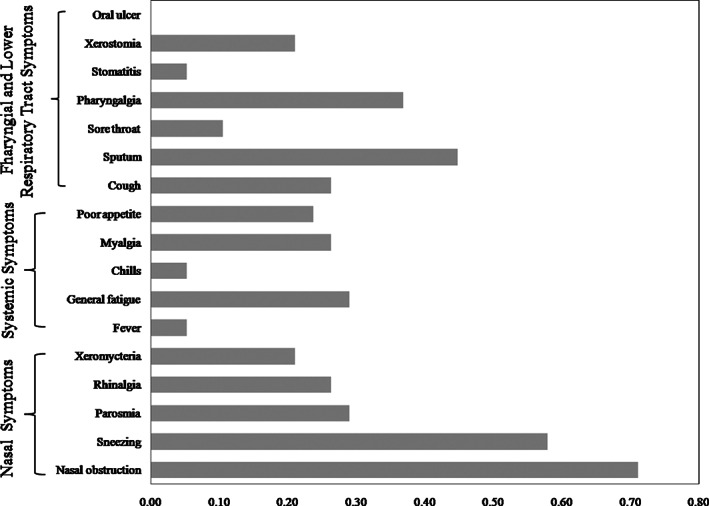
Percentage of the patients with postviral olfactory dysfunction reporting each symptom.
Fig. 2.
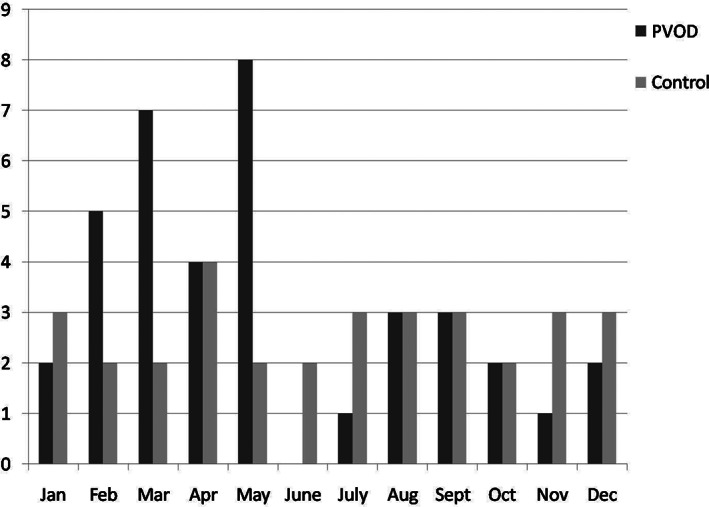
The monthly distribution of patients with postviral olfactory dysfunction (PVOD) and the control group with septal deviation.
Identification of 18 Viruses
RV was identified in 13 patients (34.2%), and CoV OC43 was found in one patient (2.6%) (Table I). Furthermore, the RVs found in the specimens were further classified as HRV‐78 (six patients), HRV‐40 (four patients), HRV‐75 (two patients), and HRV‐28 (one patient). In the control group, RV was identified in one patient (3.1%). There were no other viruses found in the control group.
TABLE I.
Identification of 18 Respiratory Viruses in the Olfactory Cleft of Patients With Postviral Olfactory Dysfunction by Multiplex Polymer Cain Reaction Detection.
| Case No. | Age, yr | Gender | Duration of Smell Loss, mo | T | D | I | TDI | Severity | Virus |
|---|---|---|---|---|---|---|---|---|---|
| 1 | 65 | M | 1 | 7 | 6 | 4 | 17 | Hyposmia | — |
| 2 | 56 | M | 1 | 6.5 | 7 | 7 | 20.5 | Hyposmia | — |
| 3 | 32 | F | 1 | 0 | 7 | 11 | 18 | Hyposmia | — |
| 4 | 36 | F | 1 | 5.5 | 10 | 10 | 25.5 | Hyposmia | — |
| 5 | 31 | F | 1 | 6 | 6 | 7 | 19 | Hyposmia | — |
| 6 | 44 | F | 3 | 5.5 | 8 | 11 | 24.5 | Hyposmia | — |
| 7 | 64 | M | 3 | 3.5 | 6 | 8 | 17.5 | Hyposmia | Coronavirus |
| 8 | 72 | F | 1 | 3.5 | 5 | 9 | 17.5 | Hyposmia | — |
| 9 | 34 | M | 3 | 4.25 | 8 | 6 | 18.25 | Hyposmia | — |
| 10 | 35 | M | 1 | 7 | 9 | 11 | 27 | Hyposmia | Rhinovirus |
| 11 | 35 | F | 1 | 5.5 | 8 | 12 | 25.5 | Hyposmia | — |
| 12 | 40 | F | 1 | 0 | 3 | 4 | 7 | Anosmia | — |
| 13 | 51 | F | 3 | 0 | 3 | 3 | 6 | Anosmia | Rhinovirus |
| 14 | 39 | M | 3 | 0 | 5 | 4 | 9 | Anosmia | — |
| 15 | 34 | M | 2 | 0 | 2 | 4 | 6 | Anosmia | Rhinovirus |
| 16 | 65 | M | 2 | 0 | 2 | 2 | 4 | Anosmia | Rhinovirus |
| 17 | 61 | F | 3 | 0 | 3 | 5 | 8 | Anosmia | Rhinovirus |
| 18 | 34 | F | 1 | 1 | 1 | 2 | 4 | Anosmia | Rhinovirus |
| 19 | 76 | F | 1 | 0 | 3 | 4 | 7 | Anosmia | Rhinovirus |
| 20 | 54 | F | 2 | 0 | 4 | 3 | 7 | Anosmia | — |
| 21 | 58 | M | 1 | 1 | 5 | 4 | 10 | Anosmia | Rhinovirus |
| 22 | 69 | M | 1 | 2 | 9 | 8 | 19 | Hyposmia | |
| 23 | 38 | F | 3 | 3 | 14 | 8 | 25 | Hyposmia | |
| 24 | 63 | F | 1 | 0 | 4 | 6 | 10 | Anosmia | |
| 25 | 50 | F | 1 | 1 | 11 | 12 | 24 | Hyposmia | |
| 26 | 34 | F | 1 | 4.5 | 10 | 12 | 26.5 | Hyposmia | Rhinovirus |
| 27 | 33 | F | 1 | 3.5 | 11 | 10 | 24.5 | Hyposmia | |
| 28 | 50 | F | 1 | 0 | 14 | 6 | 20 | Hyposmia | Rhinovirus |
| 29 | 47 | M | 2 | 3 | 5 | 8 | 16 | Hyposmia | |
| 30 | 44 | F | 1 | 4.5 | 9 | 12 | 24.5 | Hyposmia | |
| 31 | 77 | F | 1 | 0 | 1 | 1 | 1 | Anosmia | |
| 32 | 58 | M | 1 | 0 | 0 | 3 | 3 | Anosmia | Rhinovirus |
| 33 | 62 | F | 1 | 0 | 0 | 1 | 1 | Anosmia | |
| 34 | 41 | F | 1 | 0 | 1 | 2 | 3 | Anosmia | Rhinovirus |
| 35 | 64 | F | 1 | 0 | 0 | 2 | 2 | Anosmia | Rhinovirus |
| 36 | 27 | M | 3 | 1 | 13 | 14 | 28 | Hyposmia | |
| 37 | 54 | M | 1 | 1 | 0 | 4 | 5 | Anosmia | |
| 38 | 57 | F | 1 | 3 | 11 | 4 | 18 | Hyposmia |
F = female; M = male; T = threshold test; D = discrimination test; I = identification test.
The frequency of positive virus detection in the patients with anosmia was higher than in those with hyposmia (58.8% [10/17] vs. 19.0% [4/21], P = .018).
DISCUSSION
In this study, we demonstrated the convenience and feasibility of testing samples from the olfactory clefts of PVOD patients using flocked swabs, universal viral transport media, and RVP FAST v2. Among the 38 samples tested, 13 were positive for RV and one was positive for CoV OC43, suggesting that RVs and CoVs are major causative agents of PVOD. We also found that the positive detection rate was higher in the PVOD patients with anosmia than in those with hyposmia, suggesting that the persistence of the virus may be one factor that results in more severe injury to the olfactory system. Viruses were identified in patients who visited a physician nearly 3 months after the onset of symptoms of the common cold. The observation indicates that the virus has not completely disappeared from the olfactory cleft by the time the diagnosis is confirmed, at least at this early time point.
Because most PVOD patients tend to delay visiting a physician, and because the viruses that cause URTIs are thought to be detectable in nasal lavage samples for up to 4 weeks after symptom onset, the isolation and detection of PVOD‐causing viruses is difficult. In recent years, some scholars have looked for traces of virus in patients with PVOD. Unfortunately, it is hard to directly compare the results of such investigations due to the use of different inclusion criteria, sample sizes, and virus detection methods, as well as variability in the geographic origin of patients.
Sugiura et al. 11 obtained indirect etiological evidence from epidemiological data by comparing the monthly incidence of PVOD with the monthly frequency of the isolation of various viruses using public infectious disease surveillance data. These results were further examined by testing serum antibody titers for the viruses in 127 PVOD samples. Parainfluenza type 3 was the most likely causative virus. The authors did not consider CoVs and RVs because they were not reported sufficiently frequently in the surveillance data because they are difficult to isolate. Suzuki et al. 8 presented direct etiological evidence by detecting 10 viruses, including RVs, CoVs, IVs, PIVs, RSVs, AdVs, EVs, Epstein‐Barr virus (EBVs), herpes simplex virus (HSVs), and varicella‐zoster virus (VZVs), in the nasal secretions of 24 patients with PVOD by reverse‐transcription PCR. RVs were detected in 10 patients who visited an outpatient clinic within 72 hours after the onset of olfactory dysfunction. CoV and parainfluenza virus were also detected in one patient each. Consistent with our results, the study provided additional powerful evidence that RVs can cause olfactory dysfunction. Wang et al. 9 reported a high detection rate (88.0%) of PIV3 in the turbinate epithelial cells of 22 PVOD patients compared with a low incidence rate in a healthy population. In contrast, we did not find PIV3 in this study. However, it did not mean that PIV3 has been excluded as a candidate causal agent due to the limited sample size. Furthermore, studies have shown that parainfluenza virus type 1 18 , 19 infects olfactory neurons and persists in nerve tissue of mice for a long time. Direct detection of pathogens in PVOD patients may provide more reliable and direct evidence compared with animal experiments. More clinical research should be done to determine if PIV3 infects olfactory receptor neurons in humans like it does in mice.
The human rhinoviruses (HRVs), members of the family Picornaviridae are the most common cause of URTIs and include more than 100 serotypes. 20 Though HRVs preferentially infect nasal epithelial cells and are usually rather harmless, there is increasing evidence that HRVs set the stage for more dangerous conditions, such as severe diseases of the lower respiratory tract, asthmatic exacerbation, and even autoimmunity. 21 , 22 However, the evidence linking RV infection and olfactory dysfunction is insufficient, because there is no evidence that RVs have the ability to spread from respiratory pathways to the central nervous system through the olfactory tract like the influenza virus. 23 The mechanisms underlying RV‐induced olfactory dysfunction may differ from those responsible for influenza‐induced olfactory dysfunction.
CoVs, which belong to the Coronaviridae family, cause 30% of upper and lower respiratory tract infections in humans. 24 Human coronavirus 229E (HCoV‐229E), OC43 (HCoV‐OC43), HKU1 (HCoV‐HKU1), and NL63 (HCoV‐NL63) are detected globally and evoke only mild symptoms in most patients, 25 whereas severe acute respiratory syndrome coronavirus (SARS‐CoV) and Middle East respiratory syndrome coronavirus can elicit severe symptoms and even death. 26 Akerlund et al. reported that the olfactory threshold increased after nasal inoculation with CoV 229E. 27 In addition to the lungs, the brain is also infected in some patients with SARS‐CoV; such an infection results in long‐term neurological sequelae. Studies of transgenic mice that express the SARS‐CoV receptor (human angiotensin‐converting enzyme 2) have shown that the virus enters the brain primarily via the olfactory bulb, and that infection results in rapid transneuronal spread to connected areas of the brain. 28 The primary cell targets of the mouse hepatitis virus strain JHM, a murine CoV, are also olfactory neurons; infection of mitral neurons in the olfactory bulb is followed by spread to the brain along olfactory and limbic pathways. 29 , 30 , 31 In this study, CoV was identified in one patient based on clinical evidence, suggesting that CoV might be one of the causes of PVOD.
Recently, the identification of respiratory viruses has become more important because of the unexpected emergence of several terrible viruses, such as SARS‐CoV and the influenza A viruses H5N1 and H1N1. 32 However, given the number of etiological agents that have been implicated in URTIs, several conventional monoplex PCR assays have to be used in parallel, which is tedious, time consuming, expensive, unstable, and requires large amounts of biological samples. 33 , 34 Compared with laboratory‐developed real‐time reverse‐transcription PCR assays, a number of commercial multiplex PCR assays for the detection of respiratory viral infections have been proposed that enable the detection of 12 to 33 different pathogens at the same time. 35 The RVP FAST v2 is the first kit for multiplex detection of respiratory virus nucleic acids to obtain FDA approval. The performance of this kit in testing nasopharyngeal samples has been validated in a clinical laboratory setting. For RSV, hMPV, EV, and RV, it demonstrated an improved overall detection rate over specialized viral reverse‐transcription PCR assays. 36 Despite the controversy surrounding assay sensitivity, due to the specificity and cost‐effectiveness of commercial multiplex respiratory virus detection assays compared with monoplex real‐time reverse‐transcription PCR, and in‐house–developed multiplex reverse‐transcription PCR, 37 , 38 , 39 , 40 a commercially available assay for rapid diagnosis would be a very useful tool for routine screening of respiratory specimens in clinical settings and hospital‐based laboratories. Consistent with previous studies, 32 , 34 , 41 our study has proven it to be a rapid, simple, reliable, and cost‐effective platform to identify respiratory viruses in one analysis. Based on this pilot study, specialized multiplex molecular tests should be designed to determine the causative agent of PVOD.
Compared to the disposable mucus extractor used by Suzuki et al. 8 or to other special sample collection instruments such as suction, clysis, or brush, the fine nasopharyngeal flocked swabs used in this study are commercially available and provide an optimal specimen for the diagnosis of respiratory infections by reverse transcription PCR. 42 Furthermore, collecting samples via flocked swabs is easier to perform in an outpatient setting without causing more patient discomfort, even when doing so from the narrow olfactory cleft.
There are several limitations in this work. First, a better control population would have been patients up to 3 months after an URTI without smell loss and with a similar monthly distribution, which might provide additional evidence to causative virus identification. Wang et al. 9 proposed that the control group of patients with nasal septal deviation would be an appropriate comparator. The phenotype of PVOD might be determined by many factors, such as gender, age, and immune state. Due to the limited number of positive samples, our data cannot answer the question of whether higher viral yields are present earlier in the course of PVOD. The disadvantage of the qualitative test panel is that it lacks quantitation; we also did not perform replicate assays. These issues can be addressed in future studies.
In routine practice, tests for viral URTI are not always available, and currently, there are often no treatments available for particular viral infections. Nevertheless, investigating the causative virus is the first step in understanding the pathogenic mechanism of PVOD.
CONCLUSION
RVs and CoVs may be causative viruses in PVOD. More work needs to be done to clarify how the pathogenic viruses identified through screening affect olfactory function.
Supporting information
Supporting Appendix S1. The limits of detection (LOD) of the xTAG Respiratory Viral Panel Fast v2 for each virus at 95% confidence range.
Editor's Note: This Manuscript was accepted for publication on July 16, 2020.
This study was funded by National Natural Science Foundation of the government of China (81271062).
The authors have no other funding, financial relationships, or conflicts of interest to disclose.
BIBLIOGRAPHY
- 1. Henkin RI, Larson AL, Powell RD. Hypogeusia, dysgeusia, hyposmia, and dysosmia following influenza‐like infection. Ann Otol Rhinol Laryngol 1975;84:672–682. [DOI] [PubMed] [Google Scholar]
- 2. Damm M, Temmel A, Welge‐Lussen A, et al. Olfactory dysfunctions. Epidemiology and therapy in Germany, Austria and Switzerland [in German]. HNO 2004;52:112–120. [DOI] [PubMed] [Google Scholar]
- 3. Seiden AM, Duncan HJ. The diagnosis of a conductive olfactory loss. Laryngoscope 2001;111:9–14. [DOI] [PubMed] [Google Scholar]
- 4. Quint C, Temmel AF, Schickinger B, Pabinger S, Ramberger P, Hummel T. Patterns of non‐conductive olfactory disorders in eastern Austria: a study of 120 patients from the Department of Otorhinolaryngology at the University of Vienna. Wien Klin Wochenschr 2001;113:52–57. [PubMed] [Google Scholar]
- 5. Chen G, Wei Y, Miao X, Li K, Ren Y, Liu J. Clinical features of olfactory disorders in patients seeking medical consultation. Med Sci Monit 2013;19:444–450. [DOI] [PMC free article] [PubMed] [Google Scholar]
- 6. Vaira LA, Salzano G, Deiana G, De Riu G. Anosmia and ageusia: common findings in COVID‐19 patients. Laryngoscope 2020;130:1787. [DOI] [PMC free article] [PubMed] [Google Scholar]
- 7. Welge‐Lussen A, Wolfensberger M. Olfactory disorders following upper respiratory tract infections. Adv Otorhinolaryngol 2006;63:125–132. [DOI] [PubMed] [Google Scholar]
- 8. Suzuki M, Saito K, Min WP, et al. Identification of viruses in patients with postviral olfactory dysfunction. Laryngoscope 2007;117:272–277. [DOI] [PMC free article] [PubMed] [Google Scholar]
- 9. Wang JH, Kwon HJ, Jang YJ. Detection of parainfluenza virus 3 in turbinate epithelial cells of postviral olfactory dysfunction patients. Laryngoscope 2007;117:1445–1449. [DOI] [PubMed] [Google Scholar]
- 10. Konstantinidis I, Haehner A, Frasnelli J, Reden J, Quante G. Post‐infectious olfactory dysfunction exhibits a seasonal pattern. Rhinology 2006;44:135–139. [PubMed] [Google Scholar]
- 11. Sugiura M, Aiba T, Mori J, Nakai Y. An epidemiological study of postviral olfactory disorder. Acta Otolaryngol Suppl 1998;538:191–196. [DOI] [PubMed] [Google Scholar]
- 12. Wolfensberger M, Schnieper I, Welge‐Lussen A. Sniffin' Sticks: a new olfactory test battery. Acta Otolaryngol 2000;120:303–306. [DOI] [PubMed] [Google Scholar]
- 13. Kobal G, Hummel T, Sekinger B, Barz S, Roscher S, Wolf S. "Sniffin' sticks": screening of olfactory performance. Rhinology 1996;34:222–226. [PubMed] [Google Scholar]
- 14. Hummel T, Sekinger B, Wolf SR, Pauli E, Kobal G. Sniffin' sticks': olfactory performance assessed by the combined testing of odor identification, odor discrimination and olfactory threshold. Chem Senses 1997;22:39–52. [DOI] [PubMed] [Google Scholar]
- 15. Hummel T, Kobal G, Gudziol H, Mackay‐Sim A. Normative data for the "Sniffin' sticks" including tests of odor identification, odor discrimination, and olfactory thresholds: an upgrade based on a group of more than 3,000 subjects. Eur Arch Otorhinolaryngol 2007;264:237–243. [DOI] [PubMed] [Google Scholar]
- 16. Ishiko H, Miura R, Shimada Y, et al. Human rhinovirus 87 identified as human enterovirus 68 by VP4‐based molecular diagnosis. Intervirology 2002;45:136–141. [DOI] [PubMed] [Google Scholar]
- 17. Olive DM, Al‐Mufti S, Al‐Mulla W, et al. Detection and differentiation of picornaviruses in clinical samples following genomic amplification. J Gen Virol 1990;71:2141–2147. [DOI] [PubMed] [Google Scholar]
- 18. Mori I, Komatsu T, Takeuchi K, Nakakuki K, Sudo M, Kimura Y. Parainfluenza virus type 1 infects olfactory neurons and establishes long‐term persistence in the nerve tissue. J Gen Virol 1995;76:1251–1254. [DOI] [PubMed] [Google Scholar]
- 19. Kristensson K, Leestma J, Lundh B, Norrby E. Sendai virus infection in the mouse brain: virus spread and long‐term effects. Acta Neuropathol 1984;63:89–95. [DOI] [PubMed] [Google Scholar]
- 20. Mackay IM. Human rhinoviruses: the cold wars resume. J Clin Virol 2008;42:297–320. [DOI] [PMC free article] [PubMed] [Google Scholar]
- 21. Kirchberger S, Majdic O, Stockl J. Modulation of the immune system by human rhinoviruses. Int Arch Allergy Immunol 2007;142:1–10. [DOI] [PubMed] [Google Scholar]
- 22. Holgate ST. Rhinoviruses in the pathogenesis of asthma: the bronchial epithelium as a major disease target. J Allergy Clin Immunol 2006;118:587–590. [DOI] [PubMed] [Google Scholar]
- 23. Aronsson F, Robertson B, Ljunggren HG, Kristensson K. Invasion and persistence of the neuroadapted influenza virus A/WSN/33 in the mouse olfactory system. Viral Immunol 2003;16:415–423. [DOI] [PubMed] [Google Scholar]
- 24. Chang CK, Lo SC, Wang YS, Hou MH. Recent insights into the development of therapeutics against coronavirus diseases by targeting N protein. Drug Discov Today 2016;21:562–572. [DOI] [PMC free article] [PubMed] [Google Scholar]
- 25. Matoba Y, Abiko C, Ikeda T, et al. Detection of the human coronavirus 229E, HKU1, NL63, and OC43 between 2010 and 2013 in Yamagata, Japan. Jpn J Infect Dis 2015;68:138–141. [DOI] [PubMed] [Google Scholar]
- 26. Zumla A, Hui DS, Perlman S. Middle East respiratory syndrome. Lancet 2015;386:995–1007. [DOI] [PMC free article] [PubMed] [Google Scholar]
- 27. Akerlund A, Bende M, Murphy C. Olfactory threshold and nasal mucosal changes in experimentally induced common cold. Acta Otolaryngol 1995;115:88–92. [DOI] [PubMed] [Google Scholar]
- 28. Netland J, Meyerholz DK, Moore S, Cassell M, Perlman S. Severe acute respiratory syndrome coronavirus infection causes neuronal death in the absence of encephalitis in mice transgenic for human ACE2. J Virol 2008;82:7264–7275. [DOI] [PMC free article] [PubMed] [Google Scholar]
- 29. Sun N, Perlman S. Spread of a neurotropic coronavirus to spinal cord white matter via neurons and astrocytes. J Virol 1995;69:633–641. [DOI] [PMC free article] [PubMed] [Google Scholar]
- 30. Kalicharran K, Dales S. The murine coronavirus as a model of trafficking and assembly of viral proteins in neural tissue. Trends Microbiol 1996;4:264–269. [DOI] [PMC free article] [PubMed] [Google Scholar]
- 31. Lane TE, Paoletti AD, Buchmeier MJ. Disassociation between the in vitro and in vivo effects of nitric oxide on a neurotropic murine coronavirus. J Virol 1997;71:2202–2210. [DOI] [PMC free article] [PubMed] [Google Scholar]
- 32. Dabisch‐Ruthe M, Vollmer T, Adams O, Knabbe C, Dreier J. Comparison of three multiplex PCR assays for the detection of respiratory viral infections: evaluation of xTAG respiratory virus panel fast assay, RespiFinder 19 assay and RespiFinder SMART 22 assay. BMC Infect Dis 2012;12:163. [DOI] [PMC free article] [PubMed] [Google Scholar]
- 33. Perez‐Ruiz M, Pedrosa‐Corral I, Sanbonmatsu‐Gamez S, Navarro‐Mari M. Laboratory detection of respiratory viruses by automated techniques. Open Virol J 2012;6:151–159. [DOI] [PMC free article] [PubMed] [Google Scholar]
- 34. Salez N, Vabret A, Leruez‐Ville M, et al. Evaluation of four commercial multiplex molecular tests for the diagnosis of acute respiratory infections. PLoS One 2015;10:e130378. [DOI] [PMC free article] [PubMed] [Google Scholar]
- 35. Renaud C, Crowley J, Jerome KR, Kuypers J. Comparison of FilmArray respiratory panel and laboratory‐developed real‐time reverse transcription‐polymerase chain reaction assays for respiratory virus detection. Diagn Microbiol Infect Dis 2012;74:379–383. [DOI] [PMC free article] [PubMed] [Google Scholar]
- 36. Jokela P, Piiparinen H, Mannonen L, Auvinen E, Lappalainen M. Performance of the Luminex xTAG respiratory viral panel fast in a clinical laboratory setting. J Virol Methods 2012;182:82–86. [DOI] [PMC free article] [PubMed] [Google Scholar]
- 37. Choudhary ML, Anand SP, Tikhe SA, et al. Comparison of the conventional multiplex RT‐PCR, real time RT‐PCR and Luminex xTAG(R) RVP fast assay for the detection of respiratory viruses. J Med Virol 2016;88:51–57. [DOI] [PMC free article] [PubMed] [Google Scholar]
- 38. Gadsby NJ, Hardie A, Claas EC, Templeton KE. Comparison of the Luminex respiratory virus panel fast assay with in‐house real‐time PCR for respiratory viral infection diagnosis. J Clin Microbiol 2010;48:2213–2216. [DOI] [PMC free article] [PubMed] [Google Scholar]
- 39. Pabbaraju K, Tokaryk KL, Wong S, Fox JD. Comparison of the Luminex xTAG respiratory viral panel with in‐house nucleic acid amplification tests for diagnosis of respiratory virus infections. J Clin Microbiol 2008;46:3056–3062. [DOI] [PMC free article] [PubMed] [Google Scholar]
- 40. Mansuy JM, Mengelle C, Da SI, Grog I, Saune K, Izopet J. Performance of a rapid molecular multiplex assay for the detection of influenza and picornaviruses. Scand J Infect Dis 2012;44:963–968. [DOI] [PubMed] [Google Scholar]
- 41. Pabbaraju K, Wong S, Tokaryk KL, Fonseca K, Drews SJ. Comparison of the Luminex xTAG respiratory viral panel with xTAG respiratory viral panel fast for diagnosis of respiratory virus infections. J Clin Microbiol 2011;49:1738–1744. [DOI] [PMC free article] [PubMed] [Google Scholar]
- 42. Abu‐Diab A, Azzeh M, Ghneim R, et al. Comparison between pernasal flocked swabs and nasopharyngeal aspirates for detection of common respiratory viruses in samples from children. J Clin Microbiol 2008;46:2414–2417. [DOI] [PMC free article] [PubMed] [Google Scholar]
Associated Data
This section collects any data citations, data availability statements, or supplementary materials included in this article.
Supplementary Materials
Supporting Appendix S1. The limits of detection (LOD) of the xTAG Respiratory Viral Panel Fast v2 for each virus at 95% confidence range.