

Summary
Plasticity of cancer metabolism can be a major obstacle to efficient targeting of tumour-specific metabolic vulnerabilities. Here, we identify the compensatory mechanisms following the inhibition of major pathways of central carbon metabolism in cMYC-induced liver tumours. We find that, while inhibition of both glutaminase isoforms (Gls1 and Gls2) in tumours significantly delays tumourigenesis, glutamine catabolism continues due to the action of amidotransferases. Synergistic inhibition of both glutaminases and compensatory amidotransferases is required to block glutamine catabolism and proliferation of mouse and human tumour cells in vitro and in vivo. Gls1 deletion is also compensated by glycolysis. Thus, co-inhibition of Gls1 and hexokinase 2 significantly affects Krebs cycle activity and tumour formation. Finally, the inhibition of either serine (Psat1KO) or fatty acid biosynthesis (FasnKO) is compensated for by uptake of circulating nutrients; and dietary restriction of serine/glycine or fatty acids, respectively, synergistically suppresses tumourigenesis. These results highlight the high flexibility of tumour metabolism and demonstrate that either pharmacological or dietary targeting of metabolic compensatory mechanisms can improve therapeutic outcomes.
Keywords: MYC tumour, metabolic flexibility, glutaminase, Gls1, amidotransferase, isoforms, serine metabolism, fatty acids, diet, Psat1, Fasn, hexokinase, Hk2, therapy
Introduction
Metabolism of tumours is different from metabolism in parental tissues. This difference is thought to favour maximal use of the resources with an adequate energy balance to allow cancer cells to survive and proliferate in a competitive tumour microenvironment1,2. This metabolic rewiring of tumours can induce metabolic dependencies that have the potential to be exploited therapeutically3. However, to date only few existing strategies targeting tumour-specific metabolic vulnerabilities have proven useful3. One of the underlying challenges may be metabolic plasticity of cancer cells. Furthermore, the selection of metabolic targets for therapeutic interventions has often been done in cell culture systems, where metabolism of initial tumour-derived cells can be significantly affected by culture conditions4. These systems also do not recapitulate tumour heterogeneity and complex inter-tumour and tumour-host interactions5.
One of the major regulators of cellular metabolism during proliferation and development is the proto-oncogene cMYC (henceforth termed MYC), which is also one of the most frequently dysregulated lesions in human cancers6,7. The difficulty of targeting MYC itself8 highlights the need to uncover and exploit therapeutic targets amongst its downstream effectors, including metabolic pathways. Using a genetically engineered mouse model of liver cancer9, we and others have demonstrated that MYC-induced liver tumours have increased catabolism of both glucose and glutamine in comparison with the normal liver10–12. Since both glucose and glutamine fuel pathways that are vital for cellular proliferation and survival4,13–16, several enzymes that control these pathways have been considered to be attractive therapeutic targets4,10,17–21. However, the inability to completely inhibit tumourigenesis in any of these approaches suggests that tumours engage compensatory mechanisms that allow them to survive and proliferate despite decreased activity of these enzymes. Although an understanding of the complexity of factors determining tumour metabolic vulnerabilities and flexibilities is emerging1,22–25, the mechanisms of metabolic resistance of tumours in vivo still remain largely unknown. Here we identify multiple strategies that tumours engage in order to overcome metabolic perturbations, including expression of alternative enzyme isoforms, reliance on alternative metabolic pathways, and utilisation of nutrients from the bloodstream. We demonstrate how blocking these compensatory mechanisms can lead to stronger inhibition of tumour growth in vivo, which provides a putative strategy for designing more effective therapeutic approaches.
Results
Major pathways of glucose and glutamine catabolism are increased in MYC-induced liver tumours.
We have previously demonstrated that glucose catabolism through glycolysis and catabolism of both glucose and glutamine through the Krebs cycle are increased in MYC-induced liver tumours9 in comparison with normal tissue counterparts10. We have now further evaluated these tumours in vivo, using either [U-13C]-glucose or [U-13C]-glutamine in tumour-bearing and control mice. [U-13C]-glucose boluses resulted in elevated enrichment of lactate and citrate (Fig. 1a) while [U-13C]-glutamine boluses resulted in enhanced enrichment of citrate, malate, fumarate and oxaloacetate-derived aspartate in tumours in comparison with normal livers (Fig. 1b). Furthermore, when the labelled nutrients were infused for 3 hours, the pools of 13C-glucose-derived pyruvate, lactate, alanine, citrate and glutamate, and the 13C-carbon pools of malate, fumarate, and aspartate derived from either [U-13C]-glucose or [U-13C]-glutamine were significantly increased in tumours (Fig. 1c). The extent of isotope enrichment, either from glucose or glutamine, demonstrated that they are major sources for the generation of Krebs cycle intermediates in both tumours and livers (30–40% of total isotope enrichment). The partial contribution of glucose and glutamine to the pools of most of Krebs cycle intermediates at steady-state in tumours remained similar to that observed in normal livers, except for 13C-glucose-derived citrate, the entry point of glucose carbons into the Krebs cycle (Extended Data Fig. 1a,b,d,e,g).
Fig. 1. In vivo metabolic tracing using 13C-labeled glucose and glutamine reveals upregulated pathways in MYC-driven liver tumours.

(a and b) 13C-enrichment of the indicated metabolites extracted from either normal livers or MYC-driven liver tumours after either a bolus of [U-13C]-glucose (a, n=5,6) or [U-13C]-glutamine (b, n=4,5) measured by GC-MS. Tumours were initiated in LAP-tTA/TRE-MYC mice by weaning them into regular chow. Mice maintained on a doxycycline-containing diet were used as controls. Data are presented as mean ± S.D. Statistical analysis was performed using a two-tailed Student’s t-test.
(c) Quantification of the [U-13C]-glucose and [U-13C]-glutamine carbon incorporation into some of the key intermediates of the central carbon metabolism in MYC-driven liver tumours and control normal livers after 3 h of infusion (n=5 mice per group). The content of 13C-labeled palmitic acid from a triglyceride pool is compared for tumours and corresponding adjacent livers (n=3 mice per group). Glutamine labelling is estimated from quantification of its spontaneous product pyroglutamate53, and glutamate from the non-pyroglutamate fraction. The decrease of tumoural 13C-glutamate and 13C-glutamine pools suggests their fast catabolism and increased anaplerosis. Labelling in all carbon positions of pyruvate, lactate and alanine from both 13C-glucose and 13C-glutamine in tumours suggests malic enzyme-driven pyruvate cycling. The main serine isotopologues observed during [U-13C]-glucose are +1 and +2 and not +3, which can be produced due to carbon exchange during glycine synthesis and one carbon metabolism54.
Data are presented as mean ± S.D. Statistical analysis was performed using a two-tailed Student’s t-test. Corresponding isotopologues in tumours and normal livers infused with the same label are compared.
(d) Diagram depicting the relative contribution of glucose (red) and glutamine (green) to the different pathways studied.
(e) Western blot comparing MYC-driven tumours and normal livers for the expression levels of key enzymes involved in the metabolic pathways depicted in (d) (n=3 mice per group).
See also Extended Data Fig. 1 and 2.
Together with fuelling the Krebs cycle, the increased level of glucose and glutamine catabolism is also required to support the activity of other pathways essential for tumourigenesis (Fig. 1d). Indeed, we observed an accumulation of serine and glycine in MYC-induced liver tumours (Extended Data Fig. 1c,f), as well as a marked increase in their production from [U-13C]-glucose (Fig. 1a; Extended Data Fig. 1b) and alpha-15N-glutamine (Extended Data Fig. 1h). We also observed a strong elevation in the incorporation of both glucose and glutamine carbons into tumour fatty acids (Fig. 1c; Extended Data Fig. 1i) consistent with the accumulation of neutral lipids (Extended Data Fig. 1j).
The increased metabolic pathway activities in tumours were associated with an elevated expression of enzymes or a change in enzyme isoform patterns (Fig. 1e; Extended Data Fig. 2a,b), consistent with previous observations by us and others10,11. These changes included (i) heightened expression of hexokinase 2, Hk2, and depressed expression of glucokinase, Gck, or hexokinase 4 (glycolysis) and (ii) increased expression of Gls1 and decreased expression of the Gls2 isoform of glutaminase (glutaminolysis). The expression of all serine biosynthesis enzymes was higher in tumours compared with normal livers, most notably phosphoserine aminotransferase (Psat1; Fig. 1e; Extended Data Fig. 2b). Finally, although the mRNA expression levels of enzymes involved in some normal liver functions, such as gluconeogenesis, were suppressed in tumours, the expression of some lipogenic enzymes, such as fatty acid synthase (FASN), remained high (Fig. 1e; Extended Data Fig. 2b).
To evaluate whether the elevated activity of these major pathways of glucose and glutamine catabolism is required for MYC-induced liver tumourigenesis, we used the Albumin-CreERT2 mouse line to knock-out Hk2, Gls1, Psat1, and Fasn genes specifically in hepatocytes at the time of tumour initiation (Extended Data Fig. 2c), verified by adeno-associated virus-mediated lineage tracing26 (Extended Data Fig. 2d–g). In this case, tumours were induced by hydrodynamics-based transfection of a plasmid encoding a combination of MYC and MCL112,27, another gene frequently overexpressed in human liver tumours (Extended Data Fig. 2h).
GLS2 partially compensates for GLS1 deletion in tumours.
Liver-specific knock-out of Gls1 (Gls1KO; Fig. 2a) resulted in significantly increased latency of MYC-induced liver tumours (Fig. 2b), significantly higher levels of glutamine (Fig. 2c), and a lower incorporation of glutamine-derived carbons into Krebs cycle intermediates and amino acids (Fig. 2d). However, the total levels of Krebs cycle intermediates were unaffected upon Gls1 KO (Extended Data Fig. 3a). These data demonstrated that GLS1 plays a significant role in glutaminolysis during MYC-induced tumourigenesis, consistent with previous results18. However, in the absence of GLS1, tumours were still able to develop and catabolize a substantial amount of glutamine. We next investigated which other enzymes could be responsible for this capability.
Fig. 2. Ablation of glutaminases impairs MYC-induced tumourigenesis and reveals a contribution of a glutaminase-independent glutamine catabolism.
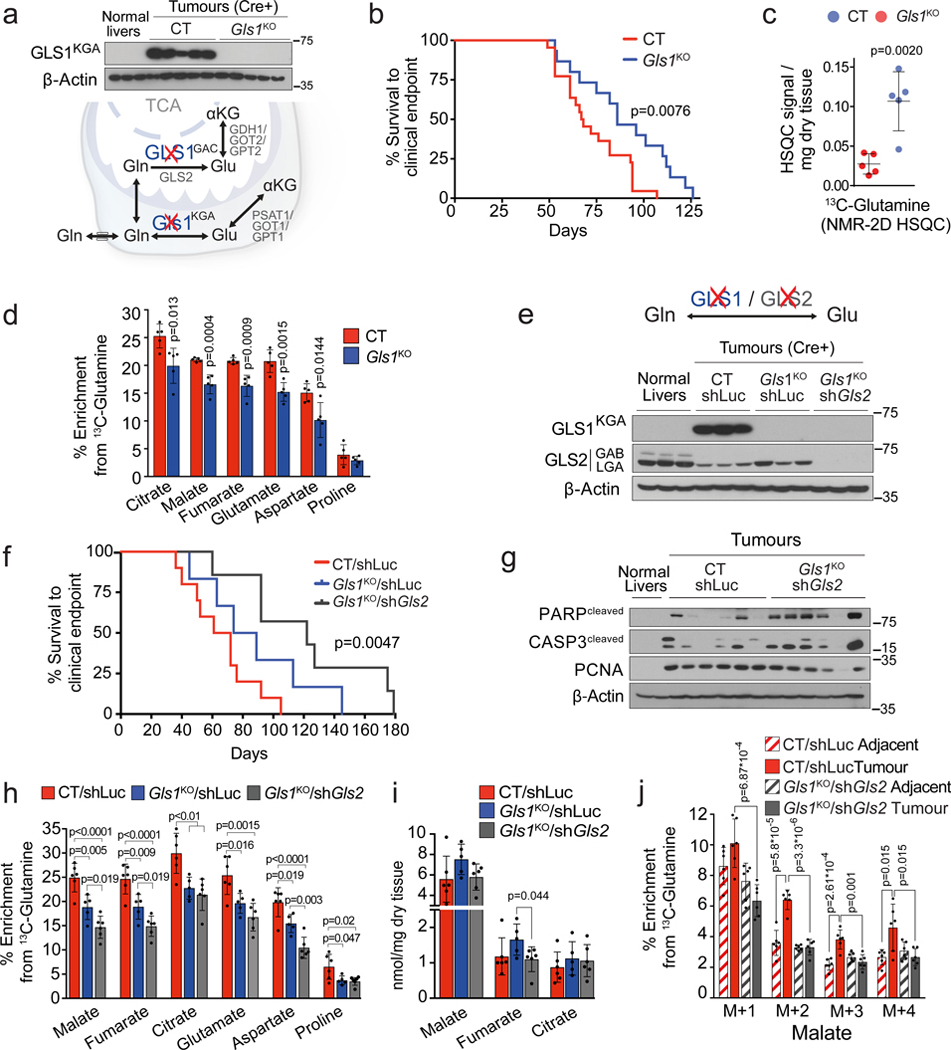
(a-d) Inhibiting Gls1 expression in MYC-driven tumours decreases glutamine catabolism and tumour burden: Tumours were induced by hydrodynamics-based transfection of MYC/MCL1 two weeks after tamoxifen-induced liver-specific CRE activation in Gls1fl/fl/Alb-CreERT2/Rosa26eYFP (Gls1KO) and Alb-CreERT2/Rosa26eYFP (CT) mice. (a) Top, western blot demonstrating the absence of GLS1 in Gls1KO tumours (n=3,5,5). Bottom, glutaminases catalyse the conversion of glutamine to glutamate, a key point of amino acid metabolism. (b) Kaplan-Meier survival curve (CT n=22; Gls1KO n=15). P-value was calculated by Mantel–Cox test. (c) Glutamine levels in CT and Gls1KO tumours (n=5 mice per group, NMR). (d) 13C-enrichment from [U-13C]-glutamine in the indicated metabolites of CT and Gls1KO tumours after [U-13C]-glutamine boluses (n= 5 mice per group, GC-MS).
(e-j) Gls2 knock-down in Gls1KO tumours increases the repressive effect on tumour glutaminolysis and tumour burden. Gls1KO/shGls2 tumours are compared to CT/shLuc and Gls1KO/shLuc tumours expressing shRNA against luciferase: (e) Western blot demonstrating shRNA-mediated reduction of GLS2 protein levels in tumours (n=3,3,3,3). (f) Kaplan-Meier survival curve (CT/shLuc n=10, Gls1KO/shLuc n=6, Gls1KO/shGls2 n=7). P-value was calculated by Mantel–Cox test. (g) Western blot showing the protein levels of cleaved PARP, cleaved Caspase 3 and PCNA in the indicated tissues (n=2,6,6). β-Actin was used as a loading control. (h) 13C-enrichment of the indicated metabolites after a [U-13C]-glutamine bolus (n=6,5,6, group labels as above). (i) Total levels of Krebs cycle intermediates (n=6,5,6, group labels as above; GC-MS). (j) 13C-enrichment of malate isotopologues in the experiment shown in Fig. 2 h (n=6,6,6,6).
All data are presented as mean ± S.D. Statistical analysis was performed using a two-tailed Student’s t-test. See also Extended Data Fig. 2, 3 and 4.
GLS2, expression of which was decreased in MYC-induced tumours in comparison with the normal liver, appeared to be expressed in Gls1KO tumours (Fig. 2e; Extended Data Fig. 3b). Gls2 knock-down in Gls1 wild type tumours, using short hairpin RNA (shRNA) interference (Extended Data Fig. 3c), had no impact on either tumourigenesis or glutamine catabolism (Extended Data Fig. 3d,e), demonstrating that GLS1 is the major glutaminase isoform supporting glutaminolysis in these tumours. In the absence of GLS1, however, inhibiting Gls2 expression (Gls1KO/shGls2; Fig. 2e) resulted in a more significant delay of tumourigenesis than Gls1KO alone (Fig. 2f). This delay was associated with increased levels of the apoptosis markers cleaved caspase 3 and poly-ADP ribose polymerase (PARP) and reduced levels of a proliferation marker, proliferating cell nuclear antigen (PCNA), when compared to control (CT/shLuc) tumours (Fig. 2g). These data suggested that the growth of Gls1KO/shGls2 tumours was inhibited not only at the initiation stage but also during tumour progression, by affecting the balance between apoptosis and proliferation. Gls1KO/shGls2 tumours showed a trend towards even higher accumulation of glutamine in comparison with that observed in Gls1KO tumours (Extended Data Fig. 3f) and a further suppression of glutamine catabolism both into the Krebs cycle and amino acids (Fig. 2h; Extended Data Fig. 3g,h). Nevertheless, the levels of Krebs cycle intermediates were still not significantly affected by the absence of both glutaminases (Fig. 2i). Interestingly, however, the total levels of non-essential amino acids (NEAAs), whose synthesis depends on glutamine, including glutamate, alanine and aspartate, showed a tendency to be lower in both Gls1KO and Gls1KO/shGls2 tumours in comparison with their control counterparts (Extended Data Fig. 4a,b).
The levels of NEAAs in tumours lacking glutaminases is maintained by exogenous uptake.
To explore a possible mechanism for the delayed formation of Gls1KO and Gls1KO/shGls2 tumours, we compared metabolic profiles of cells derived from CT/shLuc, Gls1KO/shLuc and Gls1KO/shGls2 tumours (MYC-driven hepatocellular carcinoma (HCC) cells; HCCMYC). Consistent with the in vivo phenotype, HCCMYC-Gls1KO/shLuc cells proliferated more slowly than HCCMYC-CT/shLuc cells; this effect was significantly exacerbated in HCCMYC-Gls1KO/shGls2 cells (Extended Data Fig. 4c). Importantly, the levels of Krebs cycle intermediates, malate and fumarate, were lower only in HCCMYC-Gls1KO/shGls2 cells while the levels of both aspartate and alanine were lower in both HCCMYC-Gls1KO/shLuc and Gls1KO/shGls2 cells (Extended Data Fig. 4d). The extent of these changes correlated with the extent of proliferation delay observed in these cell lines. Interestingly, the levels of citrate were not affected (Extended Data Fig. 4d) apparently being supported by glucose catabolism. These results suggested that decreasing glutamine catabolism into the Krebs cycle may affect its biosynthetic capacity to support tumour cell proliferation. Consistently, the presence of all NEAAs in the media improved slowed proliferation of HCCMYC-Gls1KO/shGls2 cells (Extended Data Fig. 4c).
To test whether a more significant decrease in tumour Krebs cycle intermediates and amino acids levels observed upon the decrease of glutaminase activity in vitro in comparison with in vivo was due to the uptake of the amino acids by tumours from the bloodstream, we administered a bolus of 15N-alanine, the second most abundant amino acid in serum after glutamine, to mice bearing either CT/shLuc or Gls1KO/shGls2 tumours. Interestingly, both types of tumours were not only able to assimilate alanine, but also converted it into glutamate, and consequently the remaining NEAAs by utilisation of the alanine amino group, with an initial step catalyzed by alanine aminotransferases (Extended Data Fig. 4f).
Together, these data suggested that limiting a biosynthetic capacity of the Krebs cycle may be one of the factors that determines the effect of glutaminase inhibition on tumour progression. Furthermore, the uptake and catabolism of circulating amino acids can support amino acid pools in tumours and may constitute one of the elements of tumour resistance to glutaminase inhibition.
Amidotransferase action compensates for the inhibition of glutaminase activity in tumours.
Although Gls1KO/shGls2 tumours exhibited significantly decreased flux of glutamine into the Krebs cycle, they were still able to incorporate approximately half of the glutamine-derived carbons into Krebs cycle intermediates, compared to control tumours, and a level comparable to the adjacent livers (Fig. 2h; Extended Data Fig. 3h). The presence of a substantial fraction of the +4 isotopologue of malate derived from [U-13C]-glutamine in Gls1KO/shGls2 tumours reflected the direct glutamine catabolism (Fig. 2j). We therefore hypothesised that enzymes other than glutaminases could be responsible for the production of glutamate from glutamine and subsequent glutamine flux into the Krebs cycle, and could be potentially targeted together with glutaminase inhibition as a potential therapeutic intervention. Indeed, several other enzymes, including those involved in asparagine, nucleotide, glucosamine, NADH, and aminoacyl-tRNA biosynthesis, can utilize glutamine as an amide nitrogen donor and generate glutamate28 (Fig. 3a,b). Interestingly, the expression of most of these enzymes was upregulated in liver tumours driven by MYC (Fig. 3c). Their expression also correlates with the expression of Gls1 in human HCC (Extended Data Fig. 5a), indicating that GLS1 inhibitors may not be efficient as a mono-therapy in human patients and could better be combined with amidotransferase inhibitors.
Fig. 3. Enzymes that use glutamine as an amide donor sustain glutamine catabolism when glutaminase activity is inhibited.

(a) The fate of the amide group of glutamine.
(b) A diagram depicting the enzymes that can utilize glutamine as an amide donor, representing the pathways involved in the glutaminase-independent glutamine catabolism.
(c) Heat map of transcriptome data showing the gene expression of enzymes that use glutamine as an amide donor (n=4 mice per group) in tumours initiated in LAP-tTA/TRE-MYC mice by weaning them into regular chow. Mice kept on a doxycycline-containing diet are used as controls.
(d) Representative images of 1H-15N 2D-HMBC NMR spectra of tumours from mice infused with amido-15N-glutamine, or cells derived from CT and Gls1KO/shGls2 tumours incubated with amido-15N-glutamine for 48 h, showing nitrogen incorporation into the indicated metabolites.
(e) Effect of the glutamine antagonist and transamidase inhibitor DON (50 mg/kg, 4 h) on the 13C-incorporation into metabolites in CT/shLuc and Gls1KO/shGls2 tumours from mice administered with a [U-13C]-glutamine bolus (n=3 mice per group; GC-MS).
(f) The effect of DON on the incorporation of either [U-13C]-glutamine or [U-13C]-glucose-derived carbons into malate in CT and Gls1KO/shGls2 tumour cells (3 h; n=3 independent experiments; GC-MS).
All data are presented as mean ± S.D. Statistical analysis was performed using a two-tailed Student’s t-test.
(g and h) Combination of glutaminase inhibition and DON on proliferation of HCCMYC cells: either HCCMYC- Gls1KO/shGls2 (g) or HCCMYC-CT cells (h) were treated with the indicated concentrations of CB-839 and DON, or their indicated combinations. Growth was monitored in an IncuCyte Live-Cell analysis system. Representative curves from three independent experiments are shown. Data are presented as mean ± S.D. See also Extended Data Fig. 2, 5 and 6.
Investigations of these pathways can contribute to the synthesis of glutamate from glutamine using amido-15N-glutamine in either tumours or tumour-derived cells revealed that glutamine-derived 15N was incorporated into nucleotides (both purines, AXP and GXP; and pyrimidines, UXP, TXP, and CXP), NADH, and glucosamine, among other metabolites (Fig. 3d and Extended Data Fig. 5b,c). Interestingly, we also observed the incorporation of the amido-15N-glutamine-derived nitrogen into amino acids (Fig. 3d; Extended Data Fig. 5b,c), suggesting the presence of ammonia recycling, probably through the glutamate dehydrogenase (GDH) reverse reaction29. This labelling pattern was dramatically reduced in Gls1KO/shGls2 cells, consistent with the lack of ammonia generation, but relatively preserved in Gls1KO/shGls2 tumours probably due to the uptake of the labelled amino acids that were detected in serum (Extended Data Fig. 5d).
To demonstrate that the combined output of transamidase reactions could be feeding the Krebs cycle with glutamine-derived carbons in the absence of glutaminases, we treated tumour-bearing mice with 6-diazo-5-oxo-L-norleucine (DON), a glutamine analog, and pan-amidotransferase inhibitor. Consistent with its function, DON ablated the incorporation of the amido-15N-glutamine-derived nitrogen into nucleotides in MYC-driven liver tumours (Extended Data Fig. 5e). In Gls1KO/shGls2 tumours a single dose of DON administered prior to the [U-13C]-glutamine bolus substantially suppressed the incorporation of 13C into Krebs cycle intermediates and amino acids (Fig. 3e), increased the 13C-glutamine level while decreasing the levels of 13C-glutamate and total levels of alanine, malate, and fumarate (Extended Data Fig. 6a,b,c). Interestingly, DON minimally affected glutamine-derived anaplerosis in control tumours (Fig. 3e), suggesting that glutaminases are relatively insensitive to DON, and that only the combination of the administration of DON with glutaminase inhibition can completely suppress glutamine catabolism. Consistently with the in vivo results, DON treatment almost completely ablated glutamine utilization in HCCMYC-Gls1KO/shGls2 cells with a much smaller impact on control cells (Fig. 3f; Extended Data Fig. 6d,e). Additionally, DON treatment further increased the contribution of glucose to the Krebs cycle in HCCMYC-Gls1KO/shGls2 cells making it virtually the sole carbon source (Fig. 3f; Extended Data Fig. 6e). Consistent with its effect on glutamine catabolism, DON treatment inhibited the proliferation of HCCMYC cells only in combination with either the inhibition of glutaminase expression (Gls1KO/shGls2; Fig. 3g) or application of the GLS1 inhibitor, CB-839 (Fig. 3h; Extended Data Fig. 6f). This effect was rescued by either the addition of a mix of NEAAs or a combination of four amino acids absent from DMEM, i.e. alanine, aspartate, proline and asparagine (AAAP; Extended Data Fig. 6g,h). The combination of DON and CB-839 also showed a synergistic effect in the human cancer cell line HepG2 (Fig. 6i). These data demonstrate that decreasing Krebs cycle anaplerosis and amino acid biosynthesis plays a substantial role in the suppression of tumour cell proliferation downstream of combined inhibition of glutaminases and amidotransferases.
Fig. 6. Lipid demands of tumours are fulfilled by a joint effort of de novo synthesis and uptake.

(a-d) Fasn deletion in MYC-driven tumours ablates lipogenesis but does not significantly affect tumour burden. Tumours were induced by hydrodynamics-based transfection of MYC/MCL1 2 weeks after tamoxifen-induced liver-specific CRE activation in Fasnfl/fl/Alb-CreERT2/Rosa26eYFP and Alb-CreERT2/Rosa26eYFP mice. (a) Western blot demonstrating the absence of FASN in FasnKO tumours (n=3,5,5). (b) Kaplan-Meier survival curve (CT n=22; FasnKO n=14). P-value was calculated by Mantel–Cox test. (c and d), 13C-enrichment of citrate (n= 4,3,3,4,4; GC-MS) (c) and palmitic acid (n=5,4,4,5,5; GC-MS) (d) in the indicated tissues after a [U-13C]-glucose infusion.
(e and f) Direct fluorescence images of tissues of interest showing tumoural lipid uptake after FasnKO mice where intraperitoneally injected with fluorescently-labelled fatty acids, Bodipy™ FL C16 (e) or fluorescently-labelled lipoproteins, Dil-LDL (f). Representative images of three mice per condition are shown.
(g) Kaplan-Meier Survival Curve of tumour bearing CT and FasnKO fed with the LFD (CT on the LFD n=10; FasnKO on the LFD n=10). P-value was calculated by Mantel–Cox test. Gene deletion was achieved during tumour induction by co-injection of pT3-CMV-Cre with c-MYC and MCL1-expressing plasmids in Fasnfl/fl and WT mice. Animals were moved onto an indicated diet one week later.
(h) The effect of combining the LFD and Fasn inhibitor, Fasnall, on the progression of MYC tumour cell-derived allografts (Veh/9% fat diet n= 9; Fasnall/9% fat diet n= 9; Veh/4% fat diet n= 11; Fasnall/4% fat diet n= 11).
All data are presented as mean ± S.D. Statistical analysis was performed using a two-tailed Student’s t-test. In (c) *, p < 0.05; **, p< 0.01; ***, p < 0.001, with respect to its corresponding adjacent liver; # with respect to the normal liver; α with respect to FasnKO tumours.
See also Extended Data Fig. 2 and 8.
Altogether, our data demonstrate that high levels of glutamine catabolism are required for MYC-induced tumourigenesis in vivo, and that deletion of Gls1 can be partially compensated by the presence of Gls2. Furthermore, a significant proportion of glutamine-derived glutamate can be produced by enzymes that utilize glutamine as the amide nitrogen donor, thereby fuelling the Krebs cycle.
Synergistic inhibition of Gls1 and amidotransferases synergises in models of human colon cancer.
Next, we evaluated whether the synergistic interaction between glutaminases and amidotransferases in supporting the activity of the Krebs cycle and liver tumourigenesis also exists in other tumour types. To this end we used in vitro and in vivo models of colorectal cancer, a cancer type in which GLS1 plays a role in supporting tumour growth30 and MYC has been identified as one of the regulators of the colon cancer metabolic reprograming31. The combination of CB-839 and DON had a significantly stronger inhibitory effect on the proliferation of the human colon cell line, HCT116 (Fig. 4a), and proliferation and colony formation of primary mouse Apcmin/+ tumour organoids (Fig. 4b,c), than CB-839 or DON alone. Importantly, this effect was also observed in primary human colon cancer organoids (Fig. 4d,e), a model demonstrating a strong predictive power for therapy efficiency in humans32. Finally, a combination of an orally bioavailable selective Gls1 inhibitor (Compound 27)33 and DON was the most efficient in suppressing the growth of HCT116 xenografts (Fig. 4f). Accordingly, this combination also had the strongest effect on the levels of Krebs cycle intermediates and their labelling from 13C-glutamine (Fig. 4g). Interestingly, citrate levels were maintained, which reinforced the role of glucose as the main contributor to the citrate pool. Importantly, these results also demonstrated that DON alone does not suppress the entry of glutamine carbons into the Krebs cycle. DON treatment resulted in elevated levels of aspartate, which may be a result of asparagine synthetase inhibition and may increase glutamine availability to glutaminases. Together these data confirm that inhibiting both glutaminases and other enzymes utilising glutamine as an amide nitrogen donor is required for the maximal inhibition of glutamine catabolism in tumours.
Fig. 4. Inhibiting glutaminase and amidotransferases has a synergistic effect on mouse and human cell proliferation in vitro and in vivo.

(a) HCT116 cells treated with DON and/or CB-839 at the indicated concentrations. Representative curves from one of three independent experiments with 3 replicates are shown. Data are mean ± S.D.
(b) Representative images of colony formation assay of organoids derived from APCmin tumours after seven days in culture with the indicated treatments. Scale bar is 500 μm.
(c) Left panel: Quantitation of the organoid formation assay in Fig. 4b. Data are mean ± S.D. from three independent experiments. Right panel: Cell Titer Glo luciferase assay of APCmin organoids treated with the indicated treatments. Data represents three independent experiments with three replicates each.
(d) Representative images of colony formation assay of two patient derived organoids after 19 days in culture (Patient A) and 10 days in culture (Patient B) with the indicated treatments. Scale bar is 500 μm.
(e) Top panel: Quantitation of the organoid formation assay in Fig. 4d. Bottom panel: Cell Titer Glo luciferase assay of patient derived organoids in Fig. 4d treated with the indicated treatments. In both panels, the data represents three independent experiments with three replicates each.
(f) The effect of combining a glutaminase inhibitor and DON on the progression of HCT116 xenografts. Mice were injected with 5 million cells and treated with 100 mg/Kg of the glutaminase inhibitor Compound 27, p.o. daily, and/or 25 mg/kg of DON every 72 h i.p. (Vehicle n=13; Compound 27 n=10; DON n=11; Compound 27+DON n=10).
(g) Total levels (top) and 13C-enrichment of the indicated metabolites after a [U-13C]-glutamine bolus in the HCT116 xenograft tumours from mice of the experiment shown in (f ) (n= 4 mice per group; GC-MS).
All data are presented as mean ± S.D. Statistical analysis was performed using a two-tailed Student’s t-test. *, p < 0.05; **, p< 0.01; ***, p < 0.001; #, p < 0.05; ##, p< 0.01; ***, p < 0.001; α, p < 0.05; αα, p< 0.01; two-tailed t-test (c, e, f, h), and two-way ANOVA (g). In (h) statistical significance of an indicated column is represented by * with respect to the vehicle group, by # in respect to Gls1i C.27 group, and by α in respect to DON group. Complete list of exact p-values is provided as a source data file.
Targeting glycolysis and glutaminolysis together efficiently inhibits tumourigenesis.
Our results demonstrated that the pools of Krebs cycle metabolites were preserved in Gls1KO/shGls2 tumours (Fig. 2h), and glucose contribution to the Krebs cycle was higher in Gls1KO/shGls2 cells than in CT cells, and even more so when inhibiting glutaminase expression was combined with DON treatment (Fig. 3f; Extended Data Fig. 6d,e). We next tested whether concomitant inhibition of glucose and glutamine catabolism would supress Krebs cycle activity and affect MYC-induced tumourigenesis. Elevated glycolysis in MYC-induced liver tumours was associated with increased expression of Hk210 (Fig. 1e), deletion of which was previously shown to have a profound effect on mammary gland and lung tumourigenesis17. In contrast, Hk2 deletion at the time of tumour initiation (Hk2KO; Fig. 5a) did not affect the latency of MYC liver tumours (Fig. 5b), probably due to the observed compensatory expression of glucokinase (Fig. 5a). Nevertheless, Hk2KO tumours showed decreased catabolism of glucose into lactate (Fig. 5c; Extended Data Fig. 7a) associated with lower levels of glucose 6P and fructose 6P (Extended Data Fig. 7b). The incorporation of glucose into Krebs cycle intermediates was also decreased in Hk2KO tumours (Fig. 5d). However, only the level of citrate, the entry point of glucose into the Krebs cycle, was decreased, and not the levels of other Krebs cycle intermediates (Extended Data Fig. 7c). Altogether, these data suggested that glutaminolysis could be compensating for a decreased glycolytic flux and vice-versa.
Fig. 5. A cross-compensatory metabolism of glucose and glutamine sustains mitochondrial metabolic pools and MYC-induced tumourigenesis.

(a-d) Hk2 deletion in MYC-driven tumours decreases glycolysis but does not affect tumour burden. Tumours were induced by hydrodynamics-based transfection of MYC/MCL1 2 weeks after tamoxifen-induced liver-specific CRE activation in Hk2fl/fl/Alb-CreERT2/Rosa26eYFP and Alb-CreERT2/Rosa26eYFP mice. (a) Western blot demonstrating the absence of HK2 in Hk2KO tumours (n=3,5,5). (b) Kaplan-Meier survival curve (CT n=22; Hk2KO n=15). P-value was calculated by Mantel–Cox test. (c) Total content, 13C-enrichment, and total 13C content of lactate and (d) 13C-enrichment of Krebs cycle intermediates in CT and Hk2KO tumours after a [U-13C]-glucose bolus (n=6 mice per group; GC-MS).
(e-g) Deletion of both Gls1 and Hk2 affects MYC-induced tumourigenesis. Simultaneous Gls1 and Hk2 gene deletion and cell transformation by MYC were achieved by co-injection of pT3-CMV-Cre with c-MYC and MCL1-expressing plasmids. (e) Kaplan-Meier survival curve (CT n=11; Gls1KO/Hk2KO n=16). P-value was calculated by Mantel–Cox test. (f) Total content of Krebs cycle intermediates and 2-hydroxybutyrate (n=8,9, group labels as above; GC-MS).
(g) AMP/ATP and GMP/GTP ratios (n=8,9, group labels as above; LC-MS). All data are presented as mean ± S.D. Statistical analysis was performed using a two-tailed Student’s t-test.
(h) HCCMYC-CT and HCCMYC-Gls1KO/shGls2 tumour cells were treated with either 0.5 or 1 mM 2-DG and growth was monitored in an IncuCyte Live-Cell analysis system. Representative curves from one of three independent experiments with three replicates are shown. Data represents means ± S.D.
(i) HCCMYC-CT and HCCMYC-Gls1KO/shGls2 tumour cells were treated with 100 μM UK5099 for 48 h. Crystal violet staining from a representative of three independent experiments is shown. See also Extended Data Fig. 2 and 7.
We next deleted both Gls1 and Hk2 (Gls1KO/Hk2KO) at the initiation stage of MYC-induced liver tumourigenesis. This combination strikingly impaired tumour formation (Fig. 5e), with 37.5 % of mice failing to develop tumours even after one year. In contrast to either Gls1KO or Hk2KO tumours, Gls1KO/Hk2KO tumours had lower levels of Krebs cycle intermediates (Fig. 5f; Extended Data Fig. 7d). They had a higher level of glutamine consistent with the inhibition of glutamine catabolism (Extended Data Fig. 7e), but maintained the levels of lactate (Extended Data Fig. 7f) and amino acids (Extended Data Fig. 7g). Importantly, the AMP/ATP and GMP/GTP ratios were depressed in Gls1KO/Hk2KO tumours in comparison with CT tumours (Fig. 5g) suggesting that Gls1KO/Hk2KO tumours may fail to maintain a proper energy balance. Interestingly, Gls1KO/Hk2KO tumours also had lower levels of pentose phosphate pathway intermediates (Extended Data Fig. 7h). In general, the tumours that developed showed a wide range of metabolite concentrations, consistent with a heterogeneous pattern of GLS2, GCK and HK1 expression (Extended Data Fig. 7i,j), suggesting different mechanisms of metabolic adaptation. Consistent with the previous findings17, some tumours exhibited a residual expression of HK2 suggesting that they originated from cells with incomplete deletion of the gene. This observation reinforced the idea that the deletion of both HK2 and Gls1 is highly detrimental for tumourigenesis. Consistently, treatment with either UK5099, an inhibitor of the mitochondrial pyruvate transporter, or 2-deoxy-D-glucose (2DG) affected the proliferation of Gls1KO/shGls2 cells more than of CT cells (Fig. 5h,i). Overall, these results demonstrate that, when the catabolism of either glucose or glutamine into the Krebs cycle is individually blocked, the other metabolite can compensate to support Krebs cycle activity and downstream pathways. Concomitantly, reducing both anaplerotic pathways simultaneously could supress tumourigenesis more efficiently than inhibiting each pathway individually.
Dietary interventions synergize with the inhibition of tumour biosynthetic pathways.
One of the pathways that is fuelled by both glucose and glutamine in MYC-induced liver tumours is fatty acid biosynthesis (Fig. 1c,d). We tested whether this major pathway is required for the formation of MYC-induced tumours by deleting the Fasn gene at the onset of tumourigenesis (FasnKO). Fasn KO delayed the onset of palpable tumours but did not lengthen the total time to a clinical endpoint (Fig. 6a,b). A total block of fatty acid labelling and unaffected labelling of citrate from [U-13C]-glucose confirmed the inhibition of de novo lipogenesis in tumours at the FASN step (Fig. 6c,d; Extended Data Fig. 8a). Interestingly, the defect in lipogenesis in FasnKO tumours was not associated with the lowering of the total content of fatty acids but rather with and altered fatty acid composition (lower c16:0/c18:0 and c16:0/c18:2 ratios; Extended Data Fig. 8b,c). This outcome suggested that in the absence of Fasn and endogenous lipid production tumour development was sustained by different exogenous lipids and the tumour lipidome was determined by the lipid composition of the diet. Consistently, MYC-induced tumours express a wide range of lipid transporters (Extended Data Fig. 8d) and both CT and FasnKO tumours imported fluorescently-labelled lipids from serum more avidly than the adjacent liver and most other tissues (Fig. 6e,f).
To test whether modulating lipid availability would synergise with Fasn deletion, we placed mice bearing FasnKO and CT tumours onto a diet with a lower fat content (LFD, 5.1% in comparison with 9% in our normal chow diet). The LFD significantly increased the latency of FasnKO tumours (Fig. 6g), demonstrating that the uptake of circulating lipids was supporting the growth of FasnKO tumours at a rate comparable to CT tumours. Paradoxically, FasnKO tumours of mice on the LFD showed a tendency to enlarged lipid pools measured at the endpoint (Extended Data Fig. 8e), but again with the change in fatty acid composition, reflected by decreased 16:0/18:0 and 16:0/18:2 ratios (Extended Data Fig. 8f). Consistent with the in vivo results, cells isolated from FasnKO tumours showed a lower proliferation rate compared to CT cells in complete media and stopped proliferating in lipid-depleted media, both of which were rescued by fatty acid supplementation (Extended Data Fig. 8g). Importantly, a previously-published Fasn inhibitor, Fasnall34, was only able to significantly decrease the growth of HCCMYC allografts when combined with the LFD (Fig. 6h). Together, these results demonstrate that lipid requirements of tumours in vivo are sustained by both de novo lipogenesis and lipid uptake, and that strategies that do not target both pathways could be less effective.
Another major pathway fuelled by both glucose and glutamine, demonstrated to support the proliferation of cancer cells, is serine biosynthesis35. Serine and its immediate metabolic product glycine are essential precursors for protein, nucleic acid, folate, and lipid synthesis35–38. PSAT1 catalyzes one of the key steps in serine biosynthesis when glucose-derived carbon is combined with glutamine-derived nitrogen (Fig. 7a). MYC-induced liver tumours had heightened serine biosynthetic capacity and significantly elevated Psat1 mRNA and protein levels (Fig. 1a,c,e; Extended Data Fig. 1b, 2b and Fig. 7b). Thus, we tested whether directly inhibiting serine biosynthesis would affect MYC-induced tumourigenesis. Surprisingly, Psat1 deletion at the time of tumour initiation (Psat1KO) had no effect on a tumour onset or progression (Fig. 7b,c). [U-13C]-glucose infusions and amino-15N-glutamine boluses demonstrated the ablation of de novo serine and glycine synthesis in Psat1KO tumours (Fig. 7d; Extended Data Fig. 9a,b). Interestingly, only serine and not glycine levels were reduced (Fig. 7d), suggesting that serine pools were more dependent on serine synthesis, while the glycine level may be sustained by direct import from the bloodstream. To test whether a reduction in serine/glycine (SG) availability in vivo would synergise with the absence of PSAT1, we placed mice with either Psat1KO or CT tumours on a SG-deficient diet (-SG; Fig. 7e), that has been shown to affect tumour progression in some mouse models of cancer39. Remarkably, the -SG diet had no significant effect on the latency of CT tumours (Fig. 7f), in which the glycine, but not serine, level was significantly reduced (Fig. 7g). Only the combination of Psat1 deletion with the -SG diet achieved a reduction in the SG levels, and a striking delay in tumour progression (Fig. 7f). Consistent with the in vivo results, Psat1WT tumour cells were able to proliferate in the absence of both serine and glycine while Psat1KO tumour cells required serine but not glycine for proliferation (Extended Data Fig. 9c). In the absence of serine, Psat1KO cells were only able to proliferate when formate, a carbon donor for one-carbon metabolism normally present in serum, was supplied (Extended Data Fig. 9c). These data demonstrate the need for targeting both the synthesis and the dietary supply of serine and glycine, and also suggests a limitation in the interconversion of these amino acids. Indeed, one of the factors preventing the production of serine from glycine can be the depletion of methyl groups from one-carbon metabolism, which would limit nucleotide biosynthesis.
Fig. 7. Depleting serine and glycine in tumours requires simultaneous intervention against endogenous production and a circulating supply.

Psat1 KO was induced in hepatocytes of Psat1fl/fl/Alb-CreERT2/Rosa26eYFP mice by tamoxifen administration followed by hydrodynamics-based transfection of MYC/MCL1.
(a) PSAT1 links glycolysis, glutaminolysis and TCA cycle. PSAT1 transfers the amino group from glutamate to the glucose derived phosphopyruvate, and generates Krebs cycle intermediate, α-ketoglutarate, and phosphoserine.
(b) Western blot demonstrating the absence of PSAT1 in Psat1KO tumours (n=3,5,5).
(c) Kaplan-Meier survival curve (CT n=22; Psat1KO n=7). P-value was calculated by Mantel–Cox test.
(d) Total content, and 13C-enrichment of serine and glycine in the indicated tissues after a [U-13C]-glucose infusion (Normal livers n=6; CT tumours n=5; Psat1KO tumours n=5; GC-MS).
(e) Schedule for the experiment combining Psat1 knockout and -SG diet.
(f) Kaplan-Meier survival curve (CT on the Control diet n=6; Psat1KO on the Control diet n=10; CT on the –SG diet n=8; Psat1KO on the –SG diet n=11). P-value was calculated by Mantel–Cox test.
(g) Total content, and 15N-enrichment of serine and glycine in the indicated tumours after amino-15N-glutamine bolus in mice fed with either the control or the -SG diets (n=5,5,7,7).
All data are presented as mean ± S.D. Statistical analysis was performed using a two-tailed Student’s t-test. Complete list of exact p-values is provided as a source data file.
See also Extended Data Fig. 2 and 9.
Surprisingly, a very profound delay in the formation of Psat1KO/–SG tumours was associated with only a few detectable metabolic changes. Psat1KO/–SG tumours had a lower levels of α-ketoglutarate but not any other Krebs cycle intermediates (Extended Data Fig. 9d). While Diehl et al40 reported a significant decrease in purine nucleotide biosynthesis in cancer cell lines deprived of serine, we did not observe any effect of the -SG diet on the levels of purine nucleotides possibly due to 50% of serine still being present in serum of animals on the -SG diet (Extended Data Fig. 9e). The appearance of 15N-serine and 15N-glycine in the blood of tumour-bearing animals injected with amino-15N-glutamine demonstrated that in the absence of dietary SG, blood SG levels can be sustained by synthesis and export from other organs (Extended Data Fig. 9e). One of the differences that was observed, however, upon Psat1KO and -SG diet was in the level of alanine, which was significantly increased in Psat1KO/–SG tumours (Extended Data Fig. 9a,d). Serine depletion has been shown to affect ROS balance39, and alter the metabolism of glycerophospholipids and sphingolipids38, leading to intracellular accumulation of cytotoxic deoxysphingolipids41 derived from alanine instead of serine. Therefore, an elevated alanine-to-serine ratio could be one of the causes of the increased latency of Psat1KO/–SG tumours.
Together, these data demonstrate that both SG synthesis and uptake can support the progression of MYC-induced liver tumours, and that a 50% reduction in the blood serine levels is sufficient to synergize with the inhibition of serine biosynthesis and profoundly impairs tumourigenesis.
Discussion
A number of compounds that inhibit metabolic enzymes, including GLS1 and FASN, are currently in different phases of clinical trials as potential cancer therapeutics. However, tumour metabolic plasticity could be a major obstacle to their success. Our in vivo results illustrate how cancer cells can withstand interventions that target metabolism, and explore different options for combinatorial targeting of specific metabolic adaptations for greater impact on tumour development.
Our data builds up on the previous work that has shown promising but heterogeneous outcomes with the inhibition of individual metabolic enzymes in different mouse models4,17–21,42, suggesting that both the tissue of origin and the genetic drivers can not only influence the metabolic reprogramming during oncogenic transformation10 but also the mechanisms of metabolic adaptation. Deleting those isoforms that drive glucose and glutamine catabolism in a single tumour system allowed us to reveal several mechanisms of metabolic compensation that should be considered when designing metabolism-based therapeutic strategies. Inhibiting the expression of either Hk2 or Gls1 at the onset of MYC-induced liver tumourigenesis resulted in the formation of tumours with re-expression of Gck or Gls2, respectively - the isoforms expressed in the normal liver and repressed in tumours. We cannot exclude that the expression of liver isoforms in tumours is the result of the selection of transformed cells that maintain their expression during transformation. Nevertheless, these observations demonstrate that the expression of the enzyme isoforms in a parental tissue can determine the degree of tumour sensitivity to a metabolism-focused therapy. The underlying mechanisms that drive the expression of isoforms are yet to be elucidated.
Furthermore, our results emphasize the role of glucose and glutamine as anaplerotic nutrients that support Krebs cycle activity. The flux of carbons from either substrate can compensate and support Krebs cycle intermediate pools when the other is limited. Indeed, only reducing both glucose and glutamine catabolism significantly lowered these pools and affected tumour formation. These results further substantiate previous elegant studies on the interactions between glucose and glutamine catabolism that support the survival of cancer cells22–25.
Our results demonstrate that not only GLS1 but synergistic action of glutaminases and amidotransferases can fuel glutamine-derived carbons to the Krebs cycle. This is clinically relevant since the expression of Gls1 and different amidotransferases is strongly correlated in human HCCs, suggesting that these patients may only benefit from a combination of compounds that inhibit these enzymes. During human clinical trials, DON was used as an inhibitor of both amidotransferases and glutaminases, based on previous results in vitro that employed relatively high doses43,44. In contrast, our results suggest that at therapeutically relevant doses, DON does not inhibit glutaminases. This finding opens the door to exploring the combination of GLS1 inhibitors with inhibitors of other glutamine-catabolising enzymes, such as DON. Importantly, DON prodrugs have been developed to enhance the delivery of an active compound to tumour tissues and circumvent gastrointestinal toxicity45,46.
Our results also shed light on the key roles played by dietary intake and host tissues in supplying nutrients that allow tumour cells to shift to an auxotrophic phenotype, emphasizing the potential importance of dietary intervention as an adjuvant cancer therapy. Strategies that individually target serine synthesis, or reduce its availability, have been the focus of recent studies. The -SG diet affects tumour growth in some models, including Eμ-Myc lymphoma and Apcmin-induced intestinal tumours while leaving KRas-induced pancreatic and intestinal tumours intact39. The -SG diet also enhanced the antineoplastic activity of biguadines on colon adenocarcinoma allografts, but had only a minor effect as a single therapy47. Our results suggest that the ability of tumours to synthesise serine makes them resistant to the -SG diet and inhibiting serine biosynthesis is necessary to broaden the spectrum of cancer types that respond positively to this dietary regime. Importantly, inhibitors of serine biosynthesis pathway have been developed36,48, and the sensitivity towards these inhibitors may also be determined by the concentration of serine and glycine in a specific tissue49. Together with inhibiting SG biosynthesis in tumours, these compounds should also be able to suppress the synthesis of SG by the host tissues. In this context a partial reduction of dietary serine and glycine, which is more feasible to implement in a clinic than total depletion, might suffice to deplete serine/glycine serum levels and affect tumour progression.
Similar to the situation with serine biosynthesis, different tumours have varying requirements for de novo fatty acid synthesis21,42. The FASN inhibitor TVB2640, alone or in combination, is currently being tested in different clinical trials (ClinicalTrials.gov identifiers: NCT02223247, NCT03032484, NCT02980029, and NCT03179904), and appears to shows anti-tumour activity50. Our results suggest that decreasing lipid availability or inhibiting lipid uptake should be considered as an adjuvant for therapies that target de novo lipogenesis. The inhibition of lipid transporters is one option51. However, the multitude of uptake mechanisms could present a major obstacle. Therefore, even though low fat diets on their own seem to have minor effects on human cancer progression52, they represent an attractive alternative.
Although targeting several metabolic pathways may seem to be more detrimental for normal cells and tissues than a mono-therapy, our results and those of others24,25 demonstrate that a therapeutic window exists. One of the contributory factors is the enhanced likelihood that complementary metabolic activities co-existing and are elevated in tumour cells in comparison with a given normal cell arising out of their significantly different metabolic demands. A deeper understanding of the differences in metabolic requirements and the response to metabolic interventions between different tumour cells and normal cells is required to design therapeutic approaches with minimal side effects.
In conclusion, our study illuminates how the understanding of metabolic adaptations in vivo is crucial for the design of effective therapeutic strategies for cancer, and that exploitation of combinatorial interventions against compensatory metabolic pathways may lead to more robust inhibition of tumour growth.
Methods
Mice.
Mice transgenic for both LAP-tTA and tet-o-MYC that overexpress MYC in the liver of males were generated as previously described9. To initiate MYC expression, male mice were weaned into regular chow. Male mice kept on a doxycycline-containing diet did not overexpress c-MYC and were used as controls (normal livers). Gls1fl/fl mice55, Hk/l/fl mice17 and Fasnfl/fl mice42 have been previously described. Psat1fl/fl mice were derived from Psat1tm1a(KOMP)Wtsi mice, obtained from the KOMP repository (UCDavis, MGI:4363603). Gls1fl/fl, Hk2fl/fl, Psat1fl/fl, and Fasnfl/fl mice, originated in different backgrounds, were back-crossed for a minimum of 10 generations with an FVBN/J strain to allow comparison among all the experimental groups. All lines were crossed with Alb-CreERT2 56 and Rosa26eYFP lines57 to generate Genefl/fl/Alb-CreERT2/Rosa26eYFP lines. Gene deletion was achieved by intraperitoneally (i.p.) administration of tamoxifen (Sigma; 10 mg/kg; dissolved in 1:10 ethanol:oil solution) starting at 5 – 6 weeks of age. Mice were bred and maintained under specific pathogen-free conditions at The Francis Crick Institute (Mill Hill laboratory and Midland Road Laboratory). Mice were palpated to detect liver tumours two times a week starting at three weeks post hydrodynamics-based transfection or doxycycline diet removal. All mice were closely monitored for any signs of distress, poor health or body weight loss (weight loss of either 20% from the start of an experiment, or 15% in the last 72h, was considered a humane end point). Tumours were identified as hard masses in an otherwise soft abdominal area or by an enlarged abdomen at later stages. 20% increase in the normal abdomen diameter was considered a humane end point. All procedures and animal husbandry were carried out in accordance with the UK Home Office, under the Animals (Scientific Procedures) Act 1986, and the Local Ethics Committee under the Project license number P609116C5.
Constructs and reagents.
The constructs for mouse injection, including pT3-EF1α-c-MYC, pT3-EF1α-MCL1 and pCMV-SB (which encodes for sleeping beauty transposase), and pCMV-CRE (which encodes for CRE recombinase), were previously described58. miR30-based shRNA targeting for Gls2 and Renilla Luciferase were cloned into pT3-EF1α-c-MYC. The shRNA sequences are: Gls2: CATCATGCCAACAAGCAACTT and Renilla Luciferase: AGGAATTATAATGCTTATCTA. All plasmids used for in vivo experiments were purified using the Endotoxin-free Maxiprep kit (Qiagen). [U-13C]-glucose, [U-13C]-glutamine, 15N-glutamine and 15N-alanine were purchased from Cambridge Isotope Laboratories, Inc.
Hydrodynamics-based transfection of DNA in the liver.
All mice used in the experiments were males. Hydrodynamic-based transfection was performed as described59, with some variations. Briefly, 10μg of pT3-EF1α-c-MYC, pT3-EF1α-c-MYC/shGls2 or pT3-EF1α-c-MYC/shLuc with 10 μg of pT3-EF1α-Mcl1 along with sleeping beauty transposase (SB) in a ratio of 25:1 were diluted in a volume of saline (0.9% NaCl) corresponding to 10% of body weight, and injected into the lateral tail vein of seven to nine-week-old FVB/N mice in 7 to 9 seconds. Since the ectopic expression of Cre recombinase has been previously shown to exacerbate MYC-induced apoptosis and reduce the efficiency of MYC-induced tumourigenesis60, the ectopic expression of MYC by hydrodynamics-based transfection was combined with the expression of MCL1. In these cases, a gene deletion was achieved by co-injection of 40 μg of CRE-recombinase (pT3-CMV-Cre) with c-MYC and MCL1-expressing plasmids and 4 μg of SB-encoding plasmid. Titration of the amount of SB allowed to ensure a reliable amount of integration events and induction of tumourigenesis. Mice used as controls (normal livers - Figures 2–7) were injected with an empty plasmid (pT3-EF1α-MCS). The timescale for tumour burden is specific for different methods of c-MYC induction and gene knockout.
Xenograft experiments.
5 × 10⁶ human HCT116 cells were subcutaneously injected into the flank of six to eight-week-old male SCID mice. 5 × 10⁶ mouse HCCMYC cells were injected into the flank of FVB/N mice. Xenografts were allowed to grow 2–3 mm before randomizing the mice into groups for treatment. Tumours were measured with a calliper, every three days and the volume was calculated using the formula for a hemiellipsoid (volume = (π/6) × length × width2). A tumour diameter of 1.5 cm was considered a humane end point. All mice were closely monitored for any signs of distress, poor health or body weight loss (weight loss of either 20% from the start of an experiment, or 15% in the last 72h, was considered a humane end point). All tumours were harvested at the end of the experiment and stored for further processing.
Diets and compound administration.
For the dietary amino acid restriction two synthetic diets were used: TestDiet® Baker amino acid diet with no added serine and glycine 5W53, and the control diet Baker amino acid defined diet 5CC7. Mice were placed on diets one week before hydrodynamics.
For the low-fat diet experiment a Low-Fat Control for Western Diet (5TJS) from Test Diet was used. We did not use a zero-fat diet to avoid its reported paradoxical effect on lipid accumulation in FasnKO non-cancerous livers61. To improve acceptance of the diet, in this experiment 5TJS was initially mixed with 5CC7 pellets (both diets have 5.1% fat content).Mice were placed on diets one week after hydrodynamics.
For the treatment with the Fasn inhibitor Fasnall, 4% and 9% Fat diets from Teklad Global Diets were used (2914C and 2919 respectively). Diet was changed six days after tumour cells injection, when tumours reached 0.3 mm of diameter, and 25mg/kg of Fasnall was administered every 72 h via i.p from one day after diet change. The vehicle was 50% DMSO, 25% saline, 25% PBS.
For short-term DON administration, 50 mg/kg of DON was administered 4 h before labelling. For long-term treatment. For the treatment of mice bearing HCT116 xenografts 25 mg/kg of DON and 100mg/kg of Gls1 inhibitor (compound 27) were used. DON was dissolved in saline and administered every 72 h via intraperitoneal. Gls1i/Compound 2733 was dissolved at 10 mg/ml in 1% tween 80 and the pH was adjusted to 3.5, and kept at room temperature under constant mixing for a maximum of seven days. Compound 27 (and vehicle) was administered every 24 h via oral gavage.
Stable isotope labelling in vivo.
Two types of in vivo label administration were performed: either bolus injections (once for glucose – endpoint: 15 min; twice for glutamine– endpoint: 30 min; and one for alanine - endpoint: 30 min), or a long-term infusion (3 h). A short time bolus allowed us to evaluate the capacity of tissues to take up and catabolize these nutrients. Intravenous infusions allowed us to measure a tracer incorporation into various metabolites, including lipids, and to calculate the steady state partial contribution of glucose and glutamine to different pathways.
Boluses of stable isotope-labelled compounds dissolved in saline (0.9% NaCl) were administered through the tail-vein (i.v.). [U-13C]-glucose was administered in a single bolus of 0.57 mg/g body weight (calculated as 20 mg of [U-13C]-glucose for an average body weight of 35g, dissolved in 100 μl of saline). Due to a limited solubility, administration of glutamine-derived stable isotopes ([U-13C]-glutamine, amino-15N-glutamine and amido-15N-glutamine) was divided into two boluses separated by a 15 min interval. A total dose of glutamine-derived stable isotopes was 0.34 mg/g body weight (calculated as 6+6 mg of [U-13C]-glutamine for an average body weight of 35g).15N-alanine was administered in a single bolus of 0.250 mg/g body weight.
Infusions were performed in animals under isofluorane anaesthesia, through a tail vein catheter, using an Aladdin AL-1000 pump (World Precision Instruments). The infusions protocol was based on the experiments described previously62. For [U-13C]-glucose, mice received a bolus of 0.4 mg/g body weight, followed by a 0.012 mg/g/min infusion for 3 h at 0.15 ml/h. For glutamine-derived stable isotopes infusions, mice received a bolus of 0.187 mg/g body weight, followed for a 0.005 mg/g/min infusion for 3 h at 0.15 ml/h. At the endpoint blood was obtained by cardiac puncture under terminal anaesthesia, and tissues were then harvested and freeze-clamped with a Wollenberger-like device pre-cooled in liquid nitrogen. The tissues were stored at −80°C until analysis.
Tissue metabolite extraction and analysis.
Freeze-clamped tissues were ground in liquid nitrogen with mortar and pestle and subsequently lyophilized on a FreeZone 4.5 Freeze Dry System (Labconco). Metabolite extraction from mouse tissues and derivatization of polar samples were performed as previously described63. Briefly, 10–15 mg of dry weight per sample were extracted with 1.8 ml of chloroform:methanol (2:1 v/v) containing a combinations of internal standards for 1 h at 4°C with intermittent sonication. Standards include scyllo-inositol (10 nmol), L-norleucine (10 nmol), 13C5-15N-Valine (5 μM final), 4,4-dimethyl-4-silapentane-1-sulfonic acid (DSS, 1 mM final), added with the methanol, and margaric acid (c17:0, 10–20 μg) added in the chloroform. After centrifugation (18,000g for 10 minutes at 4°C), the supernatant (SN1) was vacuum-dried in rotational-vacuum-concentrator RVC 2–33 CD (Christ). The pellet was re-extracted with methanol:water (2:1 v/v) as described above. After centrifugation, supernatant (SN2) was vacuum-dried in the SN1 tube. Phase partitioning (chloroform:methanol:water, 1:3:3 v/v) was used to separate polar and apolar metabolites. Fractions were vacuum dried as described above.
For GC-MS analysis of the polar metabolites, part of the polar fraction was washed twice with methanol, derivatized by methoximation (Sigma, 20 μl, 20 mg/ml in pyridine) and trimethylsilylation (20 μl of N,O-bis(trimethylsilyl)trifluoroacetamide reagent (BSTFA) containing 1% trimethylchlorosilane (TMCS), Supelco), and analysed on an Agilent 7890A-5975C GC-MS system63,64. Splitless injection (injection temperature 270°C) onto a 30 m + 10 m × 0.25 mm DB-5MS+DG column (Agilent J&W) was used, using helium as the carrier gas, in electron ionization (EI) mode. The initial oven temperature was 70°C (2 min), followed by temperature gradients to 295°C at 12.5°C/min and then to 320°C 25°C/min (held for 3 min). N-terminal glutamine residues spontaneously cyclize to become pyroglutamic acid (5-oxoproline) in the ionization source. The levels of pyroglutamic acid are used as a reference for the levels of glutamine in GC-MS experiments. It should be considered that in these experiments a fraction of glutamic acid can also contribute to pyroglutamic acid pool.
For GC-MS analysis of fatty acids, part of the apolar fraction was washed twice with methanol, derivatized by methoximation (Sigma, 20 μl, 20 mg/ml in pyridine) and analysed on an Agilent 7890A-5975C GC-MS system63,64. Splitless injection (injection temperature 270°C) onto a 30 m + 10 m × 0.25 mm DB-5MS+DG column (Agilent J&W) was used, using helium as the carrier gas, in electron ionization (EI) mode. The initial oven temperature was 50°C (1 min), followed by temperature gradients to 190°C at 20°C/min (held for 3 min), then to 242°C 4°C/min, then to 292°C at 10°C/min, and then to 320°C at 20°C/min. Triglycerides were purified by solid phase extraction on aminopropyl silica columns (Biotage Insolute NH2), with tripentadecanoin as an internal standard.
Metabolite quantification and isotopologue distributions were corrected for the occurrence of natural isotopes in both the metabolite and the derivatization reagent. Data analysis and peak quantifications were performed using MassHunter Quantitative Analysis software (B.06.00 SP01, Agilent Technologies). The level of labelling of individual metabolites was corrected for natural abundance of isotopes in both the metabolite and the derivatization reagent58. Abundance was calculated by comparison to responses of known amounts of authentic standards.
NMR spectra were acquired at 25°C with a Bruker Avance III HD instrument with a nominal 1H frequency of either 700 or 800 MHz using 3 mm tubes in a 5 mm CPTCI cryoprobe. For 1H 1D profiling spectra the Bruker pulse program noesygpr1d was used with a 1 s presaturation pulse (50 Hz bandwidth) centred on the water resonance, 0.1 ms mixing time, and 4 s acquisition time at 25°C. Typically 128 transients were acquired. To monitor the fate of 15N atoms derived from 15N-glutamine labelling, we acquired 2D 15N,1H heteronuclear multiple bond correlation (HMBC) spectra at 1H 700 MHz using the Bruker pulse program hmbcf3gpndqf, adapted to include solvent water resonance irradiation during the relaxation delay. Typically, the acquisition parameters employed were sweep widths 13 ppm (1H) and 220 ppm (15N), with offsets on the solvent water signal (1H) and at 120 ppm (15N). Acquisition times were 0.86 s (1H) and 0.012 s (15N), and pulse widths 7.4 μs (1H) and 25 μs (15N). 16 transients were collected for each increment, yielding a total measurement time of 4 h 16 m. The spectra were processed and plotted using Bruker TopSpin 3.5. The raw data were apodized with 1 Hz line broadening in the 1H dimension and unshifted sine bell in the 15N dimension and zero-filled to a matrix size of 32K × 512 points. The spectra are presented in a magnitude mode. 13Carbon incorporation was assessed using 2D 13C,1H-heteronuclear single quantum coherence (HSQC) spectroscopy with the pulse sequence hsqcetgpsisp2 using sweep widths 14 ppm (1H) and 165 ppm (13C) and offsets on the solvent water signal (1H) and 70 ppm (13C). Acquisition times were 0.16 s (1H) and 0.0176 s (13C), and pulse widths 7.4 μs (1H) and 11 μs (13C). Eight transients were collected for each increment. Non-uniform sensing (35%) of the data points in the indirect dimension was employed, yielding a total measurement time of 1 h 46 m. The spectra were reconstructed using the compressed sensing algorithm in Topspin, using Lorentz-to-Gaussian transformation (LB = −1 Hz; GB = 0.08) and cosine apodization in the 1H and 13C dimensions, respectively, and zero-filling to 4K ´ 1K points. NMR spectra were analysed with rNMR software65.
Metabolite analysis was performed by LC-MS using a Q-Exactive Plus (Orbitrap) mass spectrometer coupled to a Vanquish UHPLC system (both Thermo Fisher Scientific (Bremen, Germany)). The chromatographic separation was performed on a SeQuant® Zic®pHILIC (Merck Millipore) column (5 μm particle size, polymeric, 150 × 4.6 mm). The injection volume was 10 μl, the oven temperature was maintained at 25°C, and the autosampler tray temperature was maintained at 4°C. Chromatographic separation was achieved using a gradient program at a constant flow rate of 300 μl/min over a total run time of 25 min. The elution gradient was programmed as decreasing percentage of B from 80% to 5% during 17 minutes, holding at 5% of B during 3 minutes and finally re-equilibrating the column at 80% of B during 4 min. Solvent A was 20 mM ammonium carbonate and solvent B was acetonitrile. Metabolites were identified and quantified by accurate mass and retention time and by comparison to the retention times, mass spectra, and responses of known amounts of authentic standards using TraceFinder 4.1 EFS software (Thermo Fisher Scientific). Label incorporation and abundance was estimated using TraceFinder 4.1 EFS software. The level of labelling of individual metabolites was estimated as the percentage of the metabolite pool containing one or more 13C atoms after correction for natural abundance isotopes. Abundance was given relatively to the internal standard.
Cell experiments.
HCT116 colon cancer cell line and HepG2 hepatocellular carcinoma cell line were obtained from the Francis Crick cell lines repository (Cell cervices / Science Technology platform). The cell lines were tested for mycoplasma contamination and confirmed negative. All human cell lines undergo routine quality control, which includes STR profiling and species identification for validation. For isolation of tumour cells, harvested tissue was maintained in the ice-cold serum-free DMEM until processing (not more than 10 minutes). Tumours were minced in a 10 cm Petri dish using a scalpel, and washed twice with ice-cold HBSS containing EGTA. Then, intensive additional mincing was performed and 10 ml of digestion medium (HBSS containing 4 mM Ca2+, 5.5 mM glucose, 2 mM glutamine, and 40 μg/ml of Liberase TM (Roche)) were added, and incubated for 15–20 minutes at 37°C. The digested mixture was then passed through a 100-micron sterile nylon mesh cell strainer into a sterile 50 ml conical tube. 100-micron mesh allowed small groups of cells to pass-through, which lead to better survival results in some genotypes. Filtered cells were then centrifuged for 5 min at 200×g. The supernatant was removed and cells were resuspended in the washing media (MEM-Eagle for suspension culture plus 2 mM glutamine; Biological Industries). Cells were then seeded in DMEM containing 25 mM glucose, 2 mM glutamine, 10% FBS, 1% penicillin/streptomicin.
To knock-out Psat1 in cells isolated from MYC-driven tumours induced in Psat1fl/fl mice the retroviral vector MSCV-CreERT2 puro (Addgene plasmid #22776) was used. After transduction, cells were selected with puromycin, and then treated with 4-hydroxytamoxifen (4-OHT) to induce Cre activity.
Gls1KO/shLuc, Gls1KO/shGls2 cells, FasnKO cells and their CT counterparts were directly isolated from the respective tumours. The experiments for the analysis by GC-MS analysis were performed in medium containing 10 mM glucose and 2 mM glutamine in 6-well plates and 10 cm plates for NMR analysis. Cells were collected at sub-confluency with the media being refreshed 3 h before the extraction.
Metabolite extraction from cells was performed as described for tissues except the first step when the media was aspirated and cells were rapidly washed with ice-cold PBS and 600 μl of ice-cold methanol containing standards were added. Cells were scraped and transferred to an Eppendorf and 1.2 ml of chloroform were added. Cell proliferation was monitored by using the IncuCyte® system (Essen Bioscience). In each experiment, each condition was plated in triplicate. Growth curves were generated from data points acquired during 4 h interval imaging.
Western blot and immunofluorescence.
For western blotting tissues were homogenized in radioimmunoprecipitation assay buffer (RIPA) supplemented with protease and phosphatase inhibitor cocktails (aprotinin, leupeptin, benzamidin, pepstatin A, PMSF, sodium fluoride, sodium orthovanadate and β-glycerophosphate), with an Ultra-Turrax® homogenizer. Samples were centrifuged at 15,000 x g for 15 min at 4°C. Supernatantprotein was quantified and protein extracts were mixed with a loading buffer 4X (40% glycerol, 2% SDS, 250 mM Tris pH 6.8, 0.02% bromophenol blue, and 12% β-mercaptoethanol). Western blots were performed with 20 μg of tissue extracts. Proteins were separated in 8–12% SDS-PAGE and transferred to a nitrocellulose membrane (BioRad). The membrane was blocked in 5% milk, incubated with primary antibody in TBST with 5% BSA overnight at 4°C, and then incubated with Horseradish peroxidase activity linked to secondary antibody. Protein signal was detected with ECL substrate (Pierce) using X-Ray films. Primary antibodies used were c-MYC (1472–1, Epitomics), PSAT1 (20180–1-AP, Protein Tech), PHGDH (sc292792, Santa Cruz), β-Actin (A2228 and A3854, Sigma), Cleaved CASP3 (9661, Asp175, Cell Signaling), Glucokinase (AP7901C, Abgent), GLS2 (6217, ProSci), FASN (#23180, C20G5, Cell Signaling), HK1 (#2024, C35C4, Cell Signaling), HK2 (#2867, C64G5, Cell Signaling), PCNA (#13110, D3H8P, Cell Signaling), PARP (#9542, Cell Signaling), with the GLS1-KGA specific antibody was a generous gift from Astra Zeneca.
For immunofluorescence, tissues were fixed for 24 hours in 4% paraformaldehyde, equilibrated in 30% sucrose, embedded in OCT compound (VWR international), and stored at −80°C until 7-μm-thick cryosections were obtained. Sections were permeabilized by incubating with 0.2% Triton X-100 in PBS for 10 min, and treated with the indicated primary antibody for 16 h. Primary antibodies used were: GFP (4745–1051, Bio-Rad) and PanCK (Z0622, Dako). After four washes with 0.05% Tween in PBS, cells were incubated with anti-rabbit Alexa Fluor® 488 or 555 secondary antibodies (Invitrogen) for 1 hour. Nuclear marker DAPI was included in the mounting media. Samples were examined using a confocal microscope (TCS SP5 II Leica) and LCS Lite software (Leica) was used to collect digital images.
Mouse intestinal organoid culture.
Organoids were stablished from tumours isolated from APCmin mice using a previously described protocol66, with an additional collagenase and dispase digestion step after the EDTA-chelation step67 where Matrigel was replaced with Cultrex® BME, Type 2 RGF PathClear (Amsbio 3533–010-02). Organoids were cultured in Intesticult™ Organoid Growth media (06005, Stem Cell Technologies). The Rho kinase inhibitor Y-27632 (Sigma) was added to the culture when trypsinised.
Human material and patient-derived organoid cultures.
Samples have been harvested during surgeries at the University College London Hospital, in accordance with ethical approval, REC Ref: 15/YH/0311. Written informed consent was obtained. Intestinal samples were obtained from patients with colorectal cancer. Crypts were isolated from human intestinal tissue by incubating for 1 hour with chelation buffer (5.6 mM Na2HPO4, 8 mM KH2PO4, 96 mM NaCl, 1.6 mM KCl, 44 mM sucrose, 54.8 mM D-sorbitol, 0.5 M EDTA and 1M DTT at 4°C, and plated in drops of BME (Sato et al, 2009). After polymerization, culture media was added. Human intestinal organoid media contains advanced DMEM/F12 medium (Invitrogen) including B27 (Invitrogen), nicotinamide (Sigma-Aldrich), N-acetylcysteine (Sigma-Aldrich), EGF (Invitrogen PMG8043), TGF-ß type I receptor inhibitor A83–01 (Tocris), P38 inhibitor SB202190 (Sigma-Aldrich), gastrin I (Sigma-Aldrich), Wnt3a conditioned media (50% produced using stably transfected Lcells), Noggin and R-spondin conditioned media.
Cell Titer Glo.
Organoids were trypsinized using TrypLE and filtered with a 20 μm cell strainer. 3500 single cells were seeded in BME per 48 well and placed in a 37°C incubator to polymerize for 20 min. 250 μl of Intesticult™ Organoid Growth media (06005, Stem Cell Technologies) (for APCmin organoids) or 250 μl of complete human organoid media (for human patient organoids) with the indicated treatments was added for the indicated times. The media were supplemented with 10 μM Y-27632 for two days after plating. Cell Titer Glo Luminescent Cell viability assay (G7572, Promega) was used to assess viability of the organoids. Experiments were performed at least three times with three triplicates each.
Organoid colony formation assay.
Organoids were dissociated into single cells using TrypLE and further filtered with a 20 μm cell strainer. For each condition, 3500 single cells were seeded in BME per 48 well and placed in a 37°C incubator to polymerize for 20 min. 250 μl of Intesticult™ Organoid Growth media (06005, Stem Cell Technologies) (for APCmin organoids) or 250 μl of complete human organoid media (for human patient organoids) with the indicated conditions. The media were supplemented with 10 μM Y-27632 for two days after plating. Number of spheres formed in each well was counted as plating efficiency. Images were captured at the indicated times with EVOS FL cell imaging system (Life technologies). Experiments were performed at least three times with three triplicates each.
Microarray analysis of mouse tissues.
The microarray data from four MYC-induced liver tumours and four wild type control livers can be found on Gene Expression Omnibus (GEO) accession GSE129013 (http://www.ncbi.nlm.nih.gov/geo). Data were analysed using Bioconductor 2.13 running on R 3.0.2. Probeset expression measures were calculated using Affymetrix package’s Robust Multichip Average (RMA) default method.
Statistical analysis.
All analyses were performed using GraphPad Prism 7 software. Statistical analyses were performed applying a two-tailed Student’s t-test, one-way ANOVA or two-way ANOVA, where indicated. Error bars in figures represent the standard deviation (S.D.). No statistical methods were used to predetermine sample size. When possible (for example, for shRNA experiments, or diets), mice were randomized into groups. Samples were randomized for metabolomics analysis. The investigators were not blinded to allocation during experiments.
Data availability.
All the data that support the findings of this study are available from the corresponding author upon request. The microarray data have been deposited in Gene Expression Omnibus (GEO) under accession code GSE129013 (http://www.ncbi.nlm.nih.gov/geo).
Extended Data
Extended Data Fig. 1. Glucose and glutamine metabolism in MYC liver tumours.

(a-g) Mice bearing MYC-driven liver tumours and control mice (n=5 per group) were infused with [U-13C]-glucose (a-c), or [U-13C]-glutamine (d-f) and the label incorporation into tissue metabolites was analysed by GC-MS: percent enrichment in either serum glucose (a) or glutamine (d) in mice administered either [U-13C]-glucose or [U-13C]-glutamine bolus, respectively (*glutamine enrichment is estimated from quantification of its spontaneous product pyroglutamate); (b and e) percent enrichment; (c and g) total content of metabolites. Note that lower glutamine enrichment in Krebs cycle intermediates in tumours in comparison with normal livers is proportional to the difference in serum enrichment between control and tumour-bearing mice; normalized values for Krebs cycle metabolites from (b and e) are shown in (g). Data are presented as mean ± S.D. Statistical analysis was performed using a two-tailed Student’s t-test. Complete list of exact p-values is provided as a source data file.
(h) 15N-HMBC 2D NMR signals of the indicated metabolites in the indicated mouse tissues after amino- 15N-glutamine bolus. Spectra of three representative mice per group are shown (n=5 mice per group).
(i) Percent enrichment of tissue total fatty acids (both free and esterified) after either [U-13C]-glucose or [U-13C]-glutamine infusions (n=5 mice per group; GC-MS). Data are presented as mean ± S.D. Statistical analysis was performed using a two-tailed Student’s t-test. Complete list of exact p-values is provided as a source data file.
(j) Nile red fluorescence visualised by confocal microscopy showing neutral lipid accumulation (in red) in MYC-driven tumours. Nuclei are shown in blue.
Extended Data Fig. 2. Expression of key metabolic enzymes in MYC liver tumours and the method of genetically manipulating their expression in vivo.

(a) A diagram depicting some of the most relevant transcriptomic changes in central carbon metabolism in MYC-driven liver tumours when compared with normal livers based on microarray data shown in (b).
(b) A heat map of gene expression of relevant metabolic enzymes and metabolite transporters in normal livers and MYC-driven liver tumours (n=4 mice per group). Statistical analysis was performed using a two-tailed Student’s t-test. *, p < 0.05.
(c) Generation of liver specific conditional knockouts of the genes of interest in hepatocytes. Cre-ERT2 is expressed under the hepatocyte-specific albumin gene promoter. Cre is activated upon administration of tamoxifen. Simultaneously, the Enhanced Yellow Fluorescent Protein (eYFP) reporter gene is activated, following Cremediated excision of a loxP-flanked transcriptional “stop” sequence, after the Rosa26 locus.
(d-g) To confirm a cell of origin of MYC-driven liver tumours, the dose of AAV8-Cre (adenoassociated virusserotype 8 expressing Cre recombinase) required to activate the eYFP reporter expression in all the hepatocytes was titrated. Dose is expressed in genome copies (GC): (d) Macroscopic fluorescence image of the livers of the mice treated with different doses of AAV8- Cre; (e) Confocal fluorescence image of the mouse livers shown in (d) demonstrating that the dose of 8 × 10¹² GC induces eYFP expression in all the hepatocytes; (f) Immunostaining with the cholangiocyte marker Pan- cytokeratin (PanCK) demonstrates that cholangiocytes are not targeted by AAV8-Cre; (g) Rosa26-eYFP mice treated with 8 × 10¹² GC AAV8-Cre, were hydrodynamically transfected with MYC and MCL1, and the resulting tumours expressed eYFP, demonstrating that hepatocytes are the cell of origin of the tumours (n=3 mice per dose).
(h) MYC and MCL1 are among genes frequently upregulated in human liver cancers. Analysis performed in cBioPortal67,68, combining all available liver cancer databases, expressed as percentage of positive tumour samples.
Extended Data Fig. 3. Metabolic consequences of the deletion of either Gls1 or Gls2 in MYC liver tumours.

(a) Total concentration of 13C-labeled Krebs cycle metabolites in CT and Gls1KO tumours after a [U-13C]- glutamine bolus (n=5 mice per group; GC-MS).
(b) Western blot of the samples presented in Fig. 2a showing the expression of GLS2 in Gls1KO tumours (n=3,5,5).
(c-e) shRNA mediated Gls2 knock-down in MYC-driven liver tumours with intact Gls1 expression does not affect tumour burden or glutamine catabolism. Liver tumours were induced by hydrodynamics-driven co-transfection of plasmids encoding MYC that included a miR30 based shRNA targeting for Gls2 or Renilla Luciferase (pT3- EF1α-c-MYC/shGls2 and pT3-EF1α-c-MYC/shLuc, respectively), and a plasmid encoding MCL1 (pT3-EF1α- MCL1) (c) Western blot demonstrating efficient Gls2 knock-down (n=3,5,5). (d) Kaplan-Meier survival curve (shLuc n=13; shGls2 n=11). P-value was calculated by Mantel–Cox test. (e) 13C-enrichment in the indicated metabolites extracted from either shLuc or shGls2 tumours (Gls1 wild type) after a [U-13C]-glutamine bolus (n=5 mice per group). (f) Total level of glutamine and glutamate in CT/shLuc, Gls1KO/shLuc, and Gls1KO/shGls2 tumours (n=6,5,6; LC-MS).
(g) Isotopologue distribution of the 13C-enrichment of glutamine in the serum of mice shown in Fig. 2h–j, Extended Data Fig. 3f, h and 4b (n=6,4,5; GC-MS). Glutamine enrichment was estimated from quantification of its spontaneous product pyroglutamate.
(h) 13C-enrichment of the indicated metabolites after a [U- 13C]-glutamine bolus, related to Fig. 2h,i, shows the enrichment of glycolytic intermediates from [U-13C]- glutamine through gluconeogenesis in tumours and the respective adjacent livers (n=6,5,6,6,5,6).
All data are presented as mean ± S.D. Statistical analysis was performed using a two-tailed Student’s t-test. Complete list of exact p-values is provided as a source data file.
Extended Data Fig. 4. Non-essential amino acids support proliferation of tumour cells in the absence of glutaminases.

(a-b) Total levels of NEAA measured in extracts from either CT and Gls1KO tumours (a; n=5 mice per group; GC-MS), or CT/shLuc and Gls1KO/shGls2 tumours (b; n=6 mice per group; GC-MS).
(c) Proliferation of cells derived from either CT, Gls1KO/shLuc or Gls1KO/shGls2 HCCMYC tumours in the indicated conditions. Representative curves from one of three independent experiments (with three biological replicates) are shown.
(d) Quantification of Krebs cycle metabolites and amino acids in extracts from the CT, Gls1KO/shLuc or Gls1KO/shGls2 HCCMYC cells grown in control conditions (Data represents the average of three different experiments).
(e) 15N-enrichment in the indicated amino acids from CT and Gls1KO/shGls2 tumours after a 15N-alanine bolus (n=4 mice per group; GC-MS).
Data are presented as mean ± S.D. Statistical analysis was performed using a two-tailed Student’s t-test. Complete list of exact p-values is provided as a source data file.
Extended Data Fig. 5. The role of transamidasedependent glutamine catabolism.

(a) A correlation between the gene expression level of Gls1 and different amidotransferases analyzed from the TCGA human Hepatocellular Carcinoma Provisional mRNA dataset (https://www.cancer.gov/tcga, RNA Seq V2, 371 patients / 373 samples). Modified from cBioPortal67,68.
(b) A representative full 1H-15N 2D-HMBC NMR spectra of the polar fraction of a CT tumour from a mouse infused for three hours with amido-15N-glutamine. Shows the regions of interest (R.O.I) of the signals from the indicated metabolites as the results of the 15Nincorporation from the amide group of glutamine during in vivo infusions.
(c) Quantification of the amido-15N-glutamine-derived enrichment of different metabolites, including nucleosides, in tumours from mice infused with amido- 15N-glutamine (n=3 mice per group; LC-MS; top panel) and cells isolated from the tumours and incubated with 2 mM amido-15N-glutamine for 48 h (n=3 independent experiments; LC-MS; bottom panel). Data are presented as mean ± S.D. Statistical analysis was performed using a two-tailed Student’s t-test. Complete list of exact p-values is provided as a source data file.
(d) 1H-15N 2D-HMBC NMR spectra of the serum of mice infused with amido-15N-glutamine, demonstrating the presence of labelled amino acids.
(e) Representative region of the 1H-15N 2D-HMBC NMR spectra of CT MYC liver tumours from mice treated with the vehicle or 25 mg/kg of the pan-amidotransferase inhibitor DON, infused with amido-15N-glutamine. Note the DON-dependent suppression of the 15N incorporation.
Extended Data Fig. 6. The effect of coinhibiting glutaminases and amidotransferases on metabolism and tumour cell proliferation.

(a-c) The effect of DON (50 mg/kg, 4 h) on either CT or Gls1KO/shGls2 tumours from animals treated prior to [U- 13C]-glutamine bolus (n=3 mice per group): (a) 2D 1H- 13C-HSQC NMR signals of glutamine and glutamate; (b) Total concentration of glutamine-derived amino acids (n=3 mice per group); (c) Total concentration of Krebs cycle intermediates (n=3 mice per group).
(d) Enrichment from either [U-13C]-glutamine or [U-13C]- glucose in HCCMYC-CT and HCCMYC-Gls1KO/shGls2 tumour cells treated with DON (3 h; n=3 independent experiments; GC-MS).
(e) Isotopologue distribution of the 13C incorporation into malate in the experiment shown in (d) (n=3 independent experiments).
Data are presented as mean ± S.D. Statistical analysis was performed using a two-tailed Student’s t-test. Complete list of exact p-values is provided as a source data file.
(f) Combination of glutaminase inhibition and DON on cell proliferation of HCCMYC cells: HCCMYC-CT cells were treated with 1 μM CB-839 and/or 2 μM of DON.
(g and h) HCCMYC-Gls1KO/shGls2 (g) and HCCMYC-CT (h) cells treated with a combination of DON and CB-839 with or without the addition of the indicated amino acids. AAAP - a mix of alanine, aspartate, asparagine and proline.
(i, j) HepG2 cells treated with DON and/or CB-839 at the indicated concentrations.
In (f-i) growth was monitored in an IncuCyte Live-Cell analysis system. In (f-i), representative curves from one of three independent experiments with 3 replicates are shown. Data are presented as mean ± S.D.
Extended Data Fig. 7. Effects of the simultaneous reduction of glycolysis and glutaminolysis on metabolism of tumours.

(a) 13C-enrichment of glucose in the serum of mice bearing either CT and Hk2KO tumours administered [U- 13C]-glucose bolus (n=6 mice per group).
(b,c) Total level of glucose 6P and fructose 6P (b) and Krebs cycle intermediates (c) in CT and Hk2KO tumours (n=6 mice per group; GC-MS). (d-f) Total metabolite levels in CT and Gls1KO/Hk2KO tumours (CT n=8; Gls1KO/Hk2KO n=9; LC-MS): (d) Additional Krebs cycle intermediates to those shown in Fig. 5f; (e) glutamine; (f) glycolytic intermediates; (g) NEAAs; (h) pentose phosphate pathway intermediates.
(i,j) Western blot of glutaminase and hexokinase isoform expression in CT and Gls1KO/Hk2KO tumours. β-actin was used as a loading control: (i) Demonstration of the deletion of Gls1 and Hk2 (n=2,5,5); (j) Protein levels of other glutaminase and hexokinase isoforms in CT and Gls1KO/Hk2KO tumours (n=2,6,6).
Data are presented as mean ± S.D. Statistical analysis was performed using a two-tailed Student’s t-test. Complete list of exact p-values is provided as a source data file.
Extended Data Fig. 8. Inhibition of lipid metabolism in MYC liver tumours.

(a) 13C-enrichment of fatty acids (total fraction) from the indicated tissues of mice infused with [U-13C]-glucose demonstrating a total blockade in fatty acid biosynthesis in FasnKO tumours (n=4,5,5). A representative chromatogram of the fatty acid composition of a FasnKO tumour is shown. For unsaturated fatty acids, a residual enrichment that remained in the authentic standards after substraction of the natural abundance of 13C, was also substracted from the samples.
(b) Total fatty acid content in CT and FasnKO tumours (n=11,10).
(c) Fatty acid ratios in CT and FasnKO tumours (n=11,10).
(d) Left panel, a heat map demonstrating the expression of genes involved in lipid transport in MYC-driven liver tumours compared to normal livers (gene microarray, Log2-transformed; n=4 mice per group). Right panel, absolute values are shown to identify those genes with higher total expression level, and to discriminate the genes with low levels of expression, which could be insufficient to produce relevant protein levels. Based on the expression of the relevant control genes (examples are shown in the lower panel) we considered 6 as a baseline level, while higher than 8 as a high level of expression.
(e) Total fatty acid content in CT and FasnKO tumours kept on the Low-Fat diet (n=6,11).
(f) The ratios of different fatty acids in CT and FasnKO tumours kept on the low-fat diet (n=6,11). Data are presented as mean ± S.D. Statistical analysis was performed using a two-tailed Student’s t-test. Complete list of exact p-values is provided as a source data file.
(g) Light microscopy images of living cells isolated from CT and FasnKO tumours, after being maintained in the indicated media conditions with modulation of the lipid availability for 72 h. Representative images from three independent experiments are shown.
Extended Data Fig. 9. Inhibition of serine and glycine metabolism in MYC liver tumours.

(a) Representative 15N-HMBC 2D NMR signals of the indicated metabolites in mouse livers and tumours after an amino-15N-glutamine bolus (NMR spectra acquired: n=4 mice per group).
(b) 15N-enrichment of glutamine (m+1) in the serum of mice shown in Fig. 7g and Extended Data Fig. 9a,d,e (n=5,5,7,7; GC-MS). Glutamine enrichment is estimated from quantification of its spontaneous product pyroglutamate.
(c) Psat1fl/fl cells were transduced with either MSCVCreER or Empty vector, and both lines were treated with 4OH-Tamoxifen to induce Cre activity. The resulting Psat1WT and Psat1KO cells were cultured in DMEM with dialysed FCS and indicated metabolites. Ser: 0.5 mM serine; Gly: 0.5 mM glycine; 0.5 mM formate. Representative curves from one of three independent experiments with three replicates are shown. Data represent mean ± S.D.
(d) Total concentration of metabolites in livers and tumours of mice from the experiment shown in Fig. 7f,g and Extended Data Fig. 9a, b, e (n=4,4,5,5,7,7; LC-MS).
(e) Total concentration and 15N-enrichment from an amino-15N-glutamine bolus in serine and glycine from the serums of the indicated mice from the experiment shown in (a) (n=5,5,7,7).
In (b and e) data are presented as mean ± S.D. Statistical analysis was performed using a two-tailed Student’s ttest. Complete list of exact p-values is provided as a source data file.
In (d) data are presented as mean ± S.D. Statistical analysis was performed using one-way ANOVA followed by Tukey’s post hoc test. *, p < 0.05; **, p< 0.01; ***, p < 0.001, with respect to CT tumours on control diet; #, p < 0.05; ##, p< 0.01; ###, p < 0.001, with respect to CT tumours on –SG diet.
Supplementary Material
Acknowledgements
This work was supported by the Francis Crick Institute which receives its core funding from Cancer Research UK (FC001223), the UK Medical Research Council (FC001223), and the Wellcome Trust (FC001223); by grants from NIH R01CA136606 and R21CA198490 to XC; P30DK026743 for UCSF Liver Center; NIH R01CA206167 and Department of Veteran Affairs BX000733 for NH. We thank The Francis Crick Institute Biological Services for breeding and maintenance of the mice and the MRC Biomedical NMR Centre for assistance. We also thank Alex P. Gould, Patricia M. Nunes, and Andrew P. Bailey for critical reading and useful comments on the manuscript.
Footnotes
Competing Interests Statement
The authors declare no competing interests.
References
- 1.Vander Heiden MG & DeBerardinis RJ Understanding the Intersections between Metabolism and Cancer Biology. Cell 168, 657–669, doi: 10.1016/j.cell.2016.12.039 (2017). [DOI] [PMC free article] [PubMed] [Google Scholar]
- 2.Hsu PP & Sabatini DM Cancer cell metabolism: Warburg and beyond. Cell 134, 703–707, doi: 10.1016/j.cell.2008.08.021 (2008). [DOI] [PubMed] [Google Scholar]
- 3.Luengo A, Gui DY & Vander Heiden MG Targeting Metabolism for Cancer Therapy. Cell Chem Biol 24, 1161–1180, doi: 10.1016/j.chembiol.2017.08.028 (2017). [DOI] [PMC free article] [PubMed] [Google Scholar]
- 4.Davidson SM et al. Environment Impacts the Metabolic Dependencies of Ras-Driven Non-Small Cell Lung Cancer. Cell Metab 23, 517–528, doi: 10.1016/j.cmet.2016.01.007 (2016). [DOI] [PMC free article] [PubMed] [Google Scholar]
- 5.Lyssiotis CA & Kimmelman AC Metabolic Interactions in the Tumor Microenvironment. Trends Cell Biol 27, 863–875, doi: 10.1016/j.tcb.2017.06.003 (2017). [DOI] [PMC free article] [PubMed] [Google Scholar]
- 6.Miller DM, Thomas SD, Islam A, Muench D & Sedoris K. c-Myc and cancer metabolism. Clin Cancer Res 18, 5546–5553, doi: 10.1158/1078-0432.CCR-12-0977 (2012). [DOI] [PMC free article] [PubMed] [Google Scholar]
- 7.Stine ZE, Walton ZE, Altman BJ, Hsieh AL & Dang CV MYC, Metabolism, and Cancer. Cancer Discov 5, 1024–1039, doi: 10.1158/2159-8290.CD-15-0507 (2015). [DOI] [PMC free article] [PubMed] [Google Scholar]
- 8.Dang CV, Reddy EP, Shokat KM & Soucek L. Drugging the ‘undruggable’ cancer targets. Nat Rev Cancer 17, 502–508, doi: 10.1038/nrc.2017.36 (2017). [DOI] [PMC free article] [PubMed] [Google Scholar]
- 9.Shachaf CM et al. MYC inactivation uncovers pluripotent differentiation and tumour dormancy in hepatocellular cancer. Nature 431, 1112–1117, doi: 10.1038/nature03043 (2004). [DOI] [PubMed] [Google Scholar]
- 10.Yuneva MO et al. The metabolic profile of tumors depends on both the responsible genetic lesion and tissue type. Cell Metab 15, 157–170, doi: 10.1016/j.cmet.2011.12.015 (2012). [DOI] [PMC free article] [PubMed] [Google Scholar]
- 11.Hu S. et al. 13C-pyruvate imaging reveals alterations in glycolysis that precede c-Myc-induced tumor formation and regression. Cell Metab 14, 131–142, doi: 10.1016/j.cmet.2011.04.012 (2011). [DOI] [PMC free article] [PubMed] [Google Scholar]
- 12.Mendez-Lucas A. et al. Glucose Catabolism in Liver Tumors Induced by c-MYC Can Be Sustained by Various PKM1/PKM2 Ratios and Pyruvate Kinase Activities. Cancer Res 77, 4355–4364, doi: 10.1158/0008-5472.CAN-17-0498 (2017). [DOI] [PMC free article] [PubMed] [Google Scholar]
- 13.DeBerardinis RJ et al. Beyond aerobic glycolysis: transformed cells can engage in glutamine metabolism that exceeds the requirement for protein and nucleotide synthesis. Proc Natl Acad Sci USA 104, 19345–19350, doi: 10.1073/pnas.0709747104 (2007). [DOI] [PMC free article] [PubMed] [Google Scholar]
- 14.Hensley CT, Wasti AT & DeBerardinis RJ Glutamine and cancer: cell biology, physiology, and clinical opportunities. J Clin Invest 123, 3678–3684, doi: 10.1172/JCI69600 (2013). [DOI] [PMC free article] [PubMed] [Google Scholar]
- 15.Pavlova NN & Thompson CB The Emerging Hallmarks of Cancer Metabolism. Cell Metab 23, 27–47, doi: 10.1016/j.cmet.2015.12.006 (2016). [DOI] [PMC free article] [PubMed] [Google Scholar]
- 16.Still ER & Yuneva MO Hopefully devoted to Q: targeting glutamine addiction in cancer. Br J Cancer 116, 1375–1381, doi: 10.1038/bjc.2017.113 (2017). [DOI] [PMC free article] [PubMed] [Google Scholar]
- 17.Patra KC et al. Hexokinase 2 is required for tumor initiation and maintenance and its systemic deletion is therapeutic in mouse models of cancer. Cancer Cell 24, 213–228, doi: 10.1016/j.ccr.2013.06.014 (2013). [DOI] [PMC free article] [PubMed] [Google Scholar]
- 18.Xiang Y. et al. Targeted inhibition of tumor-specific glutaminase diminishes cell-autonomous tumorigenesis. J Clin Invest 125, 2293–2306, doi: 10.1172/JCI75836 (2015). [DOI] [PMC free article] [PubMed] [Google Scholar]
- 19.DeWaal D. et al. Hexokinase-2 depletion inhibits glycolysis and induces oxidative phosphorylation in hepatocellular carcinoma and sensitizes to metformin. Nat Commun 9, 446, doi: 10.1038/s41467-017-02733-4 (2018). [DOI] [PMC free article] [PubMed] [Google Scholar]
- 20.Svensson RU et al. Inhibition of acetyl-CoA carboxylase suppresses fatty acid synthesis and tumor growth of non-small-cell lung cancer in preclinical models. Nat Med 22, 1108–1119, doi: 10.1038/nm.4181 (2016). [DOI] [PMC free article] [PubMed] [Google Scholar]
- 21.Li L. et al. Inactivation of fatty acid synthase impairs hepatocarcinogenesis driven by AKT in mice and humans. J Hepatol 64, 333–341, doi: 10.1016/j.jhep.2015.10.004 (2016). [DOI] [PMC free article] [PubMed] [Google Scholar]
- 22.Yang C. et al. Glutamine oxidation maintains the TCA cycle and cell survival during impaired mitochondrial pyruvate transport. Mol Cell 56, 414–424, doi: 10.1016/j.molcel.2014.09.025 (2014). [DOI] [PMC free article] [PubMed] [Google Scholar]
- 23.Cheng T. et al. Pyruvate carboxylase is required for glutamine-independent growth of tumor cells. Proc Natl Acad Sci U S A 108, 8674–8679, doi: 10.1073/pnas.1016627108 (2011). [DOI] [PMC free article] [PubMed] [Google Scholar]
- 24.Momcilovic M. et al. Targeted Inhibition of EGFR and Glutaminase Induces Metabolic Crisis in EGFR Mutant Lung Cancer. Cell Rep 18, 601–610, doi: 10.1016/j.celrep.2016.12.061 (2017). [DOI] [PMC free article] [PubMed] [Google Scholar]
- 25.Momcilovic M. et al. The GSK3 Signaling Axis Regulates Adaptive Glutamine Metabolism in Lung Squamous Cell Carcinoma. Cancer Cell 33, 905–921 e905, doi: 10.1016/j.ccell.2018.04.002 (2018). [DOI] [PMC free article] [PubMed] [Google Scholar]
- 26.Malato Y. et al. Fate tracing of mature hepatocytes in mouse liver homeostasis and regeneration. J Clin Invest 121, 4850–4860, doi: 10.1172/JCI59261 (2011). [DOI] [PMC free article] [PubMed] [Google Scholar]
- 27.Chen X & Calvisi DF Hydrodynamic transfection for generation of novel mouse models for liver cancer research. Am J Pathol 184, 912–923, doi: 10.1016/j.ajpath.2013.12.002 (2014). [DOI] [PMC free article] [PubMed] [Google Scholar]
- 28.Zalkin H & Smith JL Enzymes utilizing glutamine as an amide donor. Adv Enzymol Relat Areas Mol Biol 72, 87–144 (1998). [DOI] [PubMed] [Google Scholar]
- 29.Spinelli JB et al. Metabolic recycling of ammonia via glutamate dehydrogenase supports breast cancer biomass. Science 358, 941–946, doi: 10.1126/science.aam9305 (2017). [DOI] [PMC free article] [PubMed] [Google Scholar]
- 30.Xiang L. et al. Glutaminase 1 expression in colorectal cancer cells is induced by hypoxia and required for tumor growth, invasion, and metastatic colonization. Cell Death Dis 10, 40, doi: 10.1038/s41419-018-1291-5 (2019). [DOI] [PMC free article] [PubMed] [Google Scholar]
- 31.Satoh K. et al. Global metabolic reprogramming of colorectal cancer occurs at adenoma stage and is induced by MYC. Proc Natl Acad Sci U S A 114, E7697–E7706, doi: 10.1073/pnas.1710366114 (2017). [DOI] [PMC free article] [PubMed] [Google Scholar]
- 32.Nagle PW, Plukker JTM, Muijs CT, van Luijk P & Coppes RP Patient-derived tumor organoids for prediction of cancer treatment response. Semin Cancer Biol 53, 258–264, doi: 10.1016/j.semcancer.2018.06.005 (2018). [DOI] [PubMed] [Google Scholar]
- 33.Finlay MRV et al. Discovery of a Thiadiazole-Pyridazine-Based Allosteric Glutaminase 1 Inhibitor Series That Demonstrates Oral Bioavailability and Activity in Tumor Xenograft Models. J Med Chem 62, 6540–6560, doi: 10.1021/acs.jmedchem.9b00260 (2019). [DOI] [PubMed] [Google Scholar]
- 34.Alwarawrah Y. et al. Fasnall, a Selective FASN Inhibitor, Shows Potent Anti-tumor Activity in the MMTV-Neu Model of HER2(+) Breast Cancer. Cell Chem Biol 23, 678–688, doi: 10.1016/j.chembiol.2016.04.011 (2016). [DOI] [PMC free article] [PubMed] [Google Scholar]
- 35.Mattaini KR, Sullivan MR & Vander Heiden MG The importance of serine metabolism in cancer. J Cell Biol 214, 249–257, doi: 10.1083/jcb.201604085 (2016). [DOI] [PMC free article] [PubMed] [Google Scholar]
- 36.Pacold ME et al. A PHGDH inhibitor reveals coordination of serine synthesis and one-carbon unit fate. Nat Chem Biol 12, 452–458, doi: 10.1038/nchembio.2070 (2016). [DOI] [PMC free article] [PubMed] [Google Scholar]
- 37.Labuschagne CF, van den Broek NJ, Mackay GM, Vousden KH & Maddocks OD Serine, but not glycine, supports one-carbon metabolism and proliferation of cancer cells. Cell Rep 7, 1248–1258, doi: 10.1016/j.celrep.2014.04.045 (2014). [DOI] [PubMed] [Google Scholar]
- 38.Gao X. et al. Serine Availability Influences Mitochondrial Dynamics and Function through Lipid Metabolism. Cell Rep 22, 3507–3520, doi: 10.1016/j.celrep.2018.03.017 (2018). [DOI] [PMC free article] [PubMed] [Google Scholar]
- 39.Maddocks ODK et al. Modulating the therapeutic response of tumours to dietary serine and glycine starvation. Nature 544, 372–376, doi: 10.1038/nature22056 (2017). [DOI] [PubMed] [Google Scholar]
- 40.Diehl FF, Lewis CA, Fiske BP & Vander Heiden MG Cellular redox state constrains serine synthesis and nucleotide production to impact cell proliferation. Nat Metab 1, 861–867, doi: 10.1038/s42255-019-0108-x (2019). [DOI] [PMC free article] [PubMed] [Google Scholar]
- 41.Esaki K. et al. L-Serine Deficiency Elicits Intracellular Accumulation of Cytotoxic Deoxysphingolipids and Lipid Body Formation. J Biol Chem 290, 14595–14609, doi: 10.1074/jbc.M114.603860 (2015). [DOI] [PMC free article] [PubMed] [Google Scholar]
- 42.Li L. et al. Differential requirement for de novo lipogenesis in cholangiocarcinoma and hepatocellular carcinoma of mice and humans. Hepatology 63, 1900–1913, doi: 10.1002/hep.28508 (2016). [DOI] [PMC free article] [PubMed] [Google Scholar]
- 43.Thomas AG et al. Kinetic characterization of ebselen, chelerythrine and apomorphine as glutaminase inhibitors. Biochem Biophys Res Commun 438, 243–248, doi: 10.1016/j.bbrc.2013.06.110 (2013). [DOI] [PMC free article] [PubMed] [Google Scholar]
- 44.Thangavelu K, Chong QY, Low BC & Sivaraman J. Structural basis for the active site inhibition mechanism of human kidney-type glutaminase (KGA). Sci Rep 4, 3827, doi: 10.1038/srep03827 (2014). [DOI] [PMC free article] [PubMed] [Google Scholar]
- 45.Rais R. et al. Discovery of 6-Diazo-5-oxo-l-norleucine (DON) Prodrugs with Enhanced CSF Delivery in Monkeys: A Potential Treatment for Glioblastoma. J Med Chem 59, 8621–8633, doi: 10.1021/acs.jmedchem.6b01069 (2016). [DOI] [PubMed] [Google Scholar]
- 46.Tenora L. et al. Tumor-Targeted Delivery of 6-Diazo-5-oxo-l-norleucine (DON) Using Substituted Acetylated Lysine Prodrugs. J Med Chem 62, 3524–3538, doi: 10.1021/acs.jmedchem.8b02009 (2019). [DOI] [PMC free article] [PubMed] [Google Scholar]
- 47.Gravel SP et al. Serine deprivation enhances antineoplastic activity of biguanides. Cancer Res 74, 7521–7533, doi: 10.1158/0008-5472.CAN-14-2643-T (2014). [DOI] [PubMed] [Google Scholar]
- 48.Mullarky E. et al. Identification of a small molecule inhibitor of 3-phosphoglycerate dehydrogenase to target serine biosynthesis in cancers. Proc Natl Acad Sci U S A 113, 1778–1783, doi: 10.1073/pnas.1521548113 (2016). [DOI] [PMC free article] [PubMed] [Google Scholar]
- 49.Sullivan MR et al. Increased Serine Synthesis Provides an Advantage for Tumors Arising in Tissues Where Serine Levels Are Limiting. Cell Metab 29, 1410–1421 e1414, doi: 10.1016/j.cmet.2019.02.015 (2019). [DOI] [PMC free article] [PubMed] [Google Scholar]
- 50.Patel M. et al. Report of a first-in-human study of the first-in-class fatty acid synthase (FASN) inhibitor TVB-2640. Cancer Res 75 (15 Supplement), doi: 10.1158/1538-7445.AM2015-CT203 (2015). [DOI] [Google Scholar]
- 51.Pascual G. et al. Targeting metastasis-initiating cells through the fatty acid receptor CD36. Nature 541, 41–45, doi: 10.1038/nature20791 (2017). [DOI] [PubMed] [Google Scholar]
- 52.Chlebowski RT et al. Association of Low-Fat Dietary Pattern With Breast Cancer Overall Survival: A Secondary Analysis of the Women’s Health Initiative Randomized Clinical Trial. JAMA Oncol 4, e181212, doi: 10.1001/jamaoncol.2018.1212 (2018). [DOI] [PMC free article] [PubMed] [Google Scholar]
- 53.Purwaha P, Silva LP, Hawke DH, Weinstein JN & Lorenzi PL An artifact in LC-MS/MS measurement of glutamine and glutamic acid: in-source cyclization to pyroglutamic acid. Anal Chem 86, 5633–5637, doi: 10.1021/ac501451v (2014). [DOI] [PMC free article] [PubMed] [Google Scholar]
- 54.Sellers K. et al. Metabolic reprogramming and Notch activity distinguish between non-small cell lung cancer subtypes. Br J Cancer 121, 51–64, doi: 10.1038/s41416-019-0464-z (2019). [DOI] [PMC free article] [PubMed] [Google Scholar]
Methods-only References
- 55.Mingote S. et al. Genetic Pharmacotherapy as an Early CNS Drug Development Strategy: Testing Glutaminase Inhibition for Schizophrenia Treatment in Adult Mice. Front Syst Neurosci 9, 165, doi: 10.3389/fnsys.2015.00165 (2015). [DOI] [PMC free article] [PubMed] [Google Scholar]
- 56.Schuler M, Dierich A, Chambon P & Metzger D. Efficient temporally controlled targeted somatic mutagenesis in hepatocytes of the mouse. Genesis 39, 167–172, doi: 10.1002/gene.20039 (2004). [DOI] [PubMed] [Google Scholar]
- 57.Srinivas S. et al. Cre reporter strains produced by targeted insertion of EYFP and ECFP into the ROSA26 locus. BMC Dev Biol 1, 4, doi: 10.1186/1471-213x-1-4 (2001). [DOI] [PMC free article] [PubMed] [Google Scholar]
- 58.Chow EK, Fan LL, Chen X & Bishop JM Oncogene-specific formation of chemoresistant murine hepatic cancer stem cells. Hepatology 56, 1331–1341, doi: 10.1002/hep.25776 (2012). [DOI] [PMC free article] [PubMed] [Google Scholar]
- 59.Tao J. et al. Distinct anti-oncogenic effect of various microRNAs in different mouse models of liver cancer. Oncotarget 6, 6977–6988, doi: 10.18632/oncotarget.3166 (2015). [DOI] [PMC free article] [PubMed] [Google Scholar]
- 60.Li Y, Choi PS, Casey SC & Felsher DW. Activation of Cre recombinase alone can induce complete tumor regression. PLoS One 9, e107589, doi: 10.1371/journal.pone.0107589 (2014). [DOI] [PMC free article] [PubMed] [Google Scholar]
- 61.Chakravarthy MV et al. “New” hepatic fat activates PPARalpha to maintain glucose, lipid, and cholesterol homeostasis. Cell Metab 1, 309–322, doi: 10.1016/j.cmet.2005.04.002 (2005). [DOI] [PubMed] [Google Scholar]
- 62.Marin-Valencia I. et al. Analysis of tumor metabolism reveals mitochondrial glucose oxidation in genetically diverse human glioblastomas in the mouse brain in vivo. Cell Metab 15, 827–837, doi: 10.1016/j.cmet.2012.05.001 (2012). [DOI] [PMC free article] [PubMed] [Google Scholar]
- 63.MacRae JI et al. Mitochondrial metabolism of sexual and asexual blood stages of the malaria parasite Plasmodium falciparum. BMC biology 11, 67, doi: 10.1186/1741-7007-11-67 (2013). [DOI] [PMC free article] [PubMed] [Google Scholar]
- 64.Zamboni N, Fendt SM, Ruhl M & Sauer U. (13)C-based metabolic flux analysis. Nature protocols 4, 878–892, doi: 10.1038/nprot.2009.58 (2009). [DOI] [PubMed] [Google Scholar]
- 65.Lewis IA, Schommer SC & Markley JL rNMR: open source software for identifying and quantifying metabolites in NMR spectra. Magn Reson Chem 47 Suppl 1, S123–126, doi: 10.1002/mrc.2526 (2009). [DOI] [PMC free article] [PubMed] [Google Scholar]
- 66.Sato T. et al. Single Lgr5 stem cells build crypt-villus structures in vitro without a mesenchymal niche. Nature 459, 262–265, doi: 10.1038/nature07935 (2009). [DOI] [PubMed] [Google Scholar]
- 67.Miyoshi H & Stappenbeck TS In vitro expansion and genetic modification of gastrointestinal stem cells in spheroid culture. Nature protocols 8, 2471–2482, doi: 10.1038/nprot.2013.153 (2013). [DOI] [PMC free article] [PubMed] [Google Scholar]
- 68.Cerami E. et al. The cBio cancer genomics portal: an open platform for exploring multidimensional cancer genomics data. Cancer Discov 2, 401–404, doi: 10.1158/2159-8290.CD-12-0095 (2012). [DOI] [PMC free article] [PubMed] [Google Scholar]
- 69.Gao J. et al. Integrative analysis of complex cancer genomics and clinical profiles using the cBioPortal. Sci Signal 6, pl1, doi: 10.1126/scisignal.2004088 (2013). [DOI] [PMC free article] [PubMed] [Google Scholar]
Associated Data
This section collects any data citations, data availability statements, or supplementary materials included in this article.
Supplementary Materials
Data Availability Statement
All the data that support the findings of this study are available from the corresponding author upon request. The microarray data have been deposited in Gene Expression Omnibus (GEO) under accession code GSE129013 (http://www.ncbi.nlm.nih.gov/geo).