

Abstract
This study explores the impact of Shelter‐in‐Place Orders (SIPOs) on health, with attention to heterogeneity in their impacts. First, using daily state‐level social distancing data, we document that adoption of a SIPO was associated with a 9%–10% increase in the rate at which state residents remained in their homes full‐time. Using daily state‐level coronavirus case data, we find that approximately 3 weeks following the adoption of a SIPO, cumulative COVID‐19 cases fell by approximately 53.5%. However, this average effect masks important heterogeneity across states‐early adopters and high population density states appear to reap larger benefits from their SIPOs. (JEL H75, I12, I18)
ABBREVIATIONS
- ARDS
Acute Respiratory Distress Syndrome
- CDC
Centers for Disease Control and Prevention
- SIPO
Shelter‐in‐Place Order
I. MOTIVATION
The SARS‐CoV‐2 virus, which causes the disease COVID‐19, has spread rapidly within the United States. The total number of confirmed cases in the United States on March 12, 2020 was 1,629 which grew to 18,747 confirmed cases within 7 days (Center for Disease Control and Prevention 2020). The primary strategy suggested by governments worldwide to reduce the spread of COVID‐19 is social distancing (Australian Government Department of Health. 2020; Public Health Agency of Canada 2020; Public Health England. 2020; White House 2020). As of April 2, 2020, over 90 countries worldwide, representing half of the world's population, have requested or ordered their citizens to stay at home (Sandford 2020). In the United States, the most common comprehensive social distancing policy adopted is a shelter‐in‐place order (SIPO). A state SIPO requires residents to remain in their homes for all but essential activities such as purchasing food or medicine, caring for others, exercise, or traveling for employment deemed essential.
The authority to issue SIPOs rests with state and local officials. While agencies of the Federal government (i.e., the Centers for Disease Control and Prevention [CDC]) or the Executive Branch can make recommendations on social distancing to state and local officials, the authority to place a state under a SIPO is left to its governor. In some cases, sub‐state local jurisdictions, that is, counties, cities, and townships, also have the authority to issue SIPOs through orders from mayors, County Public Health Department officials, and other local government entities. 1
The first statewide SIPO was announced by Governor Gavin Newsom of California on March 19, 2020. Following the adoption of the California order, between March 20, 2020 and April 19, 2020, 39 additional states and the District of Columbia enacted similar statewide SIPOs. 2
Enforcement of SIPOs is handled at the local level via law enforcement agencies (Caswell 2020; Francassa 2020; Napoleon 2020), although warnings for failure to comply with a SIPO are very common for first offenses (Barr 2020). However, in contrast to a shelter‐in‐place advisory (Commonwealth of Massachusetts 2020) or a gubernatorial recommendation (Herbert 2020), SIPOs have the weight of state law behind them. Violating a SIPO is considered a misdemeanor (Allday 2020; Martineau 2020). Punishments vary from state to state, but generally take the form of a fine or, if repeated, a prison term. For example, in Maryland, those who willfully violate the state's SIPO are subject to a fine of $5,000 and up to 1 year of imprisonment (Maryland Executive Order 20‐03‐30‐01 2020). To take another example, in Minnesota, individuals are subject to fines up to $1,000, and imprisonment for no more than 90 days (Minnesota Executive Order 20‐20 2020). Still, social pressures appear to play a very important role in SIPO compliance (Ronayne and Thompson 2020). 3
Numerous reports from national, state, and local media sources suggest a substantial reduction in public gatherings following SIPOs (Fry 2020; Herrman 2020) as well as business closings (Arnold 2020; Cox 2020; U.S. Department of Labor 2020). However, these associations may be explained in whole, or in part, by voluntary social distancing in response to health knowledge that predated and, perhaps, drove SIPO adoption. Emerging evidence by economists that has sought to isolate the causal impact of SIPOs on social distancing points to modest short‐run effects from statewide orders (Abouk and Heydari 2020; Friedson et al. 2020; Sears et al. 2020).
A rapidly emerging literature has begun to study the short‐run health effects of SIPOs. Friedson et al. (2020) focus specifically on California, which enacted the nation's first SIPO. Using a synthetic control approach, and a variety of matching strategies, Friedson et al. (2020) find that California's SIPO was associated with approximately 155.9 to 180.8 fewer COVID‐19 cases per 100,000 following the policy's first month of enactment. To put their estimates in context of SIPO‐related economic costs, they suggest that California's SIPO caused approximately 600 job losses per life saved.
While understanding the experience in a single state is important, the findings of work such as Friedson et al. (2020) may not generalize to jurisdictions with different population or outbreak characteristics. For example, California is an outlier, both as an early SIPO adopter and as a highly urbanized state with extraordinarily low COVID‐19 case growth at the time of SIPO adoption. Given that an additional 40 states (including D.C.) adopted statewide SIPOs following California's enactment, understanding both the average effect of SIPOs and the heterogeneity of their impact based on the characteristics of the target location is of primary policy importance. Moreover, the recent resurgence of new COVID‐19 cases has compelled many states to suspend or push back their reopening plans. As states are again making decisions on whether to re‐impose social distancing orders and re‐issue mandates for shutting down nonessential businesses, it is critical for policy‐makers to have information on the effectiveness of these policies and the conditions under which they are effective. We provide some of the first evidence on these questions in this study.
First, using daily state‐level measures of social mobility from SafeGraph, Inc., we document that statewide SIPOs were associated with a 9%–10% increase (relative to the pre‐treatment period) in the share of the population that sheltered in place completely on any given day. This treatment‐control differential increases during the first week following SIPO adoption and then remains constant or slightly declines. Next, turning to COVID‐19, difference‐in‐differences estimates show that the adoption of a SIPO had little effect on COVID‐19 cases during the 5 days following its enactment, corresponding to the median incubation period. However, after the incubation period, and intensifying rapidly 3 weeks or more after the policy's adoption, SIPO adoption is associated with an approximate 53.5% decline in COVID‐19 cases. Approximately weeks following SIPO adoption, this corresponds to approximately 3,073 fewer cumulative COVID‐19 cases for the average SIPO‐adopting state. 4 Evidence from event study analyses is consistent with common pre‐treatment trends. Our results persist when we (a) drop California from our panel, confirming that we are not simply replicating Friedson et al. (2020), and (b) when we control for state‐specific growth in COVID‐19 testing, which could affect the number of reported coronavirus cases. While statewide SIPOs were negatively related to coronavirus‐related deaths, estimated mortality effects were imprecisely estimated.
Importantly, we find that the impact of the average state SIPO masks important state‐level heterogeneity. The earliest adopters of statewide SIPOs saw the largest declines in the rate of coronavirus cases, including declines in the rate of COVID‐19‐related mortality. In addition, more densely populated states also appear to reap relatively larger health benefits from their SIPOs. 5 Consistent with these larger health impacts, we find that statewide SIPOs are far more effective at increasing social distancing among early adopting states and states with higher population densities. We conclude that there are important heterogeneous health impacts of statewide SIPOs across states and adoption time.
II. BACKGROUND
After being detected in Wuhan, China, in December 2019, the first confirmed case of COVID‐19 in the United States was identified on January 20, 2020 in Washington State. 6 The disease spread exponentially over the next 3 months across the United States, with confirmed cases at 778,328 as of April 20, 2020, accounting for 32% of the global caseload. Public health interventions to flatten this growth trajectory have mobilized around two complementary sets of policy responses. 7 Surveillance‐based initiatives, such as expanding COVID‐19 testing capacity and deploying antibody tests, seek to monitor the spread and intensity of the disease. 8 These efforts can be instrumental in identifying infected persons, and tracing and monitoring their contacts to limit further spread of the virus. In addition, mitigation and suppression policies aim at lowering the reproduction rate of the virus and slowing its spread by limiting interactions between individuals in the community and increasing social distancing. Components of such a response include SIPOs, closures of educational facilities, restrictions on mass gatherings, and closure of business and nonessential services.
Given that the authority for imposing sheltering‐at‐home orders and school or businesses closures rests with states and localities, the Federal response has focused on (a) providing funding to states to bolster preparedness and healthcare capacity, and (b) surveillance‐based policies aimed at expanding testing and tracking infection rates. Some suppression efforts have also included travel restrictions to limit infections from international exposure. For example, on January 31, 2020, the Trump administration enacted restrictions on all foreign nationals who had been in China over the past 14 days from entering the United States. Then, following a surge in COVID‐19 related deaths, the administration suspended travel from the Schengen Area to the United States starting on March 13, which was further extended to include United Kingdom and Ireland 3 days later. 9 A global health advisory, advising U.S. citizens to avoid all international travel, was issued by the State Department on March 31. Also, the CDC has issued further guidelines for social distancing and personal protective measures (face covering, hand‐washing, etc.) as part of a broader strategy for community mitigation while awaiting a vaccine or effective treatment.
A flurry of responses at the state and local levels also ensued. At the local level, one of the first actions taken by many jurisdictions was to declare a state of emergency, which typically frees up the state's office of emergency management to deploy resources to localities for immediate assistance. 10 The power for imposing the strongest mitigation and suppression policies lies with state and local authorities. Consequently, following the declaration of emergency, many states and jurisdictions started closing schools and shutting down nonessential businesses and services.
The first SIPO was simultaneously imposed by health authorities on March 17, in the San Francisco Bay Area (Alameda, Contra Costa, Marin, San Mateo, and Santa Clara counties, and the cities of San Francisco and Berkeley). Two days later, on March 19, 2020, Governor Gavin Newsom ordered the first statewide SIPO in California. Following CA's SIPO, 39 states and D.C. issued SIPOs of their own. 11 In addition, several cities and counties issued their own shelter‐in‐home order even if there was no statewide order; for instance, as of April 20, 2020, more than 50% of the population in Utah is covered under orders issued by Davis county, Salt Lake county, and Summit county despite no statewide order in place.
Transmission of COVID‐19 is presently believed to occur via respiratory droplets, usually emitted during coughing, sneezing, or nose‐blowing (Centers for Disease Control and Prevention 2020a; World Health Organization 2020a, 2020b, 2020c) and possibly also through normal breathing function in close proximity to an infected person (Fineberg 2020). In light of this, the primary pathway through which a SIPO can potentially mitigate and suppress the spread of COVID‐19 is by restraining close contact between persons. If SIPOs effectively promote greater social distancing, then this should translate into a reduction in the number of reported cases and deaths as disease transmission slows. 12 However, reductions in new cases and deaths should occur with a lag given that the incubation period for COVID‐19 is 2–14 days (Centers for Disease Control and Prevention 2020b; Li et al. 2020) 13 and time from first symptoms to acute respiratory distress syndrome (ARDS), which is strongly associated with mortality from COVID‐19, may take up to an additional 8 days (Wang et al. 2020; Wu et al. 2020; Zhou et al. 2020). 14
Other indirect behavioral pathways may also explain a link between SIPOs and coronavirus‐related cases and deaths. For instance, SIPOs may affect confirmed cases by affecting selection into testing. Attempting to comply with the stay‐at‐home order or because of fear of getting exposed at medical facilities, infected persons who are unaware of their status may choose not to seek out medical care. Conditional on infection, SIPOs may also affect coronavirus‐related mortality by reducing the demand for nonessential or elective medical procedures, thereby freeing up resources for care of COVID‐19 patients.
This discussion underscores several key points that guide our empirical analyses. First, the incubation period for the virus and the lag from presentation of symptoms to ARDS imply important dynamics. SIPOs would not be expected to immediately dampen the growth curve given these dynamics, and strong effects may take some time to materialize (>5 days for cases, and perhaps at least 14 days for deaths). Second, given that the effectiveness of SIPOs is driven by an increase in social distancing, this effectiveness may be moderated by factors such as urbanicity and population density that play in integral role in the spread of infections across communities. In other words, urbanicity and population density may serve as multipliers which can enhance the efficacy of a given level of social distancing. Third, given the exponential progression of infections, the effects of social distancing may magnify and accelerate over time if enacted early (Florida 2020; Friedson et al. 2020). This suggests that health benefits of SIPOs can vary depending on whether they were enacted early or late during the outbreak cycle. Our study provides among the first national evidence on the effectiveness of statewide shelter‐in‐home orders in promoting social distancing, in decreasing infection rates and coronavirus‐related deaths, and potential heterogeneity in the response based on timing of enactment and state characteristics.
III. DATA AND METHODS
A. Social Mobility Data
We begin our analysis by examining whether SIPOs affect social mobility, drawing daily state‐level data on social distancing for the period March 8, 2020 to April 17, 2020 from SafeGraph, Inc. For our analysis, we leverage this firm's anonymized population movement dataset representing 45 million smartphone devices that have opted into location tracking. These data have recently been used by the CDC to gather information on the degree to which social distancing has been practiced by individuals in the United States following the COVID‐19 outbreak (Lasry et al. 2020). From these data we collect a state‐by‐day measure of the percent of the state population who remain at home for the entire day. Specifically, this shelter‐in‐place index is the percentage point change in the number of cell phones staying at home relative to the baseline of February 6, 2020 through February 12, 2020. 15
A person's home is defined as a 153‐m by 153‐m area that receives the most frequent GPS pings during the overnight hours of 6 p.m. to 7 a.m. over a 6‐week period.
While this measure of social distancing is imperfect—for instance, it does not capture whether an individual engages in social distancing while outside the home or if someone works at night—it is plausible to expect that having a higher percentage of the population who is “fully” sheltering in place is positively correlated with rates of social distancing. Given that our focus is on changes within states over time, any measurement error introduced in these measures cross‐spatially will not affect our results. As the data are based on smartphone users, they are not representative of the population that does not own smartphones. 16
Over our sample period, 35.7% of the population reported staying at home at all times (see Appendix Table 1, Supporting information). On average, 42.3% of individuals stayed at home on days when a state had a SIPO in place. This compares to 28.7% on state‐days when a SIPO was not in effect.
B. Coronavirus Case and Mortality Data
Turning to our main analysis, we draw a panel of state‐specific daily counts of COVID‐19 cases from March 8, 2020 through April 20, 2020. These data are collected from state and county‐level health agencies and made public by the New York Times. 17 By April 20, 2020 there were a total of 778,328 positive screenings for COVID‐19 in the United States. In Appendix Table 2, we show the day on which the first confirmed reported coronavirus case (and death) occurred in each state. The first known confirmed case was in Washington on January 20 followed by Illinois on January 24, although scientific knowledge on initial coronavirus arrival in the United States is evolving and earlier cases may yet be discovered. The state with the last initial case of reported coronavirus was West Virginia on March 17. Deaths followed a similar pattern, with a lag, as expected from the coronavirus's incubation period (Lauer et al. 2020) and time from first symptom to ARDS (Wang et al. 2020). In Appendix Table 1, we show that the mean rate of coronavirus cases per 100,000 population over our analysis period was 45.9.
Figure 1 shows state‐specific coronavirus case growth over our sample window. New York and New Jersey are clear outliers, on case growth trends that are higher than any other state. Over our sample period, the average increase in cases per 100,000 was about 8 times higher in New York and New Jersey as compared to the other 49 states (26.9 daily cases per 100,000 vs. 3.4 per 100,000). This is owed to the spread of COVID‐19 in the high population density cities of New York City, Newark, and Jersey City (Rosenthal 2020; Warren 2020).
FIGURE 1.
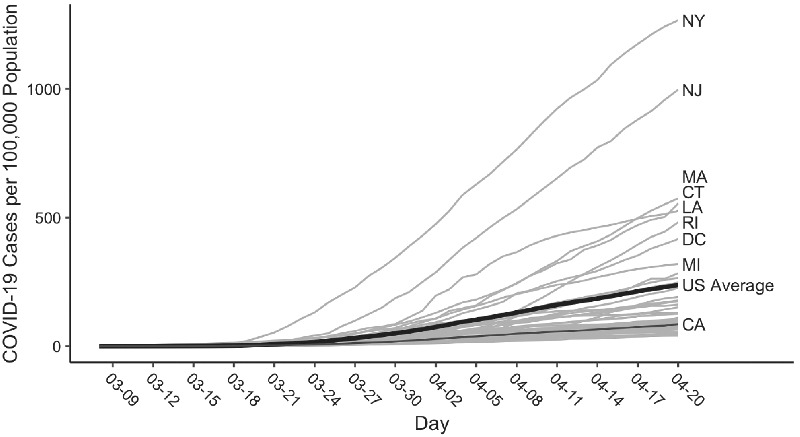
Total Cases by State and Day
Figure 2 and Appendix Table 2 describe coronavirus‐related mortality from March 8 through April 20. The average COVID‐19 death rate was 1.6 per 100,000 population. Figure 2 suggests a delay in the growth of deaths, as compared to cases. Total deaths did not start rising (even in New York and New Jersey) until late March or early April. This lag is consistent with the time period from infection to death.
FIGURE 2.
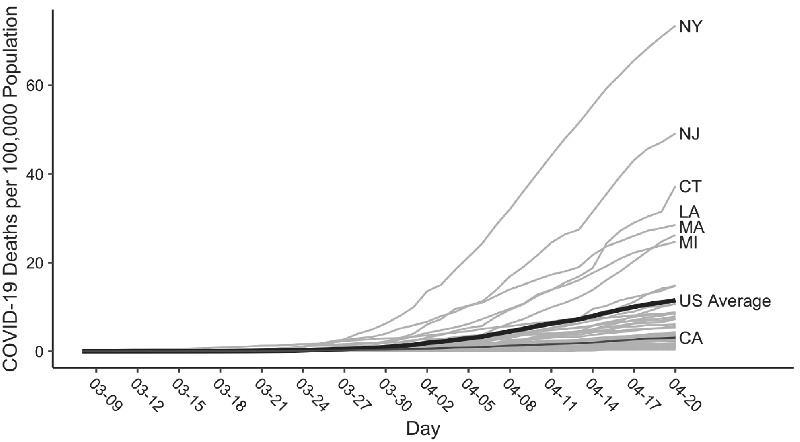
Total Deaths by State and Day
C. Shelter‐in‐Place Orders
We collect statewide SIPOs from Mervosh, Lu, and Swales (2020) as well as from our own search of state orders. 18 Table 1 lists the set of SIPOs enacted over our sample period and Appendix Figure 1A (Supporting information) shows maps depicting the geographic and temporal adoption of SIPOs. California was the first state to adopt a shelter in place order on March 19, 2020. Following California, the first cluster of states to adopt SIPOs was in the Midwest and parts of the Northeast, as well as Louisiana. Notably, many of these states were also in the midst of COVID‐19 outbreaks during that time. Later adopters of SIPOs were largely concentrated in the mid‐Atlantic and upper Midwest.
TABLE 1.
Enactment Dates of Statewide SIPOs
| State | Date | State | Date |
|---|---|---|---|
| Alabama | April 4 | Mississippi | April 3 |
| Alaska | March 28 | Missouri | April 6 |
| Arizona | March 31 | Montana | March 28 |
| California | March 19 | Nevada | April 1 |
| Colorado | March 26 | New Hampshire | March 28 |
| Connecticut | March 23 | New Jersey | March 21 |
| Delaware | March 24 | New Mexico | March 24 |
| District of Columbia | April 1 | New York | March 22 |
| Florida | April 3 | North Carolina | March 30 |
| Georgia | April 3 | Ohio | March 24 |
| Hawaii | March 25 | Oregon | March 23 |
| Idaho | March 25 | Pennsylvania | April 1 |
| Illinois | March 21 | Rhode Island | March 28 |
| Indiana | March 25 | South Carolina | April 7 |
| Kansas | March 30 | Tennessee | April 1 |
| Louisiana | March 23 | Texas | April 2 |
| Maine | April 2 | Vermont | March 25 |
| Maryland | March 30 | Virginia | March 30 |
| Michigan | March 24 | Washington | March 23 |
| Minnesota | March 28 | West Virginia | March 24 |
| Wisconsin | March 25 |
Notes: Indiana, Minnesota, New Hampshire, and Ohio implemented a statewide SIPO at 11:59 p.m. on March 24, March 27, March 27, and March 23 respectively. We code each state's SIPO as being effective the minute following its effective time. In Massachusetts, instead of a formal order, Gov. Charlie Baker issued a “Stay at Home Advisory,” which we treated as a non‐SIPO.
Source: Mervosh, Lu, and Swales (2020) and the authors' own searches of state executive orders.
As of April 20, 2020, 40 states and the District of Columbia had adopted statewide SIPOs. Among those states who had not adopted a SIPO, 6 had adopted some limited shutdown orders that fell short of full SIPOs, including mandates to close nonessential businesses (Arkansas, Iowa, Kentucky, Massachusetts, 19 North Dakota, and Wyoming), and more narrowly targeted SIPOs, which apply only to elderly individuals and those with underlying health conditions (Kentucky and Oklahoma). Only Nebraska, South Dakota, and Utah had not adopted a SIPO, a limited shutdown order, or a targeted SIPO. 20
D. Methods
For our main analyses we use a difference‐in‐differences (DD) design to estimate the association between state SIPOs and COVID‐19 cases. Specifically, we estimate:
| (1) |
where ln (COVIDCASE st ) is the natural log of the count of COVID‐19 cases in state s on day t, SIPO_0to5 st is an indicator set equal to 1 for the period 0–5 days following a SIPO's adoption, SIPO_6to9 st an analogous indicator for the period 6–9 days following adoption, SIPO_10to14 st similarly indicating a period of 10–14 days following adoption, SIPO_15to19 st is also an analogous indicator for the period 15–19 days following adoption, and SIPO_20plus st is a final analogous indicator for 20 or more days following adoption. We are particularly interested in the periods (a) 6–14 days following adoption and (b) two or more weeks following adoption, as these represent the periods following the median and 99th percentile thresholds, respectively, in the incubation window for COVID‐19 (Lauer et al. 2020). 21
With regard to control variables, PARTORDER st is an indicator for whether at least 50% of the state population were covered by a local SIPO, LIMITORDER st is an indicator for whether a nonessential business closure was adopted, or a state enacted statewide SIPO for elderly individuals or those with underlying health conditions, TRAVEL st is an indicator for whether a state required visitors or residents to self‐quarantine for 14‐days upon visiting or returning to the state, EMERG st is an indicator for whether the Federal government had declared the state a major disaster area due to the coronavirus crisis, TEMP st denotes the average high temperature in the state, and PRECIP st is an indicator for whether measurable precipitation had fallen in the state. 22
In addition, α s is a set of state fixed effects to control for fixed differences across states in COVID‐19 infections due to, for example, baseline hospital capacity differences, population density, the presence of an important airport hub, or baseline testing capacity; γ t is a set of day fixed effects to control for national factors that commonly affect state COVID‐19 infections such as national travel restrictions, announcement of Federal guidelines, expansion of COVID‐19 testing capacity, general awareness and proliferation of concern regarding COVID‐19, or important news pronouncements by National Institutes of Health Infectious Diseases Head Anthony Fauci.
Finally, we include controls, α s * t, for state‐specific linear time trends to capture any unmeasured state‐level time trends that could be coincidentally associated with the timing of a state coronavirus outbreak and SIPO adoption. Importantly, the state trends help to account for unobserved factors driving the exponential growth trajectory of transmissions, and our effects would be identified off deviations from this trend growth. State‐specific linear trends have some drawbacks, mainly that they might also soak up time‐varying treatment effects (Goodman‐Bacon 2018; Lee and Solon 2011). However, we view this as a reasonable tradeoff to make in order to establish event studies which satisfy the common pre‐trends assumption for difference‐in‐differences models, and we view our estimates as a lower bound on the treatment effect. We also report results controlling for census region‐ or census division‐specific day effects to account for common unmeasured spatial shocks and treatment state‐specific pre‐policy trends.
Identification of our key coefficients of interest, β 1 to β 5, comes from within‐state variation in SIPO adoption. Over the period under study, 40 states and the District of Columbia adopted SIPOs (see Table 1). It is important to note that our estimates of β 1 to β 5 capture the impact of the SIPO itself over and above any impacts from general increases in social distancing and avoidance behaviors common to treated and untreated states.
In a standard difference‐in‐differences research design that is capitalizing on the treatment turning on at different times, as with the differential timing of SIPO adoption across states and over time, Goodman‐Bacon (2018) shows that the treatment effect is a weighted average of all possible two‐group and two‐period DD estimators. In other words, the main DD treatment effect is identified off many “mini” experiments comparing: (a) early‐ and late‐adopting states with never‐adopting states as controls; (b) early‐adopting states with late‐adopting states as controls; and (c) late‐adopting states with early‐adopting states as controls. In the presence of dynamic treatment effects, using early adopters as a control for the treated later adopters may underestimate the treatment effect. This is because the trajectory of the early‐adopting states, at the time when the late‐adopting states enact their own SIPOs, is still being affected by the policy (that is, by the SIPOs in the early‐adopting states).
In this context, Goodman‐Bacon (2018) suggests that it may be better to compare treated early adopters with yet untreated later adopters or never adopters, and compare treated later adopters with never adopters. At the same time, however, specifically when it comes to SIPOs, nonadopting states may be different than states that issue such an order. 23 This suggests that it may also be important draw on variation just among the ever‐adopters, excluding the never adopters from contributing any identifying variation.
These considerations guide our main analyses and supplementary checks. In order to assess the sensitivity of our estimates to these different sources of timing‐based identification, we draw on subsets of the treated cohorts to identify our effects—essentially validating that our effects are not driven by utilizing one particular cohort of states as a counterfactual. While the general issues outlined are valuable in thinking about which groups are identifying the effects, and which groups may be potentially problematic, event studies help to assess and alleviate some of these concerns of bias in a standard difference‐in‐differences analysis.
In light of this, we place an added focus on flexible event study formulations. We augment Equation (1) to estimate separate lead coefficients associated with windows spanning 1–2 days prior to SIPO adoption, 3–4 days pre‐adoption, 5–6 days pre‐adoption, and 7 or more days pre‐adoption. Event studies, because they rely on different states turning on and off as treated versus control for different leads and lags, are more sensitive in manifesting through the lead effects any issues with problematic controls. In the context of somewhat tricky timing‐based identification and potentially strong dynamic effects, flat pre‐trends in the event study analysis become an important signal of the presence (or lack thereof) of these issues. 24 We are careful in assessing the pre‐policy trends and accounting for potentially unmeasured time‐varying shocks that may be correlated with policy adoption.
In order to produce unbiased estimates of the effects of SIPOs on social distancing and COVID‐19‐related health, the common trends assumption must be satisfied. Threats to identification include (a) state‐specific time‐varying unobservables correlated with SIPO‐adoption and the outcomes under study, and (b) policy endogeneity, whereby social distancing trends or trends in COVID‐case or death growth induce the adoption of SIPOs.
We take a number of tacks to address each threat. With regard to state‐specific time‐varying unmeasured heterogeneity, one important concern is that changes in COVID‐19 testing may conflate the effects of SIPOs on COVID‐19 cases. To address this issue, we measure data on testing from the COVID Tracking Project, compiled by The Atlantic and Related Sciences from state public health authorities. 25 The variable TESTS st measures the cumulative number of COVID‐19 tests conducted in state s on day t. We then explore (a) whether SIPOs are associated with changes in log testing rates, and (b) how the estimated coefficient β 1 changes when we control for state‐specific changes in testing.
To take another example, it may be that other unobserved COVID‐related policies or voluntary behaviors are both related to SIPO adoption and impact social distancing or COVID‐related health. 26 To address this possibility we (a) partial out other state COVID policies that may be contemporaneously adopted, and (b) control for state‐specific linear time trends, which capture any state‐specific unobservables that trend linearly that may include voluntary tastes for social distancing or heterogeneous infection growth across states.
Endogenous adoption of SIPOs is an important concern. For instance, some jurisdictions may adopt SIPOs in response to a noticeably accelerating COVID‐19 outbreak. While controlling for state‐specific time trends is one important way to ameliorate the possibility of policy endogeneity leading to biased estimates, the event study analysis further allows us to examine and address whether pre‐treatment COVID‐19 case trends were common across jurisdictions.
To explore the association between statewide SIPOs and COVID‐19‐related deaths, we turn to a negative binomial model. As can be gleaned from Appendix Table 2, approximately 27% of state‐days in our sample had a death count of zero. Thus, we estimate a negative binomial model of the following form:
| (2) |
where COVIDDEATH st is the count of COVID‐19 related deaths in state s on day t. We include the same controls as model (1) and use state‐level population as an exposure measure. In addition, we also utilize a Tobit regression model and Poisson regression model and find results that are qualitatively similar. 27
All regressions described above are weighted using the state population and standard errors are corrected for clustering at the state‐level (Bertrand, Duflo, and Mullainathan 2004).
IV. RESULTS
A. Statewide SIPO and Social Distancing
We begin by examining the effect of statewide SIPOs on social distancing. Table 2 presents estimates of the relationship between state SIPOs and the percent of individuals who stayed at home throughout the day. In our most parsimonious specification, which includes state fixed effects, and day fixed effects we find that the enactment of a SIPO is associated with a 2.1 percentage‐point increase in stay‐at‐home rate. 28 Column 2 adds controls for state linear trends (to account for potential differential voluntary social distancing in the pre‐treatment period). The estimate is largely unchanged, indicating that the enactment of a SIPO is associated with a 2.2 percentage‐point increase in staying at home. This marginal effect represents a 9.4% increase relative to the mean pre‐treatment stay‐at‐home rate among future SIPO‐adopting states.
TABLE 2.
Difference‐in‐Difference Estimates of the Effect of SIPOs on Percent of State Residents Who Remain at Home Full‐Time
| (1) | (2) | (3) | (4) | (5) | (6) | (7) | |
|---|---|---|---|---|---|---|---|
| Panel I: SIPO effect | |||||||
| SIPO | 2.075*** | 2.181*** | 2.264*** | 2.200*** | 2.129*** | 1.986*** | 1.995*** |
| (0.433) | (0.351) | (0.339) | (0.291) | (0.282) | (0.381) | (0.312) | |
| Panel II: Lagged SIPO effect | |||||||
| 0–5 days after SIPO | 1.935*** | 1.731*** | 1.898*** | 1.885*** | 1.795*** | 1.529*** | 1.688*** |
| (0.498) | (0.382) | (0.405) | (0.359) | (0.325) | (0.355) | (0.395) | |
| 6–9 days after SIPO | 3.287*** | 2.538*** | 2.787*** | 2.849*** | 2.686*** | 2.562*** | 2.463*** |
| (0.705) | (0.490) | (0.485) | (0.400) | (0.349) | (0.473) | (0.400) | |
| 10–14 days after SIPO | 3.283*** | 1.837*** | 2.125*** | 2.241*** | 2.087*** | 1.852*** | 1.822*** |
| (0.917) | (0.630) | (0.616) | (0.529) | (0.407) | (0.588) | (0.496) | |
| 15–19 days after SIPO | 3.877*** | 1.423* | 1.771** | 1.911** | 1.728*** | 1.346* | 1.550** |
| (1.164) | (0.837) | (0.827) | (0.744) | (0.542) | (0.695) | (0.695) | |
| 20 days or more after SIPO | 5.364*** | 0.836 | 1.269 | 1.468 | 1.289 | 0.917 | 1.259 |
| (1.569) | (1.305) | (1.279) | (1.215) | (0.906) | (0.843) | (1.118) | |
| N | 2,091 | 2,091 | 2,091 | 2,091 | 2,091 | 2,091 | 2,050 |
| State and day fixed effects | Yes | Yes | Yes | Yes | Yes | Yes | Yes |
| State specific linear time trend | No | Yes | Yes | Yes | Yes | Yes | Yes |
| Business closure order and partial SIPOs | No | No | Yes | Yes | Yes | Yes | Yes |
| Travel restrictions and disaster declaration | No | No | No | Yes | Yes | Yes | Yes |
| Weather controls | No | No | No | No | Yes | Yes | Yes |
| CA included? | Yes | Yes | Yes | Yes | Yes | No | Yes |
| NY and NJ included? | Yes | Yes | Yes | Yes | Yes | Yes | No |
Notes: A business closure order is an indicator for whether the state had issued a nonessential business closure order (that fell short of a SIPO). Partial SIPOs include a targeted SIPO for older individuals or those with underlying health conditions and an indicator for whether coverage of local (i.e., city or county) SIPO orders covered at least 50% of the state population. A travel restriction is an indicator for whether the state had issued restrictions on travel to or from the state. A major disaster declaration is an indicator for whether the state had received a major disaster emergency declaration from the Federal government. Finally, weather controls include the average temperature (in degrees Celsius) in the state and an indicator for whether measurable precipitation fell in the state. All models include state fixed effects and day fixed effects. Standard errors, clustered at the state‐level, are reported in parenthesis. *Significant at the 10% level; **significant at the 5% level; ***significant at the 1% level.
Event study analyses shown in Figure 3 suggest an interesting pattern of results. While there is some indication of a weak positive differential trend in the pre‐treatment period, consistent with somewhat faster growth in voluntary social distancing in SIPO states relative to non‐SIPO states, there was a sharp and steep relative increase in stay‐at‐home rates in treatment versus control states in the week following the policy's adoption. We interpret these findings as evidence that the SIPO had an important short‐run impact on social distancing.
FIGURE 3.
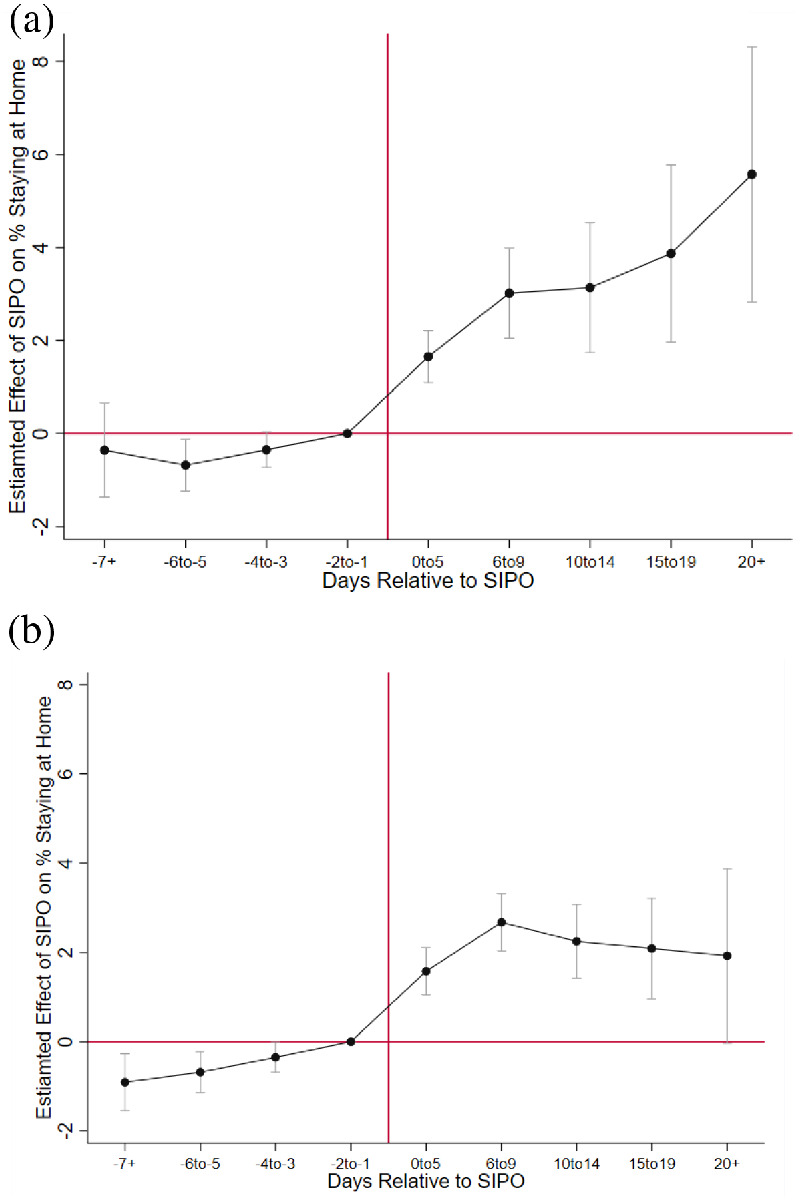
Event‐Study Analysis of Shelter in Place Orders (SIPOs) and Percent Staying at Home Full‐Time Notes: (A) Two‐way fixed effect model. (B) Model with state specific linear time trend. Estimates are obtained using weighted least squares regression. The model includes controls for state fixed effects, day fixed effects, and the controls listed in Appendix Table 1 Supporting information. Standard errors are clustered at the state level. Bars on point estimates represent 95 percent confidence intervals.
In panel a, which excludes the state linear trends, the increase in stay‐at‐home behavior continues to magnify over the post‐treatment period. In panel b, however, which accounts for state trends, following the first week after SIPO enactment, the stay‐at‐home differential between treatment and control states experienced a slight decline before leveling off. This result can be interpreted in several ways. First, the finding could suggest that residents become complacent over time and reverted back to usual habits. Such an effect could have been exacerbated by “cabin fever,” a belief that a week was sufficient time for a SIPO to have worked, or diminishing marginal utility (or perhaps disutility) of family time such that facing the expected risk of coronavirus is rationally preferred to staying at home. However, trends in the percent of individuals sheltering‐at‐home are positive throughout the sample period for the SIPO adopting states, and do not indicate an absolute decline in such social distancing behaviors. Second, a SIPO might have led to short‐run panic, including an overestimation of the risk of serious COVID‐19 illness. Additional time to overcome the negative emotional shock of being ordered to shelter in place, along with gathering of more health information, may have led to a more accurate assessment of risk of contracting serious illness from venturing outside of one's home. Third, those who were sheltering in place full‐time may have learned appropriate precautions to take to increase safety while venturing away from their residences.
Of course, the explanation could also reflect factors other than behavioral responses by residents of SIPO‐adopting states. For instance, a lagged increase or catch‐up in voluntary social distancing by those in control states, perhaps in response to widespread SIPO adoption in other states or general proliferation of awareness and concern regarding COVID‐19, may have led to greater convergence in rates of staying at home. 29 Consistent with this explanation, Sears et al. (2020) find that mobility, travel behavior, and social interactions had declined considerably by the time states were implementing stay‐at‐home orders, although these orders also modified travel behaviors further and led to additional declines in mobility and interactions. It is important to note, however, that even if SIPOs merely accelerated sheltering in place in treated versus untreated states, and both sets of states achieved the same level of social distancing eventually, there may be meaningful benefits to SIPO‐adoption in the longer term by slowing spread of the illness earlier in the outbreak cycle.
Next, we test the sensitivity of our estimates to controls for other predictors of social distancing. Specifically, we include controls for other COVID‐19 orders (column 3), travel restrictions, disaster declaration (column 4), and weather controls (column 5). It is validating that the results remain largely unchanged. We find consistent evidence of a 2.1–2.3 percentage‐point increase in stay‐at‐home rates, representing daily increases in social distancing of about 9.3–10% relative to the mean stay‐at‐home rate. These findings are largely consistent with those of Friedson et al. (2020) and Sears et al. (2020). 30
The dynamics of the SIPO effects on stay‐at‐home behaviors, presented in panel II, confirm the pattern evident in the event study analysis (Figure 3). We find strong significant effects in sheltering‐in‐place full time within 14 days post‐adoption, with effect magnitudes representing an 8–13% increase. The effect sizes slightly diminish after this point, reflecting an increase in voluntary social distancing in the control states, although the differential for the treated states remains positive throughout the post‐treatment period and statistically significant up to 19 days following the adoption of a SIPO.
Together, our findings thus far suggest that SIPOs were effective, particularly in the short term, in encouraging residents to stay at home. 31 But are our difference‐in‐differences findings simply a replication of Friedson et al.'s (2020) results on the stay‐at‐home effects of California's SIPO? In column 6, we drop California from our analysis sample. While the magnitude of the estimated SIPO effect declines to 2.0, it remains statistically distinguishable from zero at conventional levels. Moreover, we cannot reject the null hypothesis that the coefficients reported in columns 5 and 6 are statistically equivalent.
Finally, in column 7, we drop New York and New Jersey from the analysis sample. These states are outliers with respect to both COVID‐19 case levels and annual growth rates, owed to outbreaks in the high‐population density cities of New York City and Jersey City. From March 8 through April 20, the average daily increase in COVID‐19 cases per 100,000 population was around 8 times higher in New York and New Jersey as compared to the remaining 49 (26.9 daily cases per 100,000 population vs. 3.4 daily cases per 100,000 population). In addition, these states were also early adopters of SIPOs, perhaps in response to the gathering storm of outbreak. When we drop these states from our sample, the estimated effect of SIPO adoption on stay‐at‐home rates is unchanged.
B. Statewide SIPOs and COVID‐19 Cases
We begin our coronavirus case analysis with a sample including 48 states and the District of Columbia, excluding the two states on a very different case growth trajectory, New York and New Jersey. However, we will return to these states shortly.
Event study analyses of COVID‐19 cases are visually presented in panels A and B of Figure 4, and these prefigure our main findings. In panel A there is some indication of a distant differential pre‐treatment trend, with the coefficient on the lead for 7 or more days prior to SIPO adoption being statistically significant. Panel B accounts for the state linear trend controls. In doing so, we now find very little evidence of differential pre‐SIPO COVID‐19 case trends in treatment and control states during all periods prior to adoption. Each of the leads is statistically indistinguishable from zero and each point estimate is near zero. Moreover, in both panels, there is a clear break in the trend between the SIPO and non‐SIPO states following the mandate. Estimated case reductions accelerate over time, becoming largest after 20 days following enactment of a SIPO. These findings are consistent with a causal interpretation and with exponential growth in short‐run health benefits during the period of the SIPO.
FIGURE 4.
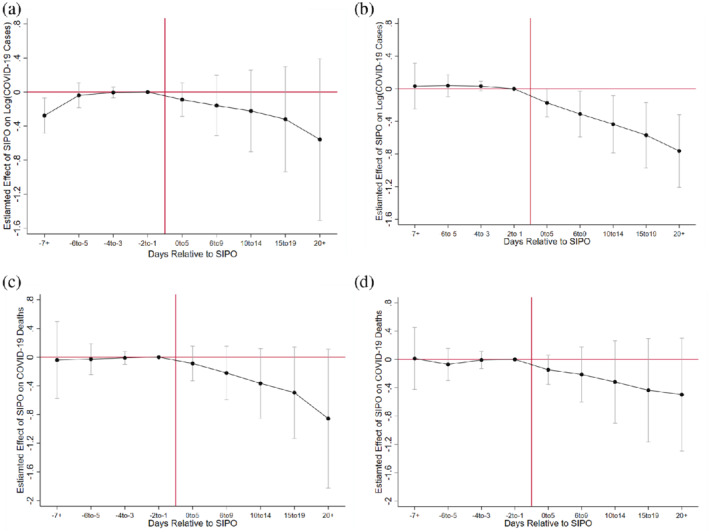
Event‐Study Analysis of Shelter in Place Orders (SIPOs) and COVID‐19 Cases and Deaths Notes: (A) Two‐way fixed effect model outcome—Log(COVID‐19 cases). (B) Model with state specific linear time trend time trend outcome—Log(COVID‐19 cases). (C) Two‐way fixed effect model outcome—deaths. (D) Model with state specific linear time trend outcome—death. Estimates are obtained using weighted least squares regression. All modes include controls for state fixed effects, day fixed effects, and the controls listed in Appendix Table 1 Supporting information. Standard errors are clustered at the state level. Bars on point estimates represent 95 percent confidence intervals.
In Table 3, we present difference‐in‐differences estimates of the effect of SIPO adoption on COVID‐19 cases, based on Equation (1). 32 In our most parsimonious specification, we find little evidence that COVID‐19 cases were affected during the 5 days following a SIPO's enactment. This is not too surprising given that transmission may not be as common during an asymptomatic incubation period. 33 However, the estimated coefficients on the SIPO policy become much larger after 6–14 days. After 14 days of adoption, enactment of a SIPO is associated with a 20.5% decline in COVID‐19 cases, and the effect strengthens to 39.2% 20 or more days post‐enactment (column 1), although these effects are imprecisely estimated. 34
TABLE 3.
Difference‐in‐Difference Estimates of the Effect of SIPOs on Log (COVID‐19 Cases)
| (1) | (2) | (3) | (4) | (5) | |
|---|---|---|---|---|---|
| 1–5 days after SIPO | 0.030 | −0.171 | −0.209* | −0.201* | −0.191* |
| (0.118) | (0.116) | (0.121) | (0.109) | (0.103) | |
| 6–9 days after SIPO | −0.056 | −0.319* | −0.369** | −0.341** | −0.324** |
| (0.207) | (0.161) | (0.166) | (0.150) | (0.135) | |
| 10–14 days after SIPO | −0.130 | −0.440** | −0.495*** | −0.465*** | −0.447*** |
| (0.275) | (0.181) | (0.183) | (0.170) | (0.154) | |
| 15–19 days after SIPO | −0.230 | −0.567*** | −0.628*** | −0.601*** | −0.577*** |
| (0.346) | (0.200) | (0.200) | (0.189) | (0.170) | |
| 20+ days after SIPO | −0.497 | −0.740*** | −0.811*** | −0.791*** | −0.765*** |
| (0.516) | (0.214) | (0.219) | (0.211) | (0.201) | |
| N | 2,100 | 2,100 | 2,100 | 2,100 | 2,100 |
| State and day fixed effects | Yes | Yes | Yes | Yes | Yes |
| State specific linear time trend | No | Yes | Yes | Yes | Yes |
| Business closure order and partial SIPOs | No | No | Yes | Yes | Yes |
| Travel restrictions and disaster declaration | No | No | No | Yes | Yes |
| Weather controls | No | No | No | No | Yes |
Notes: Estimates are obtained using weighted least squares regression. A business closure order is an indicator for whether the state had issued a nonessential business closure order (that fell short of a SIPO). Partial SIPOs include a targeted SIPO for older individuals or those with underlying health conditions and an indicator for whether coverage of local (i.e., city or county) SIPO orders covered at least 50% of the state population. A travel restriction is an indicator for whether the state had issued restrictions on travel to or from the state. A major disaster declaration is an indicator for whether the state had received a major disaster emergency declaration from the Federal government. Finally, weather controls include the average temperature (in degrees Celsius) in the state and an indicator for whether measurable precipitation fell in the state. All models include state fixed effects and day fixed effects. Standard errors, clustered at the state‐level, are reported in parenthesis. *Significant at the 10% level; **significant at the 5% level; ***significant at the 1% level.
In column 2 we utilize controls for state‐specific linear time trends. We believe this specification is preferable for three reasons. First, in a model with log cases as the outcome, state linear trends control for the state‐specific exponential growth path of the outbreak (at least prior to reaching the peak number of cases), making the estimated effect of the SIPO deviations from that growth path. Second, with regard to the common trends assumption, the specification including state‐specific linear time trends is more defensible when examining event studies, as the pre‐treatment trends are generally flatter. 35 Third, the trend controls appear to soak up residual variance and improve precision of the estimated coefficients.
In column 2, we find that between 6 and 9 days following enactment of a SIPO, there was a 27.3% decline in COVID‐19 cases, an effect that is statistically distinguishable from zero at the 10% level. Moreover, 10–14 days after SIPO adoption, we find that coronavirus cases fell by 35.6%. The effect progressively gets stronger with the length of the post‐treatment window, and after 20 days subsequent to SIPO adoption, we find that coronavirus cases fell by 52.2%, suggesting that the health benefits of SIPOs may grow larger in the periods following enactment.
The remaining columns of Table 3 show the robustness of the COVID‐19 case results to observable state‐level observable controls. 36 We find no evidence that other COVID‐19‐related shutdown or shelter policies (column 3), travel restrictions or major disaster emergency declarations (column 4), or weather (column 5) affected the estimated impact of SIPOs on COVID‐19 cases. 37
C. Sensitivity Analysis
In Table 4, we explore the sensitivity of our main findings to the inclusion and exclusion of states from the analysis sample. Above, we argued for the exclusion of New York and New Jersey from our sample. In column 1 of Table 4, we include these states in the analysis sample. The estimated effect of SIPO adoption on coronavirus cases is similar to that reported in column 5 of Table 3 (53% vs. 48% decline in cases 20+ days post‐SIPO). 38
TABLE 4.
Sensitivity of Findings to the Inclusion or Exclusion of States in Analysis Sample
| (1) | (2) | (3) | (4) | (5) | |
|---|---|---|---|---|---|
| Add NY and NJ | Drop CA | Drop WA | Drop MA | Drop LA | |
| 1–5 days after SIPO | −0.096 | −0.053 | −0.189* | −0.188* | −0.196* |
| (0.137) | (0.088) | (0.112) | (0.108) | (0.102) | |
| 6–9 days after SIPO | −0.213 | −0.140 | −0.324** | −0.308** | −0.327** |
| (0.181) | (0.127) | (0.145) | (0.143) | (0.134) | |
| 10–14 days after SIPO | −0.321 | −0.250 | −0.450*** | −0.418** | −0.454*** |
| (0.209) | (0.163) | (0.164) | (0.165) | (0.152) | |
| 15–19 days after SIPO | −0.439* | −0.380* | −0.585*** | −0.535*** | −0.582*** |
| (0.230) | (0.200) | (0.180) | (0.183) | (0.167) | |
| 20+ days after SIPO | −0.654*** | −0.647** | −0.798*** | −0.695*** | −0.754*** |
| (0.233) | (0.278) | (0.205) | (0.205) | (0.201) | |
| N | 2,188 | 2,056 | 2,056 | 2,056 | 2,057 |
| (6) | (7) | (8) | (9) | (10) | |
|---|---|---|---|---|---|
| Drop DC | Drop CT | Drop OR | Drop TX | Drop MN | |
| 1–5 days after SIPO | −0.194* | −0.195* | −0.189* | −0.214** | −0.186* |
| (0.103) | (0.102) | (0.106) | (0.105) | (0.102) | |
| 6–9 days after SIPO | −0.328** | −0.330** | −0.326** | −0.358*** | −0.317** |
| (0.135) | (0.133) | (0.139) | (0.132) | (0.134) | |
| 10–14 days after SIPO | −0.451*** | −0.450*** | −0.450*** | −0.492*** | −0.447*** |
| (0.154) | (0.151) | (0.158) | (0.153) | (0.153) | |
| 15–19 days after SIPO | −0.582*** | −0.580*** | −0.583*** | −0.621*** | −0.584*** |
| (0.170) | (0.167) | (0.173) | (0.173) | (0.170) | |
| 20+ days after SIPO | −0.769*** | −0.758*** | −0.785*** | −0.781*** | −0.784*** |
| (0.201) | (0.201) | (0.203) | (0.212) | (0.205) | |
| N | 2,056 | 2,056 | 2,056 | 2,056 | 2,056 |
Notes: Estimates are obtained using weighted least squares regression. The model includes the following controls: an indicator for whether the state had issued a nonessential business closure order (that fell short of a SIPO) or a targeted SIPO for older individuals or those with underlying health conditions, an indicator for whether coverage of local (i.e., city or county) SIPO orders covered at least 50% of the state population, an indicator for whether the state had issued restrictions on travel to or from the state, an indicator for whether the state had received a major disaster emergency declaration from the Federal government, the average temperature (in degrees Celsius) in the state, an indicator for whether measurable precipitation fell in the state, state fixed effects, day fixed effects, and a state‐specific linear time trend. Standard errors, clustered at the state‐level, are reported in parentheses. *Significant at the 10% level; **significant at the 5% level; ***significant at the 1% level.
Given that California's SIPO is significantly associated with a decline in coronavirus cases (Friedson et al. 2020), we next excluded this state from the analysis to ensure that our findings were not driven by the earliest‐adopting state for which there is already strong evidence for SIPO‐induced COVID‐19 case reductions. Our results show that the average SIPO effect we detect is not driven by California, and continue to exhibit a similar pattern of case declines that grow larger in the weeks following enactment.
In columns 3–7, we exclude a number of states with high COVID‐19 case levels (relative to the national mean), as well as states with relatively high COVID‐19 case rates. The states we drop include Washington (column 3), Massachusetts (column 4), Louisiana (column 5), District of Columbia (column 6), and Connecticut (column 7). The results show that the average SIPO effect we detect is not also driven by these states. We estimate that, after 20 days of enactment, SIPO adoption is associated with a 50.1%–55.0% reduction in COVID‐19 cases when we exclude these states from our sample.
In the final three columns of Table 3, we drop several states with lower rates of coronavirus and low rates of coronavirus case growth: Oregon (column 8), Texas (column 9), and Minnesota (column 10). Again, we find no evidence that our main finding is changed.
One concern with the estimates presented thus far is that they may be biased if SIPO adoption were correlated with COVID‐19 testing capabilities. This may be the case due to the evolution of testing over the period of analysis. As of March 13, only 15,000 tests had been conducted in the United States. To address the low testing rate in the United States, the Food and Drug Administration approved a new COVID‐19 test from the pharmaceutical company Roche (Arnold 2020). In the following days, Delaware, New York, Massachusetts, and Texas, began implementing drive‐up testing sites, which made testing more accessible (Yancey‐Bragg 2020). Despite these improvements in accessibility, many testing delays persisted due to laboratory capacity constraints (Brown and Court 2020).
SIPOs could affect COVID‐19 testing in several ways. First, SIPOs may induce some who have flu‐like symptoms to stay at home rather than seek medical attention, either due to perceived civic duty or a perception of greater adverse selection in patients who present at medical facilities during a pandemic. Second, SIPOs could strain public resources such that there is a budgetary tradeoff in enforcing SIPOs and expanding COVID‐19 testing capabilities. On the other hand, if SIPOs are effective at reducing caseloads, medical resources that no longer have to be used to treat coronavirus patients can be used to expand testing. Moreover, if SIPOs prevent symptomatic COVID‐19 cases, fewer patients will present for testing.
Data on COVID‐19 testing are obtained from COVID Tracking Project. A test is counted if the result was deemed positive, negative, or inconclusive. In Appendix Table 1, we report that the average testing rate over the sample period was 363.8 tests per 100,000 population.
The first two columns of Table 5 show estimates of the effect of SIPOs on the natural log of COVID‐19 tests. We find that SIPOs are negatively related to testing, but these effects are mainly not statistically distinguishable from zero at conventional levels. In light of these findings, it is perhaps not surprising that in columns 3 and 4 of Table 5, we find no evidence that the estimated effect of enactment of a SIPO on COVID‐19 cases is affected by the addition of a control for COVID‐19 testing capacity. Given that testing is a potentially endogenous control (although we find little evidence that it is affected by a SIPO), we nevertheless take this descriptive evidence as suggestive of the hypothesis that our estimates are not biased due to state‐level heterogeneity in growth of testing capacity.
TABLE 5.
Exploring the Effect of SIPOs on COVID‐19 Testing and Sensitivity of the Estimated Effect of SIPOs on COVID‐19 Cases to Controlling for Testing
| Log (COVID‐19 Tests) | Log (COVID‐19 Cases) | |||
|---|---|---|---|---|
| (1) | (2) | (3) | (4) | |
| 1–5 days after SIPO | −0.207 | −0.328* | −0.185* | −0.159 |
| (0.161) | (0.163) | (0.106) | (0.099) | |
| 6–9 days after SIPO | −0.211 | −0.315 | −0.304** | −0.275* |
| (0.145) | (0.185) | (0.143) | (0.138) | |
| 10–14 days after SIPO | −0.295 | −0.376 | −0.417** | −0.380** |
| (0.209) | (0.242) | (0.164) | (0.154) | |
| 15–19 days after SIPO | −0.290 | −0.323 | −0.534*** | −0.492*** |
| (0.273) | (0.309) | (0.178) | (0.166) | |
| 20+ days after SIPO | −0.077 | −0.058 | −0.697*** | −0.670*** |
| (0.384) | (0.417) | (0.193) | (0.187) | |
| N | 2,088 | 2,088 | 2,043 | 2,043 |
| State FE, day FE, state Trends | Yes | Yes | Yes | Yes |
| State controls | No | Yes | Yes | Yes |
| COVID‐19 testing control | No | No | No | Yes |
Notes: Estimates are obtained using weighted least squares regression. State controls include the following: an indicator for whether the state had issued a nonessential business closure order (that fell short of a SIPO) or a targeted SIPO for older individuals or those with underlying health conditions, an indicator for whether coverage of local (i.e., city or county) SIPO orders covered at least 50% of the state population, an indicator for whether the state had issued restrictions on travel to or from the state, an indicator for whether the state had received a major disaster emergency declaration from the Federal government, the average temperature (in degrees Celsius) in the state, and an indicator for whether measurable precipitation fell in the state. State FE are state fixed effects, day FE are day fixed effects, and state trends are state‐specific linear time trends. Standard errors, clustered at the state‐level, are reported in parentheses. *Significant at the 10% level; **significant at the 5% level; ***significant at the 1% level.
The difference‐in‐differences estimates presented to this point have identified the effect of a SIPO on the state‐specific change in cumulative cases of coronavirus. In Table 6, we explore the effect of SIPO adoption on the “derivative” of cumulative COVID‐19 cases, that is, daily COVID‐19 cases. And, in fact, we find evidence that the enactment of a SIPO also affected the rate of change in cumulative COVID‐19 cases. The results suggest that state adoption of a SIPO was associated with a 51.1%–54.1% decline in daily coronavirus cases after 20 or more days.
TABLE 6.
Difference‐in‐Difference Estimates of the Effect of SIPOs on Log (Daily COVID‐19 Cases)
| (1) | (2) | (3) | (4) | (5) | |
|---|---|---|---|---|---|
| 1–‐5 days after SIPO | −0.048 | −0.195* | −0.136 | −0.137 | −0.123 |
| (0.112) | (0.109) | (0.131) | (0.132) | (0.128) | |
| 6–‐9 days after SIPO | −0.143 | −0.333** | −0.276* | −0.280* | −0.251* |
| (0.169) | (0.140) | (0.158) | (0.158) | (0.148) | |
| 10–‐14 days after SIPO | −0.228 | −0.447** | −0.399** | −0.403** | −0.371** |
| (0.206) | (0.168) | (0.186) | (0.188) | (0.176) | |
| 15–‐19 days after SIPO | −0.412 | −0.654*** | −0.616*** | −0.619*** | −0.580*** |
| (0.255) | (0.205) | (0.223) | (0.225) | (0.211) | |
| 20+ days after SIPO | −0.658 | −0.778*** | −0.754** | −0.756** | −0.715** |
| (0.397) | (0.279) | (0.291) | (0.294) | (0.278) | |
| N | 2,003 | 2,003 | 2,003 | 2,003 | 2,003 |
| State and day fixed effects | Yes | Yes | Yes | Yes | Yes |
| State specific linear time trend | No | Yes | Yes | Yes | Yes |
| Business closure order and partial SIPOs | No | No | Yes | Yes | Yes |
| Travel restrictions and disaster declaration | No | No | No | Yes | Yes |
| Weather controls | No | No | No | No | Yes |
Notes: Estimates are obtained using weighted least squares regression. A business closure order is an indicator for whether the state had issued a non‐essential business closure order (that fell short of a SIPO). Partial SIPOs include a targeted SIPO for older individuals or those with underlying health conditions and an indicator for whether coverage of local (i.e., city or county) SIPO orders covered at least 50% of the state population. A travel restriction is an indicator for whether the state had issued restrictions on travel to or from the state. A major disaster declaration is an indicator for whether the state had received a major disaster emergency declaration from the Federal government. Finally, weather controls include the average temperature (in degrees Celsius) in the state and an indicator for whether measurable precipitation fell in the state. All models include state fixed effects and day fixed effects. Standard errors, clustered at the state‐level, are reported in parentheses. *Significant at the 10% level; **significant at the 5% level; ***significant at the 1% level.
We undertake additional analyses to address specific issues. First, there may be some concern that the composition of states that identify each of the lagged effects is changing over time. We have at least 14 days of post‐treatment data for all SIPO states. Furthermore, 29 of the 41 treated states contribute to identification of the coefficient of the longest lag window, that is effects over 20 or more days following adoption. Appendix Figure 2 plots the event study analyses on a restricted sample of states that have 20+ days of post‐treatment data following the adoption of a SIPO, showing largely similar results and dynamics.
Second, our main conclusions are not materially affected by additional approaches to controlling for unmeasured time‐varying state factors. Appendix Table 5 presents estimates that control for region by day and census division by day fixed effects. Comparing these estimates to our main analyses, we draw the following empirical conclusions. Our interpretation of the pattern of results across all models is similar: the estimated effect of SIPOs on COVID‐19 cases grows over the post‐treatment period, becoming largest in the window 3 weeks or more following enactment. 39
Third, in order to assess the sensitivity of our estimates to different sources of timing‐based identification, we draw on subsets of the treated cohorts to identify our effects, in turn excluding late adopters, early adopters, and nonadopters from the sample). These results confirm that: (a) the effects of SIPOs in reducing COVID‐19 cases are substantially larger among early‐adopting states relative to later‐adopting states; (b) the effects for the early adopters are progressively larger with the length of the post‐treatment window; (c) these effects are robust to using nonadopters as controls or late‐adopters as controls; and (d) the pattern of results is largely similar to those discussed above, utilizing all states in the analysis.
In our main analyses, we weight the models by state population to produce an average treatment effect at the population level. We also produce unweighted estimates in Appendix Table 8 to assess sensitivity to weighting, which may arise, for instance, if there are heterogeneous effects across larger versus smaller treatment states (Angrist and Pischke 2008; Solon, Haider, and Wooldridge 2015). 40 Our results and patterns remain largely similar in the unweighted models.
D. Statewide SIPO and COVID‐19 Mortality
Next, we turn to an analysis of whether statewide SIPOs affected mortality. There are several channels through which mortality may be affected by SIPOs. If SIPOs reduce coronavirus cases, mortality will decline in the longer‐run because fewer people will become infected with the coronavirus. Of course, these effects are likely to come with a much longer lag than cases given that the time from first symptoms until ARDS is, on average, about 8 days (Wang et al. 2020). In addition, SIPOs may affect the likelihood that infected patients choose to stay at home rather than seek out testing and other medical care, having the unintended consequence of increasing serious illness and death. Finally, SIPOs may also impact the availability of resources for medical care, as public resources are used to enforce SIPOs instead.
Negative binomial regressions of the effect of SIPO enactment on COVID‐19‐related mortality are shown in Table 7. Models without state trends of any sort (column 1) and with state‐specific linear time trends (column 2) suggest that after 20 days, SIPO adoption is associated with 36.1%–50.2% reduction in mortality. Controlling for state‐specific linear time trends, the estimated mortality effects are smaller, but continue to show long‐run COVID‐19 death declines. But because none of these estimates are statistically distinguishable from zero at conventional levels, we can only cautiously interpret these findings as evidence of mortality declines. We note here that due to the longer lag with which we expect mortality effects to materialize, the effects for the longer time windows (15–19 days post SIPO, >19 days post SIPO) are identified off a few early‐adopting states. Hence, more long‐run data is necessary for a definitive conclusion.
TABLE 7.
Negative Binominal Estimates of the Effect of SIPOs on Deaths
| (1) | (2) | (3) | (4) | (5) | |
|---|---|---|---|---|---|
| 1–5 days after SIPO | −0.052 | −0.063 | −0.135 | −0.133 | −0.128 |
| (0.135) | (0.189) | (0.154) | (0.132) | (0.128) | |
| 6–9 days after SIPO | −0.156 | −0.155 | −0.226 | −0.202 | −0.191 |
| (0.211) | (0.278) | (0.249) | (0.219) | (0.203) | |
| 10–14 days after SIPO | −0.284 | −0.261 | −0.325 | −0.308 | −0.295 |
| (0.291) | (0.357) | (0.336) | (0.313) | (0.291) | |
| 15–19 days after SIPO | −0.382 | −0.380 | −0.435 | −0.431 | −0.409 |
| (0.395) | (0.417) | (0.404) | (0.391) | (0.360) | |
| 20+ days after SIPO | −0.698 | −0.448 | −0.491 | −0.499 | −0.471 |
| (0.600) | (0.432) | (0.437) | (0.436) | (0.400) | |
| N | 2,156 | 2,156 | 2,156 | 2,156 | 2,156 |
| State and day fixed effects | Yes | Yes | Yes | Yes | Yes |
| State specific linear time trend | No | Yes | Yes | Yes | Yes |
| Business closure order and partial SIPOs | No | No | Yes | Yes | Yes |
| Travel restrictions and disaster declaration | No | No | No | Yes | Yes |
| Weather controls | No | No | No | No | Yes |
Notes: Estimates are obtained using weighted negative binomial regression. A business closure order is an indicator for whether the state had issued a nonessential business closure order (that fell short of a SIPO). Partial SIPOs include a targeted SIPO for older individuals or those with underlying health conditions and an indicator for whether coverage of local (i.e. city or county) SIPO orders covered at least 50% of the state population. A travel restriction is an indicator for whether the state had issued restrictions on travel to or from the state. A major disaster declaration is an indicator for whether the state had received a major disaster emergency declaration from the Federal government. Finally, weather controls include the average temperature (in degrees Celsius) in the state and an indicator for whether measurable precipitation fell in the state. All models include state fixed effects and day fixed effects. Standard errors, clustered at the state‐level, are reported in parentheses. *Significant at the 10% level; **significant at the 5% level; ***significant at the 1% level.
In Figure 4, panels C and D, we show the event study analysis on COVID‐19 related mortality. We find no evidence of differential pre‐treatment trends in mortality, with a longer delayed but imprecisely estimated potential decline in mortality.
E. Heterogeneity in Estimated Impacts of SIPOs
The results presented above provide consistent evidence that the adoption of a statewide SIPO significantly reduced infection rates, with the strongest effects realized two or more weeks after enactment. This lag is consistent with the incubation period of the virus (2–14 days) over which transmission may be possible but less efficient due to lack of symptoms. Given the exponential growth trajectory of infection, there may additional dynamics in terms of the effectiveness of the SIPO depending on when the policy is enacted—whether early or late over the cycle of disease progression. That is, the beneficial effects of social distancing on COVID‐19 caseload may have an accelerating effect over time if enacted early.
Friedson et al. (2020) find strong evidence that California's first‐in‐the‐nation SIPO had a strong public health benefit, and continued to do so even after social distancing measures between California and its control narrowed. This is suggestive of persistent and magnified effects of enacting a SIPO early in the outbreak cycle. However, given the study's focus on California, Friedson et al. (2020) were not able to explicitly test for heterogeneity in the response across early versus late adopters. 41 Table 8 presents effects separately across early adopting states (adopted on March 25 or earlier) and late adopting states (adopted after March 25). These results confirm that the effects are primarily driven by states which enacted the SIPOs relatively early, thus capitalizing on the magnified benefits of social distancing as the growth trajectory was rising but still relatively low compared with later adopters. 42 In addition, we now uncover some evidence that SIPOs are effective at reducing coronavirus‐related mortality when they were adopted early in the United States. COVID‐19 outbreak. While some of this result could be explained by insufficient longer‐run data from later adopters, all later adopters and early adopters have data between 2 and 3 weeks after SIPO adoption and early adopters see substantially larger health benefits than later adopters over this period. 43
TABLE 8.
Heterogeneity in Health Effects of SIPOs by Earlier and Later Adopting States
| (1) | (2) | |
|---|---|---|
| Log(Cases) | Deaths | |
| Early adopting states * 1–5 days after SIPO | −0.267** | −0.296 |
| (0.123) | (0.163) | |
| Early adopting states * 6–14 days after SIPO | −0.582*** | −0.609** |
| (0.190) | (0.248) | |
| Early adopting states * 15–19 days after SIPO | −0.901*** | −0.860*** |
| (0.265) | (0.326) | |
| Early adopting states * 20+ days after SIPO | −1.087*** | −0.900** |
| (0.353) | (0.390) | |
| Late adopting States * 1–5 days after SIPO | −0.137 | −0.095 |
| (0.089) | (0.132) | |
| Late adopting states * 6–14 days after SIPO | −0.257 | −0.040 |
| (0.157) | (0.229) | |
| Late adopting states * 15–19 days after SIPO | −0.254 | −0.000 |
| (0.223) | (0.324) | |
| Late adopting states * 20+ days after SIPO | −0.151 | 0.048 |
| (0.275) | (0.392) | |
| N | 2,100 | 2,156 |
Notes: Estimates in column 1 are obtained from weighted least squares regression. Estimates in column 2 are obtained from a weighted negative binomial regression. All models include the following controls: an indicator for whether the state had issued a nonessential business closure order (that fell short of a SIPO) or a targeted SIPO for older individuals or those with underlying health conditions, an indicator for whether coverage of local (i.e., city or county) SIPO orders covered at least 50% of the state population, an indicator for whether the state had issued restrictions on travel to or from the state, an indicator for whether the state had received a major disaster emergency declaration from the Federal government, the average temperature (in degrees Celsius) in the state, an indicator for whether measurable precipitation fell in the state, state fixed effects, day fixed effects, and a state‐specific linear time trend. Standard errors, clustered at the state‐level, are reported in parentheses. States that enacted SIPO between March 19 and 25 are coded as early adopting states. States that enacted SIPO on March 26 or later are coded as late adopting states. *Significant at the 10% level; **significant at the 5% level; ***significant at the 1% level.
In Table 9, we explore whether COVID‐19‐related health benefits are larger among states with higher population density. To do this, we explore the interquartile range of population density rankings of U.S. states. 44 In the main, our findings suggest larger COVID‐19‐related health benefits among those outside the lower 25th percentile of state population density rankings. Those states in the middle 50th percentile and upper 25th percentile of population density tend to see larger reductions in COVID‐19‐related cases. This result is consistent with the hypothesis that stay‐at‐home orders are likely to generate greater health benefits when crowd‐related contagion is avoided. The relationship between population density and the marginal effect of SIPOs on mortality appears more nonmonotonic.
TABLE 9.
Examination of Heterogeneous Treatment Effects by Population Density of SIPO‐Adopting State
| (1) | (2) | |
|---|---|---|
| Log Cases | Deaths | |
| 1–5 days after SIPO * lower 25th percentile population density | −0.200* | 0.077 |
| (0.114) | (0.305) | |
| 1–5 days after SIPO * middle 50th percentile population density | −0.086 | −0.174 |
| (0.093) | (0.138) | |
| 1–5 days after SIPO * upper 25th percentile population density | −0.182 | −0.083 |
| (0.130) | (0.220) | |
| 6–14 days after SIPO * lower 25th percentile population density | −0.237 | 0.127 |
| (0.196) | (0.478) | |
| 6–14 days after SIPO * middle 50th percentile population density | −0.214 | −0.373* |
| (0.155) | (0.224) | |
| 6–14 days after SIPO * upper 25th percentile population density | −0.344** | −0.044 |
| (0.145) | (0.379) | |
| 15–19 days after SIPO * lower 25th percentile population density | −0.295 | 0.218 |
| (0.257) | (0.689) | |
| 15–19 days after SIPO * middle 50th percentile population density | −0.337* | −0.625** |
| (0.200) | (0.309) | |
| 15–19 days after SIPO * upper 25th percentile population density | −0.491*** | −0.080 |
| (0.171) | (0.500) | |
| 20+ days after SIPO * lower 25th percentile population density | −0.258 | 0.358 |
| (0.377) | (0.805) | |
| 20+ days after SIPO * middle 50th percentile population density | −0.585** | −0.775* |
| (0.271) | (0.427) | |
| 20+ days after SIPO * upper 25th percentile population density | −0.533** | −0.000 |
| (0.242) | (0.508) | |
| N | 2,100 | 2,162 |
Notes: Estimates in column 1 are obtained from weighted least squares regression. Estimates in column 2 are obtained from a weighted negative binomial regression. All models include the following controls: an indicator for whether the state had issued a nonessential business closure order (that fell short of a SIPO) or a targeted SIPO for older individuals or those with underlying health conditions, an indicator for whether coverage of local (i.e., city or county) SIPO orders covered at least 50% of the state population, an indicator for whether the state had issued restrictions on travel to or from the state, an indicator for whether the state had received a major disaster emergency declaration from the Federal government, the average temperature (in degrees Celsius) in the state, an indicator for whether measurable precipitation fell in the state, state fixed effects, day fixed effects, and a state‐specific linear time trend. Standard errors, clustered at the state‐level, are reported in parentheses. *Significant at the 10% level; **significant at the 5% level; ***significant at the 1% level.
Together, the findings in Tables 8 and 9 generally suggest compounding and stronger effects of social distancing among the early adopters and higher population density states and provide some explanation as to why the SIPOs continue to have a beneficial effect on infection rates 6 to 20+ days post‐enactment. 45 In Table 10, we test this hypothesis by presenting estimates of the effect of SIPOs on stay‐at‐home rates by (a) whether the enacting state was an early or later adopter, and (b) the interquartile range of population density.
TABLE 10.
Examination of Heterogeneous Treatment Effects on Social Distancing by Timing of SIPO Adoption and Population Density
| Panel I: Earlier and later adopting states | |
| Early adopting states * SIPO | 2.585*** |
| (0.361) | |
| Late adopting states *SIPO | 1.335*** |
| (0.353) | |
| Panel II: Population density | |
| SIPO * lower 25th percentile population density | 0.436 |
| (0.724) | |
| SIPO * middle 50th percentile population density | 1.855*** |
| (0.401) | |
| SIPO * upper 25th percentile population density | 2.559*** |
| (0.430) | |
| N | 2,091 |
Notes: Estimates are obtained using weighted least squares regression. The models include the following controls: an indicator for whether the state had issued a nonessential business closure order (that fell short of a SIPO) or a targeted SIPO for older individuals or those with underlying health conditions, an indicator for whether coverage of local (i.e., city or county) SIPO orders covered at least 50% of the state population, an indicator for whether the state had issued restrictions on travel to or from the state, an indicator for whether the state had received a major disaster emergency declaration from the Federal government, the average temperature (in degrees Celsius) in the state, an indicator for whether measurable precipitation fell in the state, state fixed effects, day fixed effects, and a state‐specific linear time trend. Standard errors, clustered at the state‐level, are reported in parentheses. States that enacted SIPO between March 19 and 25 are coded as early adopting states. States that enacted SIPO on March 26 or later are coded as late adopting states. *Significant at the 10% level; **significant at the 5% level; ***significant at the 1% level.
First, consistent with our health results our findings in panel I provide strong evidence that SIPOs were more effective at increasing social distancing in early adopting SIPO states as compared to later adopting states. The estimated social distancing effect was twice as large for early as compared to later‐adopting states (2.6 percentage‐points vs. 1.3 percentage‐points). One explanation for our finding may be that residents of later‐adopting SIPO states already adopted some social distancing behaviors prior to their SIPO adoption or because later‐adopting SIPO state residents were less compliant with social distancing mandates, perhaps because of political or ideological preferences (Painter and Qiu 2020).
Next, if the primary mechanism through which SIPOs impact case rates is through social distancing, then we would expect these benefits to be further magnified in states with a high population density. Population density is an independent predictor of community spread of infection; SIPOs therefore would have more capacity to reduce social distancing in these states, and a given decrease in social distancing would also translate into reduced modes of person‐to‐person contact. In panel II, Table 10, we assess heterogeneity in the effects on stay‐at‐home behaviors across states with lower versus higher rates of population density, as measured by population per state area in square miles. Consistent with our findings on COVID‐19, we find that SIPOs are more effective in promoting social distancing in more densely populated states. The patterns uncovered in Table 10, with respect to heterogeneity in social distancing, parallel the stronger health effects that we find among states that adopted the orders earlier and among more densely populated states.
V. CONCLUSIONS
Since March 19, 2020, 40 states and the District of Columbia have adopted SIPOs to attempt to hasten the spread of COVID‐19, smooth illnesses and treatment over time, and prevent short‐run medical capacity constraints from causing otherwise avoidable deaths. Critics, however, argue that SIPOs impose large, and perhaps long‐lasting, job loss, strain social insurance programs beyond their capacity, and slow the progression toward community‐level herd immunity. While the lack of long‐run data does not yet permit us to answer all of the claims made by proponents and opponents of SIPOs, this paper proposes an important first step: to estimate the short‐term impact of statewide SIPOs on COVID‐19 cases and COVID‐19‐related mortality. That is, did these policies meet their immediate public health objective?
First, using GPS‐based anonymized cell phone records from SafeGraph, Inc. to measure state‐level daily social mobility, we find evidence that the enactment of a state SIPO resulted in a short‐run increase in the percent of state residents remaining at home full time. While longer‐run differentials in stay‐at home rates for treatment and control states were smaller or slightly negative, the findings do suggest an important effect of SIPOs on social distancing. We view the social distancing results as an important first‐stage outcome, but by no means the complete story with regard to policy and social distancing behavior. Our results capture a single, but important measure of social distancing, and studying other metrics of mobility (as done by Sears et al. 2020) will likely be a fruitful way to push this literature forward.
Second, using coronavirus case and mortality data from March 8, 2020 to April 20, 2020, and a difference‐in‐differences approach, we find that approximately 3 weeks after the enactment of a statewide SIPO, the average number of cumulative cases fell by approximately 53.5%. Roughly 3 weeks following SIPO adoption, this corresponds to approximately 3,073 fewer cumulative COVID‐19 cases for the average SIPO‐adopting state. Event study analysis suggests that this result was not driven by differential pre‐treatment trends, nor was it driven by the California experience (Friedson et al. 2020). We find that states that were highly urbanized and were early SIPO adopters saw the largest declines in cases, consistent with the hypothesis that early adopters with high population densities had the largest margins for larger short‐run public health benefits. 46 With the United States seeing a resurgence in new COVID‐19 cases, these results on the effectiveness of state orders targeting social distancing have continued relevance as states are starting to suspend or roll‐back their reopening plans, and making decisions on re‐imposing orders for nonessential business closures and sheltering‐at‐home.
An important limitation of our work is the preliminary examination of COVID‐19‐related deaths. While it is true that detecting more consistently negative death effects of SIPOs may take more time to uncover, effects on COVID‐related deaths could be quite different from cases. For instance, it could be that SIPOs may have important case‐reducing effects mostly among populations at low‐risk for mortality from this disease. In that case, the avoided infections may not generate substantial reduction in mortality because the high‐risk infections, that is, in nursing homes, still occurred. Future work might explore characteristics of marginal individual who avoided a COVID‐19 infection due to a SIPO.
The larger efficacy of a statewide SIPO depends on a number of factors beyond the specific scope of our paper. But if we assume (a) SIPOs are temporary because the economic costs are substantial, (b) development of a vaccine or effective treatment for COVID‐19 is unlikely in the short‐run (Fauci 2020), and (c) universal (or at least widespread) testing of asymptomatic individuals is also very unlikely in the short‐run (Center for Disease Control and Prevention 2020d), some of the short‐run COVID‐19 cases and deaths may simply be postponed to the near future when the SIPO is lifted. In that case, deaths and serious illnesses averted by avoiding short‐run shortages of ventilators, hospital beds, and medical professionals may be a SIPO's most likely path to generating long‐run public health benefits.
Supporting information
Appendix S1. Supporting information
Endnotes
For example, Austin, Texas and Denver, Colorado (among many other municipalities) put in place municipal SIPOs when there was no state‐level SIPO in place at the time.
As of April 15, 2020, six states issued limited orders that closed nonessential businesses, and two states enacted targeted shelter‐in‐place orders that applied only to those ages 65 and older and who had underlying health conditions (Mervosh, Lu, and Swales 2020; Weaver 2020).
Media reports suggest that some private citizens have begun to monitor neighbors' behavior and local businesses, reporting perceived violations of SIPOs to local law enforcement agencies (Webber 2020).
The mean number of cumulative cases of coronavirus in the average SIPO‐adopting state over our sample period was 5,744 (for the full sample, this number was 5,501).
This is consistent with findings from a case‐study of county‐level orders in Texas (Dave et al. 2020).
See Holshue et al. (2020).
While numerous clinical trials for a COVID‐19 vaccine and anti‐viral treatments are underway, significant lag times with clinical testing and approval by the Food and Drug Administration mean that an effective prophylactic and treatment are unlikely over the short‐term. Hence, public health efforts centered on suppression and mitigation take on added relevance to prevent the surge in cases from overwhelming the healthcare system.
President Trump declared a National Emergency concerning the COVID‐19 outbreak, on March 13.
States generally include some exceptions to shelter‐in‐place orders, including going to work for certain jobs, grocery shopping, walking the dog, exercising, or getting medical care.
There is, in fact, important work showing that increased generosity of sick leave pay, which encourages social distancing, reduces the spread of contagious disease (Pichler, Wen, and Ziebarth 2020; Pichler and Ziebarth 2017).
The incubation lag is 5 days at the median, and 10 days at the 97.5 percentile.
Some transmission from asymptomatic infected persons during this period is also possible.
Thus a value of 25 is for the shelter‐in‐place index could represent an increase of 12% of phones staying at home at baseline to 37% of phones staying at home (37 – 12 = 25).
Data from the 2018 American Community Survey indicate that 90% of households included at least one smartphone user, and 81% of Americans owned a smartphone based on a survey by the Pew Research Center in 2019 (see: https://www.pewresearch.org/internet/fact‐sheet/mobile/). Smartphone ownership increases with education and income, decreases with age, and is roughly similar across race/ethnicity. Analyses by SafeGraph show that their sample correlates very highly with the true Census populations (0.97 across U.S. counties) and with the proportion of the population across educational attainment and income levels (correlation of 0.99). See: https://www.safegraph.com/blog/what‐about‐bias‐in‐the‐safegraph‐dataset.
See data available here: https://www.nytimes.com/interactive/2020/us/coronavirus‐us‐cases.html.
Mervosh, Lu, and Swales's (2020) article is available at: https://www.nytimes.com/interactive/2020/us/coronavirus‐stay‐at‐home‐order.html.
The governor of Massachusetts did not issue a shelter‐in‐place order, but did offer a shelter‐in‐place advisory on March 24, 2020. However, this advisory did not carry the force of law.
Notably, however, county shelter‐in‐place orders in Texas and Utah covered over half of the state population by March 25 and April 2, respectively.
The period from 1 to 14 days is the 99% confidence interval for the incubation period for coronavirus (Lauer et al. 2020).
Data for emergency decrees for major disaster areas are available at the U.S. Department of Homeland Security—Federal Emergency Management Agency, found here: https://www.fema.gov/disasters. Daily data on temperature and precipitation are available at: https://www.ncdc.noaa.gov.
Appendix Figure 1B shows COVID‐19 case growth was somewhat higher among the later‐ and never‐adopting states relative to the early adopters.
Sun and Abraham (2020) show that in a standard two‐way fixed effects model with leads and lags of the treatment variable, spurious differential pre‐trends can also arise in the presence of heterogeneous treatment effects. In other words, nonzero positive lead coefficients can arise due to contamination with post‐treatment effects, even if there are no differential pre‐trends. This can raise the probability of a Type 1 error when testing if the lead coefficients are zero. Failure to reject the null (lead effects that are insignificant and close to zero) hence becomes an added validation check.
These data are available at: https://covidtracking.com. Note that COVID‐19 testing data are missing for some days for the following states: Alabama, Delaware, Kansas, Maryland, Michigan, and Ohio.
As shown by Sears et al. (2020), there were large nationwide declines in mobility and travel behavior even prior to the imposition of statewide stay‐at‐home mandates, reflecting reduced economic activity, revised work‐from‐home guidelines, and voluntary social distancing following CDC guidelines and diffusion of risk‐related information regarding COVID‐19.
These findings are available upon request.
As the baseline for the shelter‐in‐place index is the same for all states (week ending February 12, 2020), and the pre‐SIPO trends are nearly identical, the treatment effect can be interpreted as the increase in the percent of households who are staying at home relative to its counterfactual in the post‐SIPO period.
Trends in Appendix Figure 1C are consistent with this interpretation, showing a general increase in social distancing across all states that accelerated initially and then slowed down. Rate of growth is monotonic with the timing of SIPO adoption, with relatively faster growth in social distancing experienced by the early‐adopting states. Appendix Figure 1D shows the trends in stay‐at‐home behavior across event time, and suggest diminishing returns in the increase in social distancing among the early‐adopting states, as the nonadopting states are somewhat catching up—thus partly narrowing the differential.
Friedson et al. (2020) find that California's shelter‐in‐place order resulted in a 9%–12% increase in the percent of individuals staying at home. Sears et al. (2020), using data on change in average distance traveled, change in visits to nonessential businesses, and changes in the rate of human interactions, based on cellular location data provided by Unacast, similarly find that the state shelter‐in‐place mandates reduced travel behaviors by approximately 6%–11%.
Complete sheltering‐in‐place full time, our main measure, is an extreme margin. And, we view this social distancing measure as a litmus check on whether or not the mechanism is active, but not as the full story on social distancing behavior as there is potential for a great number of margins of response. There may be other forms or social distancing and avoidance behaviors, induced by the SIPO, that are being followed and which can drive containment in the infection rate. We also assessed effects on two other measures: (a) median hours spent at home; and (b) percent full‐time work outside the home. These effects are consistent with the estimates for stay‐at‐home behavior, and also suggest a significant increase in time spent at home and a decrease in work outside the home.
Appendix Table 3 presents coefficients on the control variables for the regressions shown in Table 3.
This finding could also be explained by lags in COVID‐19 testing.
This estimate is calculated as (e−0.230 − 1) * 100 = 20.5.
COVID‐19 case specifications that include state‐specific linear time trends (see Figure 3, Appendix Figure 2) produce stronger evidence of common pre‐treatment trends than the two‐way fixed effects model over the entire pre‐treatment window, particularly in netting out distant (more than a week prior) differential trends.
In alternate specifications, available upon request, we estimate negative binomial and tobit regressions of the effect of SIPOs on COVID‐19 cases. The findings are qualitatively unchanged from those we report.
In Appendix Table 4, we explore the lagged effects of nonessential business closure policies, which was a common policy adopted just prior to full SIPOs or instead of SIPOs. We find no evidence that nonessential business closure policies affect the number of COVID‐19 cases.
Appendix Figure 3 shows an event‐study analysis when we include New York and New Jersey in the main analysis sample. Note that as we approach the period over 1 week prior to adoption, the coefficient estimates decrease, suggesting a slight pre‐treatment upward trend in cases when we include New York and New Jersey to our sample.
In Appendix Tables 6 and 7, we present analyses that utilize alternate controls for unobserved state trends. Appendix Table 6 utilizes a two‐part correction, which estimates state‐specific trends (separately for each state and alternately for each treatment cohort) using only the pre‐policy observations and then partials out these extrapolated pre‐policy trends from the post‐policy periods (Goodman‐Bacon 2018). These estimates are the largest (in absolute magnitude), indicating a 61%–62% decline in COVID‐19 cases, and a 85%–87% decline in mortality three or more weeks following adoption. While this finding is consistent with the hypothesis that estimated policy effects from models including the state‐specific linear time trend may understate the policy's impact, with an exponentially growing outbreak, extrapolating the pre‐treatment trends forward using the pre‐policy periods may also risk biasing the dynamics in the opposite direction if the intervention is effective and dampens the trajectory to sub‐exponential growth. Moreover, the extrapolated functional form yields pre‐trends that violate parallel trends in event study analyses. For instance, the large 34%–37% increase in COVID‐related mortality within 0–5 following SIPO adoption is not credible and reflects a continuation of existing positive pre‐trends that are not effectively netted out with the extrapolated trend controls. Appendix Table 7 presents estimates that control for treatment state‐specific linear pre‐policy trends. While these models indicate similar patterns as with our main analyses, they also fail to generate credible pre‐trends. The significant decrease, in this case, in mortality of 17%–23% within the first few days of the enactment of the SIPO is a carry‐over of existing pre‐policy trends that are again not effectively being eliminated with these trend controls. In summary, while the patterns are consistent with our main analyses, these alternate approaches to controlling for unmeasured time‐varying state factors fail to produce parallel pre‐policy trends between the treated and control states and should be interpreted with much caution.
Appendix Figure 4 presents the event study analyses for the unweighted specifications.
The states within each percentile group used to subset the data in the analyses to follow can be found in Appendix Table 9.
Appendix Table 10 explores heterogeneity in the efficacy of SIPOs based on whether or not the state in question had a nonessential business closure or local SIPOs covering over 50% of the state population in place prior to the statewide SIPO. Statewide SIPOs are less effective when these other policies are enacted first. For further discussion of this phenomenon see Dave et al. (2020).
Appendix Table 11 conducts a similar analysis to Table 8, instead splitting states into groups based on their average daily growth rate of COVID‐19 cases prior to their SIPO as a proxy for how early or late their adoption was relative to their state‐specific outbreak. Results show that states which adopted relatively earlier in their outbreak cycle realized stronger effects.
We obtain our population density measures here: https://www.statista.com/statistics/183588/population‐density‐in‐the‐federal‐states‐of‐the‐us/.
Event‐study analyses on early‐adopting and more densely populated states, available upon request, produces a pattern consistent with coronavirus case differentials that trend near zero in the pre‐treatment period and fall precipitously following SIPO enactment. Furthermore, there is sufficient variation in the distribution of population density across the early adopting states. Models that further separate out the effects of early adoption from population density indicate that states which adopted earlier and are more densely populated experienced the strongest decrease in COVID‐19 cases. We lose precision in these models however.
In this context, that our average estimate is smaller than the estimated effect of CA statewide SIPO (Friedson et al. 2020) is to be expected. As indicated by our heterogeneity analysis, early‐adopting and more densely populated states— such as CA—stand more to gain from enacting a SIPO early during the outbreak cycle. Courtemanche et al. (2020a, 2020b) find results that are larger in magnitude by examining all social distancing policies in tandem (including the SIPO) in Kentucky and nationally.
Contributor Information
Dhaval Dave, Email: ddave@bentley.edu.
Andrew I. Friedson, Email: andrew.friedson@ucdenver.edu.
Kyutaro Matsuzawa, Email: qmatsuzawa@gmail.com.
Joseph J. Sabia, Email: jsabia@sdsu.edu.
REFERENCES
- Abouk, R. , and Heydari B.. “The Immediate Effect of COVID‐19 Policies on Social Distancing Behavior in the United States.” 2010. Available at SSRN: https://ssrn.com/abstract=3571421. [DOI] [PMC free article] [PubMed]
- Allday, E. 2020. “Bay Area Orders ‘Shelter in Place,’ Only Essential Businesses Open in 6 Counties.” San Francisco Chronicle, March 16, 2020. Available at: https://www.sfchronicle.com/local‐politics/article/Bay‐Area‐must‐shelter‐in‐place‐Only‐15135014.php.
- Angrist, J. D. , and Pischke J. S.. Mostly Harmless Econometrics: An empiricist's Companion. Princeton university press, 2008. [Google Scholar]
- Arnold, C. 2020. “America Closed; Thousands of Stores, Resorts, Theaters Shut Down.” NPR, March 16, 2020. Available at: https://www.npr.org/2020/03/16/816398498/america‐closed‐thousands‐of‐stores‐resorts‐theaters‐shut‐down.
- Australian Government Department of Health . “Social Distancing for Coronavirus (COVID‐19).” 2020. Available at: https://www.health.gov.au/news/health‐alerts/novel‐coronavirus‐2019‐ncov‐health‐alert/how‐to‐protect‐yourself‐and‐others‐from‐coronavirus‐covid‐19/social‐distancing‐for‐coronavirus‐covid‐19.
- Barr, L. “To Enforce Coronavirus Distancing, Police Say Arrests Are Last Resort”. ABC News, March 31, 2020. Available at: https://abcnews.go.com/Health/enforce‐coronavirus‐distancing‐police‐arrests‐resort/story?id=69885017.
- Bertrand, M. , Duflo E., and Mullainathan S.. “How Much Should we Trust Differences‐in‐Differences Estimates?” The Quarterly Journal of Economics, 119(1), 2004, 249–75. [Google Scholar]
- Brown, K.V. , and Court E., “U.S. Labs Face Crisis After Crisis Despite Improvements in Testing.” Bloomberg, 2020, https://www.bloomberg.com/news/articles/2020‐04‐07/coronavirus‐testing‐accuracy‐and‐availability‐shortages‐remain. [Google Scholar]
- Caswell, B. “Stay‐At‐Home Order Now in Effect: What You Need to Know.” Dayton Now, March 23, 2020. Available at: https://dayton247now.com/news/local/stay‐at‐home‐order‐goes‐into‐effect‐at‐midnight‐what‐you‐need‐to‐know.
- Centers for Disease Control and Prevention . “Cases in U.S.” 2020a. Available at: https://www.cdc.gov/coronavirus/2019‐ncov/cases‐updates/cases‐in‐us.html.
- Centers for Disease Control and Prevention . “Coronavirus Disease 2019 (COVID‐19): How It Spreads.” 2020b. Available at: https://www.cdc.gov/coronavirus/2019‐ncov/prevent‐getting‐sick/how‐covid‐spreads.html?CDC_AA_refVal=https%3A%2F%2Fwww.cdc.gov%2Fcoronavirus%2F2019‐ncov%2Fprepare%2Ftransmission.html.
- Centers for Disease Control and Prevention . “Interim Infection Control Guidance for Public Health Personnel Evaluating Persons Under Investigation (PUIs) and Asymptomatic Close Contacts of Confirmed Cases at Their Home or Non‐Home Residential Settings.” 2020c. Available at: https://www.cdc.gov/coronavirus/2019‐ncov/php/guidance‐evaluating‐pui.html.
- Commonwealth of Massachusetts . “Governor Charlie Baker Orders All Non‐Essential Businesses To Cease In Person Operation, Directs the Department of Public Health to Issue Stay at Home Advisory For Two Weeks” March 23, 2020. Available at: https://www.mass.gov/news/governor‐charlie‐baker‐orders‐all‐non‐essential‐businesses‐to‐cease‐in‐person‐operation.
- Courtemanche, C. J. , Garuccio J., Le A., Pinkston J. C., and Yelowitz A.. “Did Social‐Distancing Measures in Kentucky Help to Flatten the COVID‐19 Curve?” Institute for the Study of Free Enterprise Working Paper 2020‐4, 2020a.
- Courtemanche, C. , Garuccio J., Le A., Pinkston J., and Yelowitz A.. “Strong Social Distancing Measures In The United States Reduced The COVID‐19 Growth Rate.” Health Affairs, 39(7), 2020, 1237–1246. 10.1377/hlthaff.2020.00608. [DOI] [PubMed] [Google Scholar]
- Cox, J. . “U.S. Weekly Jobless Claims Double to 6.6 Million.” CNBC, April 2, 2020. Available at: https://www.cnbc.com/2020/04/02/weekly‐jobless‐claims.html.
- Dave, D. , Friedson A., Matsuzawa K., Sabia J. J., and Safford S.. “Were Urban Cowboys Enough to Control COVID‐19? Local Shelter‐in‐Place Orders and Coronavirus Case Growth.” IZA Discussion Paper No. 13262, 2020. [DOI] [PMC free article] [PubMed]
- Fauci, A. “Long Before COVID‐19, Dr. Anthony Fauci ‘Changed Medicine in America Forever’.” April 16, 2020. Available at: https://www.npr.org/sections/health‐shots/2020/04/16/834873162/long‐before‐covid‐19‐dr‐tony‐fauci‐changed‐medicine‐in‐america‐forever.
- Fineberg, H. “Rapid Expert Consultation on the Possibility of Bioaerosol Spread of SARS‐CoV‐2 for the COVID‐19 Pandemic.” The National Academies of Science, Engineering, Medicine, April 1, 2020. Available at: https://www.nap.edu/read/25769/chapter/1#3.
- Florida, R. “The Geography of Coronavirus.” Citylab, 2020, https://www.citylab.com/equity/2020/04/coronavirus‐spread‐map‐city‐urban‐density‐suburbs‐rural‐data/609394/. [Google Scholar]
- Francassa, D. “Bay Area Coronavirus: How Life Has Changed After 20 Days of Shelter‐In‐Place Order.” San Francisco Chronicle, April 6, 2020. Available at: https://www.sfchronicle.com/bayarea/article/Bay‐Area‐to‐shelter‐in‐place‐What‐you‐need‐15135087.php.
- Friedson, A. , McNichols D., Sabia J. J., and Dave D.. “Did California's Shelter‐in‐Place Order Work? Early Coronavirus‐Related Public Health Effects.” NBER Working Paper No. 26992, 2020.
- Fry, H. “As Coronavirus Spreads, Los Angeles County Scores an A in Social Distancing; Other Counties Lag.” Los Angeles Times, March 31, 2020. Available at: https://www.latimes.com/california/story/2020‐03‐31/lcoronavirus‐los‐angeles‐scores‐an‐a‐in‐social‐distancing‐according‐to‐a‐gps‐tracking‐project.
- Goodman‐Bacon, A. “Difference‐in‐Differences with Variation in Treatment Timing.” NBER Working Paper No. 25108, 2018.
- Herbert, G. R. “Directive to the State of Utah: The Governor's Coronavirus Directive for Utah “Stay Safe, Stay Home”.” March 27, 2020. Available at: https://drive.google.com/file/d/1Qey2xIxAEqIxiiAHJyHSxBosmjetkbN7/view.
- Herrman, J. “New York City is Social Distancing.” New York Times, March 18, 2020. Available at: https://www.nytimes.com/2020/03/18/style/coronavirus‐social‐distancing‐new‐york.html.
- Holshue, M. L. , DeBolt C., Lindquist S., Lofy K. H., Wiesman J., Bruce H., Spitters C., Ericson K., Wilkerson S., Tural A., Diaz G., Cohn A., Fox L., Patel A., Gerber S. I., Kim L., Tong S., Lu X., Lindstrom S., Pallansch M. A., Weldon W. C., Biggs H. M., Uyeki T. M., Pillai S. K., and Washington State 2019‐nCoV Case Investigation Team . “First Case of 2019 Novel Coronavirus in the United States.” New England Journal of Medicine, 382(10), 2020, 929–36. [DOI] [PMC free article] [PubMed] [Google Scholar]
- Lasry, A. , Kidder D., Hast M., Poovey J., Sunshine G., Zviedrite N., Ahmed F., and Ethier K. A.. “Timing of Community Mitigation and Changes in Reported COVID‐19 and Community Mobility—Four U.S. Metropolitan Areas, February 26–April 1, 2020.” CDC Morbidity and Mortality Weekly Report, April 17, 2020. Available at: https://www.cdc.gov/mmwr/volumes/69/wr/mm6915e2.htm?s_cid=mm6915e2_x. [DOI] [PMC free article] [PubMed]
- Lauer, S. A. , Grantz K. H., Bi Q., Jones F. K., Zheng Q., Meredith H. R., Azman A. S., Reich N. G., and Lessler J.. “The Incubation Period of Coronavirus Disease 2019 (COVID‐19) from Publicly Reported Confirmed Cases: Estimation and Application.” Annals of Internal Medicine, 172(9), 2020, 577–82. [DOI] [PMC free article] [PubMed] [Google Scholar]
- Lee, J. Y. , and Solon G.. “The Fragility of Estimated Effects of Unilateral Divorce Laws on Divorce Rates.” The BE Journal of Economic Analysis & Policy, 11(1), 2011. [Google Scholar]
- Li, P. , Fu J.‐B., Li K.‐F., Chen Y., Wang H.‐L., Liu L.‐J., Liu J.‐N., Zhang Y.‐L., Liu S.‐L., Tang A., Tong Z.‐D., and Yan J.‐B.. “Transmission of COVID‐19 in the Terminal Stage of Incubation Period: A Familial Cluster.” International Journal of Infectious Diseases, 96, 2020, 452–3. [DOI] [PMC free article] [PubMed] [Google Scholar]
- Martineau, P. “What's a ‘Shelter In Place’ Order, and Who's Affected?” Wired, March 20, 2020. Available at: https://www.wired.com/story/whats‐shelter‐place‐order‐whos‐affected/.
- Mervosh, S. , Lu D., and Swales V.. “See Which States and Cities Have Told Residents to Stay at Home.” The New York Times, April 7, 2020. Available at: https://www.nytimes.com/interactive/2020/us/coronavirus‐stay‐at‐home‐order.html.
- Napoleon, C. . “Police Hoping Public Adheres to Holcomb's Shelter‐In‐Place Order, But Will Be Vigilant About Enforcement.” Chicago Tribune, March 31, 2020. Available at: https://www.chicagotribune.com/suburbs/post‐tribune/ct‐ptb‐police‐holcomb‐enforcement‐st‐0326‐20200331‐cdng7tjsb5gm5asmd3jh5pttjy‐story.html.
- Painter, M. , and Qiu T.. “Political Beliefs affect Compliance with COVID‐19 Social Distancing Orders.” 2020. Available at SSRN: https://ssrn.com/abstract=3569098.
- Pichler, S. , Wen K., and Ziebarth N.. “Positive Health Externalities of Mandating Paid Sick Leave.” Cornell University Working Paper, 2020.
- Pichler, S. , and Ziebarth N.. “The Pros and Cons of Sick Pay Schemes: Testing for Contagious Presenteeism and Noncontagious Absenteeism Behavior.” Journal of Public Economics, 156, 2017, 14–33. [Google Scholar]
- Public Health Agency of Canada . “Community‐Based Measures to Mitigate the Spread of Coronavirus Disease (COVID‐19) in Canada.” 2020. Available at: https://www.canada.ca/en/public‐health/services/diseases/2019‐novel‐coronavirus‐infection/health‐professionals/public‐health‐measures‐mitigate‐covid‐19.html.
- Public Health England . “Guidance on Social Distancing for Everyone in the U.K.” 2020. Available at: https://www.gov.uk/government/publications/covid‐19‐guidance‐on‐social‐distancing‐and‐for‐vulnerable‐people/guidance‐on‐social‐distancing‐for‐everyone‐in‐the‐uk‐and‐protecting‐older‐people‐and‐vulnerable‐adults.
- Ronayne, K. , and Thompson D.. “California Governor Issues Statewide Stay‐At‐Home Order.” AP News, March 18, 2020. Available at: https://apnews.com/9ca4a191790dd6f80bd5acec569ec423.
- Rosenthal, B. “Density Is New York City's Big ‘Enemy’ in the Coronavirus Fight.” The New York Times, March 23, 2020. Available at: https://www.nytimes.com/2020/03/23/nyregion/coronavirus‐nyc‐crowds‐density.html.
- Sandford, A. “Coronavirus: Half of Humanity Now on Lockdown as 90 Countries Call for Confinement.” Euronews, April 2, 2020. Available at: https://www.euronews.com/2020/04/02/coronavirus‐in‐europe‐spain‐s‐death‐toll‐hits‐10‐000‐after‐record‐950‐new‐deaths‐in‐24‐hou.
- Sears, J. , Villas‐Boas J. M., Villas‐Boas V., and Villas‐Boas S.. “Are We #StayingHome to Flatten the Curve?” Department of Agricultural and Resource Economics. CUDARE Working Papers, 2020. Available at SSRN: https://ssrn.com/abstract=3569791.
- Solon, G. , Haider S. J., and Wooldridge J. M.. “What Are We Weighting For?” Journal of Human Resources, 50(2), 2015, 301–16. [Google Scholar]
- State of Maryland . “Order of the Governor of the State of Maryland Number 20‐03‐30‐01.” 2020. Available at: https://governor.maryland.gov/wp‐content/uploads/2020/03/Gatherings‐FOURTH‐AMENDED‐3.30.20.pdf.
- State of Minnesota . “Emergency Executive Order 20‐20.” 2020. Available at: https://mn.gov/governor/assets/3a.%20EO%2020‐20%20FINAL%20SIGNED%20Filed_tcm1055‐425020.pdf.
- Sun, L. , and Abraham S.. “Estimating Dynamic Treatment Effects in Event Studies with Heterogeneous Treatment Effects.” Working Paper, 2020.
- U.S. Department of Labor . “News Release: Unemployment Insurance Weekly Claims.” March 26, 2020. Available at: https://www.dol.gov/ui/data.pdf.
- Wang D., Hu B., Hu C., Zhu F., Liu X., Zhang J., Wang B., Xiang H., Cheng Z., Xiong Y., Zhao Y., Li Y., Wang X., and Peng Z. “Clinical Characteristics of 138 Hospitalized Patients With 2019 Novel Coronavirus‐Infected Pneumonia in Wuhan, China.” JAMA, 323(11), 2020, 1061, 10.1001/jama.2020.1585. [DOI] [PMC free article] [PubMed] [Google Scholar]
- Warren, M. S. “Here's Why New Jersey and New York Are The Epicenter of The Coronavirus Pandemic.” NJ.com, March 28, 2020. Available at: https://www.nj.com/news/2020/03/heres‐why‐new‐jersey‐and‐new‐york‐are‐the‐epicenter‐of‐the‐coronavirus‐pandemic.html.
- Weaver, K. “Oklahoma Governor Kevin Stitt Issues ‘Safer‐At‐Home’ Order.” News On 6, March 24, 2020. Available at: https://www.newson6.com/story/41935263/okla‐gov‐kevin‐stitt‐issues‐saferathome‐order.
- Webber, T. “Residents Snitch on Businesses, Neighbors Amid Shutdowns.” The Associated Press, April 2, 2020. Available at: https://apnews.com/343ed4a8e95dfc8f8dda87b9e450ca57.
- White House . “The President's Coronavirus Guidelines for America.” 2020. Available at: https://www.whitehouse.gov/wp‐content/uploads/2020/03/03.16.20_coronavirus‐guidance_8.5x11_315PM.pdf.
- World Health Organization . “Rolling Updates on Coronavirus Disease (COVID‐19).” 2020a. Available at: https://www.who.int/emergencies/diseases/novel‐coronavirus‐2019/events‐as‐they‐happen.
- World Health Organization . “Q&A: Similarities and Differences – COVID‐19 and Influenza.” 2020b. Available at: https://www.who.int/news‐room/q‐a‐detail/q‐a‐similarities‐and‐differences‐covid‐19‐and‐influenza.
- World Health Organization . “Shortage of Personal Protective Equipment Endangering Health Workers Worldwide.” March 3, 2020c. Available at: https://www.who.int/news‐room/detail/03‐03‐2020‐shortage‐of‐personal‐protective‐equipment‐endangering‐health‐workers‐worldwide.
- Wu, C. , Chen X., Cai Y., Xia J.'a., Zhou X., Xu S., Huang H., Zhang L., Zhou X., Du C., Zhang Y., Song J., Wang S., Chao Y., Yang Z., Xu J., Zhou X., Chen D., Xiong W., Xu L., Zhou F., Jiang J., Bai C., Zheng J., and Song Y.. “Risk Factors Associated with Acute Respiratory Distress Syndrome and Death in Patients with Coronavirus Disease 2019 Pneumonia in Wuhan, China.” JAMA Internal Medicine, 180(7), 2020, 934. [DOI] [PMC free article] [PubMed] [Google Scholar]
- Yancey‐Bragg, N. “Going to a drive‐thru COVID‐19 Testing Site? Here's a Step‐By‐Step Look at What to Expect.” USA Today, 2020, https://www.usatoday.com/story/news/health/2020/03/20/drive‐thru‐coronavirus‐testing‐step‐step‐look‐what‐expect/287332400. [Google Scholar]
- Zhou, F. , Yu T., Du R., Fan G., Liu Y., Liu Z., Xiang J., Wang Y., Song B., Gu X., Guan L., Wei Y., Li H., Wu X., Xu J., Tu S., Zhang Y., Chen P. H., and Cao P. B.. “Clinical Course and Risk Factors for Mortality of Adult Inpatients with COVID‐19 in Wuhan, China: A Retrospective Cohort Study.” The Lancet, 395(10229), 2020, 1054–62. [DOI] [PMC free article] [PubMed] [Google Scholar]
Associated Data
This section collects any data citations, data availability statements, or supplementary materials included in this article.
Supplementary Materials
Appendix S1. Supporting information