

Abstract
Moesin, an ezrin-radixin-moesin (ERM) family member, is involved in the regulation of cell adhesion, polarity and migration by cross-linking between the actin cytoskeleton and plasma membrane. The primary effector cell in hepatic fibrosis is the hepatic stellate cell (HSC), which undergoes activation during liver injury leading to increased extracellular matrix production. Here, we have hypothesized that moesin plays a critical role in linking the HSC cytoskeleton to the fibrogenic cascade during HSC activation. Moesin phosphorylation was upregulated during HSC activation and fibrogenesis. Using moesin wild-type and mutant constructs (phosphomimicking-T558D and nonphosphorylatable-T558A), we found that cellular motility and contraction were increased in moesin WT- and T558D-infected cells, paralleled by an increase in SMα-actin and collagen I expression. In contrast, overexpression of nonphosphorylatable moesin and moesin knockout decreased cellular motility and contraction. Most importantly, moesin knockout led to abrogation of liver fibrosis. The mechanism of moesin’s effect was a reduction in myocardin related transcription factor-A (MRTF-A) and serum response factor (SRF) mediated changes in the actin cytoskeleton, which in turn modulated the expression of matrix genes. Taken together, our findings suggest that the linkage between cytoskeletal dynamics and correlated MRTF/SRF signaling pathway has a pivotal role in HSCs activation and fibrogenesis.
Keywords: hepatic stellate cells, actin, cytoskeleton, liver, extracellular matrix
Introduction
It is well established that activated hepatic stellate cells (HSCs) play an important role in the development of liver fibrosis (1, 2). In the normal liver, HSCs exhibit a quiescent phenotype, but after liver injury, they undergo differentiation into myofibroblast-like cells with subsequent proliferation, synthesis of extracellular matrix, and smooth muscle alpha-actin. The activation process is characterized by the development of a robust cytoskeleton that in turn is responsible for a number of critical HSC functions (1, 3, 4).
Moesin is a member of the ezrin-radixin-moesin (ERM) family and plays an important role in mediating the binding of F-actin to the plasma membrane and thus is involved in many cellular functions, such as cell migration, growth, adhesion, cell polarization, motility and fibrosis (5–11). All ERM proteins contain two ERM association domains: the NH2- terminus is homologous to the membrane binding domain, and at the COOH terminus has an Filamentous-actin (F-actin) binding domain. The NH2 terminal domain of ERM proteins bind to plasma membrane via direct interaction with membrane proteins or lipid, or indirectly through adaptor proteins (5, 6, 12). Current evidence suggests that NH2- and COOH-terminal domains also bind to each other in a dormant state, preventing COOH-terminal ERM interaction with F-actin, but the conformationally “closed” ERM maintains interaction with the membrane, albeit with reduced affinity compared with “open” ERM proteins (12). There is also evidence that the ERM proteins are important for cell–cell and cell–matrix contacts – potentially through interactions with focal adhesions complexes and integrins (13, 14) – as well as for the reorganization of the cytoskeleton (5, 12). In liver, ezrin is expressed in cholangiocytes, radixin is expressed in canalicular membrane of hepatocytes, and moesin has been reported to be expressed in HSCs and liver sinusoidal endothelial cells (8, 15).
In the present study, we have hypothesized that moesin plays a critical role in linking the HSC cytoskeleton to the fibrogenic cascade during stellate cell activation. We have used both a well validated in vitro primary HSC culture model and in vivo liver injury model to examine the role of moesin in liver fibrosis. We find that cell motility and contraction was induced by moesin phosphorylation. Most importantly, we found that the absence of moesin decreased MRTF-A and SRF expression - and increased globular actin (G-actin) polymerization which prevented MRTF-A shuttling to the nucleus. Consequently, decreased MRTF-A and SRF abrogated transcriptional activation of collagen, resulting in a reduction in fibrogenesis.
Experimental Procedures
Animal Models of Liver Injury and Cell Culture
Sprague Dawley male rats (400–500 g) were purchased from Charles River Laboratory and moesin knockout mice were generated on a 129 × C57BL/6 background via the conventional gene-trapping system as described (16). Animals were housed in MUSCs animal facility following NIH and IACUC guidelines. Liver fibrosis was induced by carbon tetrachloride (CCl4) (given by gavage once a week for 6 weeks) and common bile duct was ligation (BDL) as described (17, 18). HSCs were isolated by in situ enzymatic digestion of normal or fibrotic liver and purified by Accudenz (Accurate Chemicals, Westbury, NY) gradient as described (18). Freshly isolated HSCs were cultured in standard 199OR medium containing 10% calf serum and 10% horse serum (Invitrogen, Grand Island, NY) in a 3% CO2 incubator at 37 °C otherwise stated. Hepatocytes, sinusoidal endothelial cells and cholangiocytes were isolated and purified as described (17, 19, 20).
Recombinant Adenovirus Constructs and Infection of HSCs
To generate recombinant adenovirus-cyan fluorescent protein (CFP)-tagged moesin expression system, mouse moesin was isolated and a pcDNA 3.1/moesin vector inserted into a shuttle vector pDC311-CFP. Constructs were (pDC311/moesin-CFP and pBHGloxDE1,3Cre) cotransfected into HEK293 cells, with recombination leading to virus production. A single viral colony was isolated, amplified, and titrated. Aliquots of virus were stored at −80°C.
Site-directed mutatagenesis of moesin (T558A and T558D) was performed with the QuikChange II site-directed mutagenesis kit according to the manufacturer’s instructions (Agilent Technologies, Santa Clara, CA). HSCs were isolated, grown for 2 days in culture, and then infected with adenoviral vectors (100 MOI) in standard 199OR medium for 3 days as described (16). Adenovirus containing CFP only was used as a control.
Assessment of liver morphology and fibrosis, serum chemistry, intrahepatic bile duct mass and biliary proliferation
Livers were perfused with PBS (pH 7.4) and 4% phosphate-buffered formaldehyde and tissue sections (5μm) were dehydrated with xylene, and rehydrated with decreasing ethanol grades. Sections were stained with picrosirius red stain as described (18). Hematoxylin and eosin (H&E) staining was performed in paraffin-embedded liver sections. Portal inflammation grading was performed as described (21). Serum alanine aminotransferase (ALT) and total bilirubin levels were measured in WT and moesin KO animals (control, CCI4-trated, sham, BDL) by using a Catalyst One Chemistry analyzer from IDEXX Lab (Westbrook, Maine). Intrahepatic bile duct mass was evaluated by semiquantitative immunohistochemistry to detect cytokeratin-19 (CK-19) as previously described (20, 22). Hydroxyproline assay was performed according to the method described previously (23).
Real-Time PCR (RT-PCR)
RNA from HSCs was isolated using Trizol (Invitrogen) and 1–2 μg of total RNA was used for first-strand cDNA synthesis with SuperScript III (Invitrogen). Resulting cDNA was PCR amplified and SYBR green supermix (BioRad, Hercules, CA) on a BioRad CFX Connect Real-Time PCR Detection System (18).
Cell Contraction and Wound-Healing Assays
HSCs were isolated and grown on collagen gels (Advanced Biomatrix, San Diego, CA) as described (18). Cells were exposed to adenovirus (100 MOI) on the second day of culture and incubated for 3 further days. Standard medium was exchanged for serum free medium, and gels were released from the plastic substratum, after which gel area was measured as described.
Cell migration was measured as per the manufacturer’s instructions (Cell Biolabs, San Diego, CA). In brief, cells were isolated and placed in 24-well plates containing a specific insert in each well bottom to divide cells equally. Following 2 days of culture, the insert was removed and formed a clear, sharp demarcation on the plastic substrate. HSCs were exposed to adenovirus (100 MOI) in standard serum containing medium, and cell movement was measured over time as described (18).
Immunoblotting
Immunoblotting was performed as described (6, 18). Briefly, cells were lysed, protein samples were then separated on a SDS-PAGE gel, transferred onto nitrocellulose membrane, and probed with anti–moesin, anti-phospho ERM (for phospho-moesin), anti-MRTF-A, and anti–SRF, anti-SM α actin, anti-type 1 collagen, ant-desmin, anti-CK-19, anti-integrin beta 3, anti-eNOS or α-tubulin antibodies. Specific signals were captured using chemiluminescence and with a Syngene G-Box digital imaging system (Syngene, Frederick, MD); quantitative data were obtained using the system’s software.
Immunofluorescence microscopy and live cell imaging
To double-stain SM α actin and moesin or phospho moesin, HSCs were grown on coverslips and infected with recombinant adenoviruses. After 36 h, cells were fixed with 3.7% formaldehyde, permeabilized with 0.1% Triton X-100, and then incubated with rabbit anti- anti-SM α actin, moesin or phospho-moesin, followed by incubation with Alexa-555 or Alexa 488-secondary antibodies. Finally, cells were stained with DAPI (Sigma) for 15 min before mounting with FluorSave solution (Calbiochem, San Diego, CA). Images were obtained using a Zeiss fluorescence microscope (Carl Zeiss Inc., Thornwood, New York). For live cell imaging, HSCs were seeded on glass-bottom cell culture dishes and infected with recombinant adenoviruses. After 36 h post infection, CFP images were collected using fluorescence microscopy with a Zeiss AxioObserver Z1 microscope (Carl Zeiss, Thornwood, NY). In order to determine the presence of proteins of interest in the liver of animals subjected to various treatments, immunofluorescence (IF) labeling of frozen sections was used, followed by fluorescence microscopy with a Zeiss AxioObserver Z1 microscope, as described before (17). For quantitative assessment of protein expression, the staining of each immunohistochemical specimen was captured in randomly selected fields and quantitated using Image J software (NIH, Bethesda, MD).
G-Actin/F-actin Assay
In order to determne the relative proportions of filamentous actin (F-actin) and free globular-actin (G-actin), in moesin wild type and moesin knockout HSCs, we used the G-actin/F-actin in vivo Assay Biochem Kit as per the manufacturer’s instructions (Cytoskeleton, Inc. Denver, CO). In brief, HSCs were homogenized in F-actin stabilization buffer, followed by centrifugation to separate the F-actin from G-actin pool. The fractions were separated by SDS-PAGE and actin was quantitated by immunoblotting. The resulting ratio of F-actin incorporated into the cytoskeleton and G-actin found in the cytosol was determined. As a positive control we used actin polymerizing drug jasplakinolide.
Statistical Analysis
Quantitative data were analyzed with Microsoft Excel software. Bar graphs represent mean ± standard deviation. Significance (p<0.05 or p<0.01) was assessed by the Student’s t-test.
Results
Cellular distribution of moesin
To clarify the cellular source of moesin in whole liver, we examined moesin expression in isolated mouse HSCs, sinusoidal endothelial cells (SECs), hepatocytes and cholangiocytes by immunoblot (Figure 1 A, B); in immunoblot assays, moesin was identified in HSCs and SECs, but not in hepatocytes or cholangiocytes. In whole mouse liver sections that were dual-labeled with anti-moesin and anti-eNOS (the latter a SEC marker, Figure 1 B, upper panel), or anti-moesin and anti-desmin (the latter a HSC marker, Figure 1B, lower panel) moesin was identified in nonparenchymal cells, which, with co-labeling are shown to be HSCs and SECs.
Figure 1. Moesin expression in whole liver and isolated hepatic cells and moesin phosphorylation during HSC activation.
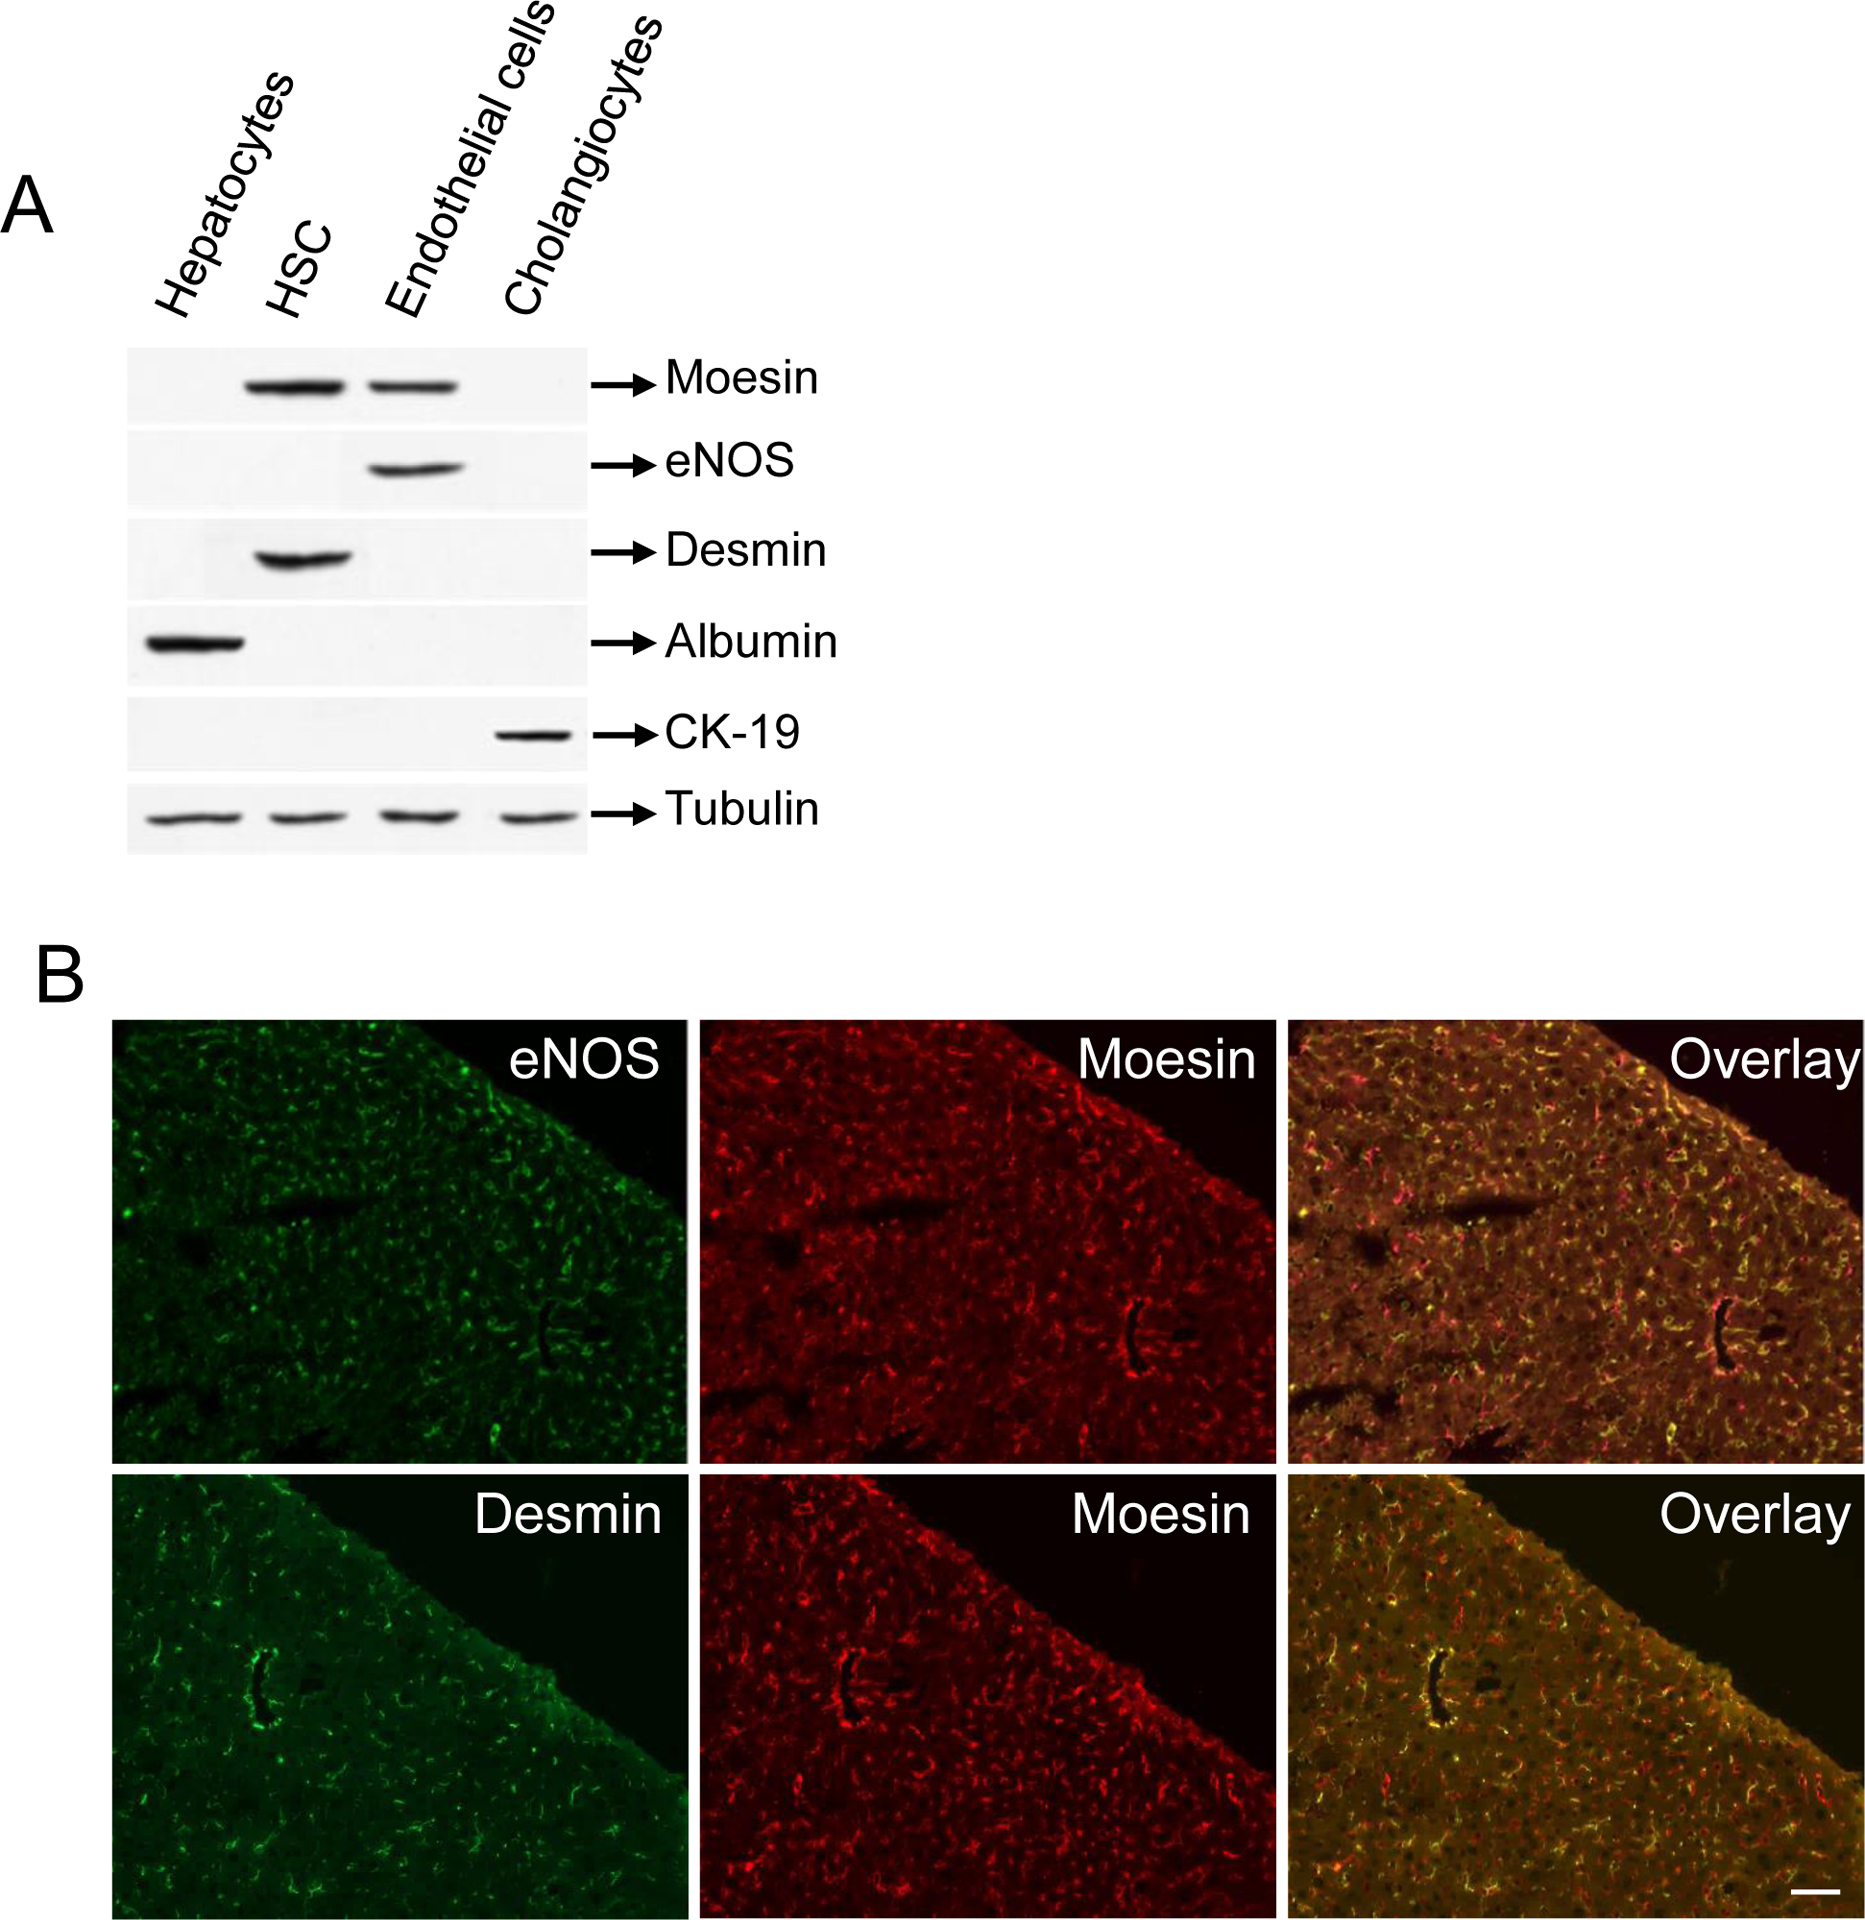
In (A), different liver cell types were isolated and cell lysates were subjected to immunoblot analysis as in methods. Representative images (of greater than 4 others) are shown. In (B), mouse liver sections were dual labeled with moesin and eNOS (upper panel) as well as moesin and desmin (lower panel). Representative images (of greater than 4 others) are shown. In (C), HSCs were isolated and grown for 1 day, 3 days or 7 days as described in Methods. At these time points, cell lysates were collected and subjected to immunoblot analysis to detect moesin and phospho-moesin as in Methods. Representative immunoblots (of greater than 4 others) are shown. In (D), HSCs were isolated after BDL induced liver injury (and in sham operated animals) as in Methods and plated overnight to allow complete cell recovery. Cell lysates were collected and subjected to immunoblot analysis. In (E), immunoblot data from (C) and (D), respectively, were scanned, quantitated, and presented graphically below the corresponding immunoblot lane (n = 4, *p< 0.01, phospho moesin expression after day 3 and day 7 – compared to day 1 and BDL cells compared to cells from sham operated cells).
Moesin and phospho-moesin expression in HSCs
We initially examined moesin expression during HSC activation, both in vitro and in vivo. During classic culture induced HSC induced activation, total moesin expression appeared to be unchanged, but phospho-moesin was substantially upregulated (Figure 1C). Similarly, phospho-moesin was upregulated during HSC activation in vivo after liver injury (Figure 1D).
Cellular localization of moesin and phospho-moesin in HSCs
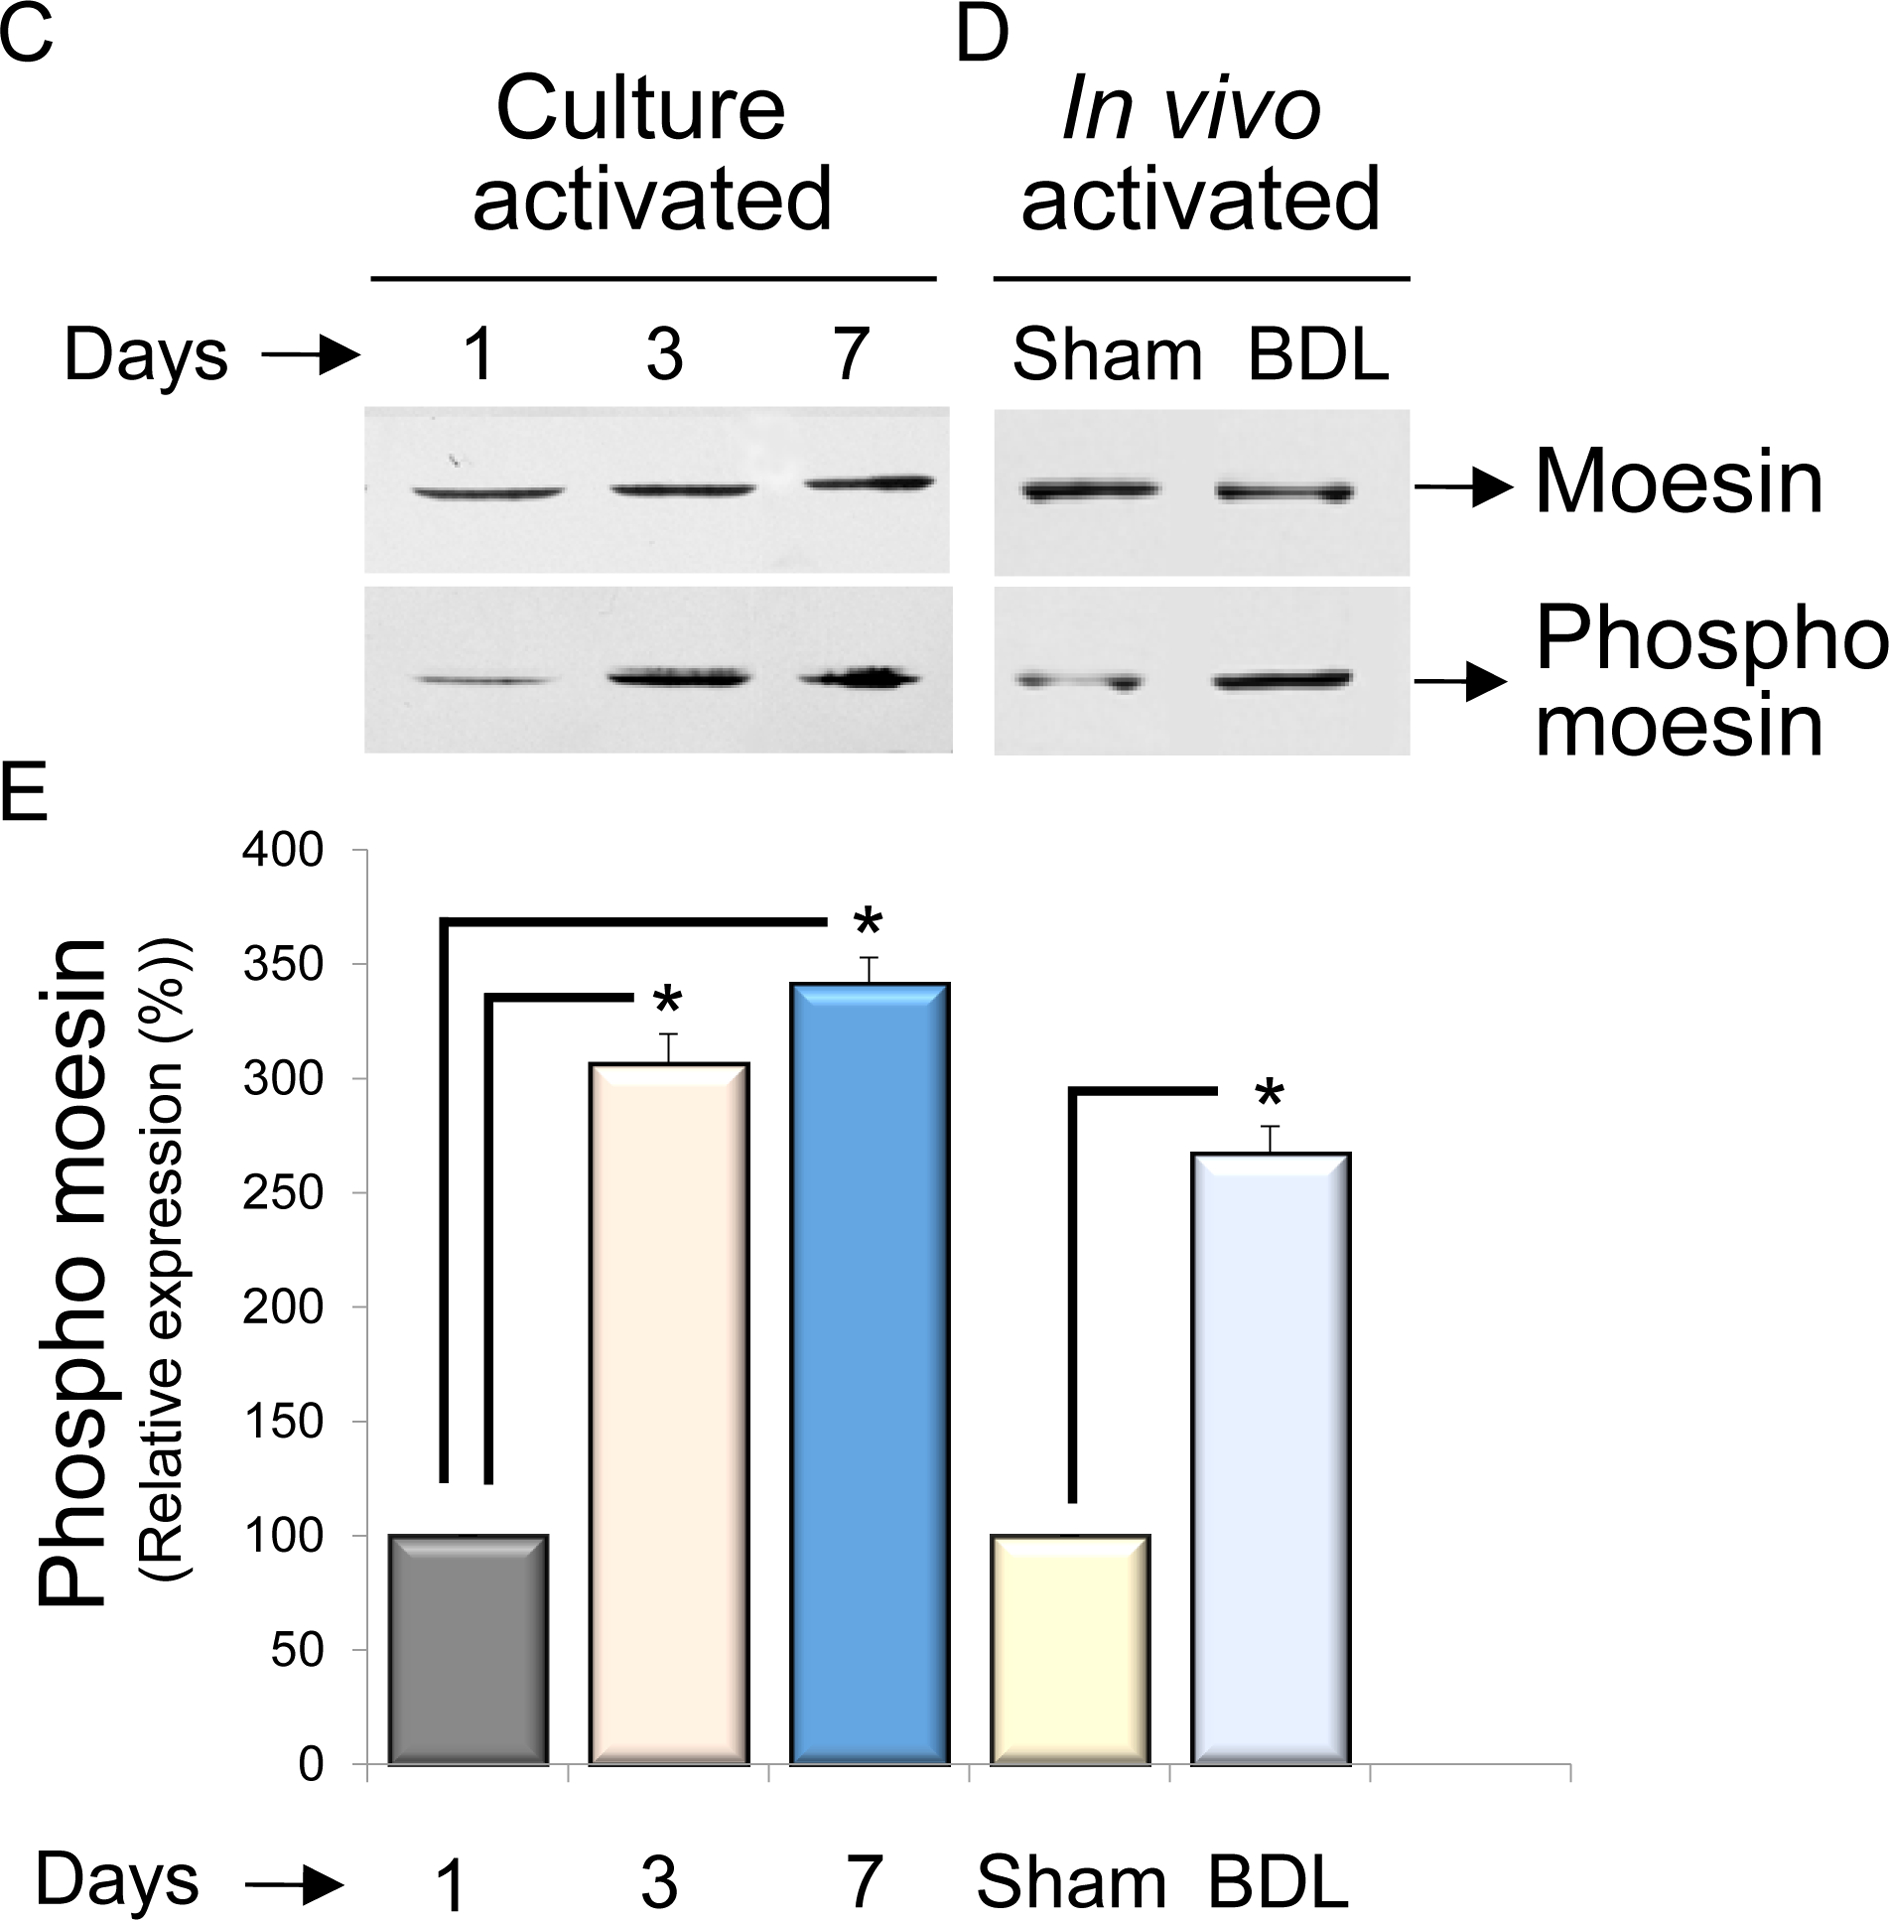
We next explored moesin and phospho-moesin localization in quiescent and cultured as well as BDL-activated HSCs (Figure 2). Immunofluorescence localization of moesin and phospho-moesin demonstrated that it was normally present in the plasma membrane and lamellipodial structures (Figure 2A, and 2B). SMα-actin was localized predominantly to the cytoplasmic spaces. As expected, expression of SMα-actin in quiescent cells was low.
Figure 2. Localization of moesin, phospho-moesin and smooth muscle α actin in HSCs.
Cultured stellate cells were maintained in culture for 36h as in Methods. Some cells were kept in quiescent condition. Cells were fixed and labeled to detect moesin (green – panel A), phospho-moesin (green – panel B) and SMα-actin (red – both panels) as in Methods. Representative images (of greater than 4 others) are shown, including merged images (overlay). The bar marker represents 10 μm.
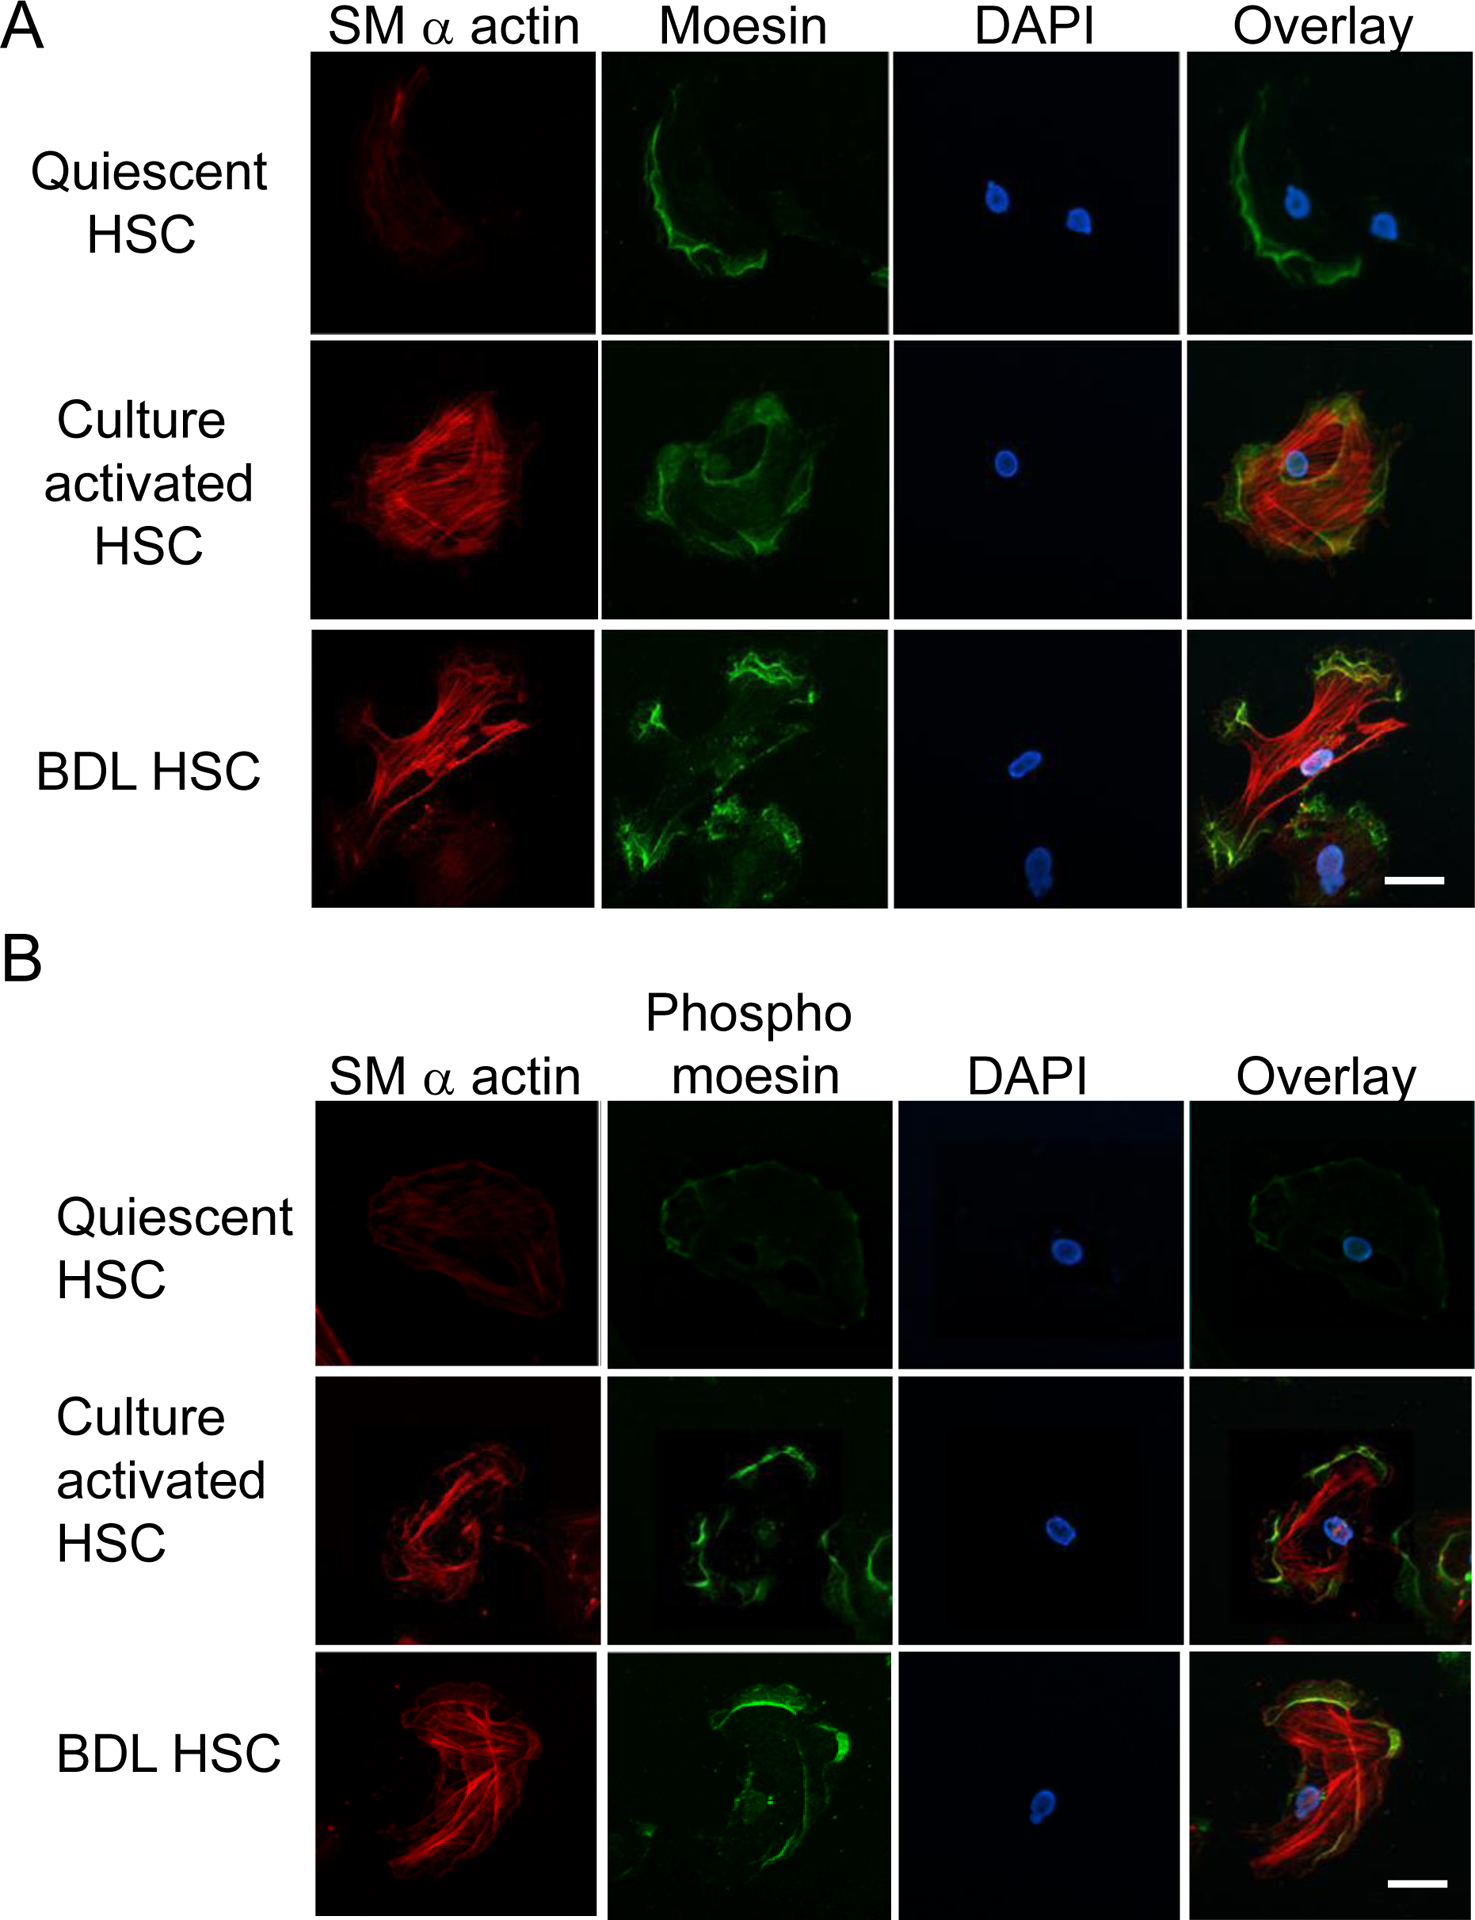
In order to determine more precisely identify the intracellular localization of moesin, we overexpressed both wild-type and moesin mutants (expressing CFP) in quiescent and activated HSCs using live cell imaging. Moesin was clearly expressed in HSCs beginning at approximately 12 h after infection. High levels of expression were observed by 36h post-infection (Figure 3). Overexpression of WT moesin in quiescent and activated HSCs revealed that moesin was localized in lamellipodia, similar to native moesin expression, with relatively little expression in the cytoplasmic space (Figure 3, left panels). In contrast, the dominant negative construct appeared to force moesin to the cytoplasm (Figure 3, middle panels). However, the phosphomimiking dominant active construct led to prominent moesin expression in the plasma membrane in the form of long microvillar and filopodial membrane extensions (Figure 3, right panels).
Figure 3. Cellular localization of exogenously expressed moesin wild type and mutants in live HSCs.
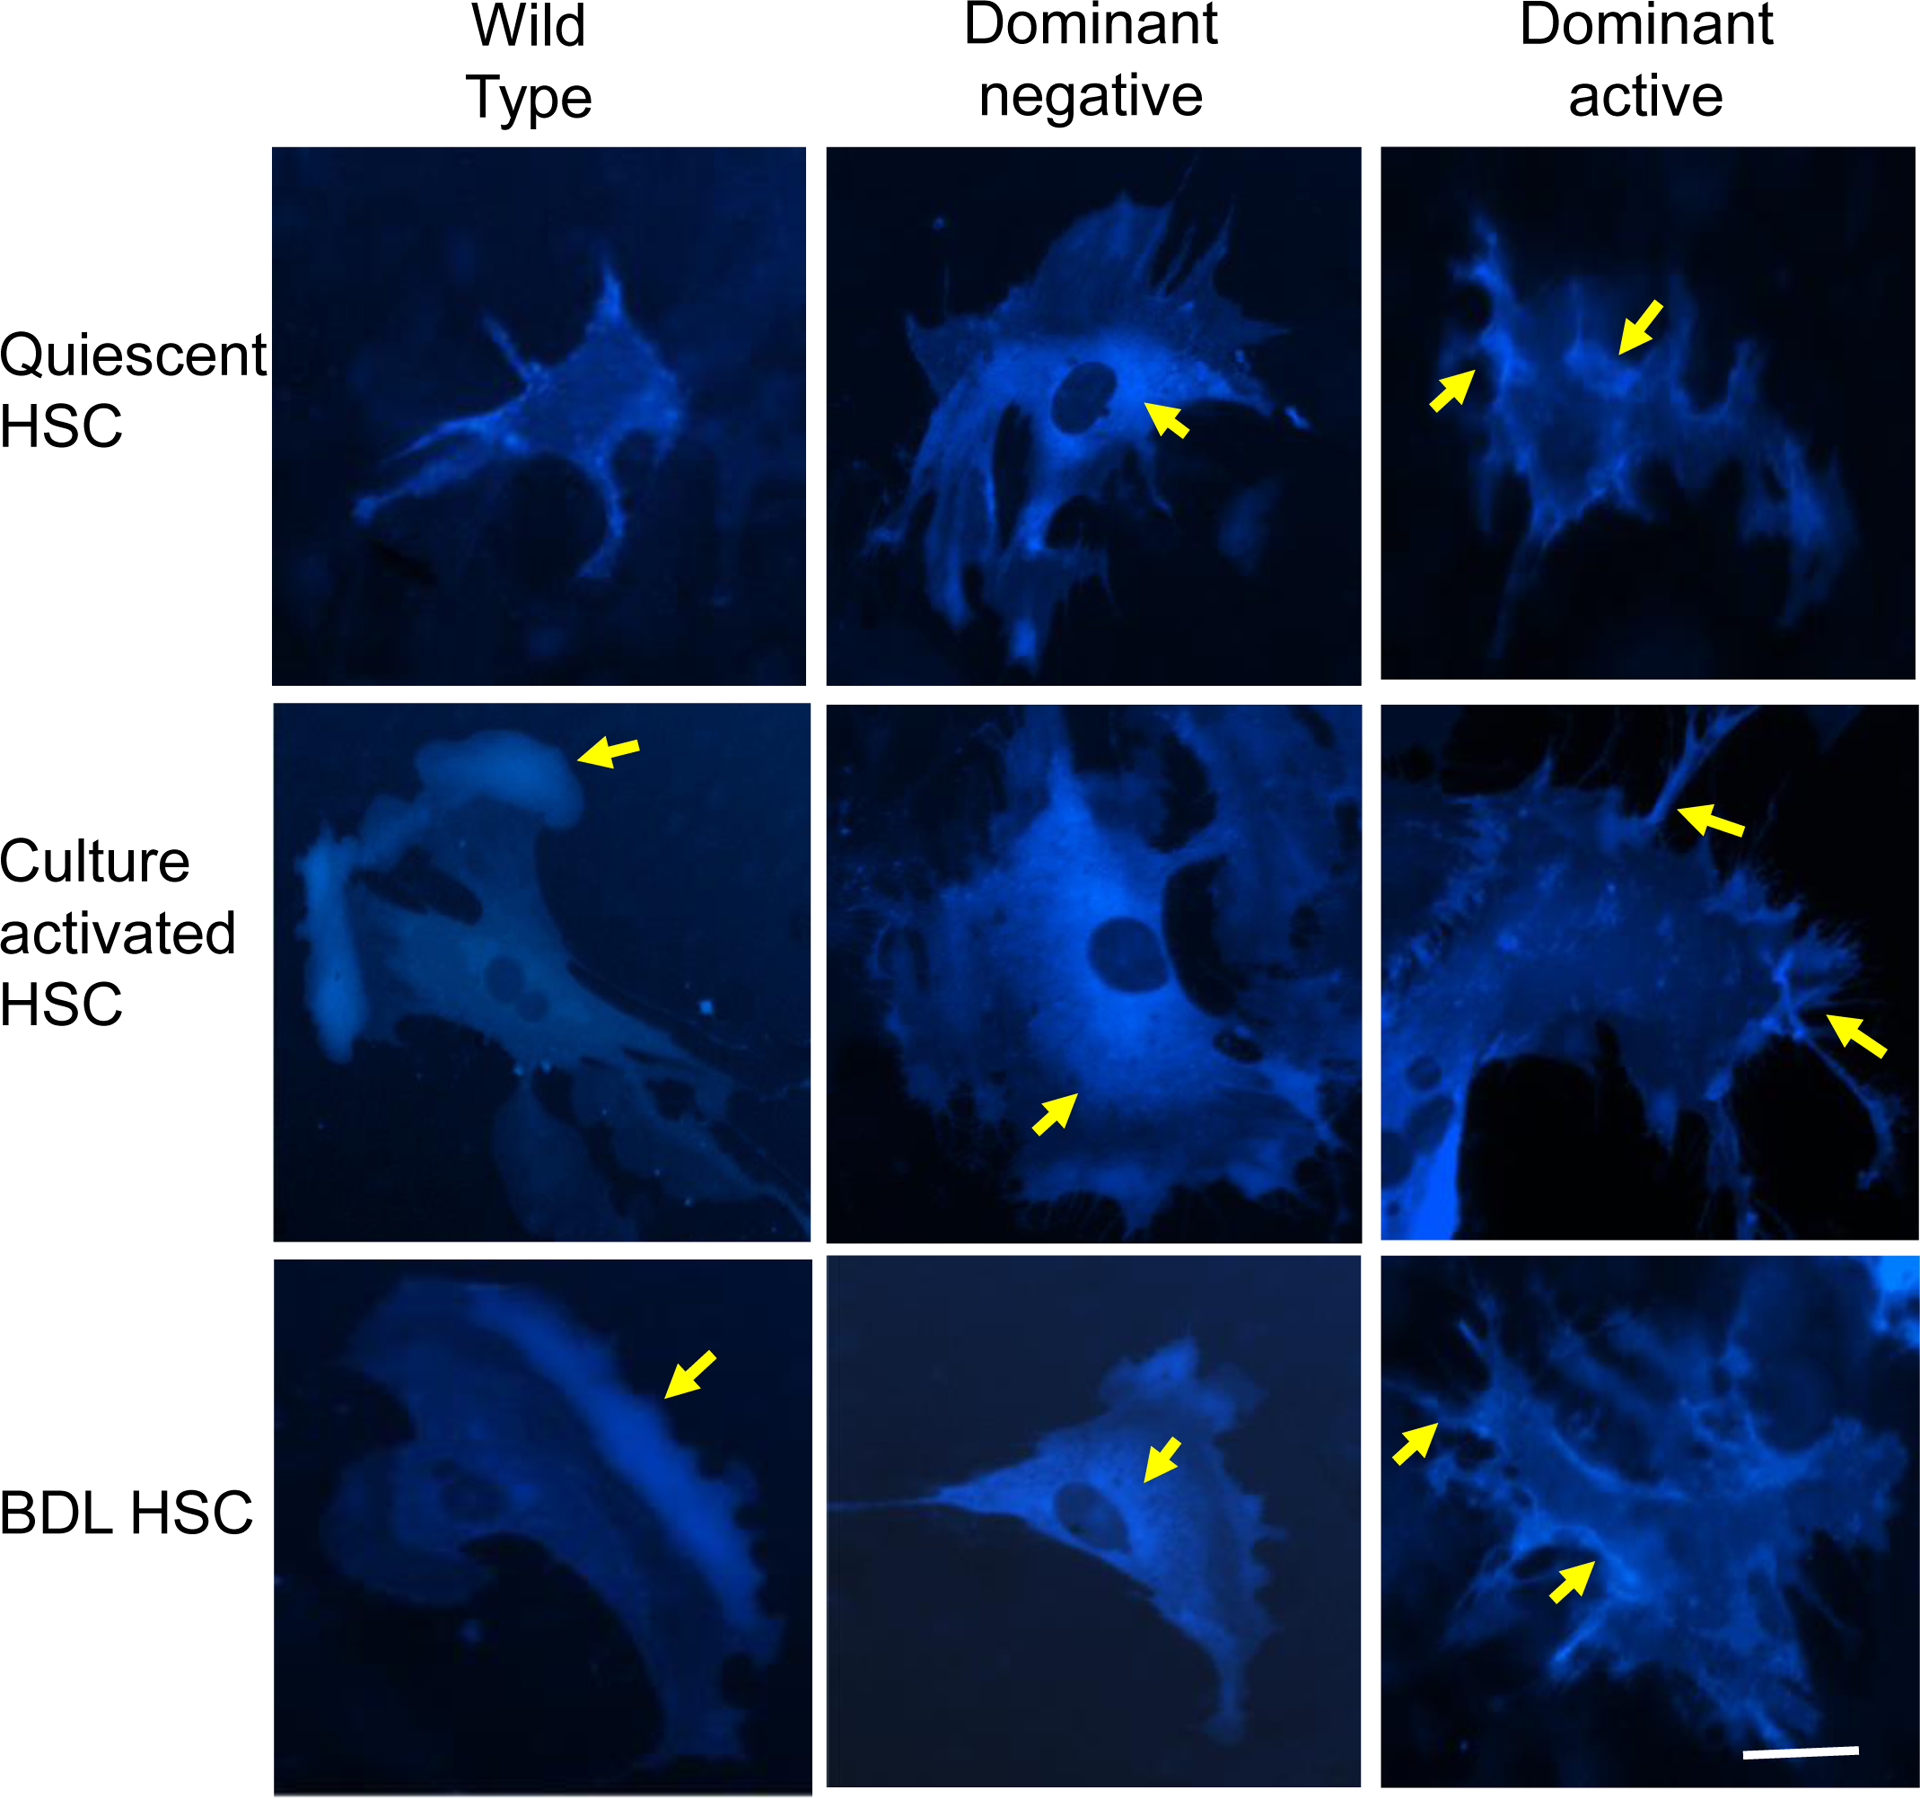
Stellate cells as in Figure 2 were infected with adenovirus containing recombinant CFP labeled wild type moesin (Wild Type), CFP labeled nonphosphorylatable T558A moesin (Dominant negative) and CFP labeled phospho-mimicking T558D moesin (dominant active). After 36 hours in culture conditions, moesin localization (cyan fluorescence) was evaluated. Representative images (of greater than 5 others) are shown. Intracellular localization and distribution dynamics of exogenously expressed CFP-tagged moesin wild type and mutants can be readily visualized seen. The yellow arrows point to CFP-tagged moesin (accumulation). In wild type cells (left column), moesin is concentrated in lammelipodia. In the dominant negative infected cells (middle column), there is cytoplasmic accumulation of dominant negative moesin, and in dominant negative infected cells (right column), dominant active moesin accumulates in the periphery in finger like projections (n=5). The bar represents 10 μm.
The effect of moesin on HSC smooth muscle α actin and collagen 1α1 expression
To test the functional effects of moesin in HSCs, we first overexpressed moesin-CFP WT and mutant moesin constructs (moesin-CFP-T558A and moesin-CFP-T558A) in isolated stellate cells. Overexpression of the moesin WT and phosphomimicking mutants led to remarkable upregulation of type I collagen mRNA (127% and 167% of uninfected cells respectively, P < 0.01, Figure 4A) and smooth muscle α-actin mRNA production (122% and 151% of uninfected cells respectively, P < 0.05, Figure 4B), In contrast, the nonphosphorylatable T558A mutant moesin led to remarkable downregulation of collagen I and smooth muscle α-actin mRNA expression (76% and 81% of uninfected cells, respectively, each P < 0.05; Figure 4A and 4B). Consistent with the effects of the nonphosphorylatable T558A mutant moesin, knock down of moesin using shRNA led to down-regulation of smooth muscle α-actin and collagen 1α1 expression (50% and 62% of uninfected cells, respectively, P < 0.05; Figure 4A and 4B). Further, we evaluated collagen I and smooth muscle α-actin protein expression using wild type, nonphosphorylatable T558A, constitutively phosphorylated T558D and moesin shRNA constructs in isolated HSCs. Consistent with mRNA expression, over expression of the nonphosphorylatable T558A and constitutively phosphorylated moesin led to effects similar to those found with smooth muscle α-actin and collagen 1α1 mRNA expression (Figure 4C, 4D and 4E). Smooth muscle α-actin and collagen 1α1expression were also significantly reduced in moesin shRNA-infected cells (62% and 50% of scramble-infected cells respectively, P < 0.01; Figure 4C, 4D and 4E).
Figure 4. Moesin regulates collagen I α I and smooth muscle α actin mRNA in HSCs.
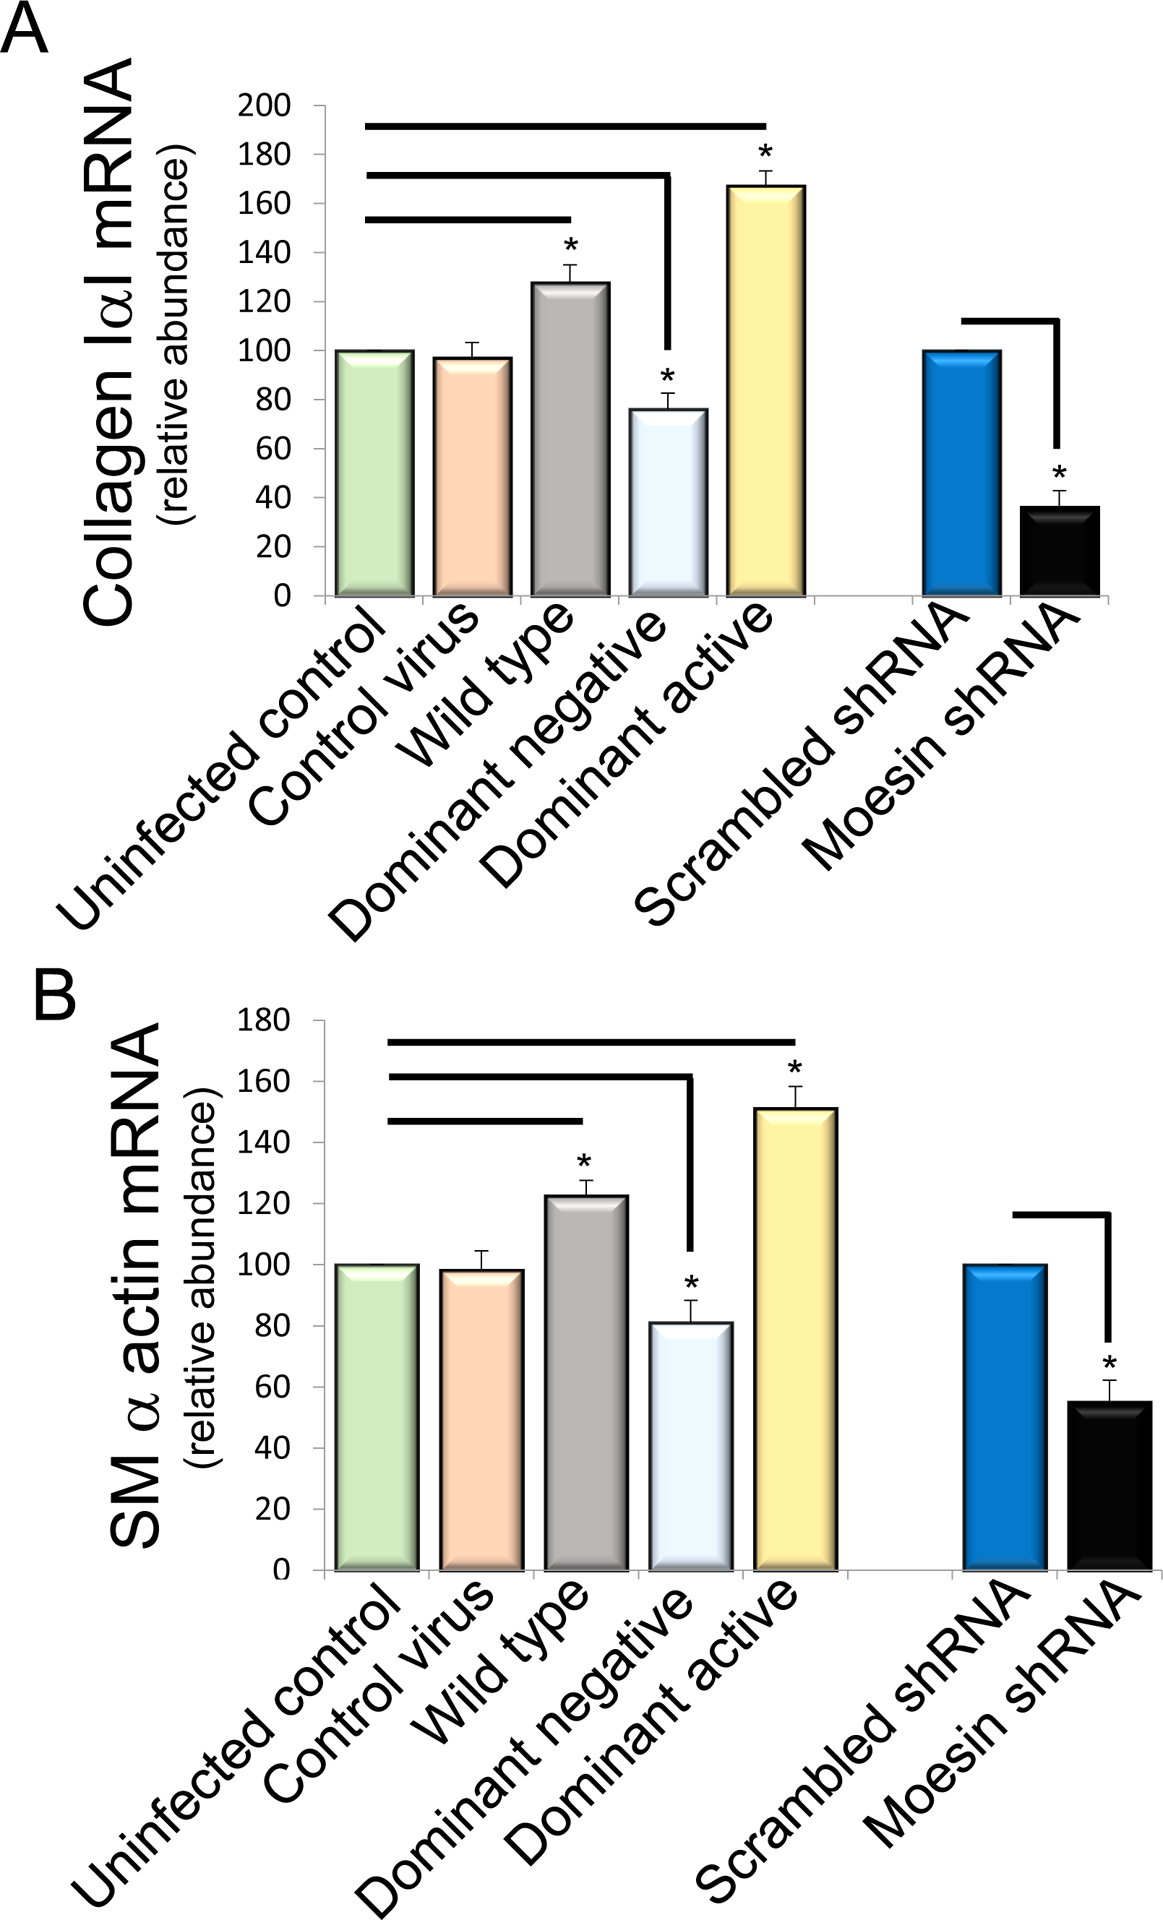
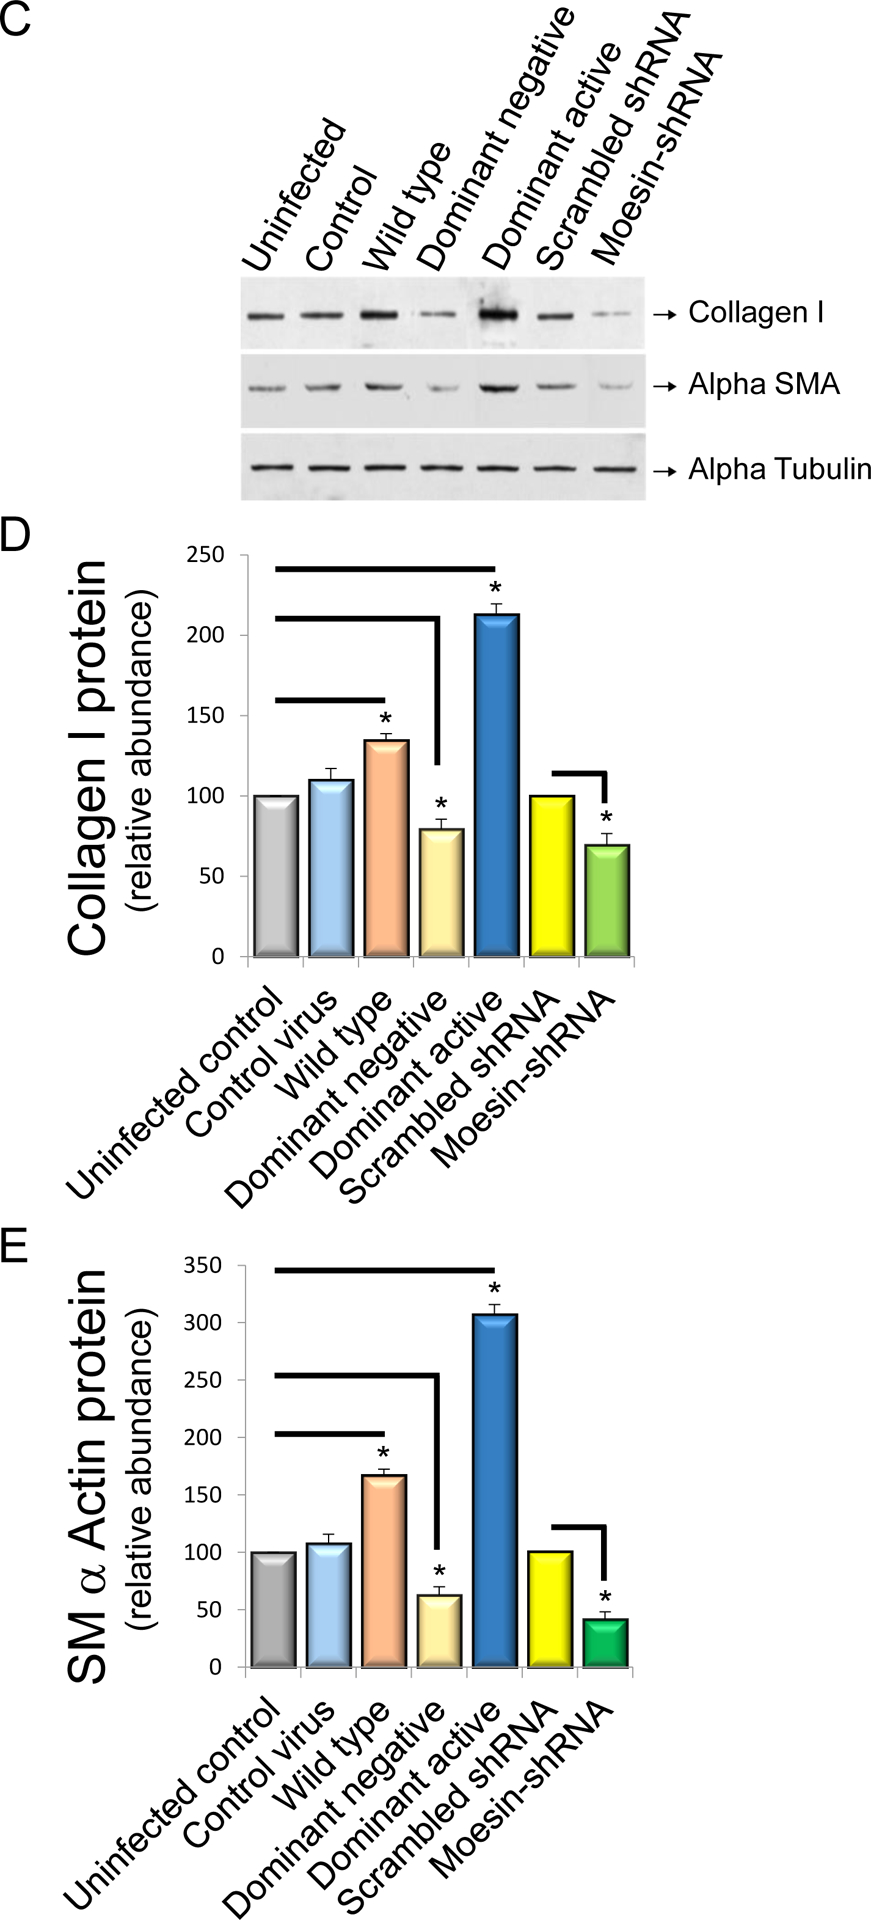
In (A) and (B), stellate cells were isolated from normal rat livers and were allowed to undergo spontaneous culture induced activation for 48 hours. Cells were serum starved overnight and infected with the adenoviral moesin wild type and mutant (dominant active moesin T558D and dominant negative moesinT558A) constructs for 36 hours as in Methods. Cells were harvested and smooth muscle α actin and collagen I α I mRNA were measured by RT-PCR as in Methods and the data presented graphically. Smooth muscle α actin and collagen I α I mRNA expression levels were similar (n=4, *p< 0.05 for moesin WT and moesin dominant negative vs. uninfected control cells, *p< 0.01 for moesin dominant active vs. uninfected control cells. *p< 0.01 for moesin shRNA infected cells vs scramble infected cells). In (C, D and E), HSCs, cells were infected with WT and mutant (dominant active and dominant negative) moesin constructs subjected immunoblotting (C). Uninfected cells and CFP only containing construct was used as control. Some cells were infected with scramble and moesin shRNA adenovirus. Type I collagen and smooth muscle α-actin protein expression were detected using antibodies to detect collagen I and smooth muscle α actin. Immediately below the immunoblots are shown scanned and quantitated data (D and E) (n=4, *p< 0.05 for moesin WT and moesin dominant negative vs. uninfected cells. *p< 0.05 for moesin- dominant active vs. uninfected cells. *p< 0.05 for moesin shRNA infected cells vs scramble infected cells).
Moesin deficiency reduces liver fibrosis in vivo
We next examined the effect of moesin depletion on hepatic injury, inflammation, bile duct proliferation and fibrosis. ALT and bilirubin levels were not significantly altered in moesin KO mice after liver injury induced by CCl4 and BDL (Supplemental Figure 1). Additionally, tumor necrosis factor (TNF)-α, IL-1β and IL-6 expression was examined after injury. These 3 cytokines, important in the inflammatory response to liver injury, were similar in WT and KO mice (Supplemental Figure 2A, B and C). Examination of liver sections after CCl4 injection and BDL induced injury revealed equal similar degrees of portal inflammation (Supplemental Figure 2D and Figure 5A). Of note, there an increase in bile duct proliferation was observed following BDL (but no significant difference between moesin WT and KO livers). Biliary mass (shown by CK-19 staining) and CK-19 mRNA levels were also similar in WT and KO animals following DBL (Supplemental Figure 3). Desmin expression was also similar in moesin WT and KO livers after liver injury (Supplemental Figure 4).
Figure 5. Moesin deficiency leads to reduced collagen expression after liver injury.
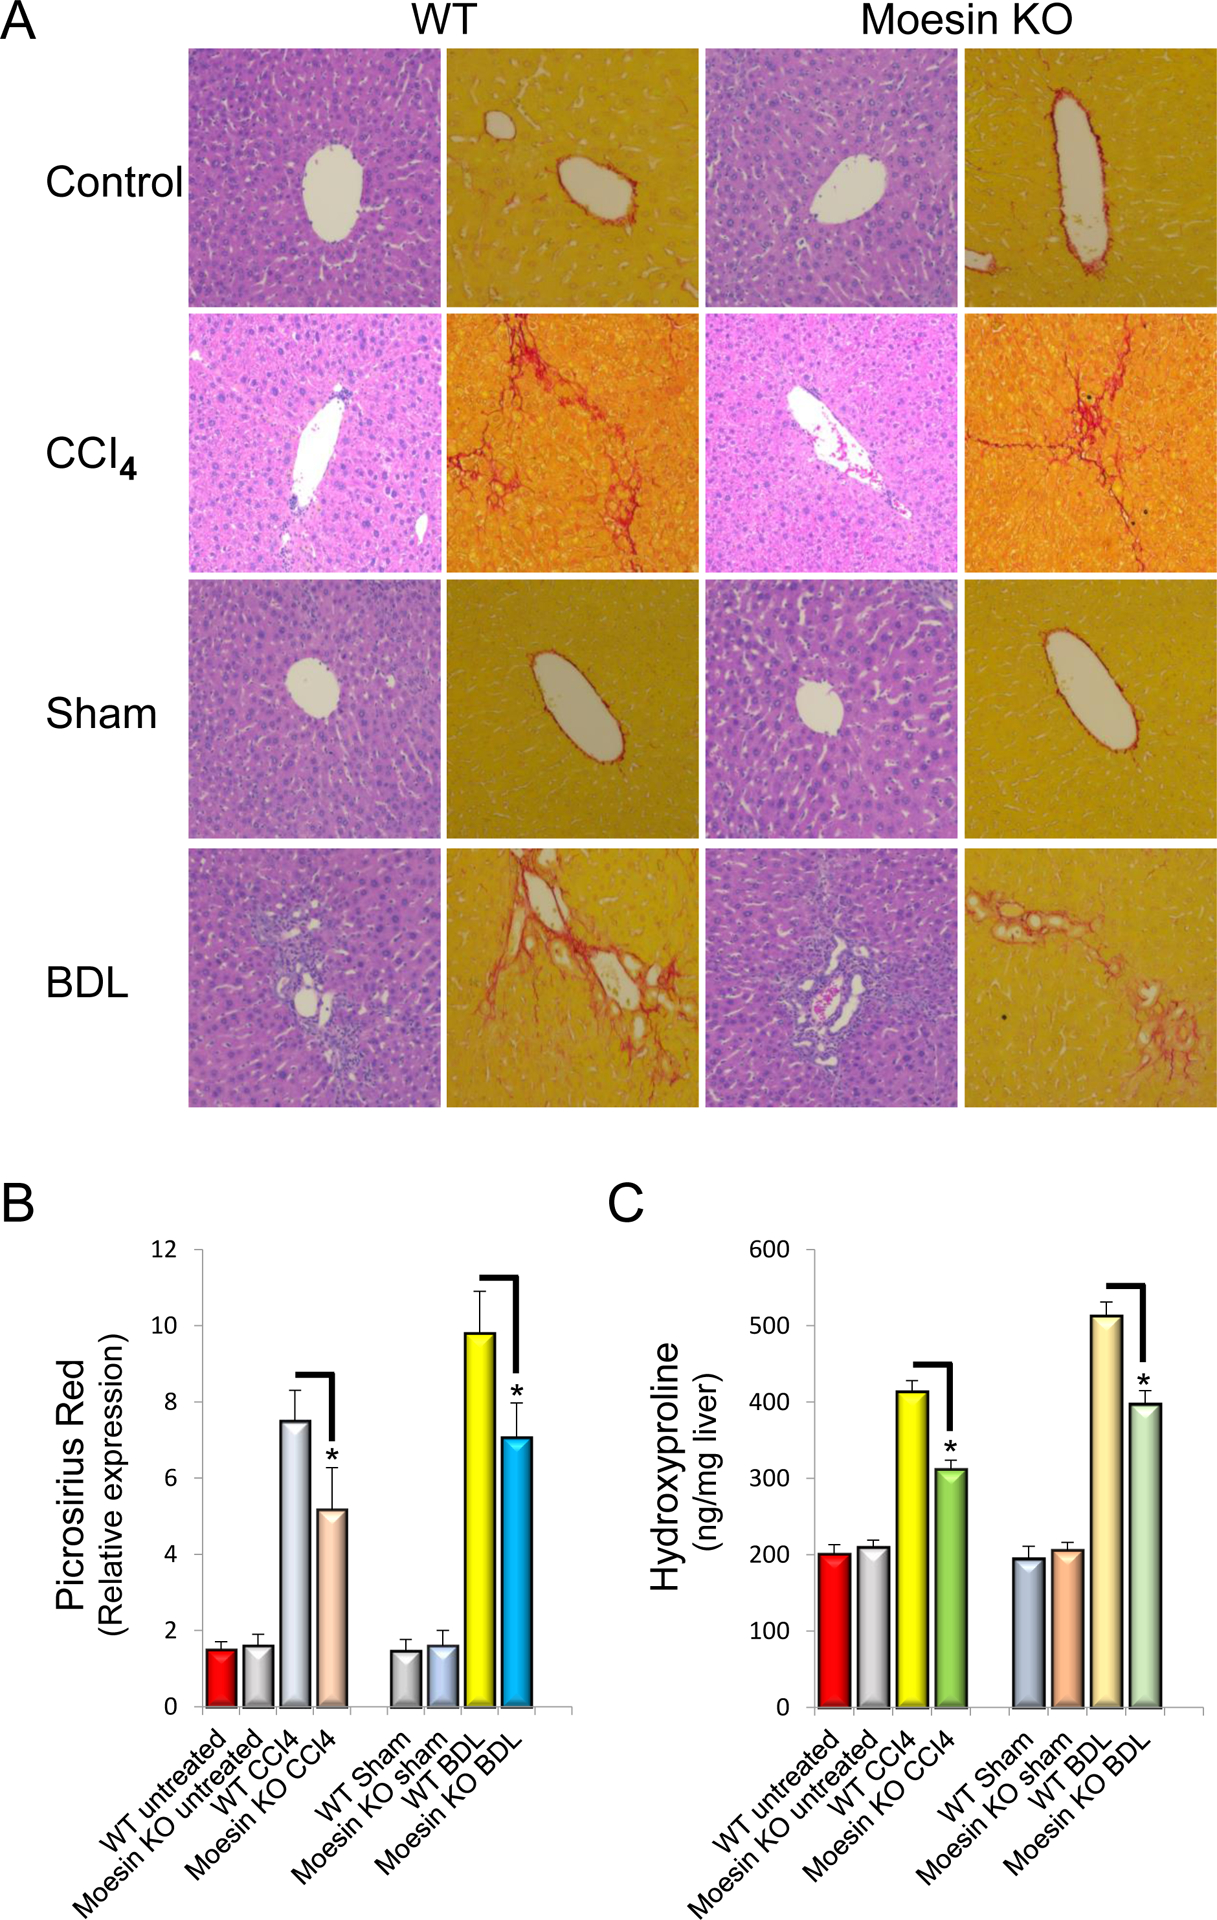
Liver injury was induced as in Methods by repetitive administration of CCl4 administration or bile duct ligation (BDL). In (A), whole liver tissues were harvested and subjected to H&E and picrosirius red staining as in Methods. Representative images (of greater than 4 others) are shown. In (B), images were subjected to quantitative morphometry to detect sirius red labeling and quantitative data are depicted graphically (n=4, *p< 0.05 for moesin wild type vs moesin KO in both CCl4 administered and BDL mice). In (C), hydroxyproline was measured in individual pieces liver from different animals, and hydroxyproline content in liver tissue from control, CCl4 administered as well as BDL and sham-operated wild-type and moesin-KO mice are depicted graphically (n=4, *p< 0.05 for moesin wild type vs moesin KO in both CCl4 administered and BDL mice).
Next, the effect of moesin deficiency on liver fibrosis in CCl4–induced and BDL liver injury was examined. Following six doses of carbon tetrachloride or 14 days after BDL surgery, collagen was labeled with picrosirius red. The amount of collagen visualized in the livers of moesin KO mice was significantly less than that of moesin WT mice (69% and 72% of wild type, respectively, each P < 0.05) (Figure 5A and Figure 5B). Hydroxyproline content was also significantly decreased in moesin KO animals after liver injury (75% of wild type CCl4-treated mouse and 77% of BDL mouse, P < 0.05) (Figure 5C).
Reduced cellular motility and contractility in moesin T558A and moesin deficient cells
Next, we examined the functional effect of moesin in HSC motility. Infection of (rat) HSCs with WT or dominant active moesin led to an increase in cell migration (Figure 6A and 6B). In contrast, the dominant negative moesin significantly abrogated cell migration (vs. control, n=5, *p<0.01, Figure 6A and 6B). Additionally, moesin KO HSCs were less motile than controls (n = 5, *p<0.05, Figure 6A and 6B).
Figure 6. HSC migration in the absence of moesin is reduced and enhanced after dominant active moesin overexpreesion.
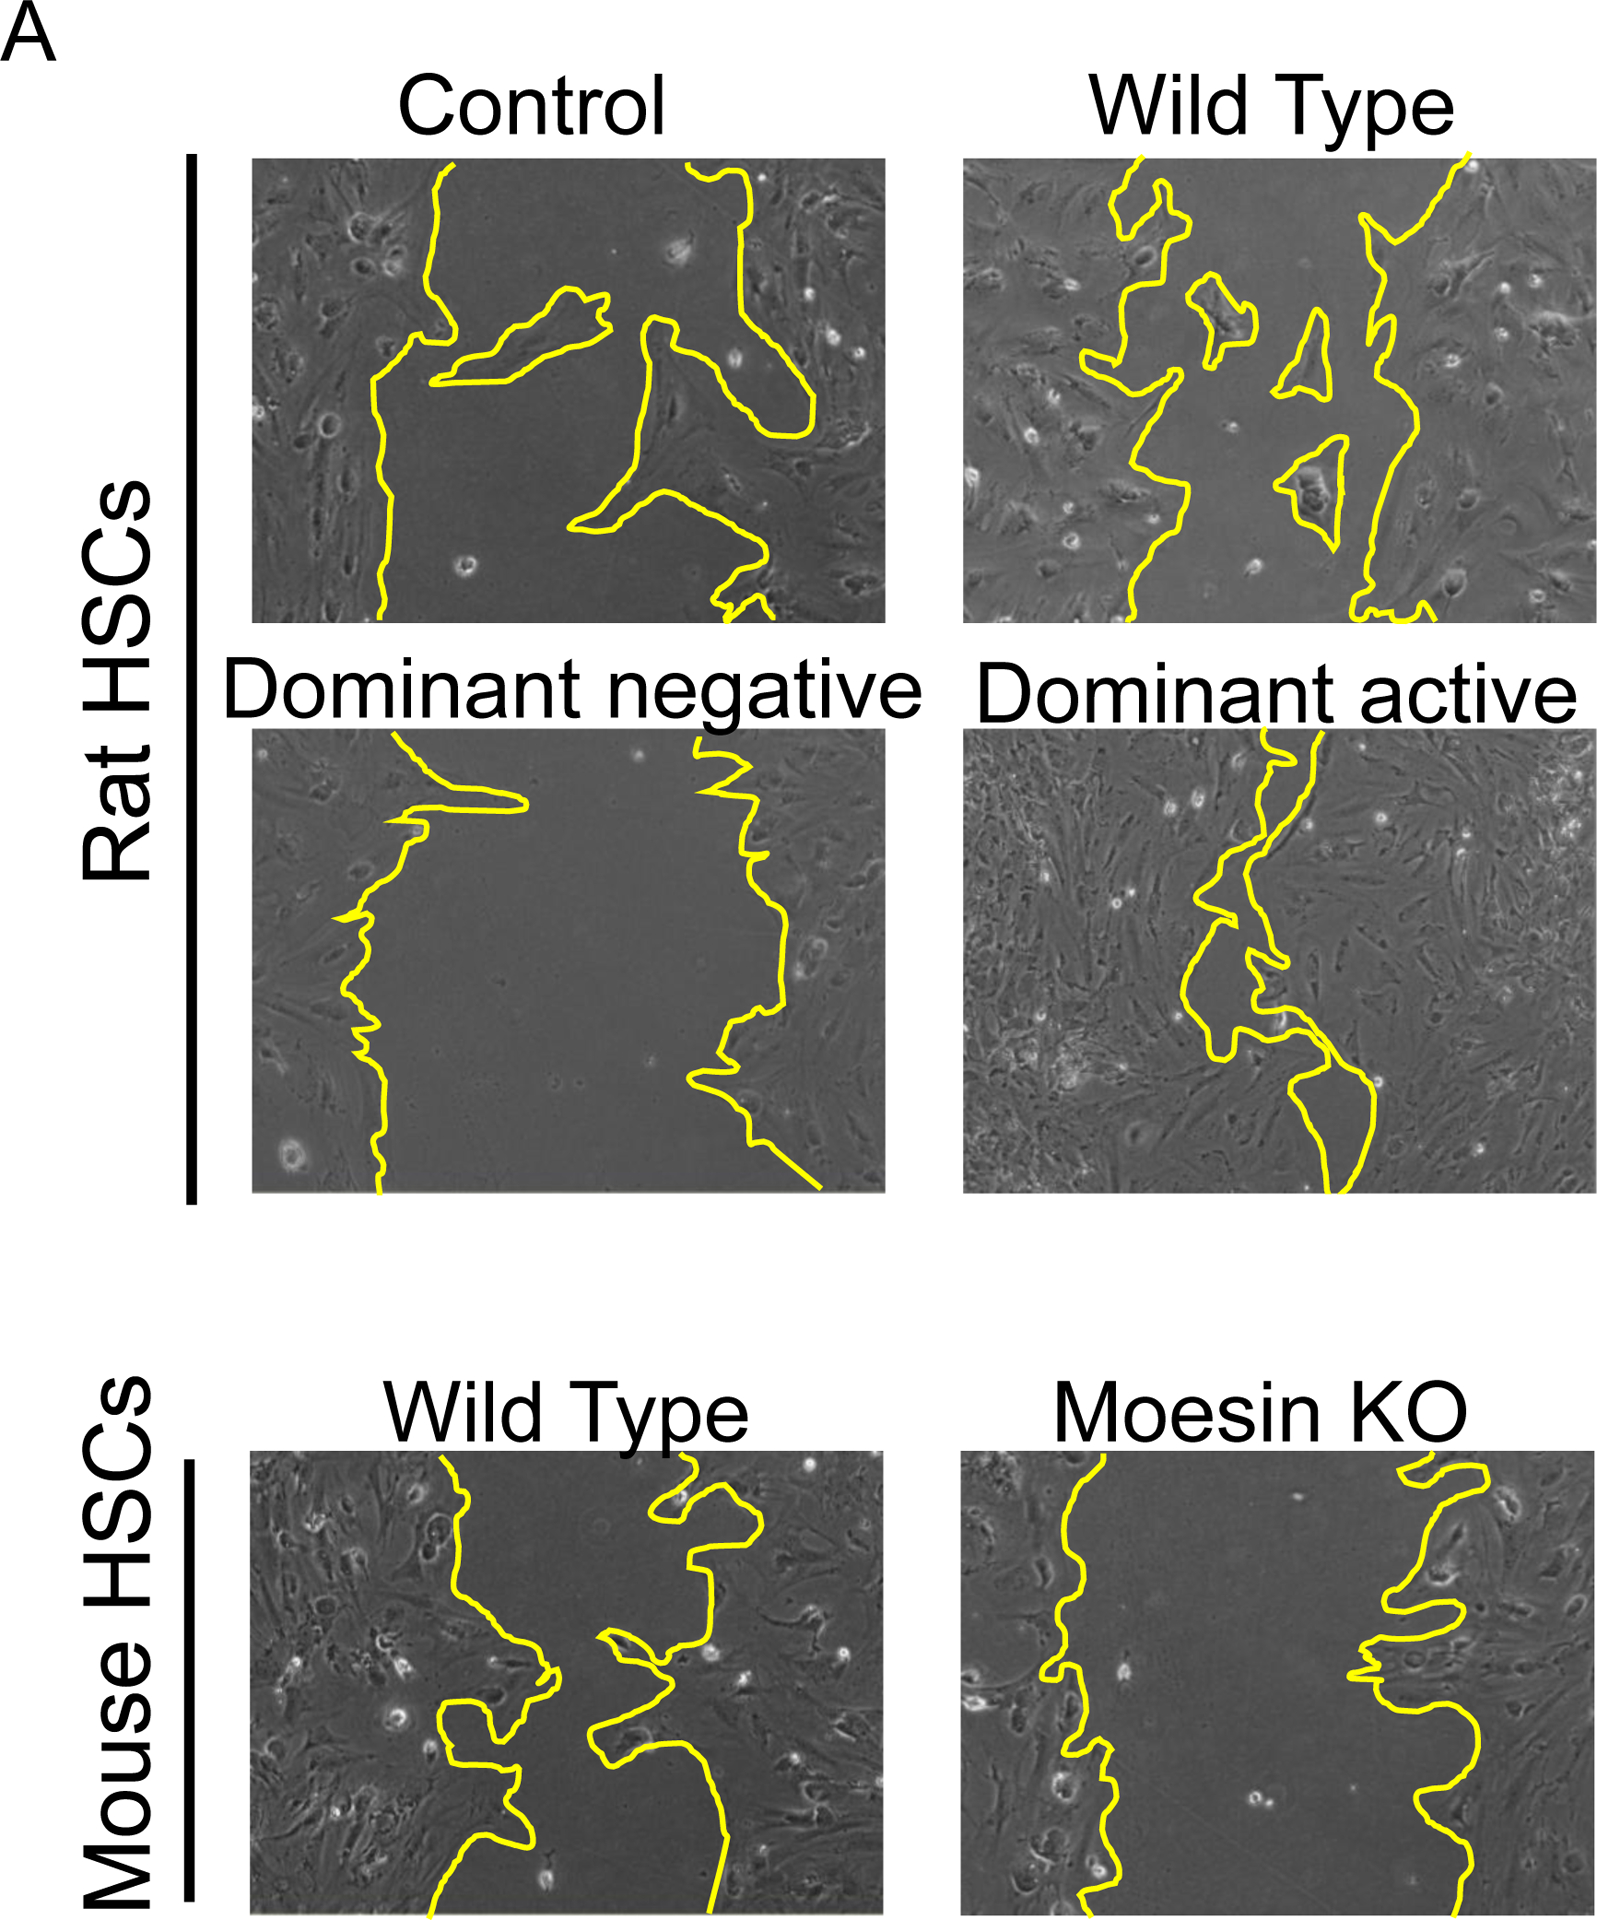
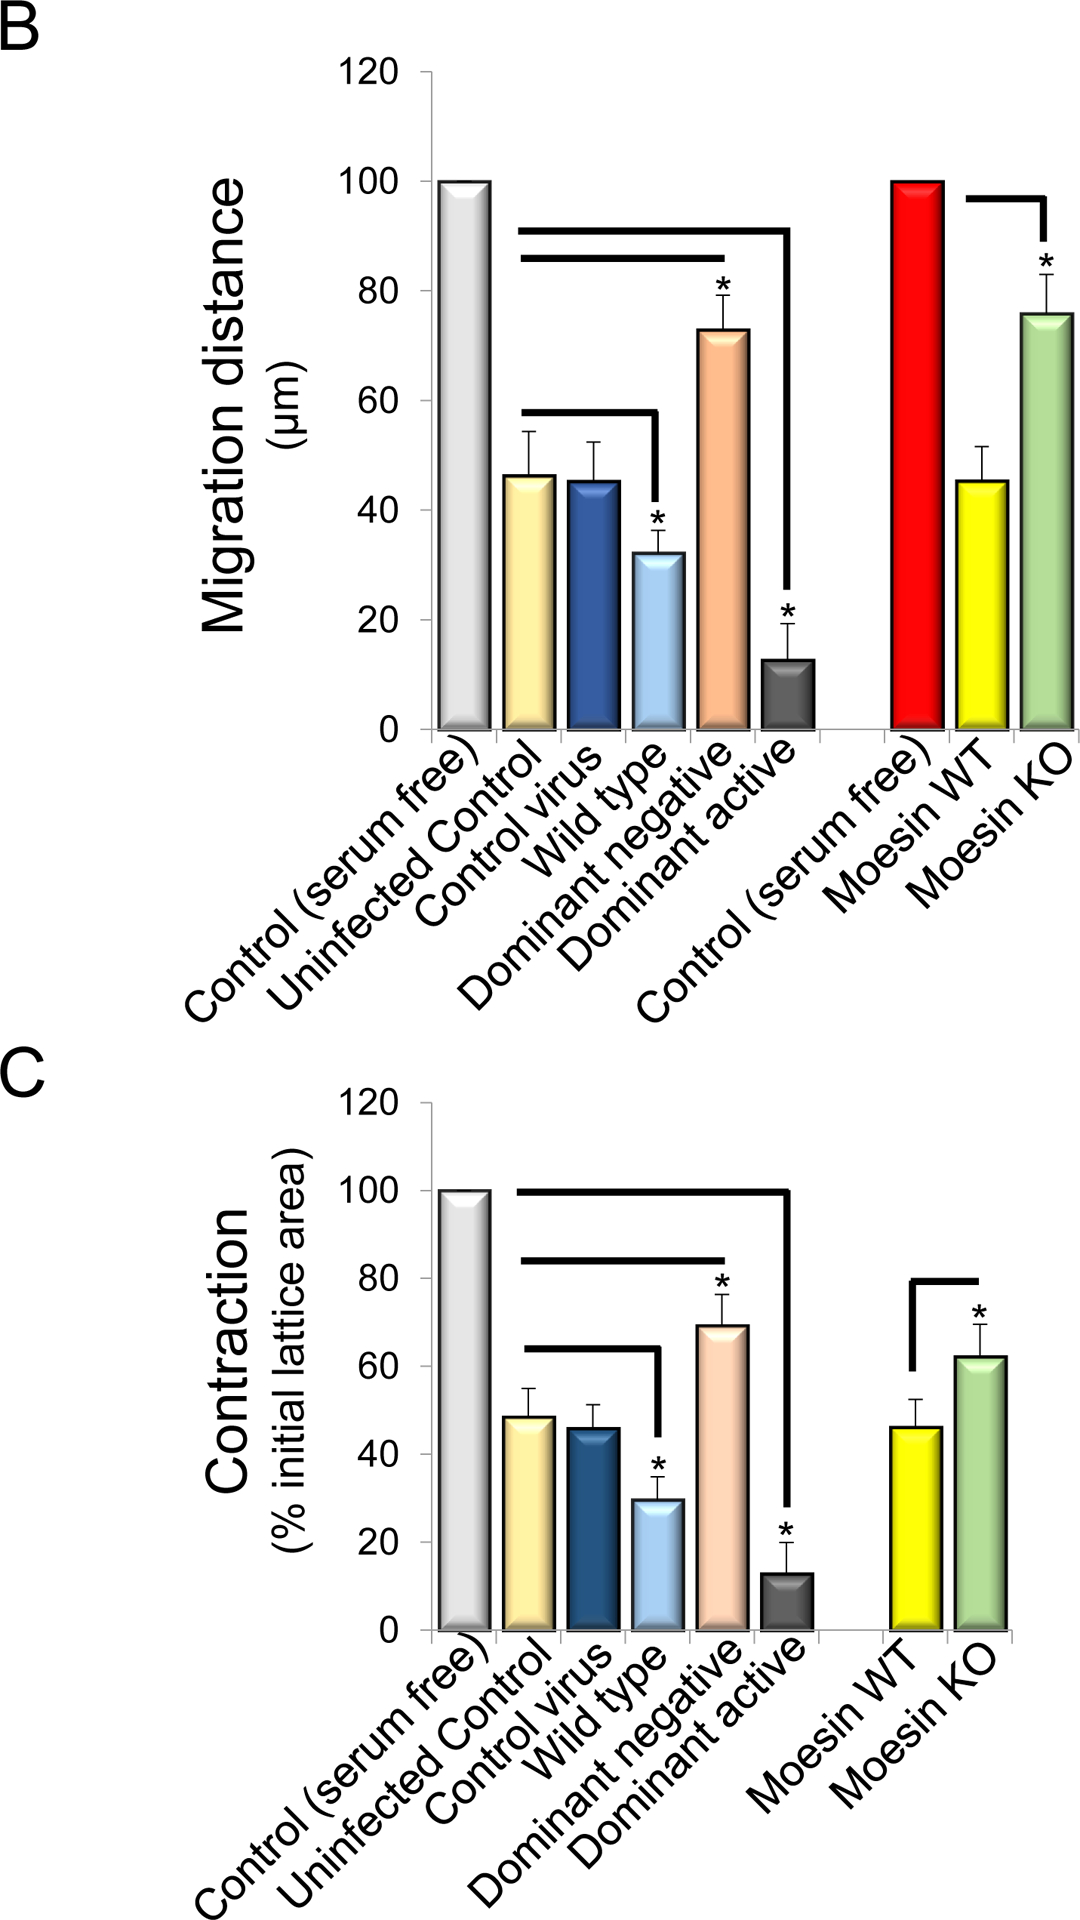
Stellate cells were isolated from rats or wild type and moesin knock out mice. Cells were plated in monolayers at uniform density in all experiments. Rat HSCs cells were infected with adenoviral constructs (moesin-CFP WT, dominant negative moesin, dominant active moesin) as in Methods and subjected to scratch wounding and as in Methods. Uninfected cells with and without serum in culture as well as control-adenovirus infected cells were served as control. Cells migrating the specified distances and 36 hours after scratch wounding were counted. In (A), representative examples of infected cells migrating into scratched areas are shown (n=4). In (B), cells migrating the specified distances and 36 hours after scratch wounding were counted (n = 4, *p<0.05 for moesin WT and moesin dominant negative vs. uninfected cells. *p< 0.01 for moesin dominant active vs. uninfected cells. *p< 0.05 for Moesin knock out vs. moesin wild type cells). In (C), stellate cells were placed on top of collagen lattices, infected with moesin constructs described above and contraction was measured as in Methods (n = 4, *p<0.05 for moesin WT vs. uninfected control cells, moesin dominant negative vs. uninfected control cells, moesin dominant active vs. uninfected control cells, and moesin knock out vs. moesin wild type cells).
We also examined another HSC function dependent on the actin cytoskeleton, namely cell contractility. HSCs infected with WT moesin as well as HSCs infected with dominant active moesin (CFP T558D) were significantly more contractile than controls (Figure 6C). Additionally, moesin KO HSCs were significantly less contractile compared to controls (n = 5, *p<0.05, Figure 6C).
Expression of MRTF-A and SRF on actin dynamics in moesin deficient HSCs
In order to examine the mechanism underlying moesin’s effect on the actin cytoskeleton and HSC function, we analyzed the expression of MRTF-A and SRF, both of which are known to be important in regulation of the cells actin cytoskeleton (18, 24–28). We specifically focused on MRTF-A and SRF expression in normal and activated HSCs from moesin KO and WT mice. MRTF-A expression was significantly increased in cells from BDL in compare to sham operated moesin WT animals (n=5, *p<0.05, for BDL (188%) vs sham (100%), Figure 7A). In contrast, MRTF-A expression was significantly decreased in HSCs from moesin-KO animals after BDL (n=5, *p<0.05, for moesin KO (188%) vs. moesin WT cells (104%)), (Figure 7A). Similarly, SRF was reduced in moesin-KO animals compared to control (n=5, *p<0.05, Figure 7B).
Figure 7. Moesin deficiency reduces MRTF-A and SRF expression and alters actin dynamics.
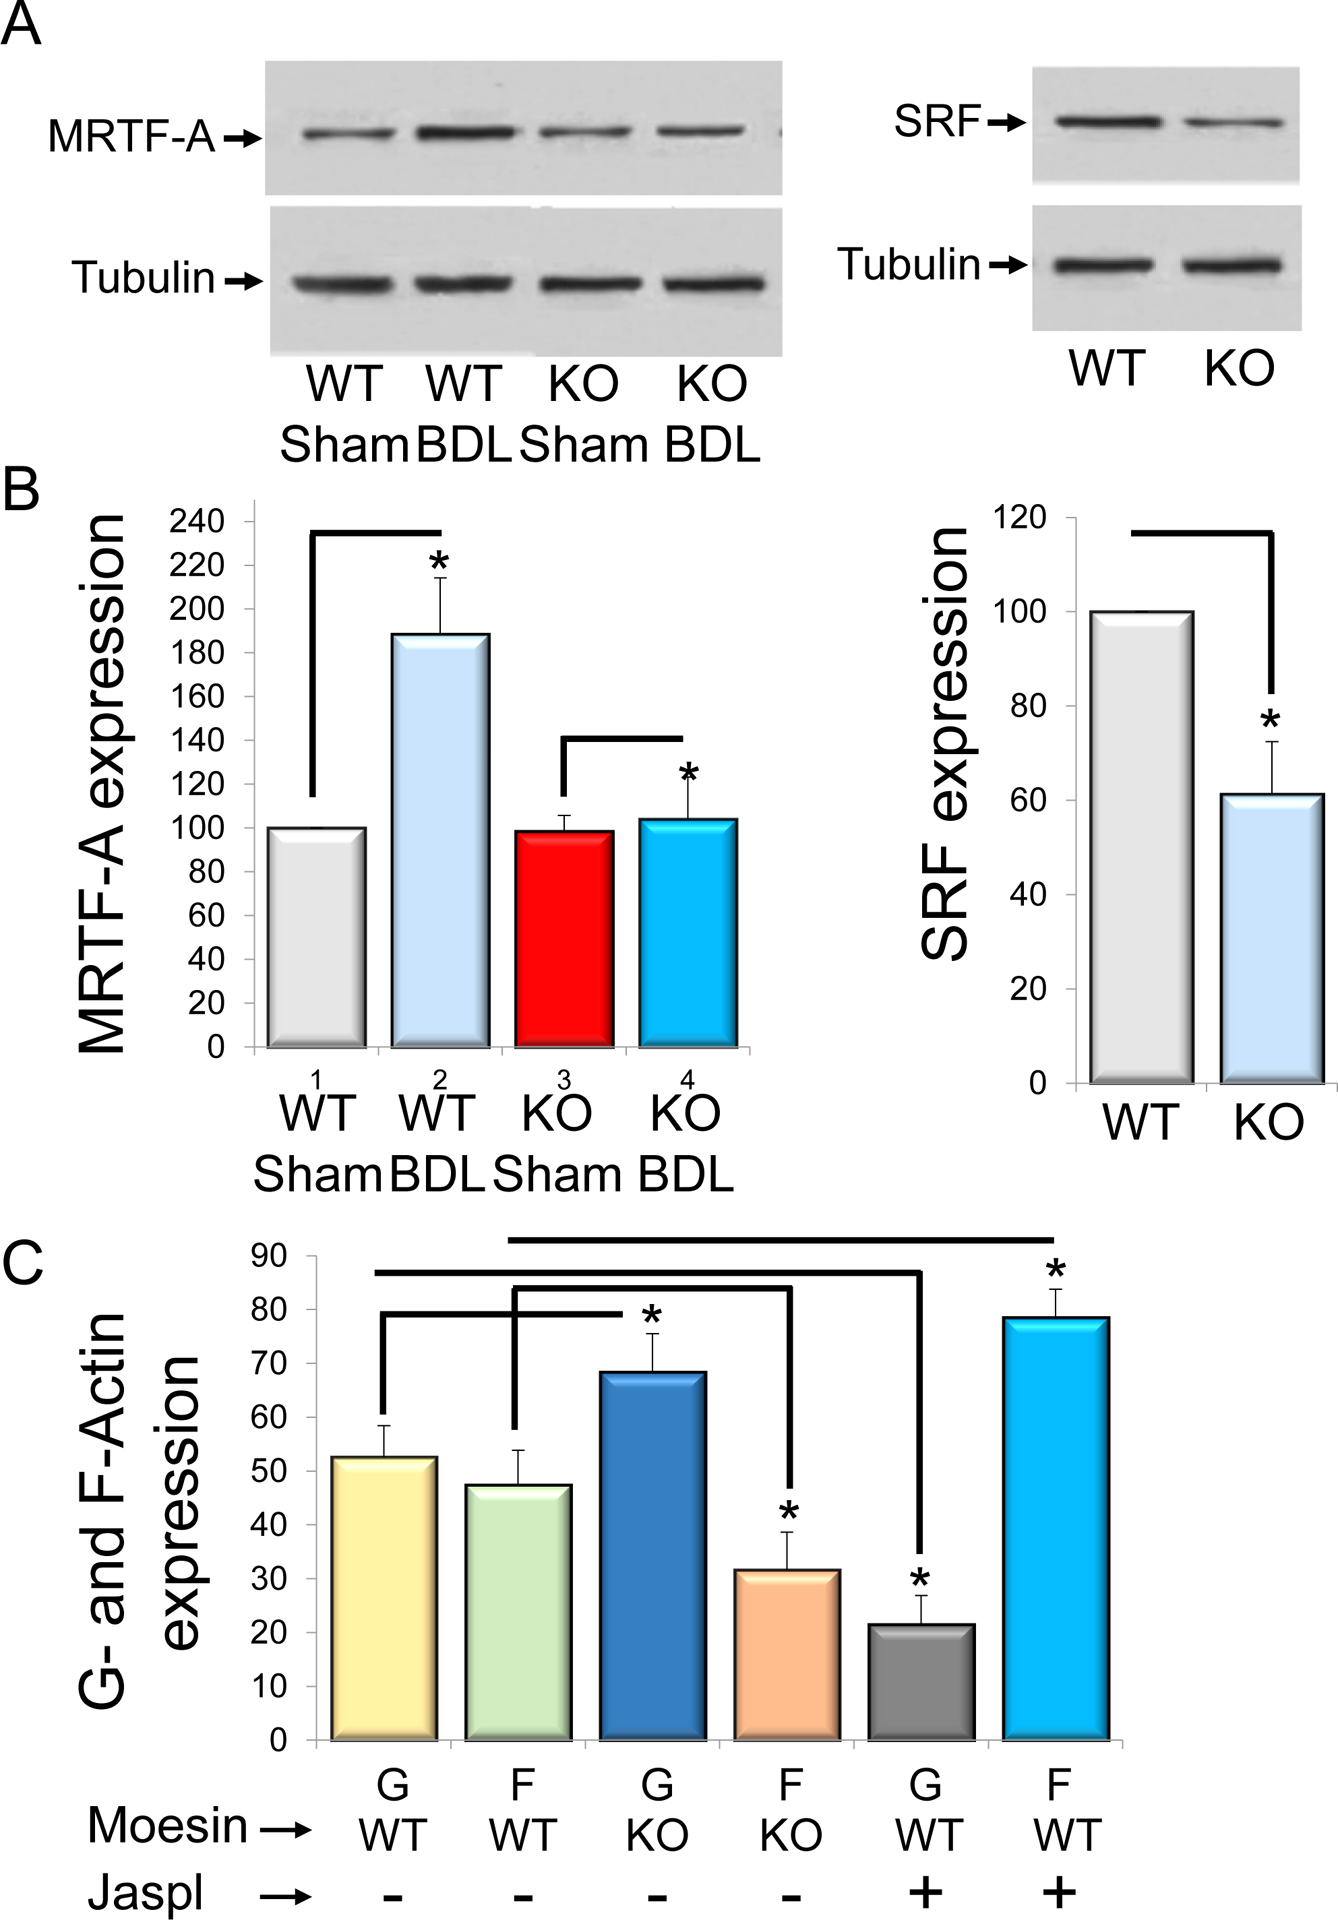
HSCs were isolated from wild type and moesin knock out mice in normal and injured (BDL) livers. MRTF-A and SRF expression were measured by immunoblotting (A left and right panels). Representative images (of greater than 3 others) are shown and quantitative data are presented graphically in (B) (n=3, *p<0.05 for moesin knock out BDL (KO BDL) vs wild type BDL (WT BDL) for MRTF-A expression, *p<0.05 for moesin knock out cells (KO) vs wild type cells (WT). In (C), Reorganization of actin from Wild type (WT) and moesin knock out (KO) cells using the G-actin/F-actin assay described in methods. Control cells were treated with actin polymerizing drug jasplakinolide (Jaspl). The G-actin (G) and F-actin (F) content was assayed. Moesin knock out cells resulted in a significant accumulation of G-actin and decreased F-actin in comparison to wild type cells, (n=3, *p<0.05 for G- and F- actin from moesin knock out cells (G KO and F KO) vs G- and F- actin from wild type G-actin (G WT and F WT). Cells treated with jasplakinolide, 80% of actin is reorganized into F-actin (n=3, *p<0.05, G-actin vs F-actin from wild type cells).
Finally, to study the effects of moesin on the actin cytoskeleton, we examined the ratio of G-actin to F-actin in HSCs from moesin KO and WT animals (as a control, HSCs were exposed to the actin polymerizing agent jasplakinolide) (Figure 7C). In moesin KO HSCs, levels of G actin were increased, and the G-actin/F-actin ratio was significantly higher than in moesin WT HSCs (n=4, p*<0.05, G-/F-actin: 68%/32% for KO mouse vs 52%/48% for WT mouse respectively, Figure 7C). Of note, as expected, in HSCs exposed to jasplakinolide, actin was prominently reorganized into F-actin (Figure 7C).
Discussion
Here, we have demonstrated an important role for the ERM (ezrin/radixin/moesin) family protein moesin regulating collagen expression in HSCs. Not only did we demonstrate that moesin phosphorylation is increased during HSC activation and fibrogenesis in vivo, but we also found that its deletion reduced fibrosis in vivo in response to injury. The mechanism by which moesin functions is through a G-actin, MRTF-A and SRF pathway that regulates extracellular matrix production.
Our study advances the field by emphasizing the critical importance of not only the actin cytoskeleton, but also the actin-binding protein, moesin, in cell structure and function. We show that moesin depletion significantly impairs cell contraction, the latter, a critical functional component of HSC activation. Indeed, these findings are consistent with previous studies demonstrating that the actin cytoskeleton (and in particular, SMα-actin) plays a critical role in HSC contractility (4, 18, 29). Further, the current findings are also consistent with previous data emphasizing the important role of actin on HSC motility (4). Since actin filament formation and actomyosin activation is the main motile force underlying cell motility, we believe that the explanation for the impaired wound-induced migration found with the nonphosphorylatable T558A moesin mutation (which does not binds actin) is impaired formation of actin dependent structures, including the cytoskeleton, but also lamellipodia, filopodia and membrane ruffles of microvilli, all of which are essential for cell motility.
We speculate that the ERM mechanics we report here may have implications for the biology of mechanotransduction in hepatic disorders other than fibrosis and/or portal hypertension. There is at present no published data available on moesin expression in cholangiopathies, liver cancer and fibrosing liver diseases including primary biliary cholangitis (PBC), primary sclerosing cholangitis (PSC), alcoholic- (ALD) and non-alcoholic steatohepatitis (NASH). However, another ERM protein, ezrin, has been shown to be upregulated in hepatocellular carcinomas (30, 31). Although a function for ezrin in HCC was not elucidated, the data raise the possibility that mechanotransducing signals could play a role in HCC carcinogenesis.
From a mechanistic standpoint, we show that the absence of moesin leads to the formation of an increased G-actin pool, this leads to G-actin/MRTF-A binding and subsequently inactivation of MRTF-A, with resultant reduction in MRTF-A-SRF mediated collagen secretion (Figure 8). The linkage between moesin-actin dynamics gene expression is largely unexplored. Extracellular signals from cytokines, mechanical force and others stimulate plasma membrane receptors (E-cadherin, TGFβ, tyrosin kinase, integrin) which in turn lead to actin polymerization and cellular motility by modulating Rho GTPase activity. For example, integrin receptors link cells to the extracellular matrix and are the main structural organizing components of focal adhesions, communicating external and internal mechanical stress to the actin cytoskeleton. In our study, integrin beta 3 expression in HSCs was not regulated after liver injury (Supplemental Figure 5). However, this does not exclude the possibility that other integrins or in particular, integrin phosphorylation is involved in downstream signaling cascades. Such signaling appears to activate the actin–MRTF–SRF pathway, which links actin dynamics with gene transcription. Additionally, cytokines such as TGF-β1 can also activate the well-characterized Smad signaling pathway and promote expression of SMα actin.
Figure 8. Proposed model for moesin-G-Actin/MRTF-A/SRF signaling in HSCs.
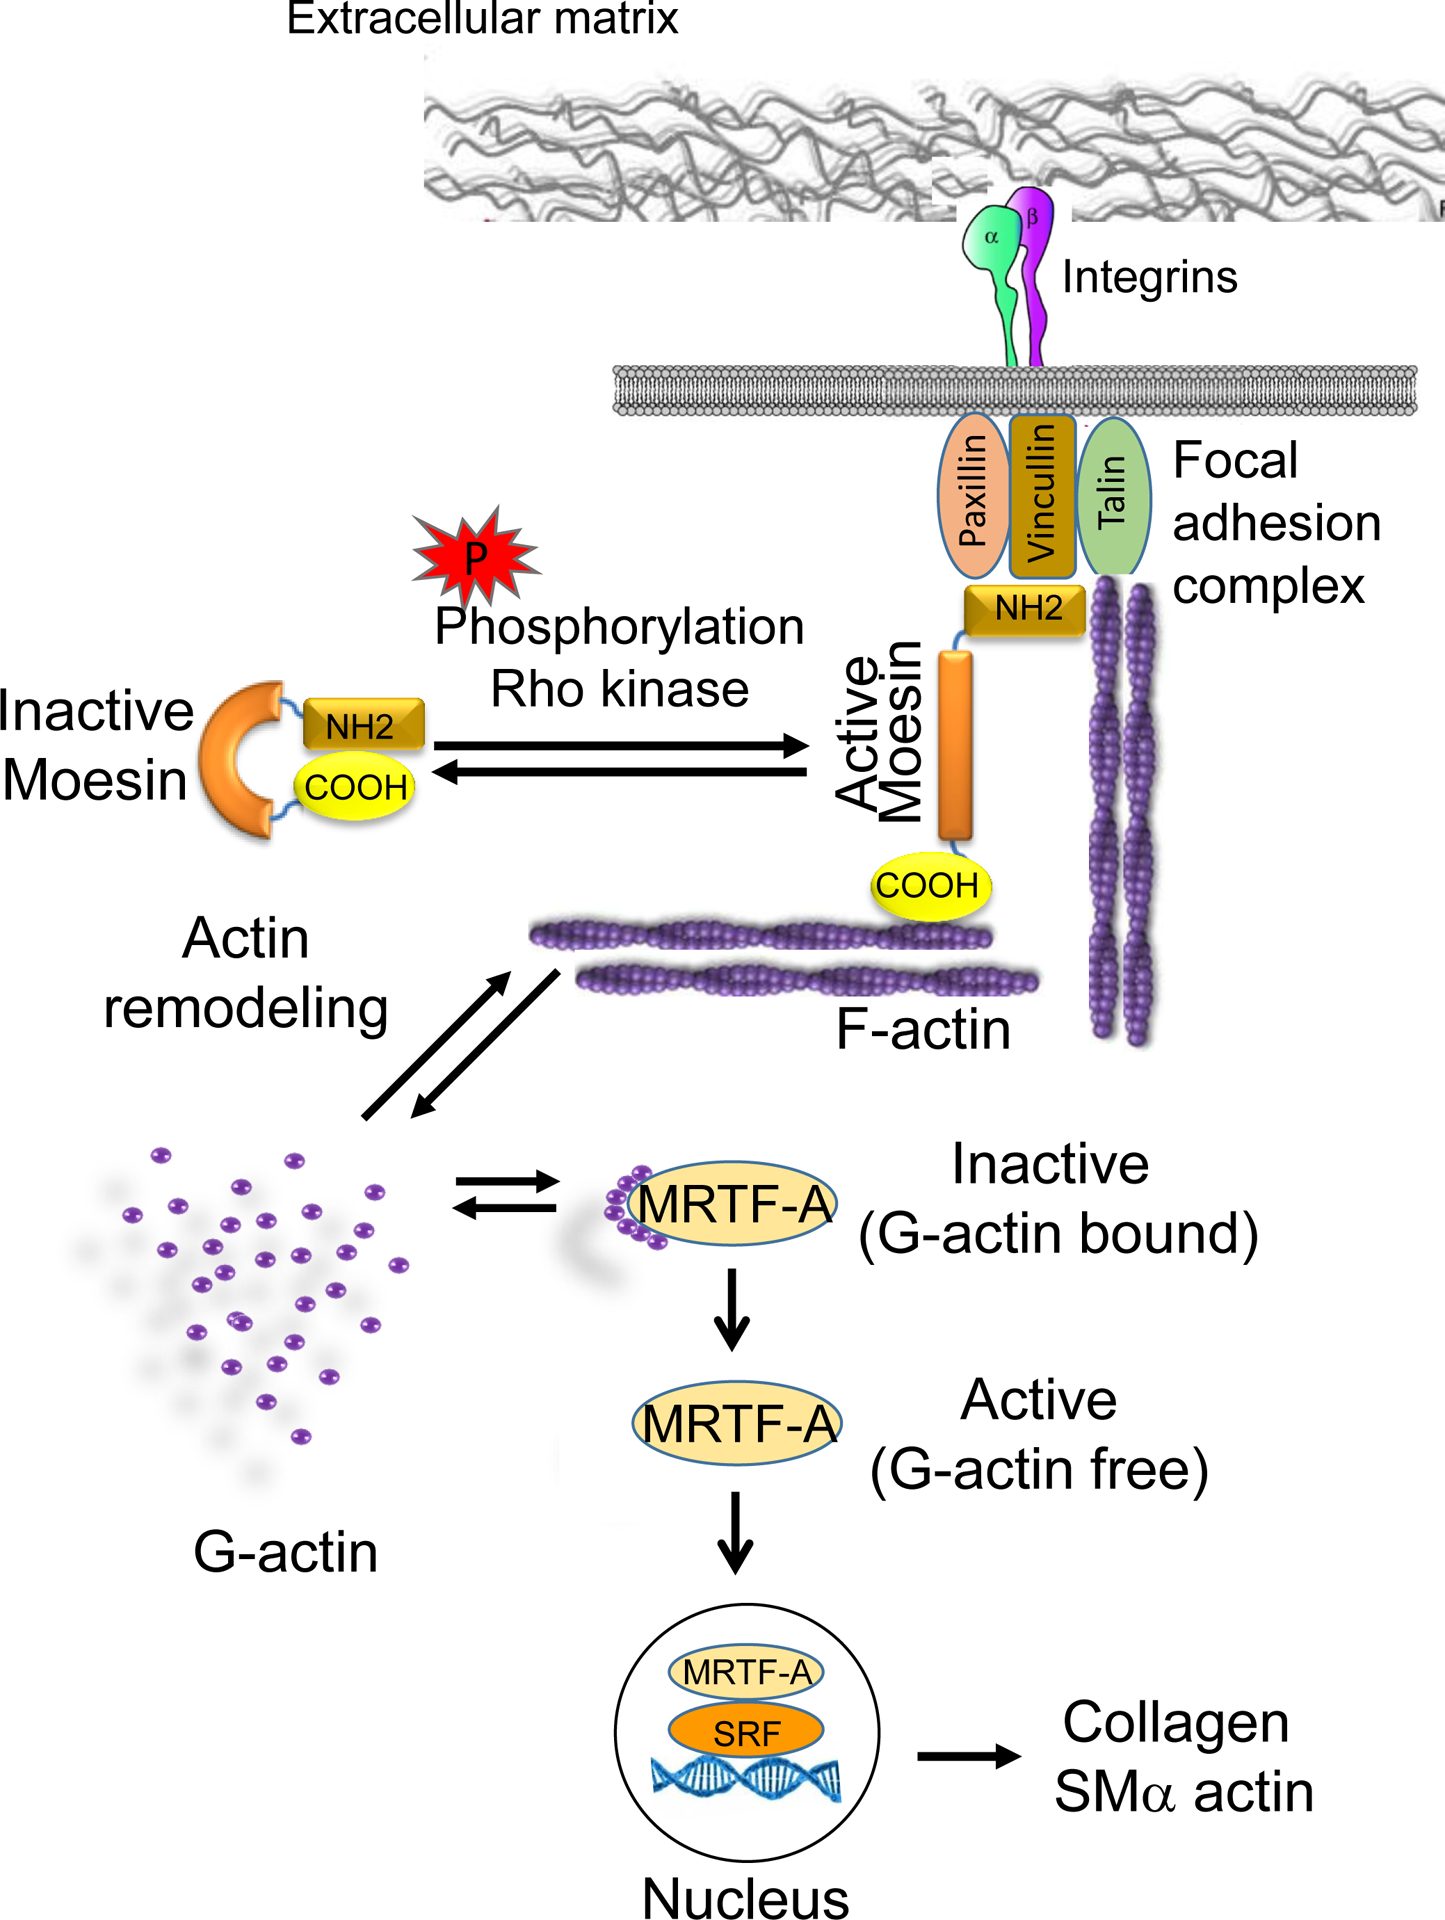
The extracellular domains of integrins bind extracellular matrix (ECM) ligands. This leads to integrin signaling, in turn linking the ECM to focal adhesion proteins and the cytoskeleton. Focal adhesion proteins can bind directly to moesin, actin and integrins. In quiescent HSCs, moesin is present in a “closed” conformation. Phosphorylation of the COOH-terminal threonine (T558) by rho kinase induces and stabilizes the unfolded active conformation of moesin, allowing the COOH-terminal domain to bind to actin filaments and focal adhesion proteins. F-actin engagement with moesin via the moesin binding region effects F-/G-actin turnover. Less G-actin (polymerization of F-actin requires cytoplasmic G-actin) will be available in the cytoplasmic space. Consequently, F-actin stress fiber formation allows MRTF-A to be released from the G-actin state, allowing MRTF-A to enter the nucleus. MRTF-A interaction with serum-response factor (SRF) on CArG box regulatory elements appears to be critical in the regulation of myofibroblast differentiation and extracellular matrix synthesis.
Our data surrounding the role of moesin, and its role in regulation of MRTF-A/SRF are consistent with previous studies that have examined MRTF-A in fibrosis, though these previous studies have not examined moesin mechanistically. Evidence that the MRTF-A pathway plays an important role in fibrosis comes from the understanding that many key genes involved in fibrosis are also SRF target genes that respond to activation by MRTF-A/SRF binding to target promoters, including ACTA2 (18, 24, 25, 27–29, 32–37). For example, MRTF-A knockout/knock down models have reduced fibrosis in the heart (28), lungs (25) and blood vessels (34). Earlier MRTF-A inhibitors have proved efficient in targeting Rho-mediated MRTF/SRF signaling (38–40). It has also been demonstrated that MRTF-A inhibitors reduce SRF reporter gene activity (38, 39). Our data extend this paradigm, linking moesin to the MRTF-A/SRF pathway.
In summary, moesin plays an important role in cytoskeletal function in HSCs - leading to an effect on fibrogenesis. The data suggest that the moesin/MRTF/SRF pathway could be a novel putative therapeutic target in fibrosing liver disease.
Supplementary Material
Figure S1. Alanine aminotransferase and bilirubin levels are similar in wild type and moesin KO mice after CCl4 administration or BDL. After liver injury as in Methods, alanine aminotransferase (ALT) and total bilirubin were measured in the serum of wild type and moesin knock out mice (n=4, no significant (ns) difference for WT vs. moesin KO in either CCl4 and BDL groups).
Figure S2. Proinflammatory cytokine production in wild type and moesin KO livers after liver injury induced by CCl4 administration or BDL. Liver injury was as in Methods; proinflammatory cytokines were measured by RT-qPCR assay of RNA from whole liver (6 weeks after CCL4 administration and 14 days after BDL). Expression of (A) interleukin-1β(IL-1β), (B) interleukin-6 (IL-6), (C) tumor necrosis factor- α(TNF-α) is shown (n=5, no significant (ns) difference between WT vs. moesin KO in either CCl4 or BDL groups) and (D) the grading of portal inflammation was performed as in Methods in WT and moesin KO animals after liver injury (CCL4 and BDL), (n=5, no significant (ns) difference for WT vs. moesin KO in either CCl4 and BDL groups).
Figure S3. Measurement of intrahepatic bile duct mass in wild type and moesin KO livers after liver injury induced by CCl4 administration or BDL. In (A), representative immunohistochemistry images of the cholangiocyte marker cytokeratin-19 (CK-19) are shown (n=4). In (B), imunfluorescent signals from sections as in A were quantitated using Image J software and presented graphically. In (C), total RNA from whole liver was isolated and subjected to PCR at in Methods (n=4, no significant (ns) difference for WT vs. moesin KO in either CCl4 and BDL groups).
Figure S4.Desmin expression in wild type and moesin KO livers after liver injury induced by CCl4 administration or BDL (n=4). After liver injury as in Methods, livers were fixed and labeled to detect desmin (green) as in Methods. In (A), representative images are shown (n=4). In (B), the staining of each immunohistochemical specimen was captured, quantitated using Image J software and depicted graphically (n=4, no significant (ns) difference between the WT vs. moesin KO in either CCl4 and BDL groups).The bar marker represents 50μm.
Figure S5. Expression of integrin beta 3 in wild type and moesin KO HSCs after liver injury induced by CCl4 administration or BDL. Six weeks after CCl4 administration and 14 days after BDL, HSCs were isolated from injured (rat (WT and mouse (KO)) livers as in Methods and placed on glass coverslips. Cells were fixed and labeled to detect the beta-3 integrin (green) and SM?-actin (red) as in Methods. Representative images are shown (n=4). The bar marker represents 10°μm.
Acknowledgments:
The authors thank Yingyu Ren for cell isolations, and Drs. Songling Liu and Zengdun Shi for helpful discussions and technical help handling experimental animals.
Financial Support: This work was supported by NIH grant R01 DK098819.
Abbreviations used (alphabetical order):
- BDL
Bile duct ligation
- CCI4
Carbon tetrachloride
- CFP
Cyan fluorescent protein
- ERM
ezrin-radixin-moesin
- F-actin
Filamentous-actin
- G-actin
Globular actin
- HSC
Hepatic stellate cell
- Jaspl
Jasplakinolide
- KO
Knock out
- MRTF-A
Myocardin related transcription factor-A
- SMα-actin
Smooth muscle alpha actin
- SRF
Serum response factor
- WT
Wild type
References
- 1.Lee UE, Friedman SL. Mechanisms of hepatic fibrogenesis. Best Pract Res Clin Gastroenterol 2011;25:195–206. [DOI] [PMC free article] [PubMed] [Google Scholar]
- 2.Rockey DC, Bell PD, Hill JA. Fibrosis--A Common Pathway to Organ Injury and Failure. N Engl J Med 2015;373:96. [DOI] [PubMed] [Google Scholar]
- 3.Rockey DC. Translating an understanding of the pathogenesis of hepatic fibrosis to novel therapies. Clin Gastroenterol Hepatol 2013;11:224–231 e221–225. [DOI] [PMC free article] [PubMed] [Google Scholar]
- 4.Rockey DC, Weymouth N, Shi Z. Smooth muscle alpha actin (Acta2) and myofibroblast function during hepatic wound healing. PLoS One 2013;8:e77166. [DOI] [PMC free article] [PubMed] [Google Scholar]
- 5.Kawaguchi K, Yoshida S, Hatano R, Asano S. Pathophysiological Roles of Ezrin/Radixin/Moesin Proteins. Biol Pharm Bull 2017;40:381–390. [DOI] [PubMed] [Google Scholar]
- 6.Suda J, Zhu L, Karvar S. Phosphorylation of radixin regulates cell polarity and Mrp-2 distribution in hepatocytes. Am J Physiol Cell Physiol 2011;300:C416–424. [DOI] [PubMed] [Google Scholar]
- 7.Chen YX, Zhang W, Wang WM, Yu XL, Wang YM, Zhang MJ, Chen N. Role of moesin in renal fibrosis. PLoS One 2014;9:e112936. [DOI] [PMC free article] [PubMed] [Google Scholar]
- 8.Okayama T, Kikuchi S, Ochiai T, Ikoma H, Kubota T, Ichikawa D, Fujiwara H, et al. Attenuated response to liver injury in moesin-deficient mice: impaired stellate cell migration and decreased fibrosis. Biochim Biophys Acta 2008;1782:542–548. [DOI] [PubMed] [Google Scholar]
- 9.Speck O, Hughes SC, Noren NK, Kulikauskas RM, Fehon RG. Moesin functions antagonistically to the Rho pathway to maintain epithelial integrity. Nature 2003;421:83–87. [DOI] [PubMed] [Google Scholar]
- 10.Zhu HY, Ng J, Salleh SM, Aung TT, Htoon MH, Beuerman RW. Moesin expression in fibrosis in the mouse cornea after sterile mechanical trauma or infection. Cornea 2014;33:973–980. [DOI] [PubMed] [Google Scholar]
- 11.Zhu HY, Yeo SW, Ng J, Htoon HM, Beuerman RW. Moesin as a key cytoskeleton regulator in corneal fibrosis. Ocul Surf 2013;11:119–132. [DOI] [PubMed] [Google Scholar]
- 12.Fehon RG, McClatchey AI, Bretscher A. Organizing the cell cortex: the role of ERM proteins. Nat Rev Mol Cell Biol 2010;11:276–287. [DOI] [PMC free article] [PubMed] [Google Scholar]
- 13.Jung Y, McCarty JH. Band 4.1 proteins regulate integrin-dependent cell spreading. Biochem Biophys Res Commun 2012;426:578–584. [DOI] [PMC free article] [PubMed] [Google Scholar]
- 14.Pujuguet P, Del Maestro L, Gautreau A, Louvard D, Arpin M. Ezrin regulates E-cadherin-dependent adherens junction assembly through Rac1 activation. Mol Biol Cell 2003;14:2181–2191. [DOI] [PMC free article] [PubMed] [Google Scholar]
- 15.Doi Y, Itoh M, Yonemura S, Ishihara S, Takano H, Noda T, Tsukita S. Normal development of mice and unimpaired cell adhesion/cell motility/actin-based cytoskeleton without compensatory up-regulation of ezrin or radixin in moesin gene knockout. J Biol Chem 1999;274:2315–2321. [DOI] [PubMed] [Google Scholar]
- 16.Ansa-Addo EA, Zhang Y, Yang Y, Hussey GS, Howley BV, Salem M, Riesenberg B, et al. Membrane-organizing protein moesin controls Treg differentiation and antitumor immunity via TGF-beta signaling. J Clin Invest 2017;127:1321–1337. [DOI] [PMC free article] [PubMed] [Google Scholar]
- 17.Singh S, Liu S, Rockey DC. Caveolin-1 is upregulated in hepatic stellate cells but not sinusoidal endothelial cells after liver injury. Tissue Cell 2016;48:126–132. [DOI] [PMC free article] [PubMed] [Google Scholar]
- 18.Shi Z, Rockey DC. Upregulation of the actin cytoskeleton via myocardin leads to increased expression of type 1 collagen. Lab Invest 2017;97:1412–1426. [DOI] [PMC free article] [PubMed] [Google Scholar]
- 19.Karvar S, Suda J, Zhu L, Rockey DC. Distribution dynamics and functional importance of NHERF1 in regulation of Mrp-2 trafficking in hepatocytes. Am J Physiol Cell Physiol 2014;307:C727–737. [DOI] [PubMed] [Google Scholar]
- 20.Kennedy LL, Meng F, Venter JK, Zhou T, Karstens WA, Hargrove LA, Wu N, et al. Knockout of microRNA-21 reduces biliary hyperplasia and liver fibrosis in cholestatic bile duct ligated mice. Lab Invest 2016;96:1256–1267. [DOI] [PMC free article] [PubMed] [Google Scholar]
- 21.Ishak K, Baptista A, Bianchi L, Callea F, De Groote J, Gudat F, Denk H, et al. Histological grading and staging of chronic hepatitis. J Hepatol 1995;22:696–699. [DOI] [PubMed] [Google Scholar]
- 22.Petrescu AD, Grant S, Frampton G, McMillin M, Kain J, Kodali M, Shetty AK, et al. Gulf war illness-related chemicals increase CD11b/c(+) monocyte infiltration into the liver and aggravate hepatic cholestasis in a rodent model. Sci Rep 2018;8:13147. [DOI] [PMC free article] [PubMed] [Google Scholar]
- 23.Rosenberg P, Sjostrom M, Soderberg C, Kinnman N, Stal P, Hultcrantz R. Attenuated liver fibrosis after bile duct ligation and defective hepatic stellate cell activation in neural cell adhesion molecule knockout mice. Liver Int 2011;31:630–641. [DOI] [PubMed] [Google Scholar]
- 24.Leitner L, Shaposhnikov D, Mengel A, Descot A, Julien S, Hoffmann R, Posern G. MAL/MRTF-A controls migration of non-invasive cells by upregulation of cytoskeleton-associated proteins. J Cell Sci 2011;124:4318–4331. [DOI] [PubMed] [Google Scholar]
- 25.Luchsinger LL, Patenaude CA, Smith BD, Layne MD. Myocardin-related transcription factor-A complexes activate type I collagen expression in lung fibroblasts. Journal of Biological Chemistry 2011;286:44116–44125. [DOI] [PMC free article] [PubMed] [Google Scholar]
- 26.Shiwen X, Stratton R, Nikitorowicz-Buniak J, Ahmed-Abdi B, Ponticos M, Denton C, Abraham D, et al. A Role of Myocardin Related Transcription Factor-A (MRTF-A) in Scleroderma Related Fibrosis. PLoS One 2015;10:e0126015. [DOI] [PMC free article] [PubMed] [Google Scholar]
- 27.Sisson TH, Ajayi IO, Subbotina N, Dodi AE, Rodansky ES, Chibucos LN, Kim KK, et al. Inhibition of myocardin-related transcription factor/serum response factor signaling decreases lung fibrosis and promotes mesenchymal cell apoptosis. Am J Pathol 2015;185:969–986. [DOI] [PMC free article] [PubMed] [Google Scholar]
- 28.Small EM, Thatcher JE, Sutherland LB, Kinoshita H, Gerard RD, Richardson JA, Dimaio JM, et al. Myocardin-related transcription factor-a controls myofibroblast activation and fibrosis in response to myocardial infarction. Circ Res 2010;107:294–304. [DOI] [PMC free article] [PubMed] [Google Scholar]
- 29.Olson EN, Nordheim A. Linking actin dynamics and gene transcription to drive cellular motile functions. Nat Rev Mol Cell Biol 2010;11:353–365. [DOI] [PMC free article] [PubMed] [Google Scholar]
- 30.Bakheet AMH, Mahmoud SA, Huang Y, Zhang J, Wang J, Wei Y, Gamallat Y, et al. Ezrin as a possible diagnostic and/or prognostic biomarker in mice lymphatic metastatic hepatocellular carcinoma in vivo. Biofactors 2017;43:662–672. [DOI] [PubMed] [Google Scholar]
- 31.Yeh CN, Pang ST, Chen TW, Wu RC, Weng WH, Chen MF. Expression of ezrin is associated with invasion and dedifferentiation of hepatitis B related hepatocellular carcinoma. BMC Cancer 2009;9:233. [DOI] [PMC free article] [PubMed] [Google Scholar]
- 32.Guettler S, Vartiainen MK, Miralles F, Larijani B, Treisman R. RPEL motifs link the serum response factor cofactor MAL but not myocardin to Rho signaling via actin binding. Mol Cell Biol 2008;28:732–742. [DOI] [PMC free article] [PubMed] [Google Scholar]
- 33.Medjkane S, Perez-Sanchez C, Gaggioli C, Sahai E, Treisman R. Myocardin-related transcription factors and SRF are required for cytoskeletal dynamics and experimental metastasis. Nat Cell Biol 2009;11:257–268. [DOI] [PMC free article] [PubMed] [Google Scholar]
- 34.Minami T, Kuwahara K, Nakagawa Y, Takaoka M, Kinoshita H, Nakao K, Kuwabara Y, et al. Reciprocal expression of MRTF-A and myocardin is crucial for pathological vascular remodelling in mice. EMBO J 2012;31:4428–4440. [DOI] [PMC free article] [PubMed] [Google Scholar]
- 35.Miralles F, Posern G, Zaromytidou AI, Treisman R. Actin dynamics control SRF activity by regulation of its coactivator MAL. Cell 2003;113:329–342. [DOI] [PubMed] [Google Scholar]
- 36.Mokalled MH, Johnson A, Kim Y, Oh J, Olson EN. Myocardin-related transcription factors regulate the Cdk5/Pctaire1 kinase cascade to control neurite outgrowth, neuronal migration and brain development. Development 2010;137:2365–2374. [DOI] [PMC free article] [PubMed] [Google Scholar]
- 37.Trembley MA, Velasquez LS, de Mesy Bentley KL, Small EM. Myocardin-related transcription factors control the motility of epicardium-derived cells and the maturation of coronary vessels. Development 2015;142:21–30. [DOI] [PMC free article] [PubMed] [Google Scholar]
- 38.Tsou PS, Haak AJ, Khanna D, Neubig RR. Cellular mechanisms of tissue fibrosis. 8. Current and future drug targets in fibrosis: focus on Rho GTPase-regulated gene transcription. Am J Physiol Cell Physiol 2014;307:C2–13. [DOI] [PMC free article] [PubMed] [Google Scholar]
- 39.Yu-Wai-Man C, Spencer-Dene B, Lee RM, Hutchings K, Lisabeth EM, Treisman R, Bailly M, et al. Local delivery of novel MRTF/SRF inhibitors prevents scar tissue formation in a preclinical model of fibrosis. Sci Rep 2017;7:518. [DOI] [PMC free article] [PubMed] [Google Scholar]
- 40.Shaw VS, Mohammadiarani H, Vashisth H, Neubig RR. Differential Protein Dynamics of Regulators of G-Protein Signaling: Role in Specificity of Small-Molecule Inhibitors. J Am Chem Soc 2018;140:3454–3460. [DOI] [PMC free article] [PubMed] [Google Scholar]
Associated Data
This section collects any data citations, data availability statements, or supplementary materials included in this article.
Supplementary Materials
Figure S1. Alanine aminotransferase and bilirubin levels are similar in wild type and moesin KO mice after CCl4 administration or BDL. After liver injury as in Methods, alanine aminotransferase (ALT) and total bilirubin were measured in the serum of wild type and moesin knock out mice (n=4, no significant (ns) difference for WT vs. moesin KO in either CCl4 and BDL groups).
Figure S2. Proinflammatory cytokine production in wild type and moesin KO livers after liver injury induced by CCl4 administration or BDL. Liver injury was as in Methods; proinflammatory cytokines were measured by RT-qPCR assay of RNA from whole liver (6 weeks after CCL4 administration and 14 days after BDL). Expression of (A) interleukin-1β(IL-1β), (B) interleukin-6 (IL-6), (C) tumor necrosis factor- α(TNF-α) is shown (n=5, no significant (ns) difference between WT vs. moesin KO in either CCl4 or BDL groups) and (D) the grading of portal inflammation was performed as in Methods in WT and moesin KO animals after liver injury (CCL4 and BDL), (n=5, no significant (ns) difference for WT vs. moesin KO in either CCl4 and BDL groups).
Figure S3. Measurement of intrahepatic bile duct mass in wild type and moesin KO livers after liver injury induced by CCl4 administration or BDL. In (A), representative immunohistochemistry images of the cholangiocyte marker cytokeratin-19 (CK-19) are shown (n=4). In (B), imunfluorescent signals from sections as in A were quantitated using Image J software and presented graphically. In (C), total RNA from whole liver was isolated and subjected to PCR at in Methods (n=4, no significant (ns) difference for WT vs. moesin KO in either CCl4 and BDL groups).
Figure S4.Desmin expression in wild type and moesin KO livers after liver injury induced by CCl4 administration or BDL (n=4). After liver injury as in Methods, livers were fixed and labeled to detect desmin (green) as in Methods. In (A), representative images are shown (n=4). In (B), the staining of each immunohistochemical specimen was captured, quantitated using Image J software and depicted graphically (n=4, no significant (ns) difference between the WT vs. moesin KO in either CCl4 and BDL groups).The bar marker represents 50μm.
Figure S5. Expression of integrin beta 3 in wild type and moesin KO HSCs after liver injury induced by CCl4 administration or BDL. Six weeks after CCl4 administration and 14 days after BDL, HSCs were isolated from injured (rat (WT and mouse (KO)) livers as in Methods and placed on glass coverslips. Cells were fixed and labeled to detect the beta-3 integrin (green) and SM?-actin (red) as in Methods. Representative images are shown (n=4). The bar marker represents 10°μm.