Abstract
Immune-related genes have great potential as prognostic markers in many types of cancer. Therefore, we have attempted to develop immune-related gene markers to enhance the prognosis of breast cancer; 1159 samples of breast cancer gene expression data and clinical follow-up messages were downloaded from TCGA and GEO, which were classified into training set, test set, and validation set. In the training set, the gene pairs are established according to the relative expression levels between 320 immune genes, in which the prognosis-related gene pairs are screened, and Lasso is used for feature selection to screen the robust biomarkers. A prognostic model of immune gene correlation was set up and verified. Sixty-six IRGPs were obtained, and 17-IRGPs signature was established. 17-IRGPs signature is an independent prognostic indicator for BC patients, which can stratify the risk in the training set and testing series, and AUC of five years survival was greater than 0.7; 17-IRGPs signature had better classification performance in patients with advanced BC. In addition, we compared the prognostic characteristics of 17-IRGPs with four reported breast cancers and clinical stages; 17-IRGPs achieved the highest average C index (0.7, P < 0.05), and functional analysis found that the dysregulated immune environment may be the cause of the observed difference in survival between patient groups defined by our characteristics. 17-IRGPs signature was constructed as a newly developed prognostic indicator to calculate the survival of BC patients.
Impact statement
Breast cancer is among the highest prevalent malignant tumors worldwide with a low survival ratio. Immune-related genes have great potential as prognostic indicator in many types of tumors. Therefore, we have attempted to develop immune-related gene markers to enhance the prognosis of breast cancer. 17-IRGPs signature was constructed as a newly developed prognostic indicator to predict the survival of BC patients.
Keywords: Bioinformatics, immune genes, prognostic markers, TCGA, IRGPs
Introduction
Breast cancer (BC) is the primary cause of cancer-related morbidity and mortality experienced by women. Even though patients with earlier BC can be treated with surgery, the relapse risk is quite high. BC genotype and cancer grade are the two top characteristics, and they are the strongest prognostic indicators in BC.1–5 The TNM staging system of American Joint Committee on Cancer is presently the only prognostic grading system currently available in clinical practice for selecting people with adjunctive chemotherapy.6–11 Nevertheless, the TNM staging system cannot accurately anticipate relapse in breast cancer with radical surgery in many patients. Gene expression profiling based on microarrays has been successfully applied to clinical cancer research to segment cancer, anticipate prognosis, or assess treatment response.12–14 However, only a few of these studies have shown clear prognostic significance. To date, in clinical practice, only BRCA1/2 mutation gene has been considered as a predictor for BC.15–19 This implies that recognizing robust genetic signatures still poses a challenge, requiring more queues to confirm signatures.
The accessibility of shared large-scale gene expression datasets offers a chance to recognize potentially more promising BC molecular biomarkers. However, in order to use all of this intelligence meaningfully, the complexity of data is also a formidable burden. Classic methods of utilizing gene expression levels require proper standardization, which is a formidable mission because of the potential bio-heterogeneity between datasets and the technical bias in measurement platforms. In contrast, methods based on relative sequencing of gene expression levels remove the requirement for data pre-processing, such as scaling and normalization, and have been proven to yield robust outcomes in a variety of applications containing cancer categorization.
An active immune response is crucial to manage tumor metastasis and advancement. Therefore, substantial evidence indicates a link between the good outcomes of diverse tumors and tumor-infiltrating lymphocytes (TILs), and20–23 a wide variety of elements of the immune system are deciding factors during cancer occurrence and progression. Escape from immune damage has been considered as marker of carcinoma.23 Immunotherapy, such as programmed death-1 (PD-1)/programmed death ligand 1 (PD-L1) inhibitors or tumor vaccines, is being developed a beneficial new treatment for many cancers. It has been reported that immunization has a significant and long-lasting response in BC. For example, TILs are predictor for triple-negative breast cancer, predicting the benefits of trastuzumab in early BC,24 tumor-associated lymphocytes as stand-alone predictors of neologically adjuvant chemotherapy response in BC,25 and CD8 + T cell infiltration is associated with BC survival.26 However, the molecular characterization of tumor immune interactions still needs to be fully investigated in terms of its prognostic potential in BC.
In this work, to validly recognize a trusted BC prognosis-associated immune gene indicators, we introduced a systematic channel to detect BC-associated immune gene markers. Gene expression profiling data of BC patients were obtained from large datasets in the TCGA and GEO databases to explore and prove personalized prognostic features of BCs based on immune-related gene pairs (IRGPs). We found that the 17-IRGPs signature is participated in vital biological processes and pathways in BC. The ssGSEA analysis also implied analogous results, suggesting that 17-IRGPs signature can strongly contribute to the prediction of the prognosis risk of patients with BC and offer a basis for better knowledge of the underlying molecular mechanism of BC prognosis.
Materials and methodologies
Data collection and analysis
RNA-seq FPKM data were collected from TCGA using GDC API containing 1222 samples, including 1109 tumor tissue samples and 113 normal samples. The chip dataset GSE2068527 of the Affymetrix Human Genome U133 Plus 2.0 Array platform, containing a whole of 327 samples and the chip dataset GSE739028,29 of the Affymetrix Human Genome U133A Array platform, containing altogether 198 samples were downloaded from GEO. All patients underwent surgically negative margin surgery, did not receive adjuvant or neoadjuvant treatment, and had open access to gene expression data and survival data downloaded on 5 April 2019. Furthermore, we downloaded all the genes (a total of 320 genes) related to four immune pathways, which were M13664 (immune system process), M19817(immune response), M14818 (immune effector process) and M3457 (immune system development), from the Molecular Signatures Database v4.0 database as immune-related gene sets.30
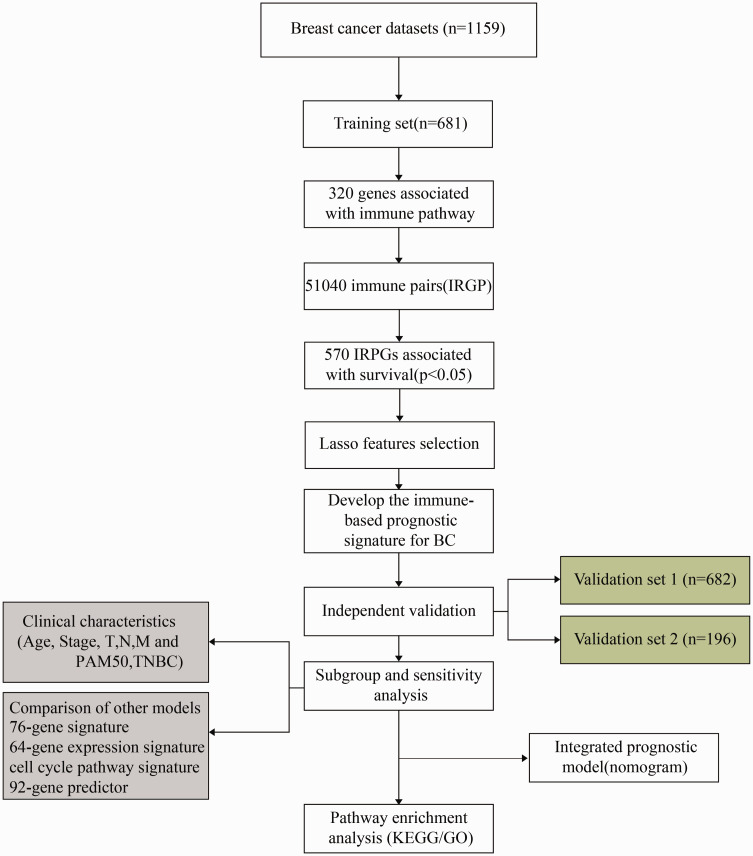
For the TCGA RNAseq data, we screened 1038 tumor samples with follow-up information and OS greater than 0, extracted the expression profile of the immune-related gene set, and removed the gene with the expression level of 0 in 50% of the samples. For chip datasets, we screened samples with follow-up information and OS greater than 0; probes were mapped to genes, probes were mapped to genes, and the probes were removed, while those mapped to a single gene were kept to take the median value to obtain gene expression profile, from which the expression profile of immune gene sets were extracted. The expression profiles of immune gene sets were extracted. The final statistics of every dataset sample is shown in Table 1, and the study design and workflow are shown in Figure 1.
Table 1.
Clinical information of three datasets.
| Characteristic | TCGA (n=1038) | GSE20685 (n=325) | GSE7390 (n=196) |
|---|---|---|---|
| Survival status | |||
| Alive | 891 | 242 | 141 |
| Dead | 147 | 83 | 55 |
| pathologic_T | |||
| T1 | 277 | 101 | |
| T2 | 593 | 186 | |
| T3 | 129 | 26 | |
| T4 | 36 | 12 | |
| TX | 3 | ||
| pathologic_N | |||
| N0 | 485 | 137 | |
| N1 | 353 | 86 | |
| N2 | 110 | 62 | |
| N3 | 73 | 40 | |
| NX | 17 | ||
| pathologic_M | |||
| M0 | 855 | 317 | |
| M1 | 21 | 8 | |
| MX | 162 | ||
| Tumor stage | |||
| I | 180 | ||
| II | 587 | ||
| III | 230 | ||
| IV | 19 | ||
| X | 22 | ||
| Age | |||
| ≤50 | 289 | 201 | 130 |
| >50 | 749 | 124 | 66 |
| Gender | |||
| Female | 1026 | ||
| Male | 12 |
Figure 1.
Workflow of this study. (A color version of this figure is available in the online journal.)
Construction of immune gene pair
Firstly, we constructed pairs of any two genes according to 320 immune genes by traversing all the genes, and obtained a whole of 51,040 immune gene pairs (IRGPs). For two genes i and j in any sample, the IRGP value is defined as follows
IRG represents the expression level of the gene. We calculated all IRGP values of all samples, respectively, and further filtered the IRGPs with standard deviation of 0.
Sample grouping
Since IRGPs are discrete values of relative ranks of genes and independent of the data platform, we combined the TCGA and GSE20685 data, including a total of 1363 samples and further divided the samples into two groups, age range and clinical stage; the period of follow-up and the percentage of patients died were similar in the two groups, and the number of dichotomous samples was closed after the clustering of gene expression profiles of the two groups. One of them is used as a training set (n = 681), one used as a verification set (n = 682), and GSE7390 is used as an external verification set. The sample characteristics of each group are as shown in Table 2.
Table 2.
Sample statistics of training set, test set, and independent verification set.
| Clinical features | Overall | Training set | Testing set | Independent set |
|---|---|---|---|---|
| Stage_T | ||||
| T1 | 378 | 197 | 181 | |
| T2 | 779 | 383 | 396 | |
| T3 | 155 | 71 | 84 | |
| T4 | 48 | 27 | 21 | |
| TX | 3 | 3 | 0 | |
| Stage_N | ||||
| N0 | 622 | 300 | 322 | |
| N1 | 439 | 240 | 199 | |
| N2 | 172 | 72 | 100 | |
| N3 | 113 | 58 | 55 | |
| NX | 17 | 11 | 6 | |
| Stage_M | ||||
| M0 | 1172 | 601 | 571 | |
| M1 | 29 | 11 | 18 | |
| MX | 162 | 69 | 93 | |
| Age | ||||
| 0–40 | 141 | 73 | 68 | |
| 40–50 | 349 | 167 | 182 | |
| 50–60 | 345 | 171 | 174 | |
| 60–70 | 305 | 149 | 156 | |
| 70–100 | 223 | 121 | 102 | |
| Status | ||||
| 0 | 1133 | 574 | 559 | 141 |
| 1 | 230 | 107 | 123 | 55 |
Construction of prognostic immune gene signature
LASSO is a popular regression modeling approach that has a wide range of possible prognostic characteristics, because it can execute automatic feature selection in a way that usually has signatures with great prognostic performance.31 The LASSO method has been developed to cover the Cox model for survival assessment and has been successfully applied to establish sparse signatures for survival prognosis purpose in many fields areas such as tumors.32–34 We carried out a Univariate Cox proportional hazard regression analysis for every IRGP using a sample of training sets, and a log rank P < 0.05 as a cutoff value for discerning prognostic IRGPs. Furthermore, R software package glmnet35 was further used to carry out robust prognostic features, and 10-fold cross validation was employed to assess the optimal features. Multivariate Cox regression analysis was further carried out with stepwise regression method, and the following risk scoring model is set up
where n is the amount of prognostic IRGPs, is the valuation of prognostic IRGPs, and is the calculated regression coefficient of IRGPs.
Functional enrichment analyzes
Kyoto Encyclopedia of Genes and Genomes (KEGG) pathway enrichment examine and Gene Ontology (GO) were carried out via R package clusterprofiler36 to identify biological processes, molecular function, and cellular component of GO terms and KEGG pathway. A FDR < .05 was thought as significance.
Single sample gene set enrichment analysis (ssGSEA) was conducted by the R package GSVA37 via the MSigDB38 C2 Canonical pathways gene set collection, which contains 1320 gene sets.
Statistical analysis
Kaplan–Meier (KM) curve was drawn as the mean risk score in each dataset which was used as a threshold for the comparison of survival risk between the high- and the low-risk group. Multivariate Cox regression analysis was carried out to examine whether the IRGPs were independently prognostic events. Significance was classified as P < 0.05, both of which were two-sided tests. The ROC analysis uses the R package pROC,39 in which the heat map is drawn via the R package pheatmap,40 and the C-index calculation by the R package RMS.41 If not specified, default parameters were used, all in R 3.4.3.
Results
The expression profile of immune-correlated genes in BC samples was highly correlated
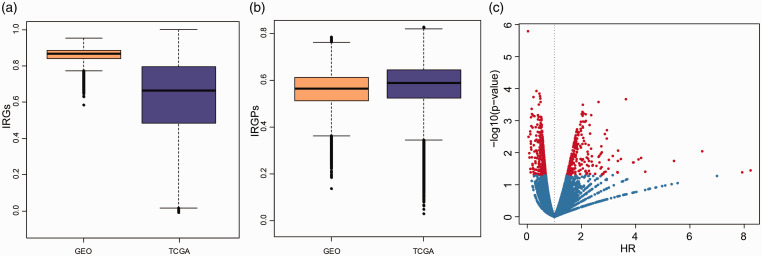
For the GEO and TCGA datasets, the correlation distribution of immune gene expression among each sample was analyzed (Figure 2(a)). In the GEO dataset, there was a higher correlation (mean correlation >0.85) and a lower standard deviation of immune gene expression among samples, while in the TCGA dataset, there was a lower correlation (mean correlation > 0.6) and a higher standard deviation of immune gene expression among samples, which may be related to the multi-center source of TCGA samples. All in all, there is a high consistency of immune gene expression profile among these samples, and there are differences between different platforms. Furthermore, we computed the IRGPs of each sample and explained the IRGPs correlation between each sample (Figure 2(b)); both the GEO and TCGA datasets have high correlation (average correlation > 0.55), and it is worth mentioning that the correlation distribution between the two datasets tends to be consistent. These results suggested that IRGPs could effectively reduce the differences caused by different data platforms.
Figure 2.
The expression profiles of immune-related genes among BC samples are highly correlated. (a) Distribution boxplot of immune-related gene expression profiles between samples of GEO dataset and TCGA dataset. (b) Distribution boxplot of IRGPs correlation between samples of GEO dataset and TCGA dataset. (c) Risk ratio (HR) and prognostic significance of volcanography. (A color version of this figure is available in the online journal.)
Identification of a 17-IRGPs signature for BC survival
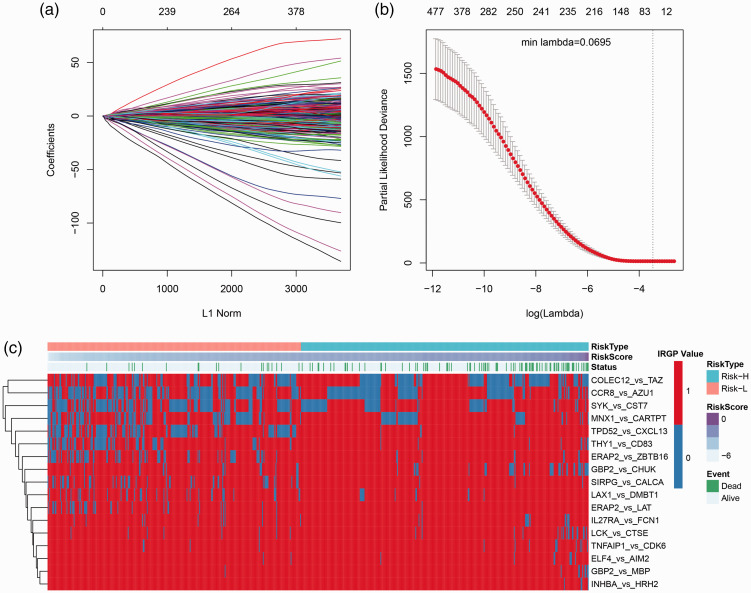
The relationship between IRGPs and prognosis was analyzed by univariate survival analysis, as shown in IRGPs HR (hazard ratio) and the significance of volcanic map (Figure 2(c)), among which 570 IRGPs with significant prognosis. Lasso was used for dimensionality reduction analysis, in which the 10-fold cross-validation was selected, the error rate is the minimum when λ = 0.0695 (Figure 3(a) and (b)) and a total of 66 IRGPs were obtained. Furthermore, stepwise multifactor regression was used to screen the least IRGPs with sufficient fitting degree, and finally 17 IRGPs were identified, and the distribution of these 17 IRGPs in each sample was determined (Figure 3(c)), which showed that 8 of these 17 IRGPs are protective factors and 9 are risk factors. The HR of these 17 IRGPs is shown in Table 3, and the risk formula is as follows
Figure 3.
Results of Lasso regression analysis. (a) The change trajectory of every autovariable, the horizontal axis indicating the logarithm of the autovariable λ, and the vertical axis indicating the coefficient of the autovariable. (b) The average error interval for each lambda. (c) Relationship between 66 IRGPs and risk score. (A color version of this figure is available in the online journal.)
Table 3.
17 prognostic IRGPs.
| IRGPs | Coef | P value | HR | Low.95.CI. | High.95.CI. |
|---|---|---|---|---|---|
| LCK_vs_CTSE | −1.34145 | 3.02E-05 | 0.261466 | 0.13923 | 0.491015 |
| GBP2_vs_MBP | −2.34651 | 0.000115 | 0.095702 | 0.029046 | 0.315325 |
| COLEC12_vs_TAZ | −0.66023 | 0.001135 | 0.516734 | 0.347216 | 0.769012 |
| THY1_vs_CD83 | 1.620052 | 0.001321 | 5.053355 | 1.880053 | 13.58281 |
| INHBA_vs_HRH2 | −2.58346 | 0.00272 | 0.075512 | 0.013946 | 0.40888 |
| CCR8_vs_AZU1 | 0.577867 | 0.008057 | 1.782233 | 1.16232 | 2.732772 |
| SYK_vs_CST7 | 0.627731 | 0.009513 | 1.873354 | 1.165629 | 3.010785 |
| ERAP2_vs_ZBTB16 | 1.033219 | 0.013751 | 2.810096 | 1.235229 | 6.392854 |
| ELF4_vs_AIM2 | −1.30961 | 0.014578 | 0.269926 | 0.094382 | 0.771971 |
| GBP2_vs_CHUK | −0.6816 | 0.01545 | 0.505806 | 0.291342 | 0.878143 |
| TPD52_vs_CXCL13 | 0.776274 | 0.037776 | 2.173359 | 1.044815 | 4.520883 |
| SIRPG_vs_CALCA | 0.776367 | 0.073936 | 2.173562 | 0.927614 | 5.093037 |
| MNX1_vs_CARTPT | 0.41659 | 0.111214 | 1.51678 | 0.908425 | 2.532539 |
| TNFAIP1_vs_CDK6 | −0.69727 | 0.1651 | 0.497942 | 0.186041 | 1.332749 |
| ERAP2_vs_LAT | 0.838926 | 0.198932 | 2.313881 | 0.643357 | 8.322049 |
| LAX1_vs_DMBT1 | 0.657293 | 0.206221 | 1.929562 | 0.69636 | 5.346674 |
| IL27RA_vs_FCN1 | −0.36307 | 0.293667 | 0.695535 | 0.353198 | 1.369683 |
RiskScore = −1.3414526*LCK_vs_CTSE-2.3465119*GBP2_vs_MBP-0.6602279*COLEC12_vs_TAZ + 1.6200523*THY1_vs_CD83-2.5834641*INHBA_vs_HRH2 + 0.5778671*CCR8_vs_AZU1 + 0.6277307*SYK_vs_CST7 +1.0332187*ERAP2_vs_ZBTB16-1.3096065*ELF4_vs_AIM2-0.6816013*GBP2_vs_CHUK + 0.7762737*TPD52_vs_CXCL13 +0.7763675*SIRPG_vs_CALCA + 0.4165898*MNX1_vs_CARTPT-0.6972717*TNFAIP1_vs_CDK6 + 0.8389264*ERAP2_vs_LAT + 0.6572929*LAX1_vs_DMBT1-0.3630734*IL27RA_vs_FCN1.
The prognostic role of 17-IRGPs signature was verified
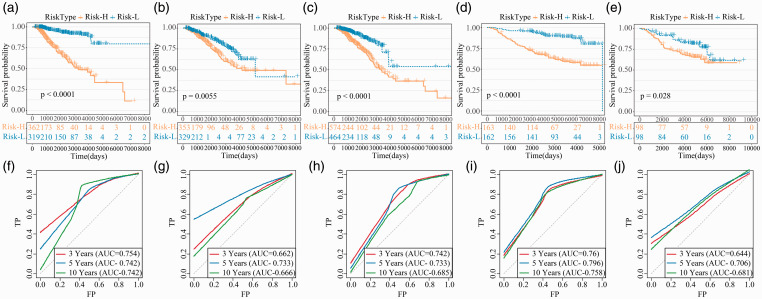
17-IRGPs signature separate people into high- and low-risk populations in the training set, and the prognosis in the high-risk group is vitally weaker than that in the low-risk populations (Figure 4(a)). There is also a difference in prognosis in the testing set (Figure 4(b)), and the same result is found in the external validation set (Figure 4(c)). The prognosis of the high-risk populations in the TCGA and GSE20685 data was also vitally weaker than the low-risk populations (Figure 4(d) and (e)). The ROC of 17-IRGPs signature in training set, test set, external verification set, TCGA and GSE20685 was analyzed, and the average AUC of 3 years, 5 years and 10 years was > 0.7 (Figure 4(f) to (j)).
Figure 4.
The prognosis of 17-IRGPs signature in each dataset. (a–e) KM curves of OS for the Risk-H and Risk-L group samples in training set, test set, training set + test set, GSE20685 and GSE7390 datasets. (f–j) ROC curves of 3, 5, and 10 year for the training set, test set, training set + test set, GSE20685, and GSE7390 datasets. (A color version of this figure is available in the online journal.)
Subgroup and sensitivity analysis of 17-IRGPs signature
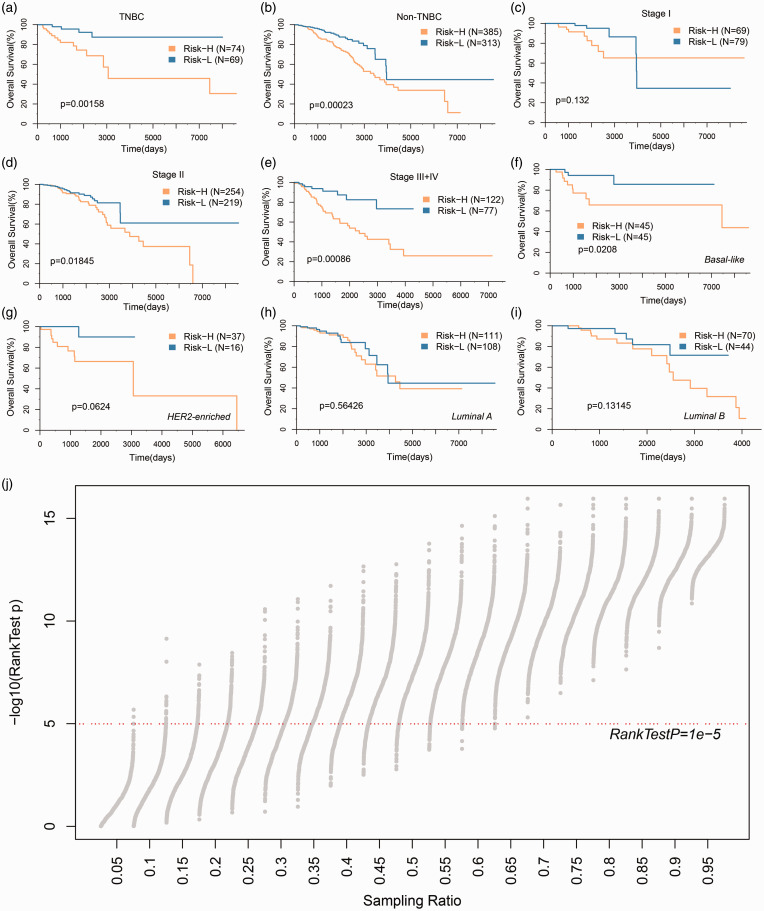
To assess the stability of different clinical subgroups and models, we analyzed the classification performance of the models in TNBC and non-TNBC samples, respectively (Figure 5(a) and (b)), and the high- and low-risk samples showed significant prognostic differences in both types of samples. The models were applied to patients in different stages, where there were no prognostic differences among the high- and low-risk populations in the Stage I sample (Figure 5(c)), and significant differences in Stage II, Stage III+IV populations (Figure 5(d) and (e)); among the most significant samples in Stage III+IV populations, this suggests that 17-IRGPs signature may be more suitable for risk stratification in advanced patients. The model was further applied to different PAM50 molecular subtypes to observe the model’s prognostic classification performance, which was expected to be the most significant in the basal-like group, which has the adverse prognosis (Figure 5(f) to (i)). In order to know the robustness of 17-IRGPs, we randomly resampled 1000 samples from different datasets in different combinations to classify the resampled samples, and most of the P values can be less than 1e-5 under resampling conditions of different proportions (Figure 5(j)), and those results show its steady predictive power.
Figure 5.
Prognostic classification performance of 17-IRGPs signature in clinical subgroups. (a) KM curve in TNBC samples by 17-IRGPs signature. (b) KM curve in non-TNBC samples by 17-IRGPs signature. (c) KM curve in Stage I samples by 17-IRGPs signature. (d) KM curve in Stage II samples by 17-IRGPs signature. (e) KM curve in Stage III+IV samples by 17-IRGPs signature. (f) KM curve in Basal-like samples by 17-IRGPs signature. (g) KM curve in Her2-enriched samples by 17-IRGPs signature. (h) KM curve in Luminal A samples by 17-IRGPs signature. (i) KM curve in Luminal B samples by 17-IRGPs signature. (j) The log rank test P value distribution of 1000 random samples under different sampling ratios, and the x-axis indicates the sampling ratio. (A color version of this figure is available in the online journal.)
Potentially related regulatory pathways for 17-IRGPs
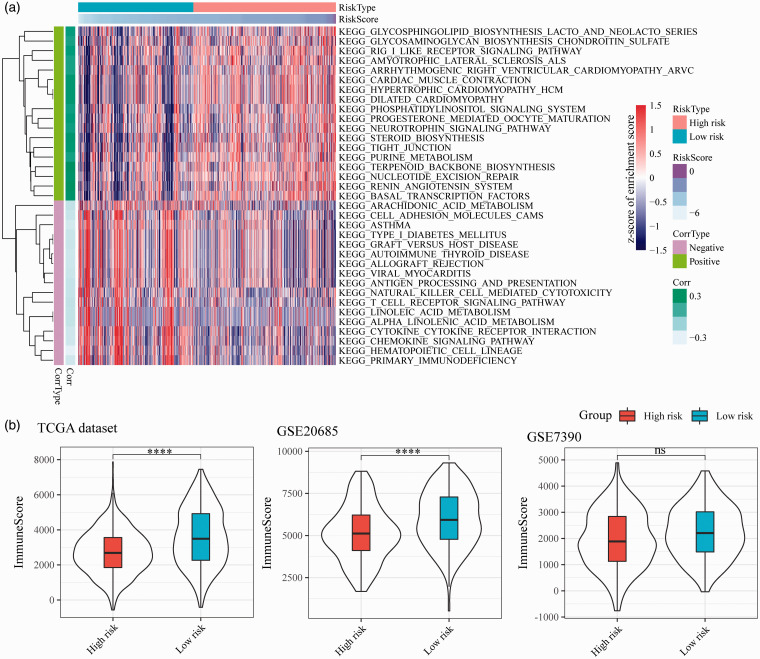
In order to analyze the function of 17-IRGPs, we first analyzed the enrichment scores of each sample in the TCGA dataset in pathways by using ssGSEA, and further calculated the correlation between 17-IRGPs and pathways, and selected FDR < 0.05 as the threshold. Finally, 73 significantly correlated pathways were screened. There are 44 positive correlations and 29 negative correlations, of which 35 have significant correlations > 0.2 (P < 0.05) (Figure 6(a)). Most of the negative correlations in these pathways are related to immunity and metabolism, such as CYTOKINE CYTOKINE RECEPTOR INTERACTION, PRIMARY IMMUNODEFICIENCY, ANTIGEN PROCESSING AND PRESENTATION, ARACHIDONIC ACID METABOLISM, LINOLEIC ACID METABOLISM, T CELL RECEPTOR SIGNALING PATHWAY, and Positive correlation pathways, NUCLEOTIDE EXCISION REPAIR, STEROID BIOSYNTHESIS, TIGHT JUNCTION were closely related to the cell cycle. These results indicated that abnormalities in the metabolic, immune, and cell cycle-related pathways in the high-risk group are the potential targets for breast cancer prognosis. Further, R software package was carried out to compute the difference between the immune microenvironment scores of high- and low-risk samples, and we observed that high-risk samples had a lower immune microenvironment score (Figure 6(b)).
Figure 6.
17-IRGPs-related biological pathways. (a) The most relevant KEGG pathway heat map by 17-IRGPs signature, the horizontal axis indicating the sample, the vertical axis indicating the KEGG Pathway, color represents the enrichment score, Corrtype represents the positive and negative correlation, and corr represents the correlation. (b) Influence of gene signature on immune microenvironment. (A color version of this figure is available in the online journal.)
17-IRGPS signature in comparison to other signatures and clinical features
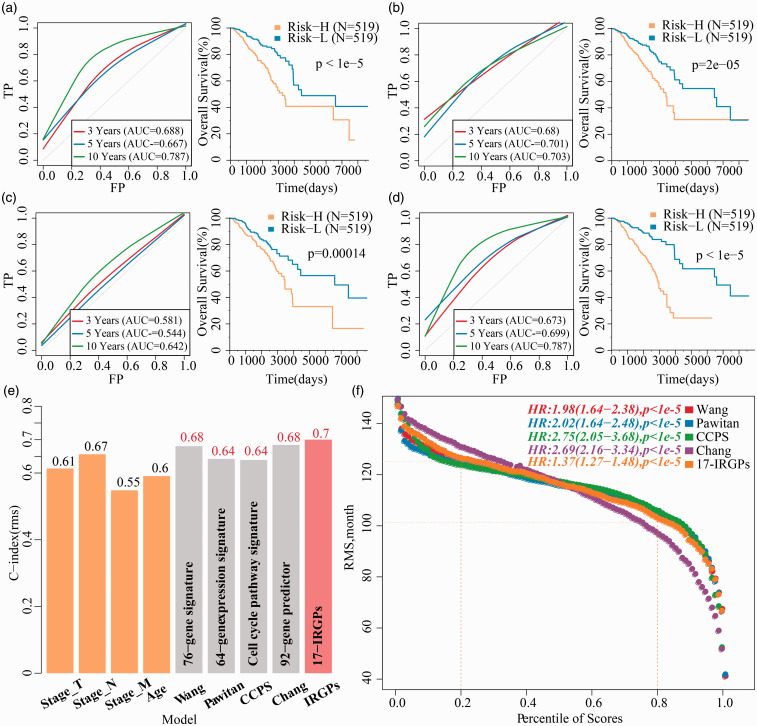
We made a comparison for the precision of 17-IRGPs model prediction with four reported signatures of prognostic features of breast cancer, such as 76-gene signature (Wang),42 64-gene expression signature (Pawitan),43 cell cycle pathway signature (CCPS),44 and 92-gene predictor (Chang).45 To enable the models comparable, we computed the risk score of every BC patient in TCGA depending on the corresponding genes in the four models using the identical method, evaluated the ROC of four models, and classified the samples into risk-high and risk-low samples based on the median Risk score, and computed the OS prognosis difference among the two groups; 76-gene signature (Figure 7(a)), 64-gene expression signature (Figure 7(b)), and 92-gene predictor (Figure 7(c)) have better ROC, and they can effectively classify the samples at high and low risk, while ROC of cell cycle pathway signature (Figure 7(d)) model was relatively poor. However, it was lower than the AUC of the 17-IRGPs model in three and five years. Furthermore, we calculated the C-index of these four models and the age, T, N, M, and 17-IRGPs models, of which 17-IRGPs have the highest C-index (Figure 7(e)). Restricted mean survival (RMS) was used to evaluate the predictive performance of five models at different points in time (Figure 7(f)), and five of the models showed some crossover in 110 months. When <110 months, the 76-gene signature, 64-gene expression signature, cell cycle pathway signature, and 17-IRGPs risk model performed better than the 92-gene predictor model. This suggested that our risk model is more suitable for predicting survival data within 10 years.
Figure 7.
17-IRGPs in comparsion to other signatures and clinical characteristic. The KM curve of OS in Risk-H/Risk-L samples and ROC of the 76-gene signature risk model. (b) The KM curve of OS in Risk-H/Risk-L samples and ROC of the 64-gene signature risk model. (c) The KM curve of OS in Risk-H/Risk-L samples and ROC of the cell cycle pathway signature risk model. (d) The KM curve of OS in Risk-H/Risk-L samples and ROC of the 92-gene predictor signature risk model. (e) C-index of T, N, M, Age, and five prognostic risk models. (f) RMS (restricted mean survival) curve of five prognostic risk models, the dash line represents the RMS time (months) corresponding to the 20% and 80% percentile scores, respectively. (A color version of this figure is available in the online journal.)
Nomogram predicts OS probability
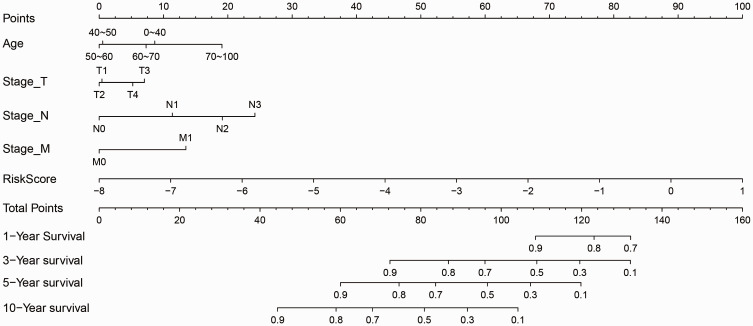
Considering that T, N, M, and Age are prognostic factors for breast cancer, we integrated T, N, M, Age, and 17-IRGPs to establish a new nomogram that combines important independent prognostic predictors (Figure 8). According to this model, 17-IRGPs contributed the most to OS, followed by N-segment, age, M-segment, and T-segment. By calculating the total score, oncologists can easily obtain the OS probability predicted by the nomogram of individual patients.
Figure 8.
Prognostic nomogram for predicting OS in BC patients.
Discussion
BC is a strongly heterogeneous illness in regard of prognosis because BC patients with identical TNM stages have different survival life. As more and more BC is increasingly detected and treated in the early stages, traditional clinicopathological criteria such as TNM staging have become challenging to match the current requirement of predicting individual results, particularly at risk stratification, because no “one size fits all” approach to treatment has proven successful.46,47 Therefore, identification of prognostic markers that adequately describe the biological characteristics of tumors is essential for individualized management of breast cancer people. Prognostic biomarkers are key to risk stratification and treatment decisions in BC groups. In this work, we examined the expression spectrum of 1559 breast cancer samples and identified a robust 17 IRGPs associated with OS, which was validated in two independent study cohort. 17-IRGPs could divide BC samples into groups with different clinical and biological results. 17-IRGPs have greater correctness than many existing biomarkers. We then combined 17-IRGPs with clinical factors and show that 17-IRGPs have higher accuracy in advanced BC. Finally, clinical staging was used to establish nomogram to help clinicians predict the prognosis and make personalized treatment decisions for BC patients.
Given the inherent heterogeneity of tumors and the technogenetic deviations induced by sequencing or microarray platforms, the classical prognostic risk models demand appropriate standardization of gene expression spectrum, which is the bottleneck. In order to know the robustness characteristics of BC predictions, we used a robust method, no matter what the technical deviations are between different platforms.48 Our propose signature is dependent on the absolute ranking of gene expression values and involves only pairwise comparisons within the gene expression spectrum of the samples; thus, no data normalization is required and no data pre-processing (e.g. scaling and normalization) is required, and this method could produce reliable results in various studies.49–51 Therefore, our prognostic characteristics can be used as precision therapy estimates of BC life and can be easily converted to clinical application.
Prognosis biomarkers correlated with tumor immune microenvironment may have good prospects in evaluating new molecular objective of immunotherapy and promoting patient management. Hida et al.52 found that the proliferation and spread of tumor infiltrating lymphocytes are a hallmark of prognosis and chemotherapy outcome of triple-negative breast cancer, and Hill et al.53 found that the collection of stromal cells in oncology microenvironment accelerates the metastasis and expansion of BC. Abnormal immune microenvironment is strongly associated with the invasion and metastasis of breast cancer. Most of the genes encompassed in immune characteristics are also cytokines and cytokine receptors, which carry pivotal role in chemotaxis, angiogenesis, and inflammation. Enhanced inflammatory microenvironment has been proven to be a consistent element of tumor processes. Unlike immunological and inflammatory silencing of apoptosis, necrosis results in release proinflammatory intracellular contents into the tumor microenvironment and triggers inflammatory responses affecting a variety of immune cells. Furthermore, tumor-associated neutrophils have been demonstrated to be responsible for prognosis in multiple cancer types. We discovered that these immune-related characteristic genes are mainly enriched to T cell activation, cell–cell adhesion, T cell receptor signaling pathway, Th17 cell differentiation, Cytosolic DNA-sensing pathway, T cell receptor signaling pathway, and other biological processes (Figure S1). CYTOKINE RECEPTOR INTERACTION, PRIMARY IMMUNODEFICIENCY, T CELL RECEPTOR SIGNALING PATHWAY, ANTIGEN PROCESSING, AND PRESENTATION in the TCGA dataset of high-immune risk group were consistently significantly inhibited. Based on the above findings, the dysregulated immune environment may be the cause of the observed difference in life between the patient groups defined by our characteristics.
Notwithstanding the fact that we identified possible candidate genes for tumor prediction in large samples through bioinformatics tools, some restrictions of this study should be addressed. Initially, the sample was devoid of some clinical follow-up messages, so we did not account for factors such as the existence of other health conditions in patient to discriminate biomarkers. Second, the results achieved through bioinformatics studies are inadequate and experimental verification is needed to substantiate these results. Therefore, genetic and laboratory studies of substantially larger sample sizes and laboratory validation are also necessary.
Conclusions
In summary, in this work, we exploited a 17-IRGPs prognostic stratification system that has a promising AUC in both the training set and the validation set, and is independent of clinical features, and the gene classifier can lead to a better survival risk prediction in comparison to clinical features. Therefore, we propose to use this classifier as a molecular diagnostic test to help estimate the prognosis risk of breast cancer people.
Supplemental Material
Supplemental material, sj-pdf-1-ebm-10.1177_1535370220936964 for Development and verification of a personalized immune prognostic feature in breast cancer by HongLei Wang, Li Wu and HongTao Wang in Experimental Biology and Medicine
Authors’ contributions
HLW conceived and guided the research; LW and HTW analyzed the data; HLW wrote the manuscript and identified the research and editorial manuscript. All authors read and confirmed the manuscript.
DECLARATION OF CONFLICTING INTERESTS
The author(s) declared no potential conflicts of interest with respect to the research, authorship, and/or publication of this article.
FUNDING
The author(s) received no financial support for the research, authorship, and/or publication of this article.
ORCID iD
HongLei Wang https://orcid.org/0000-0002-5979-8331
SUPPLEMENTAL MATERIAL
Supplemental material for this article is available online.
References
- 1.Rakha EA, Teoh TK, Lee AH, Nolan CC, Ellis IO, Green AR. Further evidence that E-cadherin is not a tumour suppressor gene in invasive ductal carcinoma of the breast: an immunohistochemical study. Histopathology 2013; 62:695–701 [DOI] [PubMed] [Google Scholar]
- 2.Ch’ng ES, Tuan Sharif SE, Jaafar H. In human invasive breast ductal carcinoma, tumor stromal macrophages and tumor nest macrophages have distinct relationships with clinicopathological parameters and tumor angiogenesis. Virchows Arch 2013; 462:257–67 [DOI] [PubMed] [Google Scholar]
- 3.Baretta Z, Guindalini RS, Khramtsova G, Olopade OI. Resistance to trastuzumab in HER2-positive mucinous invasive ductal breast carcinoma. Clin Breast Cancer 2013; 13:156–8 [DOI] [PMC free article] [PubMed] [Google Scholar]
- 4.Zheng J, Alsaadi T, Blaichman J, Xie X, Omeroglu A, Meterissian S, Mesurolle B. Invasive ductal carcinoma of the breast: correlation between tumor grade determined by ultrasound-guided core biopsy and surgical pathology. AJR Am J Roentgenol 2013; 200:W71–4 [DOI] [PubMed] [Google Scholar]
- 5.Currie MJ, Beardsley BE, Harris GC, Gunningham SP, Dachs GU, Dijkstra B, Morrin HR, Wells JE, Robinson BA. Immunohistochemical analysis of cancer stem cell markers in invasive breast carcinoma and associated ductal carcinoma in situ: relationships with markers of tumor hypoxia and microvascularity. Hum Pathol 2013; 44:402–11 [DOI] [PubMed] [Google Scholar]
- 6.Kim JH, Baek TH, Yim HS, Kim KH, Jeong SH, Kang HB, Oh SS, Lee HG, Kim JW, Kim KD. Collagen triple helix repeat containing-1 (CTHRC1) expression in invasive ductal carcinoma of the breast: the impact on prognosis and correlation to clinicopathologic features. Pathol Oncol Res 2013; 19:731–7 [DOI] [PubMed] [Google Scholar]
- 7.Knudsen ES, Dervishaj O, Kleer CG, Pajak T, Schwartz GF, Witkiewicz AK. EZH2 and ALDH1 expression in ductal carcinoma in situ: complex association with recurrence and progression to invasive breast cancer. Cell Cycle 2013; 12:2042–50 [DOI] [PMC free article] [PubMed] [Google Scholar]
- 8.Hoefgen HR, Merritt DF. Invasive ductal carcinoma in a 46,XY partial androgen insensitivity syndrome patient on hormone therapy. J Pediatr Adolesc Gynecol 2015; 28:e95–e97 [DOI] [PubMed] [Google Scholar]
- 9.Sui K, Niguma T, Yamada M, Kojima T, Mimura T. [A case of a patient who underwent resection of the remnant pancreatic cancer following a distal pancreatectomy for invasive ductal carcinoma]. Gan to Kagaku Ryoho 2014; 41:2163–5 [PubMed] [Google Scholar]
- 10.Andjelic-Dekic N, Bozovic-Spasojevic I, Milosevic S, Matijasevic M, Karadzic K. A rare case of isolated adrenal metastasis of invasive ductal breast carcinoma. Srp Arh Celok Lek 2014; 142:597–601 [DOI] [PubMed] [Google Scholar]
- 11.Ouldamer L, Lechaux E, Arbion F, Body G, Vilde A. What should be the width of radiological margin to optimize resection of non-palpable invasive or in situ ductal carcinoma? Breast 2014; 23:889–93 [DOI] [PubMed] [Google Scholar]
- 12.Huang KT, Tan D, Chen KE, Walker AM. Blockade of estrogen-stimulated proliferation by a constitutively-active prolactin receptor having lower expression in invasive ductal carcinoma. Cancer Lett 2015; 358:152–60 [DOI] [PubMed] [Google Scholar]
- 13.Ko ES, Han BK, Kim RB, Cho EY, Ahn S, Nam SJ, Ko EY, Shin JH, Hahn SY. Apparent diffusion coefficient in estrogen receptor-positive invasive ductal breast carcinoma: correlations with tumor-stroma ratio. Radiology 2014; 271:30–7 [DOI] [PubMed] [Google Scholar]
- 14.Otomi Y, Otsuka H, Terazawa K, Nose H, Kubo M, Matsuzaki K, Ikushima H, Bando Y, Harada M. Comparing the performance of visual estimation and standard uptake value of F-18 fluorodeoxyglucose positron emission tomography/computed tomography for detecting malignancy in pancreatic tumors other than invasive ductal carcinoma. J Med Invest 2014; 61:171–9 [DOI] [PubMed] [Google Scholar]
- 15.Suciu C, Muresan A, Cornea R, Suciu O, Dema A, Raica M. Semi-automated evaluation of Ki-67 index in invasive ductal carcinoma of the breast. Oncol Lett 2014; 7:107–14 [DOI] [PMC free article] [PubMed] [Google Scholar]
- 16.Tan D, Chen KE, Deng C, Tang P, Huang J, Mansour T, Luben RA, Walker AM. An N-terminal splice variant of human Stat5a that interacts with different transcription factors is the dominant form expressed in invasive ductal carcinoma. Cancer Lett 2014; 346:148–57 [DOI] [PMC free article] [PubMed] [Google Scholar]
- 17.Wahler J, So JY, Kim YC, Liu F, Maehr H, Uskokovic M, Suh N. Inhibition of the transition of ductal carcinoma in situ to invasive ductal carcinoma by a gemini vitamin D analog. Cancer Prev Res 2014; 7:617–26 [DOI] [PMC free article] [PubMed] [Google Scholar]
- 18.Wan Abdul Rahman WF, Fauzi MH, Jaafar H. Expression of DNA methylation marker of paired-like homeodomain transcription factor 2 and growth receptors in invasive ductal carcinoma of the breast. Asian Pac J Cancer Prev 2014; 15:8441–5 [DOI] [PubMed] [Google Scholar]
- 19.Yang J, Zhu J, He K, Zhao LY, Liu LY, Song TS, Huang C. Proteomic profiling of invasive ductal carcinoma (IDC) using magnetic beads-based serum fractionation and MALDI-TOF MS. J Clin Lab Anal 2015; 29:321–7 [DOI] [PMC free article] [PubMed] [Google Scholar]
- 20.Colozza M, de Azambuja E, Personeni N, Lebrun F, Piccart MJ, Cardoso F. Achievements in systemic therapies in the pregenomic era in metastatic breast cancer. Oncologist 2007; 12:253–70 [DOI] [PubMed] [Google Scholar]
- 21.Perou CM, Sorlie T, Eisen MB, van de Rijn M, Jeffrey SS, Rees CA, Pollack JR, Ross DT, Johnsen H, Akslen LA, Fluge O, Pergamenschikov A, Williams C, Zhu SX, Lonning PE, Borresen-Dale AL, Brown PO, Botstein D. Molecular portraits of human breast tumours. Nature 2000; 406:747–52 [DOI] [PubMed] [Google Scholar]
- 22.Sorlie T, Perou CM, Tibshirani R, Aas T, Geisler S, Johnsen H, Hastie T, Eisen MB, van de Rijn M, Jeffrey SS, Thorsen T, Quist H, Matese JC, Brown PO, Botstein D, Lonning PE, Borresen-Dale AL. Gene expression patterns of breast carcinomas distinguish tumor subclasses with clinical implications. Proc Natl Acad Sci U S A 2001; 98:10869–74 [DOI] [PMC free article] [PubMed] [Google Scholar]
- 23.Ahmadzadeh M, Johnson LA, Heemskerk B, Wunderlich JR, Dudley ME, White DE, Rosenberg SA. Tumor antigen-specific CD8 T cells infiltrating the tumor express high levels of PD-1 and are functionally impaired. Blood 2009; 114:1537–44 [DOI] [PMC free article] [PubMed] [Google Scholar]
- 24.Loi S, Michiels S, Salgado R, Sirtaine N, Jose V, Fumagalli D, Kellokumpu-Lehtinen PL, Bono P, Kataja V, Desmedt C, Piccart MJ, Loibl S, Denkert C, Smyth MJ, Joensuu H, Sotiriou C. Tumor infiltrating lymphocytes are prognostic in triple negative breast cancer and predictive for trastuzumab benefit in early breast cancer: results from the FinHER trial. Ann Oncol 2014; 25:1544–50 [DOI] [PubMed] [Google Scholar]
- 25.Denkert C, Loibl S, Noske A, Roller M, Muller BM, Komor M, Budczies J, Darb-Esfahani S, Kronenwett R, Hanusch C, von Torne C, Weichert W, Engels K, Solbach C, Schrader I, Dietel M, von Minckwitz G. Tumor-associated lymphocytes as an independent predictor of response to neoadjuvant chemotherapy in breast cancer. J Clin Oncol 2010; 28:105–13 [DOI] [PubMed] [Google Scholar]
- 26.Ali HR, Provenzano E, Dawson SJ, Blows FM, Liu B, Shah M, Earl HM, Poole CJ, Hiller L, Dunn JA, Bowden SJ, Twelves C, Bartlett JM, Mahmoud SM, Rakha E, Ellis IO, Liu S, Gao D, Nielsen TO, Pharoah PD, Caldas C. Association between CD8+ T-cell infiltration and breast cancer survival in 12,439 patients. Ann Oncol 2014; 25:1536–43 [DOI] [PubMed] [Google Scholar]
- 27.Kao KJ, Chang KM, Hsu HC, Huang AT. Correlation of microarray-based breast cancer molecular subtypes and clinical outcomes: implications for treatment optimization. BMC Cancer 2011; 11:1–15 [DOI] [PMC free article] [PubMed] [Google Scholar]
- 28.Patil P, Bachant-Winner PO, Haibe-Kains B, Leek JT. Test set bias affects reproducibility of gene signatures. Bioinformatics 2015; 31:2318–23 [DOI] [PMC free article] [PubMed] [Google Scholar]
- 29.Desmedt C, Piette F, Loi S, Wang Y, Lallemand F, Haibe-Kains B, Viale G, Delorenzi M, Zhang Y, d’Assignies MS, Bergh J, Lidereau R, Ellis P, Harris AL, Klijn JG, Foekens JA, Cardoso F, Piccart MJ, Buyse M, Sotiriou C, Consortium T. Strong time dependence of the 76-gene prognostic signature for node-negative breast cancer patients in the TRANSBIG multicenter independent validation series. Clin Cancer Res 2007; 13:3207–14 [DOI] [PubMed] [Google Scholar]
- 30.Liberzon A, Birger C, Thorvaldsdottir H, Ghandi M, Mesirov JP, Tamayo P. The molecular signatures database (MSigDB) hallmark gene set collection. Cell Syst 2015; 1:417–25 [DOI] [PMC free article] [PubMed] [Google Scholar]
- 31.Kostareli E, Hielscher T, Zucknick M, Baboci L, Wichmann G, Holzinger D, Mucke O, Pawlita M, Del Mistro A, Boscolo-Rizzo P, Da Mosto MC, Tirelli G, Plinkert P, Dietz A, Plass C, Weichenhan D, Hess J. Gene promoter methylation signature predicts survival of head and neck squamous cell carcinoma patients. Epigenetics 2016; 11:61–73 [DOI] [PMC free article] [PubMed] [Google Scholar]
- 32.Zhang JX, Song W, Chen ZH, Wei JH, Liao YJ, Lei J, Hu M, Chen GZ, Liao B, Lu J, Zhao HW, Chen W, He YL, Wang HY, Xie D, Luo JH. Prognostic and predictive value of a microRNA signature in stage II Colon cancer: a microRNA expression analysis. Lancet Oncol 2013; 14:1295–306 [DOI] [PubMed] [Google Scholar]
- 33.Papaemmanuil E, Gerstung M, Malcovati L, Tauro S, Gundem G, Van Loo P, Yoon CJ, Ellis P, Wedge DC, Pellagatti A, Shlien A, Groves MJ, Forbes SA, Raine K, Hinton J, Mudie LJ, McLaren S, Hardy C, Latimer C, Della Porta MG, O’Meara S, Ambaglio I, Galli A, Butler AP, Walldin G, Teague JW, Quek L, Sternberg A, Gambacorti-Passerini C, Cross NC, Green AR, Boultwood J, Vyas P, Hellstrom-Lindberg E, Bowen D, Cazzola M, Stratton MR, Campbell PJ; Chronic Myeloid Disorders Working Group of the International Cancer Genome C. Clinical and biological implications of driver mutations in myelodysplastic syndromes. Blood 2013; 122:3616–27; quiz 99 [DOI] [PMC free article] [PubMed] [Google Scholar]
- 34.Yuan Y, Van Allen EM, Omberg L, Wagle N, Amin-Mansour A, Sokolov A, Byers LA, Xu Y, Hess KR, Diao L, Han L, Huang X, Lawrence MS, Weinstein JN, Stuart JM, Mills GB, Garraway LA, Margolin AA, Getz G, Liang H. Assessing the clinical utility of cancer genomic and proteomic data across tumor types. Nat Biotechnol 2014; 32:644–52 [DOI] [PMC free article] [PubMed] [Google Scholar]
- 35.Friedman J, Hastie T, Tibshirani R. Regularization paths for generalized linear models via coordinate descent. J Stat Softw 2010; 33:1–22 [PMC free article] [PubMed] [Google Scholar]
- 36.Yu G, Wang LG, Han Y, He QY. clusterProfiler: an R package for comparing biological themes among gene clusters. Omics 2012; 16:284–7 [DOI] [PMC free article] [PubMed] [Google Scholar]
- 37.Hanzelmann S, Castelo R, Guinney J. GSVA: gene set variation analysis for microarray and RNA-seq data. BMC Bioinformatics 2013; 14:7. [DOI] [PMC free article] [PubMed] [Google Scholar]
- 38.Liberzon A, Subramanian A, Pinchback R, Thorvaldsdottir H, Tamayo P, Mesirov JP. Molecular signatures database (MSigDB) 3.0. Bioinformatics 2011; 27:1739–40 [DOI] [PMC free article] [PubMed] [Google Scholar]
- 39.Robin X, Turck N, Hainard A, Tiberti N, Lisacek F, Sanchez J-C, Müller M. pROC: an open-source package for R and S+ to analyze and compare ROC curves. BMC Bioinformatics 2011; 12:77. [DOI] [PMC free article] [PubMed] [Google Scholar]
- 40.Yang Q, Guo B, Sun H, Zhang J, Liu S, Hexige S, Yu X, Wang X. Identification of the key genes implicated in the transformation of OLP to OSCC using RNA-sequencing. Oncol Rep 2017; 37:2355–65 [DOI] [PubMed] [Google Scholar]
- 41.Wang Y, Li J, Xia Y, Gong R, Wang K, Yan Z, Wan X, Liu G, Wu D, Shi L, Lau W, Wu M, Shen F. Prognostic nomogram for intrahepatic cholangiocarcinoma after partial hepatectomy. J Clin Oncol 2012; 31:1188–95 [DOI] [PubMed] [Google Scholar]
- 42.Wang Y, Klijn JG, Zhang Y, Sieuwerts AM, Look MP, Yang F, Talantov D, Timmermans M, Meijer-van Gelder ME, Yu J, Jatkoe T, Berns EM, Atkins D, Foekens JA. Gene-expression profiles to predict distant metastasis of lymph-node-negative primary breast cancer. Lancet 2005; 365:671–9 [DOI] [PubMed] [Google Scholar]
- 43.Pawitan Y, Bjohle J, Amler L, Borg AL, Egyhazi S, Hall P, Han X, Holmberg L, Huang F, Klaar S, Liu ET, Miller L, Nordgren H, Ploner A, Sandelin K, Shaw PM, Smeds J, Skoog L, Wedren S, Bergh J. Gene expression profiling spares early breast cancer patients from adjuvant therapy: derived and validated in two population-based cohorts. Breast Cancer Res 2005; 7:R953–64 [DOI] [PMC free article] [PubMed] [Google Scholar]
- 44.Cao B, Wang Q, Zhang H, Zhu G, Lang J. Two immune-enhanced molecular subtypes differ in inflammation, checkpoint signaling and outcome of advanced head and neck squamous cell carcinoma. Oncoimmunology 2018; 7:1–13 [DOI] [PMC free article] [PubMed] [Google Scholar]
- 45.Chang JC, Wooten EC, Tsimelzon A, Hilsenbeck SG, Gutierrez MC, Elledge R, Mohsin S, Osborne CK, Chamness GC, Allred DC, O’Connell P. Gene expression profiling for the prediction of therapeutic response to docetaxel in patients with breast cancer. Lancet 2003; 362:362–9 [DOI] [PubMed] [Google Scholar]
- 46.Llovet JM, Ricci S, Mazzaferro V, Hilgard P, Gane E, Blanc JF, de Oliveira AC, Santoro A, Raoul JL, Forner A, Schwartz M, Porta C, Zeuzem S, Bolondi L, Greten TF, Galle PR, Seitz JF, Borbath I, Haussinger D, Giannaris T, Shan M, Moscovici M, Voliotis D, Bruix J, Group S. Sorafenib in advanced hepatocellular carcinoma. N Engl J Med 2008; 359:378–90 [DOI] [PubMed] [Google Scholar]
- 47.Cheng AL, Kang YK, Chen Z, Tsao CJ, Qin S, Kim JS, Luo R, Feng J, Ye S, Yang TS, Xu J, Sun Y, Liang H, Liu J, Wang J, Tak WY, Pan H, Burock K, Zou J, Voliotis D, Guan Z. Efficacy and safety of sorafenib in patients in the Asia-Pacific region with advanced hepatocellular carcinoma: a phase III randomised, double-blind, placebo-controlled trial. Lancet Oncol 2009; 10:25–34 [DOI] [PubMed] [Google Scholar]
- 48.Eddy JA, Sung J, Geman D, Price ND. Relative expression analysis for molecular cancer diagnosis and prognosis. Technol Cancer Res Treat 2010; 9:149–59 [DOI] [PMC free article] [PubMed] [Google Scholar]
- 49.Shu P, Wu J, Tong Y, Xu C, Zhang X. Gene pair based prognostic signature for colorectal colon cancer. Medicine 2018; 97:1–7 [DOI] [PMC free article] [PubMed] [Google Scholar]
- 50.Li B, Cui Y, Diehn M, Li R. Development and validation of an individualized immune prognostic signature in early-stage nonsquamous non-small cell lung cancer. JAMA Oncol 2017; 3:1529–37 [DOI] [PMC free article] [PubMed] [Google Scholar]
- 51.Peng PL, Zhou XY, Yi GD, Chen PF, Wang F, Dong WG. Identification of a novel gene pairs signature in the prognosis of gastric cancer. Cancer Med 2018; 7:344–50 [DOI] [PMC free article] [PubMed] [Google Scholar]
- 52.Hida AI, Watanabe T, Sagara Y, Kashiwaba M, Sagara Y, Aogi K, Ohi Y, Tanimoto A. Diffuse distribution of tumor-infiltrating lymphocytes is a marker for better prognosis and chemotherapeutic effect in triple-negative breast cancer. Breast Cancer Res Treat 2019; 178:283–94 [DOI] [PubMed] [Google Scholar]
- 53.Hill BS, Sarnella A, D’Avino G, Zannetti A. Recruitment of stromal cells into tumour microenvironment promote the metastatic spread of breast cancer. Semin Cancer Biol 2019; 60:202–13 [DOI] [PubMed] [Google Scholar]
Associated Data
This section collects any data citations, data availability statements, or supplementary materials included in this article.
Supplementary Materials
Supplemental material, sj-pdf-1-ebm-10.1177_1535370220936964 for Development and verification of a personalized immune prognostic feature in breast cancer by HongLei Wang, Li Wu and HongTao Wang in Experimental Biology and Medicine


