

Abstract
Introduction
Patients with type 1 diabetes has an increased risk of fracture. We wished to evaluate estimated bone strength in children and adolescents with type 1 diabetes and assess peripheral bone geometry, volumetric bone mineral density (vBMD) and microarchitecture.
Research design and methods
In a cross-sectional study, high-resolution peripheral quantitative CT (HR-pQCT) was performed of the radius and tibia in 84 children with type 1 diabetes and 55 healthy sibling controls. Estimated bone strength was assessed using a microfinite element analysis solver. Multivariate regression analyses were performed adjusting for age, sex, height and body mass index.
Results
The median age was 13.0 years in the diabetes group vs 11.5 years in healthy sibling controls. The median (range) diabetes duration was 4.2 (0.4−15.9) years; median (range) latest year Hb1Ac was 7.8 (5.9−11.8) % (61.8 (41−106) mmol/mol). In adjusted analyses, patients with type 1 diabetes had reduced estimated bone strength in both radius, β −390.6 (−621.2 to −159.9) N, p=0.001, and tibia, β −891.9 (−1321 to −462.9) N, p<0.001. In the radius and tibia, children with type 1 diabetes had reduced cortical area, trabecular vBMD, trabecular number and trabecular bone volume fraction and increased trabecular inhomogeneity, adjusted p<0.05 for all. Latest year HbA1c was negatively correlated with bone microarchitecture (radius and tibia), trabecular vBMD and estimated bone strength (tibia).
Conclusion
Children with type 1 diabetes had reduced estimated bone strength. This reduced bone strength could partly be explained by reduced trabecular bone mineral density, adverse microarchitecture and reduced cortical area. We also found increasing latest year HbA1c to be associated with several adverse changes in bone parameters. HR-pQCT holds potential to identify early adverse bone changes and to explain the increased fracture risk in young patients with type 1 diabetes.
Keywords: diabetes mellitus, type 1; diabetes complications; bone and bones; bone density
Significance of this study.
What is already known about this subject?
Patients with type 1 diabetes have an increased risk of fracture early in life and continuous throughout adulthood.
The fracture risk when having type 1 diabetes is much higher than predicted by dual X-ray absorptiometry (DXA).
High-resolution peripheral quantitative CT (HR-pQCT) enable insight into trabecular and cortical compartment-specific bone volumetric density and microarchitecture and also provides estimates of bone strength.
What are the new findings?
This is one of the first HR-pQCT study in children with type 1 diabetes.
Children with type 1 diabetes have reduced estimated bone strength partly explained by compromised trabecular volumetric bone mineral density (vBMD) due to reduced trabecular numbers and reduced cortical bone area.
Mean HbA1c of the latest year was correlated with reduced trabecular number and increased trabecular inhomogeneity.
How might these results change the focus of research or clinical practice?
Bone health needs attention when treating children and adolescents with type 1 diabetes.
Trabecular bone and bone strength are negatively influenced by higher HbA1c levels, which additionally advocate for a good glycemic control in young patients with type 1 diabetes.
DXA scan is likely to be insufficient in detecting bone changes in children with type 1 diabetes.
Future studies should examine whether improvements in glycemic control may lead to improvements in bone strength and hence reduce the risk of late bone complications in patients with type 1 diabetes.
Introduction
Type 1 diabetes affects approximately 500 000 children worldwide and the incidence is rising. Recently, an increased risk of bone fracture has been identified as a complication to type 1 diabetes.1 2 In a large UK cohort, the increased fracture risk was observed already in childhood.3 The mechanisms underlying diabetic bone fragility are not fully understood, but adult patients with type 1 diabetes show signs of impaired bone formation with low levels of osteocalcin and increased bone resorption.1 Bone growth is especially pronounced during puberty, where 25%–50% of the peak bone mass is accumulated. The bone maturing and attainment of peak bone mass are important for the resistance to fractures. Children and adolescents with type 1 diabetes may also have impaired bone metabolism with reduced osteoblast and increased osteoclast signaling,4 5 and associations between poorly controlled diabetes and changes in bone markers have been reported.6 7 However, bone structure has been sparsely studied in children with type 1 diabetes.
Areal bone mineral density (aBMD) measured by dual X-ray absorptiometry (DXA) is currently the non-invasive gold standard in osteoporosis for both the diagnosis and the monitoring of treatment efficacy. In some studies, children with type 1 diabetes have reduced aBMD,7–9 but not in all.10–12 We among others also found an association between poor glycemic control and lower total body aBMD in children with type 1 diabetes.12 13
Bone dimensions influence the results in DXA, as it is a two-dimensional scanning method assessing a three-dimensional structure. It has been proposed that bone size in children with type 1 diabetes is altered, which may impact the aBMD results obtained by DXA.11 14 Furthermore, patients with type 1 diabetes have a much higher fracture risk than predicted by DXA,15 suggesting that BMD, bone size and/or bone quality are altered in type 1 diabetes. This calls for other methods to evaluate bone fragility in patients with type 1 diabetes.16
Peripheral quantity CT (pQCT) is a technique allowing non-invasive in vivo assessment of bone geometry and volumetric bone mineral density (vBMD) by creating a 3D bone image. pQCT therefore holds potential as a useful method to investigate bones in patients with diabetes. pQCT scan can discriminate between the trabecular and cortical components of bone, assessing the cross-sectional geometry. In the few pQCT studies investigating children and adolescents with type 1 diabetes, vBMD in trabecular bone and/or cortical bone was reduced.17–19
High-resolution pQCT (HR-pQCT) further enables the defining of trabecular and cortical microstructure. HR-pQCT has excellent correlation with ex vivo μCT imaging and can be used to construct microfinite element (μFE) models of bone strength.20–22 Previous studies have shown an association between prevalent fractures and deficits in microarchitectural parameters23 24 and μFE parameters,25 independent of aBMD as assessed by DXA. Thus, HR-pQCT can provide a “non-invasive bone biopsy” which allows new insight regarding bones of patients with type 1 diabetes.
Our aim was to to examine whether children with type 1 diabetes have altered bone strength assessed by HR-pQCT scan, hypothesizing that patients with type 1 diabetes would have decreased estimated bone strength. Furthermore, we aimed to identify explaining parameters in bone geometry, density and microarchitecture affected by type 1 diabetes and to elucidate patient factors possibly associated with estimated bone strength as well as peripheral bone geometry, vBMD and microarchitecture including sex, disease duration, age of diabetes onset and mean HbA1c of the latest year.
Material and methods
A cross-sectional study design was used to evaluate the strength, geometry and microarchitecture of the bones in children with type 1 diabetes. Healthy siblings were invited to participate as controls, as no reference material was available.
The study was conducted at Hans Christian Andersen Children’s Hospital and Department of Endocrinology at Odense University Hospital in Denmark. The Strengthening the Reporting of Observational Studies (STROBE) in Epidemiology guideline for reporting cross-sectional studies was followed.
Participants
A cohort of 133 children between 6 and 17 years of age, diagnosed with type 1 diabetes and treated in the diabetic outpatient clinic of our institution were invited by their pediatrician to participate in this study (figure 1). The diagnosis of diabetes was made at the disease debut by doctors at our facility based on elevated blood glucose above 200 mg/dL, elevated Hba1c above 48 mmol/mol and presence of antibodies (GAD-65, IA2, ICA and/or Znt-8). All healthy siblings aged 6–17 years were invited to participate as a control group. Participants were excluded if they had any known bone disease, other chronic diseases, previous or current treatment that might affect bone metabolism (eg, celiac disease, thyroid disorder, systemic glucocorticoids), or if the child was unable to co-operate with the study protocol.
Figure 1.
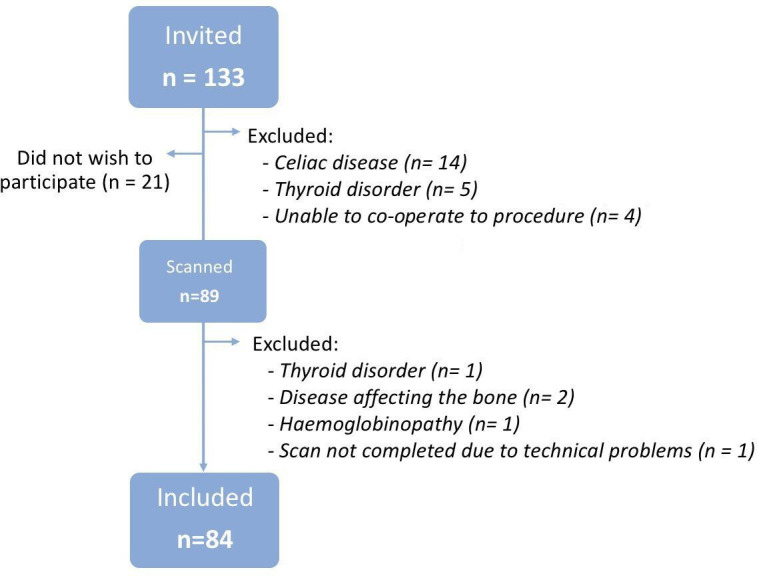
Flowchart of included cases.
Data collection
All data were collected by the same researcher (GF), ensuring all measurements were done the same way. All data were registered and stored in REDCap within Odense Patient Data Explorative Network OPEN.
Medical record review
Medical records of every participant were reviewed to ensure that no medical conditions had been registered which should exclude the participant from the study. The medical record of the patients with type 1 diabetes was also reviewed for diabetes complications, the date of diabetes debut and current treatment.
HbA1c
Glycated hemoglobin (HbA1c) was measured about every third months as part of routine clinical praxis in our diabetes cohort. We used this as an estimate for glycemic control. HbA1c was measured by high-performance liquid chromatography as fraction of total hemoglobin A0 using either Tosoh G7 or G8 (Medinor, Broendby, Denmark) with reagents as recommended by the supplier.
Sample values and measuring dates are recorded in the Department of Clinical Biochemistry at our institution dating back to 2010. HbA1c was calculated as the mean HbA1c within the latest year and the mean HbA1c of the entire disease period, or latest 7 years if the diabetes duration was longer than data were available.
Interview and examination
Participants were interviewed regarding bone fracture history, medication (including specific questions about systemic glucocorticoids, asthma and epilepsy medicine), daily intake of milk and use of supplements with vitamin D, calcium or vitamin pills. These data were self-reported, but were gathered in a standardized manner using an interview tool developed by our research group. Height without shoes was measured with SECA213(Germany) in cm and weight without clothes measured by SECA 861(Germany) with an accuracy of 0.1 kg. Weight and height were converted to Z-scores using the Danish growth reference.26 Biological sex and ethnicity were registered. For participants with type 1 diabetes, puberty development was assessed a.m. Tanner by clinical examination. Tanner stage was stratified into pre-puberty (stage 1), early puberty (stage 2–3) and late puberty (stage 4–5).
HR-pQCT
We used HR-pQCT (Xtreme CT; Scanco Medical, AG, Brüttisellen, Switzerland) to assess estimated bone strength, bone geometry, vBMD and microarchitecture, by scanning the non-dominant radius and left tibia (the opposite limb if a history of previous fracture). Non-dominant side was determined by participants report of left or right handedness. The limb being scanned was immobilized in a carbon fiber shell to minimize artifacts caused by movements.
A single anteroposterior projection of the scan site, the scout view, was obtained to enable placement of a reference line at the distal radial and tibial joint surfaces. The first CT slice was initiated at 7% of the radial length and 8% of the tibial length from the end plate of the bone. This ensured the scans to be performed as close to the identical anatomic position as possible, despite differences in length of the bone and also avoiding the growth plate. Radial length was determined by measuring the forearm from the tip of the elbow to the radial styloid process with the elbow flexed at 90°. Tibial length was measured from the medial condyle to the medial malleolus with the knee at 90°. Measures were made with anmeasuring tape and rounded to up to nearest 1 cm. Each scan measurement included 110 parallel slices in the axial direction corresponding to 3D representation of 9.02 mm thick cross-sections. The scanning methodology has been further described by Shanbhogue et al.27
The scans were performed by trained staff and the researcher conducting the interview and physical examinations was also present during the procedure. The operator immediately reviewed the most distal slice for motion artifacts. A maximum of three scans per anatomic site was allowed in case of visible motion artifacts. Image quality was graded after image reconstruction by one of the authors (VVS) using a five-step scale as suggested by the manufacturer (1=best, 5=worst) and images graded 4 or 5 were disregarded.28 Thus, if a scan of grade 3 or better could not be produced within three attempts, the scan was excluded from the analysis.
Outcomes
Our predetermined primary outcome was bone strength described as estimated failure load. A μFE analysis solver provided by the manufacturer (Finite Element analysis Software V.1.15, Scanco Medical, Switzerland) was used to estimate the mechanical properties of the radius and tibia and an estimate of failure load (N) were calculated as described previously.29 The secondary outcome variables used in our analysis included total, cortical and trabecular areas (mm2), vBMD (mg hydroxyapatite/cm3) for the entire bone section (total vBMD), trabecular (Tb vBMD) and cortical regions (Ct vBMD), trabecular bone volume to tissue volume fraction (Tb BV/TV), trabecular number (Tb.N, mm−1), thickness (Tb.Th, mm), separation (Tb.Sp, mm), trabecular network inhomogeneity (SD of 1/Tb.N, mm), cortical thickness (Ct.Th, mm) and cortical porosity (Ct.Po, %).
To ensure repeatability, all scan evaluations were performed by the same researcher (GF), who was blinded to participant grouping during the analysis.
Statistical analyses
Statistical differences between patients and controls were analyzed non-paired using χ² test, Fischer’s exact test, Students t-test or Rank-sum test where appropriate. Assumption of normal distribution was determined by the Shapiro-Wilk test.
The controls and patient cohort were compared using clinically driven regression models, adjusting for participant factors that could affect the bone including age, sex, height and body mass index (BMI). All models were controlled with normal quantile plots and residual-versus-fitted plots. A separate analysis looking for an independent association between diabetes and sex affecting the bones was performed. If an independent association between sex and diabetes had been found, the results should be stratified by sex.
Within the type 1 diabetes group, HR-pQCT data was adjusted for sex, age, height and BMI in a linear regression model and analyzed for associations to disease parameters including latest year mean HbA1c, age at diabetes onset and disease duration. All statistical analyses were performed using STATA V.15.0.
Assuming 130 participants and primary outcome 1 SD=1.1 kN30, our study was powered to detect a true difference in radius failure load between patients and controls of 0.546 kN (alpha 0.05, beta 1–0.80).
Results
Participants
The study included 84 children and adolescents with type 1 diabetes and 55 healthy siblings as controls (figure 1). All eligible siblings were invited to participate and none meet the exclusion criteria. Participants were mainly Caucasian and a few of Middle Eastern origin, with no difference in distribution between patients with type 1 diabetes and healthy controls (table 1). All included children were healthy apart from diabetes. Children with type 1 diabetes had a median disease duration of 4.9 years and median latest year HbA1c of 61.8 (range 41–106) mmol/mol (9.8 (6.8–16.2)%) (table 2).
Table 1.
Demographic and clinical characteristics
| Type 1 diabetes (n=84) | Controls (n=55) | P value | |
| Male, n (%) | 45 (54%) | 33 (60%) | 0.49 |
| Age, years | |||
| Median (range) | 13.0 (6.5 to 17.9) | 11.5 (6.1 to 17.5) | 0.01 |
| Ethnicity, n (%) | 0.32 | ||
| Caucasian | 80 (95%) | 51 (91%) | |
| Middle East | 4 (5%) | 5 (9%) | |
| Height, Z-score | |||
| Median (range) | |||
| All | 0.44 (−2.22 to 3.45) | 0.25 (−1.75 to 2.23) | 0.87 |
| Boys | 0.46 (−1.35 to 3.45) | 0.11 (−1.39 to 1.94) | 0.09 |
| Girls | −0.06 (−2.22 to 2.15) | 0.55 (−1.75 to 2.23) | 0.15 |
| Weight, Z-score | |||
| Median (range) | |||
| All | 0.61 (−1.28 to 3.11) | 0.59 (−2.76 to 2.77) | 0.06 |
| Boys | 0.67 (−1.28 to 3.11) | 0.53 (−2.76 to 2.77) | 0.13 |
| Girls | 0.44 (−0.91 to 2.88) | 0.62 (−1.23 to 2.04) | 0.67 |
| BMI, Z-score | |||
| Median (range) | |||
| All | 0.63 (−1.73 to 3.12) | 0.34 (−3.31 to 2.53) | 0.07 |
| Boys | 0.67 (−1.73 to 3.12) | 0.34 (−3.31 to 2.53) | 0.11 |
| Girls | 0.55 (−0.94 to 2.63) | 0.41 (−1.70 to 2.35) | 0.13 |
| Fracture prevalence, n | 18 | 16 | 0.21 |
| Calcium supplements, n (%) | 3 (3%) | 2 (4%) | 1.0 |
| Vitamin D supplements, n (%) | 6 (5%) | 2 (4%) | 0.4 |
| Multivitamin supplements, n (%) | 16 (12%) | 3 (8%) | 0.02 |
| Boys | 7 (15%) | 2 (6%) | 0.21 |
| Girls | 9 (23%) | 1 (5%) | 0.06 |
| Dietary milk (yes) | 80 (94%) | 56 (100%) | 0.16 |
| >2 glasses/day | 33 (41%) | 19 (33%) | 0.32 |
| Use of asthma medication | 6 (7%) | 4 (7%) | 0.61 |
Statistical significance (p<0.05) is highlighted in bold.
BMI, body mass index.
Table 2.
Characteristics of participants with type 1 diabetes
| All | Boys | Girls | P value | |
| Diabetes duration, years | ||||
| Median (range) | 4.2 (0.4 to 15.9) | 4.1 (0.4 to 15.9) | 4.3 (0.4 to 14.1) | 0.7 |
| Diabetes debut age, years | ||||
| Mean (SD) | 7.9 (3.5) | 7.8 (3.7) | 8.1 (3.3) | 0.7 |
| HbA1c, median of disease duration | 0.3 | |||
| Median (range), mmol/mol | 62.0 (47.3 to 88.6) | 60.9 (47.3 to 88.6) | 62.6 (48.6 to 86.9) | |
| Median (range) % | 7.8 (6.5 to 10.3) | 7.7 (6.5 to 10.3) | 7.8 (6.6 to 10.1) | |
| HbA1c median of latest year | 0.9 | |||
| Median (range), mmol/mol | 61.8 (41 to 106) | 61.9 (41 to 100.8) | 61.0 (48.6 to 106) | |
| Median (range) % | 7.8 (5.9 to 11.8) | 7.8 (5.9 to 11.4) | 7.7 (6.6 to 11.8) | |
| Tanner stage, n (%) | 0.3 | |||
| Prepuberty (stage 1) | 19 (22%) | 13 (28%) | 6 (15%) | |
| Early puberty (stages 2 and 3) | 23 (27%) | 12 (26%) | 11 (28%) | |
| Late puberty (stages 4 and 5) | 43 (51%) | 21 (45%) | 22 (56%) | |
| Puberty, n (%) | 0.2 | |||
| Prepuberty | 19 (22%) | 13 (28%) | 6 (15%) | |
| Puberty | 66 (78%) | 33 (72%) | 33 (85%) |
HbA1c, glycated hemoglobin.
Diabetes complications were registered in only two participants who had minimal microalbuminuria. One participant was in treatment with an angiotensin-converting enzyme inhibitor due to familial essential hypertension, and another received statin due to familial hypercholesterolemia.
The children with diabetes were on average 1 year older than the healthy controls. No differences in sex-distribution, Z-scores of height, weight and BMI, or intake of calcium or D-vitamin supplements, were found between the groups; however, multivitamin supplements were more common in the diabetes group. No difference in fracture prevalence was observed between the groups.
HR-pQCT
Five radius scans (four children with diabetes, one control) were excluded due to motion artifacts and one tibia scan was not completed due to technical problems with the scanner.
Primary outcome
In children with type 1 diabetes, estimated bone strength (failure load) was reduced in both radius and tibia when compared with the healthy sibling controls. Results of the adjusted model of radius was β −390.6 (−621.2 to −159.9) N, p=0.001, and tibia, β −891.9 (−1321 to −462.9) N, p<0.001 (table 3). R2 values in the model were R2=0.76 and R2=0.83 in radius and tibia, respectively.
Table 3.
Multiple regression analyses* of HR-pQCT results, type 1 diabetes patients compared with healthy sibling controls
| Radius | Tibia | |||
| Coef. (95% CI) | P value | Coef. (95% CI) | P value | |
| Bone strength | ||||
| Failure load, N | −390.6 (−621.2 to −159.9) | 0.001 | −891.9 (−1321 to −462.9) | <0.001 |
| Geometry | ||||
| Total bone area, mm2 | −12.4 (−24.2 to −0.6) | 0.04 | −23.3 (−57.3 to 10.7) | 0.18 |
| Cortical area, mm2 | −4.3 (−8.3 to −0.2) | 0.04 | −6.8 (−12.6 to −1.0) | 0.02 |
| Tb area, mm2 | −8.1 (−20.5 to 4.3) | 0.20 | −16.4 (−51.3 to 18.5) | 0.35 |
| Volumetric density | ||||
| Total vBMD, mg/cm3 | −14.0 (−38.2 to 10.2) | 0.26 | −17.7 (−33.9 to −1.6) | 0.03 |
| Cortical vBMD, mg/cm3 | −5.6 (−27.5 to 16.3) | 0.61 | −8.1 (−26.6 to 10.3) | 0.39 |
| Tb vBMD, mg/cm3 | −18.8 (−30.9 to −6.8) | 0.002 | −16.7 (−26.3 to −7.1) | 0.001 |
| Microarchitecture | ||||
| Tb bone volume fraction | −0.016 (−0.026 to −0.006) | 0.002 | −0.014 (−0.022 to −0.006) | 0.001 |
| Tb thickness, mm | −0.001 (−0.005 to 0.003) | 0.59 | −0.004 (−0.009 to 0.001) | 0.09 |
| Tb numbers, 1/mm | −0.17 (−0.26 to −0.07) | <0.001 | −0.09 (−0.17 to −0.00) | 0.04 |
| Tb inhomogeneity | 0.032 (0.012 to 0.051) | 0.002 | 0.018 (0.002 to 0.035) | 0.03 |
| Cortical thickness, mm | −0.051 (−0.141 to 0.039) | 0.27 | −0.056 (−0.138 to 0.027) | 0.19 |
| Cortical porosity, % | 0.005 (−0.001 to 0.011) | 0.10 | 0.004 (−0.003 to 0.012) | 0.24 |
Statistical significance (p<0.05) is highlighted in bold.
Unadjusted data is available as an online supplemental file.
*Adjusted for age, sex, height and body mass index.
HR-pQCT, high-resolution peripheral quantitative CT; Tb, trabecular bone; vBMD, volumetric bone mineral density.
bmjdrc-2020-001384supp001.pdf (30.5KB, pdf)
Secondary outcomes
The cortical area in radius and tibia was reduced in patients with type 1 diabetes. The trabecular vBMD was also reduced in both sites. When looking at the microarchitecture, the trabecular number was reduced and the trabecular network inhomogeneity was increased in both radius and tibia in patients with type 1 diabetes.
Increasing average HbA1c in the latest year was associated with reduced trabecular number and increased inhomogeneity in both radius and tibia (table 4). Same trend was seen with HbA1c across entire disease period, but only inhomogeneity in radius was found to be statistically significant (p=0.02), while inhomogeneity in tibia and trabecular number in both sites was close to being statistically significant (p<0.08). Moreover, tibia failure load, trabecular vBMD and trabecular bone volume to tissue volume fraction were reduced with increasing latest year HbA1c.
Table 4.
Latest year HbA1c adjusted* associations with HR-pQCT results
| Radius | Tibia | |||
| Coef. (95% CI) | P value | Coef. (95% CI) | P value | |
| Bone strength | ||||
| Failure load, N | −3.7 (−15.6 to 8.2) | 0.54 | −26.7 (−52.7 to −0.7) | 0.04 |
| Geometry | ||||
| Total bone area, mm2 | −0.45 (−1.21 to 0.32) | 0.2 | −0.8 (−2.9 to 1.3) | 0.44 |
| Cortical area, mm2 | 0.02 (−0.20 to 0.24) | 0.87 | −0.22 (−0.56 to 0.13) | 0.21 |
| Tb area, mm2 | −0.46 (−1.25 to 0.31) | 0.25 | −0.58 (−2.68 to 1.52) | 0.58 |
| Volumetric density | ||||
| Total vBMD, mg/cm3 | 0.12 (−1.27 to 1.51) | 0.86 | −0.77 (−1.69 to 0.15) | 0.10 |
| Cortical vBMD, mg/cm3 | 0.61 (−0.81 to 1.03) | 0.86 | 0.016 (−1.13 to 1.17) | 0.98 |
| Tb vBMD, mg/cm3 | −0.59 (−1.33 to 0.15) | 0.11 | −0.65 (−1.21 to −0.08) | 0.03 |
| Microarchitecture | ||||
| Tb bone volume fraction | −0.0005 (−0.001 to 0.000) | 0.11 | −0.0005 (−0.010 to −0.0001) | 0.03 |
| Tb thickness, mm | −0.0000 (−0.0003 to 0.0002) | 0.79 | −0.0000 (−0.0003 to 0.0024) | 0.96 |
| Tb numbers, 1/mm | −0.007 (−0.013 to −0.001) | 0.02 | −0.006 (−0.011 to −0.001) | 0.02 |
| Tb inhomogeneity | 0.002 (0.001 to 0.003) | 0.005 | 0.001 (0.000 to 0.002) | 0.04 |
| Cortical thickness, mm | 0.001 (−0.004 to 0.006) | 0.59 | −0.019 (−0.007 to 0.003) | 0.43 |
| Cortical porosity, % | −0.0001 (−0.0004 to 0.0003) | 0.56 | −0.0001 (−0.0006 to 0.0003) | 0.55 |
Statistical significance (p<0.05) is highlighted in bold.
*Adjusted for age, sex, height and body mass index.
HbA1c, glycated hemoglobin; HR-pQCT, high-resolution peripheral quantitative CT; Tb, trabecular bone; vBMD, volumetric bone mineral density.
We found no association between bone parameters and disease duration or age at diabetes onset. Last, no interaction between diabetes and sex in relation to bone parameters was found.
Discussion
Findings
In children with type 1 diabetes, we identified reduced estimated bone strength measured as failure load in both tibia and radius. This reduced bone strength might be explained by a reduced trabecular bone mineral density, adverse microarchitecture and reduced cortical area. Moreover, increasing latest year HbA1c was associated with reduced trabecular number and increased inhomogeneity and in tibia also with reduced bone strength, trabecular vBMD and trabecular bone volume to tissue volume fraction.
In support of our findings, a recently published study by Mitchell et al examining young girls with type 1 diabetes using HR-pQCT likewise reported reduced estimated failure load and reduced trabecular vBMD, along with associations between increased HbA1c and decreased trabecular vBMD and altered microarchitecture.31 Earlier studies using pQCT have also reported trabecular bone deficits in young patients with type 1 diabetes.17 32 33 Our findings are in keeping with others studies in young patients with type 1 diabetes, where aBMD, vBMD or trabecular vBMD were negatively correlated to HbA1c and/or poor glycemic control.17 18 32
HR-pQCT supplied multiple data on early deficits in bone quality in children with type 1 diabetes. The trabecular number was reduced and the inhomogeneity was increased in both radius and tibia when having diabetes, consistent with deficiency in bone modeling. Interestingly, these two bone parameters were increasingly affected with increasing latest year HbA1c. HbA1c for the entire disease period showed similar trend, but the findings were only statistically significant for inhomogeneity in radius. Mean HbA1c for the entire disease period could be confounded by factors present within this period of possibly many years and is influenced by high HbA1c measurements at the time of diagnosis followed by a patient/parent learning curve. We believe that latest year HbA1c is the most interesting and relevant to report. Latest year HbA1c is reflecting recent glycemic control and likely superior to the most recently measured HbA1c value as one measurement may not reflect the more overall glycemic control of the child. We recognize that other observation periods than the latest year may be relevant to future research. Microarchitecture being affected by glycemic control of the latest year, but not necessarily the entire disease period is supporting a dynamic nature of bone modeling in children and adolescents and a potential for reversibility with improving HbA1c which have also been suggested earlier.34
In our study, we did not find any association between age of diabetes onset and bone parameters. All our cases were diagnosed with childhood onset type 1 diabetes. A study by Shah et al suggested that childhood onset type 1 diabetes has more deleterious effect on the bones than adult onset type 1 diabetes, but it is still unclear if this difference is the effect of diabetes during bone accrual or may be due to longer duration of diabetes.35
We have previously examined the same cohort described in this study using DXA evaluation but were not able to demonstrate decreased aBMD in the children with type 1 diabetes.12 Within this HR-pQCT study, the particularly trabecular bone changes were further supported by our finding of reduced trabecular bone vBMD, without significant reductions in cortical bone vBMD. The differential reduction in vBMD may contribute to the explanation of why the aBMD by DXA was normal in our cohort (and in other studies), as most of the mineral is found in the bone cortex. Whereas cortical bone vBMD was unchanged, the cortical bone area was reduced in our participants. The reduced bone area has been described in other studies,11 14 even though children with type 1 diabetes reach a normal final height.36 This reduced bone size could also be a confounder to aBMD by DXA. We believe our current findings demonstrate the superiority of HR-pQCT compared with DXA scan in identifying bone complications in type 1 diabetes at an early stage.
Strenghts and limitations
The principal strength of our study was the use of HR-pQCT to assess bone strength in children and adolescents with type 1 diabetes. HR-pQCT accurately assesses bone microarchitecture and also provides a novel way to non-invasively assess bone strength.37 To our knowledge, this method is the most accurate method to assess bone strength in vivo, but for technical reasons, only the distal peripheral skeleton can be assessed by this method. This scan technique provides a lot of parameters with the calculated failure load being the most interesting with the potential to predict fracture risk and therefore the focus of our attention. Our secondary outcomes were chosen to provide a possible explanation for differences in failure load, describing specific bone geometric parameters and microarchitecture parameters which we had predetermined before conducting the study. When having a lot of outcomes, there can be a risk of chance findings. We have limited our conclusions by only incorporating significant findings made in both tibia and radius. As these two measurements are independent of each other, the risk of having a chance finding in the same parameter at both sites would be small.
Another strength was our focus on patients with type 1 diabetes without comorbidities and the use of healthy siblings as our control group. Genetics account for a majority of the variations in bone structure and healthy siblings are in general more comparable in terms of genetics, lifestyle and socioeconomic status. Therefore, we chose siblings as the control group despite the possible limitations including missing populations-based differences.
Last, our cohort had no overt selection bias from non-participating Danish children with type 1 diabetes without comorbidity. 64% of the invited patients participated in the study. The main reasons for non-participation were comorbidities (17%) and lack of consent (16%) (figure 1). The latter was predominantly justified by lack of time on behalf of the participant or their parents, as the examinations were performed in daytime school and working hours.
Our study also had limitations. The CIs for many of our reported variables are wide. This is in part explained by the limitations in the size of our cohort; however, many of the reported bone variables also seem to be very varying across the cohort even after adjustment for known confounder such as age and sex. We recognize that this makes the study prone to type 2 error, and more associations may be discovered in a larger study. Despite of these limitations, many outcomes of interest, including failure load, have 95% CIs that does not include 0 and hence are statically significant. Also, some changes in microarchitecture might be harder to detect in the radius do to the greater amount of motion artifacts in this region.
Another limitation was the mean age difference of 1 year between the patients with diabetes and their sibling controls. We therefore adjusted for age, among other group differences, in our linear regression analyses, assuming linearity with age. Overall, the choice of sibling controls both had strengths and limitations. We were not able to report on pubertal stage at debut of diabetes. However, the mean age at debut was 7.9 years, allowing the assumption that the majority of the participants were prepubertal at diabetes debut. Even though we adjusted for sex and our analyses showed no interaction between diabetes and sex in relation to bone parameters, larger studies with stratification of sex would be preferred.
Our findings may not be valid in other cohorts with higher or lower HbA1c means as result of differences in blood glucose control. The population of our uptake region was by far of Danish ethnic origin and therefore the study may loss validity in other populations.
Moreover, daily insulin dose may be an important parameter to include in analyses, as bone size is positively influenced by insulin. This was not included in our study. Children with type 1 diabetes have obtained a normal final height after improvement of diabetes regulation by modern insulin therapy.36 In our cohort, the vast majority of children were treated with continuous subcutaneous insulin infusion (CSII) and therefore did not allow for analyses between treatment with multiple daily injections and CSII.
No difference in self-reported fracture prevalence was detected between patients and controls. However, this study was not designed to detect a difference in fracture between the groups due to low participant numbers and short observation time. Follow-up studies and large-scale studies are needed to address this question.
Future research
The mechanism behind the fragility of bones in type 1 diabetes is still not fully understood. Hyperglycemia may lead to increased production of advanced glycation end products, which may lead to osteoblastic apoptosis, decreased osteoblast proliferation and increased osteoclast activation.16 38 Reduced osteoblast and increased osteoclast signaling has been described in children and adolescents with type 1 diabetes,4 5 but further studies with bone turnover markers are needed to elucidate the underlying mechanisms causing altered bone structure in patients with type 1 diabetes.
The increased fracture risk in type 1 diabetes is highly relevant due to the morbidity and mortality associated with fractures. Fragility fractures resulting from low bone strength may be a significant cause of major skeleton complications, which reduces quality of life in patients with type 1 diabetes.39
Estimation of bone strength by aBMD from DXA scan is probably insufficient for patients with type 1 diabetes, as poor bone quality is a more likely cause for the elevated fracture risk.16 Our study highlights the limitations of DXA compared with HR-pQCT in children and adolescents. Although currently a research tool, HR-pQCT holds potential for use in the clinical diagnosis and management in osteoporosis and in type 1 diabetes. Prospective studies are needed to evaluate HR-pQCT as a tool to identify the fracture risk in individuals with type 1 diabetes.
Conclusion
Bone strength assessed as calculated failure load by HR-pQCT was found to be reduced in children with type 1 diabetes when compared with healthy sibling controls. The reduced bone strength could partly be explained by reduced trabecular vBMD, reduced trabecular number and reduced cortical area. Increasing latest year HbA1c was associated with several adverse changes in bone parameters.
More studies are needed to evaluate HR-pQCT as a tool for identifying the fracture risk in patients with type 1 diabetes. Future studies should examine whether improvements in diabetes control may lead to improvements in bone strength and hence reduce the risk of late bone complications in type 1 diabetes.
Acknowledgments
We thank the helpful staff at HCA Research, the Osteoporosis Clinic and OPEN (Odense Patient data Explorative Network).
Footnotes
AJS and HTC contributed equally.
Contributors: GF contributed to the study protocol, recruited the patients and control siblings, collected the hospital file data, performed the HR-pQCT scans and statistical analyses and wrote the manuscript. NM contributed to data management, statistical analysis and revised the manuscript. VVS and APH contributed to the study protocol, performed and supervised the HR-pQCT scans and approved the manuscript. AJS and HTC initiated and supervised the study and revised the manuscript. AJS and HTC are joint last authors.
Funding: This study was supported financially by The Consultant’s Research Fund at Odense University Hospital (ID: A1869).
Competing interests: None declared.
Patient consent for publication: Not required.
Ethics approval: Oral and written consents from parents of children younger than 15 years and adolescents older than 15 were acquired before the physical examination and scans were performed. HR-pQCT is associated with a maximum radiation dose of 0.015 mSv. The risk of this radiation dose is considered insignificant according the guidelines from the International Commission on Radiation Protection (ICRP). The study was approved by the Regional Ethical Committee of Southern Denmark (Project-ID: S-20160159) and the Data Protection Agency (Journal nr:18/44863).
Provenance and peer review: Not commissioned; externally peer reviewed.
Data availability statement: Data are available on reasonable request. The data generated and analyzed during the current study are available in Odense Patient Data Explorative Network (OPEN), project number 495, https://open.rsyd.dk/OpenProjects/openProject.jsp?openNo=495&lang=da.
References
- 1.Hough FS, Pierroz DD, Cooper C, et al. Mechanisms in endocrinology: mechanisms and evaluation of bone fragility in type 1 diabetes mellitus. Eur J Endocrinol 2016;174:R127–38. 10.1530/EJE-15-0820 [DOI] [PubMed] [Google Scholar]
- 2.Shah VN, Shah CS, Snell-Bergeon JK. Type 1 diabetes and risk of fracture: meta-analysis and review of the literature. Diabet Med 2015;32:1134–42. 10.1111/dme.12734 [DOI] [PMC free article] [PubMed] [Google Scholar]
- 3.Weber DR, Haynes K, Leonard MB, et al. Type 1 diabetes is associated with an increased risk of fracture across the life span: a population-based cohort study using the health improvement network (thin). Diabetes Care 2015;38:1913–20. 10.2337/dc15-0783 [DOI] [PMC free article] [PubMed] [Google Scholar]
- 4.Tsentidis C, Gourgiotis D, Kossiva L, et al. Higher levels of s-RANKL and osteoprotegerin in children and adolescents with type 1 diabetes mellitus may indicate increased osteoclast signaling and predisposition to lower bone mass: a multivariate cross-sectional analysis. Osteoporos Int 2016;27:1631–43. 10.1007/s00198-015-3422-5 [DOI] [PubMed] [Google Scholar]
- 5.Khan TS, Fraser L-A. Type 1 diabetes and osteoporosis: from molecular pathways to bone phenotype. J Osteoporos 2015;2015:1–8. 10.1155/2015/174186 [DOI] [PMC free article] [PubMed] [Google Scholar]
- 6.Heilman K, Zilmer M, Zilmer K, et al. Lower bone mineral density in children with type 1 diabetes is associated with poor glycemic control and higher serum ICAM-1 and urinary isoprostane levels. J Bone Miner Metab 2009;27:598–604. 10.1007/s00774-009-0076-4 [DOI] [PubMed] [Google Scholar]
- 7.Loureiro MB, Ururahy MAG, Freire-Neto FP, et al. Low bone mineral density is associated to poor glycemic control and increased OPG expression in children and adolescents with type 1 diabetes. Diabetes Res Clin Pract 2014;103:452–7. 10.1016/j.diabres.2013.12.018 [DOI] [PubMed] [Google Scholar]
- 8.Abd El Dayem SM, El-Shehaby AM, Abd El Gafar A, et al. Bone density, body composition, and markers of bone remodeling in type 1 diabetic patients. Scand J Clin Lab Invest 2011;71:387–93. 10.3109/00365513.2011.573574 [DOI] [PubMed] [Google Scholar]
- 9.de Souza KSC, Ururahy MAG, da Costa Oliveira YM, et al. Low bone mineral density in patients with type 1 diabetes: association with reduced expression of IGF1, IGF1R and TGF B 1 in peripheral blood mononuclear cells. Diabetes Metab Res Rev 2016;32:589–95. 10.1002/dmrr.2772 [DOI] [PubMed] [Google Scholar]
- 10.Mosso C, Hodgson MI, Ortiz T, et al. Bone mineral density in young Chilean patients with type 1 diabetes mellitus. J Pediatr Endocrinol Metab 2016;29:731–6. 10.1515/jpem-2015-0097 [DOI] [PubMed] [Google Scholar]
- 11.Parthasarathy LS, Khadilkar VV, Chiplonkar SA, et al. Bone status of Indian children and adolescents with type 1 diabetes mellitus. Bone 2016;82:16–20. 10.1016/j.bone.2015.04.050 [DOI] [PubMed] [Google Scholar]
- 12.Fuusager GB, Christesen HT, Milandt N, et al. Glycemic control and bone mineral density in children and adolescents with type 1 diabetes. Pediatr Diabetes 2019;20:629–36. 10.1111/pedi.12861 [DOI] [PubMed] [Google Scholar]
- 13.Wierzbicka E, Swiercz A, Pludowski P, et al. Skeletal status, body composition, and glycaemic control in adolescents with type 1 diabetes mellitus. J Diabetes Res 2018;2018:1–14. 10.1155/2018/8121634 [DOI] [PMC free article] [PubMed] [Google Scholar]
- 14.Roggen I, Gies I, Vanbesien J, et al. Trabecular bone mineral density and bone geometry of the distal radius at completion of pubertal growth in childhood type 1 diabetes. Horm Res Paediatr 2013;79:68–74. 10.1159/000346686 [DOI] [PubMed] [Google Scholar]
- 15.Vestergaard P. Discrepancies in bone mineral density and fracture risk in patients with type 1 and type 2 diabetes--a meta-analysis. Osteoporos Int 2007;18:427–44. 10.1007/s00198-006-0253-4 [DOI] [PubMed] [Google Scholar]
- 16.Yamamoto M. Insights into bone fragility in diabetes: the crucial role of bone quality on skeletal strength. Endocr J 2015;62:299–308. 10.1507/endocrj.EJ15-0129 [DOI] [PubMed] [Google Scholar]
- 17.Lettgen B, Hauffa B, Möhlmann C, et al. Bone mineral density in children and adolescents with juvenile diabetes: selective measurement of bone mineral density of trabecular and cortical bone using peripheral quantitative computed tomography. Horm Res 1995;43:173–5. 10.1159/000184273 [DOI] [PubMed] [Google Scholar]
- 18.Moyer-Mileur LJ, Dixon SB, Quick JL, et al. Bone mineral acquisition in adolescents with type 1 diabetes. J Pediatr 2004;145:662–9. 10.1016/j.jpeds.2004.06.070 [DOI] [PubMed] [Google Scholar]
- 19.Saha MT, Sievänen H, Salo MK, et al. Bone mass and structure in adolescents with type 1 diabetes compared to healthy peers. Osteoporos Int 2009;20:1401–6. 10.1007/s00198-008-0810-0 [DOI] [PubMed] [Google Scholar]
- 20.Laib A, Rüegsegger P. Calibration of trabecular bone structure measurements of in vivo three-dimensional peripheral quantitative computed tomography with 28-microm-resolution microcomputed tomography. Bone 1999;24:35–9. 10.1016/S8756-3282(98)00159-8 [DOI] [PubMed] [Google Scholar]
- 21.MacNeil JA, Boyd SK. Accuracy of high-resolution peripheral quantitative computed tomography for measurement of bone quality. Med Eng Phys 2007;29:1096–105. 10.1016/j.medengphy.2006.11.002 [DOI] [PubMed] [Google Scholar]
- 22.Pistoia W, van Rietbergen B, Lochmüller E-M, et al. Estimation of distal radius failure load with micro-finite element analysis models based on three-dimensional peripheral quantitative computed tomography images. Bone 2002;30:842–8. 10.1016/S8756-3282(02)00736-6 [DOI] [PubMed] [Google Scholar]
- 23.Sornay-Rendu E, Cabrera-Bravo J-L, Boutroy S, et al. Severity of vertebral fractures is associated with alterations of cortical architecture in postmenopausal women. J Bone Miner Res 2009;24:737–43. 10.1359/jbmr.081223 [DOI] [PubMed] [Google Scholar]
- 24.Vico L, Zouch M, Amirouche A, et al. High-resolution pQCT analysis at the distal radius and tibia discriminates patients with recent wrist and femoral neck fractures. J Bone Miner Res 2008;23:1741–50. 10.1359/jbmr.080704 [DOI] [PubMed] [Google Scholar]
- 25.Vilayphiou N, Boutroy S, Sornay-Rendu E, et al. Finite element analysis performed on radius and tibia HR-pQCT images and fragility fractures at all sites in postmenopausal women. Bone 2010;46:1030–7. 10.1016/j.bone.2009.12.015 [DOI] [PubMed] [Google Scholar]
- 26.Tinggaard J, Aksglaede L, Sørensen K, et al. The 2014 Danish references from birth to 20 years for height, weight and body mass index. Acta Paediatr 2014;103:214–24. 10.1111/apa.12468 [DOI] [PubMed] [Google Scholar]
- 27.Shanbhogue VV. HR-pQCT - a window into bone health in diabetes beyond bone BMD. University of Southern Denmark, 2017. [Google Scholar]
- 28.Sode M, Burghardt AJ, Pialat J-B, et al. Quantitative characterization of subject motion in HR-pQCT images of the distal radius and tibia. Bone 2011;48:1291–7. 10.1016/j.bone.2011.03.755 [DOI] [PMC free article] [PubMed] [Google Scholar]
- 29.Macneil JA, Boyd SK. Bone strength at the distal radius can be estimated from high-resolution peripheral quantitative computed tomography and the finite element method. Bone 2008;42:1203–13. 10.1016/j.bone.2008.01.017 [DOI] [PubMed] [Google Scholar]
- 30.Shanbhogue VV, Hansen S, Jørgensen NR, et al. Bone geometry, volumetric density, microarchitecture, and estimated bone strength assessed by HR-pQCT in Klinefelter syndrome. J Bone Miner Res 2014;29:2474–82. 10.1002/jbmr.2272 [DOI] [PubMed] [Google Scholar]
- 31.Mitchell DM, Caksa S, Joseph T, et al. Elevated HbA1c is associated with altered cortical and trabecular microarchitecture in girls with type 1 diabetes. J Clin Endocrinol Metab 2020;105 10.1210/clinem/dgz221. [Epub ahead of print: 01 Apr 2020]. [DOI] [PMC free article] [PubMed] [Google Scholar]
- 32.Heap J, Murray MA, Miller SC, et al. Alterations in bone characteristics associated with glycemic control in adolescents with type 1 diabetes mellitus. J Pediatr 2004;144:56–62. 10.1016/j.jpeds.2003.10.066 [DOI] [PubMed] [Google Scholar]
- 33.Maratova K, Soucek O, Matyskova J, et al. Muscle functions and bone strength are impaired in adolescents with type 1 diabetes. Bone 2018;106:22–7. 10.1016/j.bone.2017.10.005 [DOI] [PubMed] [Google Scholar]
- 34.Bechtold S, Putzker S, Bonfig W, et al. Bone size normalizes with age in children and adolescents with type 1 diabetes. Diabetes Care 2007;30:2046–50. 10.2337/dc07-0142 [DOI] [PubMed] [Google Scholar]
- 35.Shah VN, Joshee P, Sippl R, et al. Type 1 diabetes onset at young age is associated with compromised bone quality. Bone 2019;123:260–4. 10.1016/j.bone.2019.03.039 [DOI] [PMC free article] [PubMed] [Google Scholar]
- 36.Chiarelli F, Giannini C, Mohn A. Growth, growth factors and diabetes. Eur J Endocrinol 2004;151:U109–17. 10.1530/eje.0.151u109 [DOI] [PubMed] [Google Scholar]
- 37.Cheung AM, Adachi JD, Hanley DA, et al. High-resolution peripheral quantitative computed tomography for the assessment of bone strength and structure: a review by the Canadian bone strength working group. Curr Osteoporos Rep 2013;11:136–46. 10.1007/s11914-013-0140-9 [DOI] [PMC free article] [PubMed] [Google Scholar]
- 38.Sanguineti R, Puddu A, Mach F, et al. Advanced glycation end products play adverse proinflammatory activities in osteoporosis. Mediators Inflamm 2014;2014:1–9. 10.1155/2014/975872 [DOI] [PMC free article] [PubMed] [Google Scholar]
- 39.Seref-Ferlengez Z, Suadicani SO, Thi MM. A new perspective on mechanisms governing skeletal complications in type 1 diabetes. Ann N Y Acad Sci 2016;1383:67–79. 10.1111/nyas.13202 [DOI] [PMC free article] [PubMed] [Google Scholar]
Associated Data
This section collects any data citations, data availability statements, or supplementary materials included in this article.
Supplementary Materials
bmjdrc-2020-001384supp001.pdf (30.5KB, pdf)