

Abstract
The association between non-alcoholic fatty liver disease (NAFLD) and diabetic kidney disease assessed using either albuminuria or proteinuria remains controversial. This study aimed to investigate the association between hepatic steatosis or fibrosis and albuminuria or proteinuria in Korean patients with type 2 diabetes mellitus (T2D).
We enrolled 1108 patients with T2D and categorized as 3 groups; non-proteinuria (NP), isolated non-albumin proteinuria (iNAP), and albuminuria. Urinary albumin and protein levels were assessed as urinary albumin-to-creatinine ratio (uACR) and urinary protein-to-creatinine ratio (uPCR), respectively. Hepatic steatosis and fibrotic burden were assessed using the NAFLD liver fat score, Fibrosis-4 calculator (FIB-4) index, and NAFLD fibrosis score (NFS).
The prevalence of significant steatosis was similar among groups (NP: 74.6% vs iNAP: 70.3% vs albuminuria: 79.9%, P = .085). The prevalence of significant fibrosis was significantly higher in the iNAP (18.7%) and albuminuria (16.5%) groups than in the NP group (9.5%, P = .001). Both uPCR and uACR showed a correlation with NFS (uPCR: r = 0.123, P < .001; uACR: r = 0.064, P = .033). In multivariate logistic regression analysis, uPCR ≥150 mg/g was found to have a stronger association with hepatic fibrosis than uACR ≥30 mg/g (adjusted odds ratio 1.55 [95% CI 1.03–2.33] vs adjusted odds ratio 1.16 [95% CI, 0.72–1.87]).
In conclusion, patients with iNAP and albuminuria had a higher prevalence of hepatic fibrosis than those without proteinuria. Total proteinuria was associated with advanced liver fibrosis, whereas albuminuria was related to hepatic steatosis.
Keywords: albuminuria, hepatic fibrosis, proteinuria, type 2 diabetes mellitus, diabetic kidney disease
1. Introduction
With the dramatically increased prevalence and incidence of non-alcoholic fatty liver disease (NAFLD) worldwide, this condition has had a great impact on the development of hepatic fibrosis, cirrhosis, and ultimately hepatocellular carcinoma.[1] The prevalence of NAFLD in Asia was reported to be ∼45%, which is similar to the global NAFLD prevalence.[2,3] In patients with type 2 diabetes mellitus (T2D), the NAFLD prevalence rate explosively increases, reportedly from 50% to 70%.[4] In addition, NAFLD is known to precede the development of T2D and is now considered a risk factor of T2D.[5] NAFLD and T2D share a common denominator: hepatic and peripheral insulin resistance. The NAFLD state is characterized by inappropriately decreasing hepatic gluconeogenesis suppression and glycogen synthesis, and increasing hepatic lipid accumulation.[6] Considering the crucial role of the liver in the pathophysiology of T2D, the association between NAFLD and T2D is inevitable. Additionally, there is convincing evidence that patients with T2D and NAFLD experience aggravation of diabetic complications including cardiovascular disease and nephropathy.[4,7]
Diabetic kidney disease (DKD), one of the chief complications of T2D, affects about 40% of patients with T2D and is a major contributor to the progression to end-stage renal disease.[8] As albuminuria reflects impairment of the glomerulus and is altered by blood pressure and other cardiovascular risk factors, it is a well-known marker and a diagnostic criterion for DKD.[9] These aspects of albuminuria not only could be confounding factors in investigating the association between cardiovascular risk factors, but can also impose several limitations in estimating the risk of DKD progression in the early stages of the disease.[10] Proteinuria, which also includes non-albumin proteinuria (NAP), can be a more sensitive screening marker than albuminuria for predicting chronic kidney disease (CKD) progression.[11] Further, measurement of total proteinuria or urinary albumin-to-total urinary protein ratio, which also reflects a tubulointerstitial pathology of the kidney, is gaining popularity as an index of diabetic complications.[12]
Recent studies have reported the possibility that the presence of NAFLD affects DKD.[7] An observational study conducted on 2103 participants with T2D and NAFLD demonstrated that the risk for CKD was 1.87-fold increased compared with those who did not have evidence of NAFLD.[13] However, a pooled systematic meta-analysis study demonstrated the insignificant association between albuminuria and NAFLD among patients with diabetes, whereas the risk of albuminuria was 1.67-fold increased in patients with NAFLD compared with individuals without NAFLD in the general population.[14]
In this regard, the associations between NAFLD (either hepatic steatosis or fibrosis) and DKD (assessed using either albuminuria or proteinuria) remain inconsistently reported. The aim of this study was to investigate the association between hepatic steatosis or fibrosis and the status of proteinuria in Korean patients with T2D who underwent concurrent evaluations for albuminuria and total proteinuria.
2. Methods
2.1. Study population
This is a retrospective study and we reviewed patient data using electronic medical records. We enrolled patients aged ≥19 years with T2D and previously diagnosed fatty liver disease confirmed by ultrasound or computerized tomography from July 2015 to December 2018 at Severance Hospital (a tertiary university hospital in Seoul, Korea). T2D was defined according to the International Classification of Diseases, 10th revision. Patients were excluded if they fulfilled any one of the following criteria: age <19 years, type 1 diabetes, pregnancy, hepatic diseases other than NAFLD, renal diseases other than DKD, renal replacement therapy including renal transplantation and dialysis, or alcohol consumption >210 g/wk for men and 140 g/wk for women. Age, sex, weight, height, waist circumference, blood pressure, duration of diabetes, and current medications were recorded. Body mass index (BMI) was calculated as body weight divided by height squared (kg/m2). The diagnosis of metabolic syndrome followed the definition of the American Heart Association (AHA) and the National Heart, Lung, and Blood Institute (NHLBI) statements for Asian populations in 2005.[15] Hypertension was defined as a systolic blood pressure of ≥130 mmHg and/or a diastolic blood pressure of ≥85 mmHg, or current use of antihypertensive medications according to the AHA/NHLBI scientific statement. NAFLD was defined using a previously validated fatty liver prediction model (≥0.64 the NAFLD liver fat score [NLFS]).[16] The Fibrosis-4 calculator (FIB-4 index)[17] and NAFLD fibrosis score (NFS)[18] were assessed to estimate the hepatic fibrosis burden, and significant fibrosis was defined as either FIB-4 ≥2.67 or NFS ≥0.676, as previously ascertained.
The study protocol received ethical approval from the institutional review board at the Yonsei University College of Medicine (No. 4–2019-0317), which waived the need for informed consent because the database was only retrospectively accessed for analytical purposes and personal information was not used.
2.2. Measurements of blood and urinary parameters
Following an overnight fast (≥8 hours), morning spot urine sample for measuring urinary albumin, protein, and creatinine, as well as blood samples for measuring complete blood count, chemistry profiles, insulin/C-peptide, and glucose parameters including hemoglobin A1c (HbA1c) and glycated albumin were collected before (0 minute; designated as basal) and after (90 minutes; designated as stimulated) the ingestion of a standardized mixed meal. Insulin sensitivity was assessed using the homeostasis model assessment of insulin resistance, HOMA-IR = [(basal insulin [pM] × glucose [mM])/156.3].[19] The estimated glomerular filtration rate was derived from the CKD Epidemiology Collaboration creatinine-based equation.[20]
Urinary albumin and protein levels were expressed as urinary albumin-to-creatinine ratio (uACR) and urinary protein-to-creatinine ratio (uPCR), respectively, to minimize the influence of variations in kidney function. We defined proteinuria as uPCR ≥150 mg/g, according to the most conservative reported normal value for urinary protein excretion of <150 mg/d.[21] Albuminuria was defined as uACR ≥30 mg/g, according to the Kidney Disease: Improving Global Outcomes recommendation.[22] NAP was indirectly calculated from the difference between uPCR and uACR using the following formula: NAP (mg/g) = uPCR (mg/g) – uACR (mg/g).[23] iNAP and non-proteinuria (NP) were defined as both uPCR of ≥150 mg/g and uACR of <30 mg/g,[24] and both uPCR of <150 mg/g and uACR of <30 mg/g, respectively.
2.3. Statistical analysis
Data were presented as mean ± standard deviation for normally distributed continuous variables, median (interquartile range) for non-normally distributed continuous variables, and number (percentage) for categorical variables. Statistical analyses were performed using IBM SPSS statistical software for Windows, version 23.0 (IBM, Armonk, NY). We analyzed the participants’ characteristics according to the status of proteinuria, using one-way analysis of variance (ANOVA) or Kruskal-Wallis test for comparing continuous variables and the chi-square test for comparing categorical variables, followed by post-hoc analyses using the Bonferroni procedure for ANOVA and Dunn procedure for the Kruskal-Wallis test. To demonstrate the association between the degrees of albuminuria and proteinuria and hepatic steatosis or fibrosis, we categorized the values of those markers into tertiles. Correlations between urinary markers (uACR, uPCR) and indices of hepatic steatosis/fibrosis were analyzed using Spearman correlation coefficients. Multiple logistic regression analysis was applied to determine the independent association between urinary indices and hepatic parameters. Several related factors were calibrated in various adjusted models. Adjusted ORs (aORs) and 95% CIs were determined. A P-value of <.05 was considered statistically significant.
3. Results
3.1. Clinical characteristics of patients according to urinary protein–creatinine ratio and urinary albumin–creatinine ratio
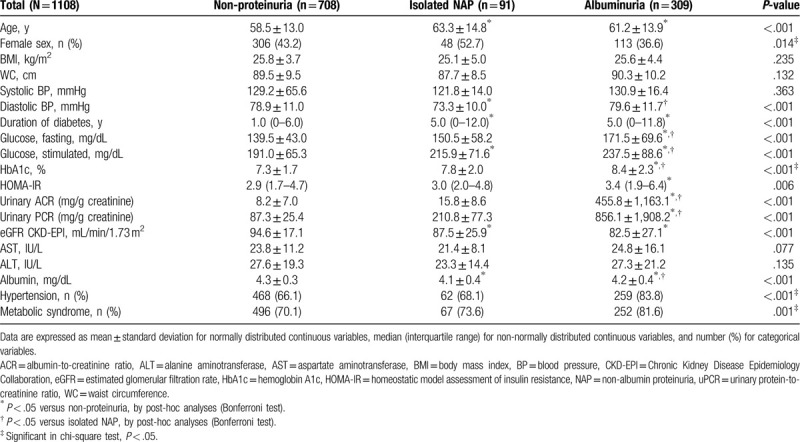
In this study, we enrolled 1108 patients with T2D (641 men and 467 women) who had undergone both urine tests for uACR and uPCR measurements and biochemical evaluations for the calculation of hepatic steatosis and fibrosis indices. The mean patient age and median duration of T2D were 59.6 and 1.0 years, respectively. On the basis of the definitions provided in the Methods section, we classified the patients into NP (708 [63.9%]), isolated NAP (iNAP) (91 [8.2%]), and albuminuria (309 [27.9%]) groups (Table 1). Among these 3 groups, there were no differences in BMI, waist circumference, systolic blood pressure, and hepatic enzymes. However, the iNAP group showed a higher proportion of female patients, a longer duration of T2D, a higher blood glucose level, and decreased kidney function (all P < .05) compared with the NP group. The albuminuria group also showed a longer duration of T2D, decreased kidney function, and increased HOMA-IR values with poor glycemic control. The proportion of patients with hypertension and metabolic syndrome was increased in both the iNAP and albuminuria groups.
Table 1.
Baseline clinical characteristics of patients.
3.2. Correlation between urinary markers and hepatic steatosis/fibrosis indices
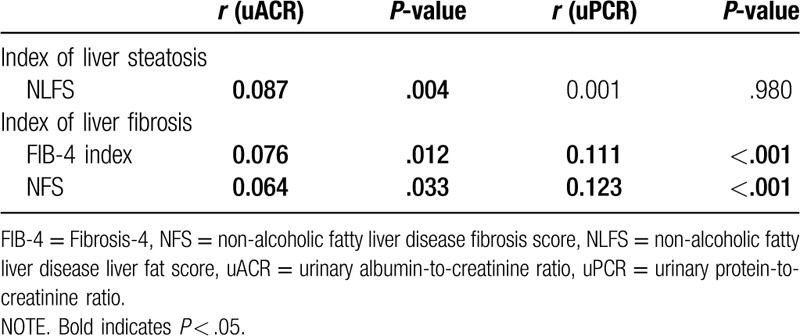
As shown in Table 2, no significant difference in hepatic steatosis according to NLFS was found among the NP, iNAP, and albuminuria groups. With respect to hepatic fibrosis, both the iNAP and albuminuria groups showed significantly increased NFS (all P < .05). Another index of hepatic fibrosis, the FIB-4 index, was increased in the iNAP and albuminuria groups, without statistical significance. As the iNAP and albuminuria groups showed higher NFS, we further analyzed the association between urine indices and hepatic steatosis. uACR was positively correlated with the NLFS (Spearman correlation, r = 0.087, P = .004) (Table 3), whereas uPCR was not significantly correlated with the index of hepatic steatosis (Spearman correlation, r = 0.001, P = .980). However, both uACR and uPCR were positively correlated with the indices of hepatic fibrosis (uACR: r = 0.076, P = .012 for FIB-4 index and r = 0.064, P = .033 for NFS; uPCR: r = 0.111, P < .001 for FIB-4 index and r = 0.123, P < .001 for NFS). In addition, uPCR showed a stronger linear correlation with the indices of hepatic fibrosis than uACR.
Table 2.
Comparison of hepatic steatosis and fibrosis indices according to proteinuria status.
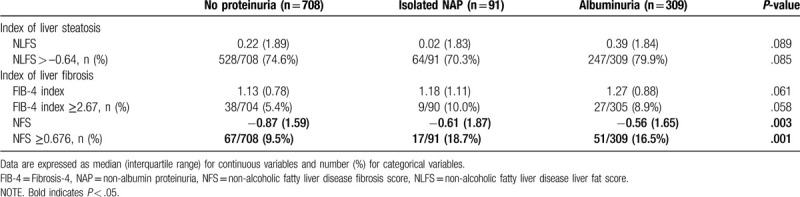
Table 3.
Relationship between hepatic steatosis/fibrosis indices and uACR/uPCR.
When urinary indices (uACR, uPCR) and the hepatic steatotic and fibrotic burden were stratified by tertiles, uACR showed a significantly positive relationship with the steatosis index (P = .016) (Fig. 1A–C). In contrast to uACR, there was no significant relationship between uPCR tertiles and the steatosis index (Fig. 1D–F). uPCR showed a strong positive relationship with the 2 fibrosis indices (FIB-4 index and NFS, both P < .05).
Figure 1.
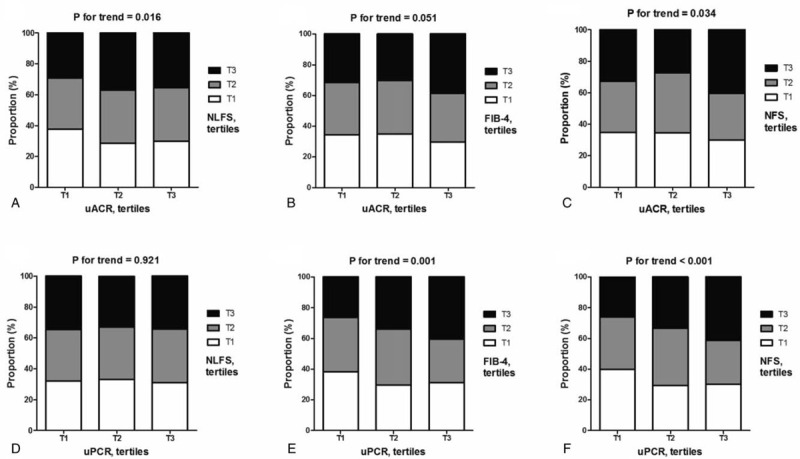
Association of NAFLD and hepatic fibrosis according to urinary marker tertiles. The association of uACR with (A) NLFS, (B) FIB-4 index, and (C) NFS by tertiles and the association of uPCR with (D) NLFS, (E) FIB-4 index, and (F) NFS by tertiles. T1 for lowest tertile and T2 for middle tertile, and T3 for highest tertile group. FIB-4 = Fibrosis-4, NFS = non-alcoholic fatty liver disease fibrosis score, NLFS = non-alcoholic fatty liver disease liver fat score, uACR = urinary albumin-to-creatinine ratio, uPCR = urinary protein-to-creatinine ratio.
3.3. Risk of hepatic steatosis/fibrosis according to urinary protein–creatinine ratio and urinary albumin–creatinine ratio
To further determine the relationship between NAFLD and urinary markers, logistic regression was performed in which potential confounders were controlled for in a stepwise manner (Table 4). The association between liver steatosis and uACR was significant when adjusting for age, sex, BMI (model 2: OR 1.64; 95% CI 1.14–2.35; P = .007), HOMA-IR, HbA1c, and duration of T2D (model 3: OR 1.56; 95% CI 1.01–2.40; P = .044). The association became insignificant after further adjustments. A similar pattern was also observed in the association between liver fibrosis and uACR.
Table 4.
Odds ratios for the presence of hepatic steatosis or fibrosis according to urinary ACR and urinary PCR.
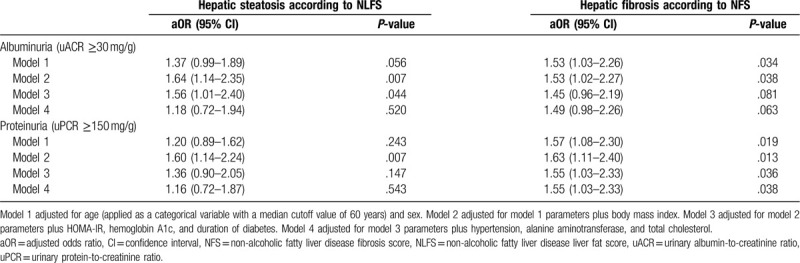
For uPCR, there was an insignificant association of hepatic steatosis after adjustment. However, liver fibrosis showed a significant association with uPCR and the association remained significant after adjusting for age, sex (model 1: OR 1.57; 95% CI 1.08–2.30; P = .019), BMI (model 2: OR 1.63; 95% CI 1.11–2.40; P = .013), HOMA-IR, HbA1c, duration of T2D (model 3: OR 1.55; 95% CI 1.03–2.33; P = .036), hypertension, alanine aminotransferase, and total cholesterol (model 4: OR 1.55; 95% CI 1.03–2.33; P = .038).
4. Discussion
Recent studies have reported the possibility that the presence of NAFLD affects DKD.[7] However, the relationship between NAFLD and DKD has remained controversial. In addition, the pathophysiologic mechanisms between albuminuria and NAFLD have not been clearly demonstrated and are questionable. In urine, the total protein amount is primarily accounted for by albumin, although other pathophysiological proteins and non-albumin proteins are also present. As the presence of albuminuria suggests glomerular damage, NAP could indicate kidney injury of a tubular origin.[25] Accordingly, we hypothesized that the development and progression of fibrosis in the hepatic parenchyma in T2D might simultaneously occur in the kidney, especially in the renal tubules. In this study, we observed the correlation between proteinuria and the pathological status of the liver. The current study elucidated 2 main findings. First, the presence of albuminuria in patients with T2D was closely related to hepatic steatosis. Second, total proteinuria, which reflects injury of both glomeruli and proximal tubules, was more closely associated with hepatic fibrosis progression. This association remained significant after adjusting for other essential factors.
With respect to albuminuria and NAFLD, one cross-sectional study of 1763 patients with T2D and NAFLD ascertained using transient elastography (FibroScan) demonstrated that the risk of albuminuria in persons with diabetes and hepatic fibrosis was 1.53-fold higher than in those without fibrosis.[26] Furthermore, the risk of albuminuria increased with greater severity of liver fibrosis. In our study, the uACR value was significantly more associated with the degree of hepatic steatosis ascertained using the NLFS (r = 0.087, P = .004) than with the degree of hepatic fibrosis assessed using FIB-4 (r = 0.076, P = .012) and NFS (r = 0.064, P = .033). However, uPCR was associated only with the degree of hepatic fibrosis. Because albuminuria is known to be related to insulin resistance, which is the underlying mechanism of metabolic syndrome and other cardiometabolic disease,[27,28] and insulin resistance also plays a role in the development of hepatic steatosis,[29,30] the link between albuminuria and hepatic steatosis in this study is acceptable and reasonable.
With respect to the association between proteinuria and hepatic fibrosis, patients with iNAP showed a higher prevalence of hepatic fibrosis and more advanced stages of liver fibrosis than those with albuminuria and NP. The hepatic fibrosis indices (FIB-4 and NFS) were more closely associated with uPCR (P < .001 for both) than with uACR (P = .980). In addition, this association remained after the application of various modalities for assessing hepatic fibrosis. Moreover, multiple logistic regression analysis showed a significant association between hepatic fibrosis and proteinuria. It has been known that iNAP is related to tubulointerstitial pathologies and that low urinary albumin-to-total protein ratio is strongly associated with tubulointerstitial disease in renal biopsies.[12] Previously, we demonstrated that uncontrolled hyperglycemia along with a lower HOMA-β, reflecting oxidative stress to the whole body system, affects renal tubulopathy in early DKD.[31] Liver fibrosis is driven by necroinflammation in response to parenchymal injury.[32] A widely accepted two-hit theory explaining the progression to hepatic fibrosis involves triglyceride deposition in hepatocytes followed by formation of reactive oxygen species and free radicals.[33] These conditions activate proinflammatory cytokines and induce oxidative stress, consequently leading to fibrosis.[33] Considering the contribution of uncontrolled hyperglycemia to chronic inflammation as well as the correlation of NAP to hyperglycemia, we postulate that NAP, which is a specialized portion of the total proteinuria, might more precisely reflect hepatic fibrosis compared with albuminuria.
With respect to the clinical and pathophysiological features of iNAP defined as both uPCR ≥150 mg/g and uACR <30 mg/g,[24] the prevalence of iNAP has been reported to be >10% among patients with T2D.[34,35] A comparable result was observed in our study. Similar to the previous study,[35] the comparatively less metabolic burden of the iNAP group, such as the presence of hypertension and metabolic syndrome, than that of the albuminuria group was also observed in the current study.[25] Although the increase in hepatic steatosis in patients with T2D with iNAP was not clear, these patients showed fibrosis progression as assessed using FIB-4 and NFS. The pathophysiological mechanisms that result in NAP are multifactorial and not fully understood. The physiological changes that induce NAP and whether NAP plays a pathophysiological role in hepatic fibrosis remain unclear. However, as mentioned above, insulin resistance or systemic inflammation can also lead to both conditions. Increased glucose reabsorption due to hyperglycemia in the proximal tubule could cause tubulointerstitial hypoxia and increased oxidative stress.[36,37] Chronic hyperglycemia per se can induce macro-/microvascular complications.[38] Additionally, the association between renal tubule function and hepatic fibrosis may be explained by hepatorenal syndrome. In hepatorenal syndrome, hemodynamic stress activates the renin-angiotensin aldosterone system, and consequently, acute tubular necrosis (the most common cause of acute kidney injury in cirrhosis) occurs.[39] Although a detailed mechanism for the independent association between the degree of NAP and fibrotic burden in the liver was not demonstrated in our cross-sectional study, our results were rather consistent with those of previous studies proposing NAP as a marker for future T2D complications including hepatic fibrosis.[25,40] In this regard, if the presence of albuminuria is to be applied only as a screening or monitoring marker for the identification of diabetes nephropathy, the risk of hepatic fibrosis progression in patients with proteinuria without albuminuria could possibly be neglected.
The current study has a few limitations. First, owing to the retrospective design of this study, we could not elucidate the causal relationship between the observed findings. Selection bias could be present because we enrolled only patients who underwent all related evaluations. In addition, this study was based on the one tertiary university hospital's medical record, our results could not reflect the entire Korean population. Further multi-centered, longitudinal study would show more clear association between liver status and albuminuria. Second, uPCR and uACR were measured once in most cases, and single rather than repeated measurements could have a low positive predictive value for the detection and segregation of the iNAP group.[24] Third, despite the acceptance of fatty liver prediction models including the NLFS, FIB-4, and NFS as indices for detecting NAFLD, these models are not currently gold standard methods for detecting NAFLD. Liver biopsy is regarded for precise diagnostic tool for evaluating the fatty liver disease, however, due to its complication, non-invasive diagnostic tools including NLFS has been widely utilized.[16] Fourth, the number of patients in the NAP group was too small to fully interpret the clinical and pathophysiological relevance of NAP with respect to hepatic steatosis and fibrosis in T2D.
In conclusion, our results showed that patients with T2D frequently have NAP and patients with NAP/albuminuria were associated with a higher risk for significant hepatic fibrosis. Additionally, the level of uPCR was associated with an increased hepatic fibrosis score, whereas uACR was associated with hepatic steatosis score. The current study may contribute to the understanding of the hepatic complications in patients with T2D. The identification of NAP as well as conventional DKD markers, such as uACR and uPCR, may help predict future hepatic complications in T2D. Further studies in larger numbers of patients with longer periods of observation with liver biopsy are needed to more clearly determine the associations between the proteinuria status and the progression of NAFLD.
Acknowledgments
The authors thank Editage (www.editage.com) for English language editing and publication support.
Author contributions
Administrative, technical, or material support: Yong-ho Lee, Eun Seok Kang, Bong-Soo Cha.
Analysis and interpretation of data: Eugene Han, Yongin Cho, Kyung-won Kim, Byung-wan Lee.
Conception and design: Yongin Cho, Eugene Han, Byung-wan Lee.
Data curation: Eugene Han, Yongin Cho, Kyung-won Kim.
Development of methodology: Yongin Cho, Eugene Han, Byung-wan Lee.
Investigation: Eugene Han, Yongin Cho.
Study supervision: Byung-wan Lee.
Supervision: Yong-ho Lee, Eun Seok Kang, Bong-Soo Cha.
Writing, review, and/or revision of the manuscript: Yongin Cho, Eugene Han, Byung-wan Lee.
Footnotes
Abbreviations: AHA = American Heart Association, BMI = body mass index, CKD = chronic kidney disease, DKD = diabetic kidney disease, eGFR = estimated glomerular filtration rate, FIB-4 = Fibrosis-4 calculator, HbA1c = hemoglobin A1c, HOMA-IR = homeostasis model assessment of insulin resistance, iNAP = isolated non-albumin proteinuria, NAFLD = non-alcoholic fatty liver disease, NAP = non-albumin proteinuria, NFS = non-alcoholic fatty liver disease fibrosis score, NHLBI = National Heart, Lung, and Blood Institute, NLFS = non-alcoholic fatty liver disease liver fat score, NP = non-proteinuria, uACR = urinary albumin-to-creatinine ratio, uPCR = urinary protein-to-creatinine ratio.
How to cite this article: Han E, Cho Y, Kim Kw, Lee Y-h, Kang ES, Cha BS, Lee B-W. Hepatic fibrosis is associated with total proteinuria in Korean patients with type 2 diabetes. Medicine. 2020;99:33(e21038).
EH and YC have equally contributed to this work.
This study was supported by research grants from Hanmi Pharmaceutical Co., Ltd.
The authors have no conflicts of interest to disclose.
The datasets generated during and/or analyzed during the current study are not publicly available, but are available from the corresponding author on reasonable request.
References
- [1].Younossi ZM, Stepanova M, Afendy M, et al. Changes in the prevalence of the most common causes of chronic liver diseases in the United States from 1988 to 2008. Clin Gastroenterol Hepatol 2011;9:524 e521–30 e521. quiz e560. [DOI] [PubMed] [Google Scholar]
- [2].Fan JG, Kim SU, Wong VW. New trends on obesity and NAFLD in Asia. J Hepatol 2017;67:862–73. [DOI] [PubMed] [Google Scholar]
- [3].Younossi ZM, Koenig AB, Abdelatif D, et al. Global epidemiology of nonalcoholic fatty liver disease-Meta-analytic assessment of prevalence, incidence, and outcomes. Hepatology 2016;64:73–84. [DOI] [PubMed] [Google Scholar]
- [4].Lee YH, Cho Y, Lee BW, et al. Nonalcoholic fatty liver disease in diabetes. Part I: Epidemiology and diagnosis. Diabetes Metab J 2019;43:31–45. [DOI] [PMC free article] [PubMed] [Google Scholar]
- [5].Anstee QM, Targher G, Day CP. Progression of NAFLD to diabetes mellitus, cardiovascular disease or cirrhosis. Nat Rev Gastroenterol Hepatol 2013;10:330–44. [DOI] [PubMed] [Google Scholar]
- [6].Tilg H, Moschen AR, Roden M. NAFLD and diabetes mellitus. Nat Rev Gastroenterol Hepatol 2017;14:32–42. [DOI] [PubMed] [Google Scholar]
- [7].Han E, Lee YH. Non-alcoholic fatty liver disease: the emerging burden in cardiometabolic and renal diseases. Diabetes Metab J 2017;41:430–7. [DOI] [PMC free article] [PubMed] [Google Scholar]
- [8].Adler AI, Stevens RJ, Manley SE, et al. Development and progression of nephropathy in type 2 diabetes: the United Kingdom Prospective Diabetes Study (UKPDS 64). Kidney Int 2003;63:225–32. [DOI] [PubMed] [Google Scholar]
- [9].Keane WF, Brenner BM, De Zeeuw D, et al. The risk of developing end-stage renal disease in patients with type 2 diabetes and nephropathy: the RENAAL study. Kidney Int 2003;63:1499–507. [DOI] [PubMed] [Google Scholar]
- [10].Hong N, Lee M, Park S, et al. Elevated urinary N-acetyl-beta-D-glucosaminidase is associated with high glycoalbumin-to-hemoglobin A1c ratio in type 1 diabetes patients with early diabetic kidney disease. Sci Rep 2018;8:6710. [DOI] [PMC free article] [PubMed] [Google Scholar]
- [11].Methven S, MacGregor MS, Traynor JP, et al. Assessing proteinuria in chronic kidney disease: protein–creatinine ratio v ersus albumin–creatinine ratio. Nephrol Dial Transplant 2010;25:2991–6. [DOI] [PubMed] [Google Scholar]
- [12].Smith ER, Cai MM, McMahon LP, et al. The value of simultaneous measurements of urinary albumin and total protein in proteinuric patients. Nephrol Dial Transplant 2011;27:1534–41. [DOI] [PubMed] [Google Scholar]
- [13].Targher G, Bertolini L, Rodella S, et al. Non-alcoholic fatty liver disease is independently associated with an increased prevalence of chronic kidney disease and proliferative/laser-treated retinopathy in type 2 diabetic patients. Diabetologia 2008;51:444–50. [DOI] [PubMed] [Google Scholar]
- [14].Wijarnpreecha K, Thongprayoon C, Boonpheng B, et al. Nonalcoholic fatty liver disease and albuminuria: a systematic review and meta-analysis. Eur J Gastroenterol Hepatol 2018;30:986–94. [DOI] [PubMed] [Google Scholar]
- [15].Grundy SM, Cleeman JI, Daniels SR, et al. Diagnosis and management of the metabolic syndrome: an American Heart Association/National Heart, Lung, and Blood Institute scientific statement. Circulation 2005;112:2735–52. [DOI] [PubMed] [Google Scholar]
- [16].Kotronen A, Peltonen M, Hakkarainen A, et al. Prediction of non-alcoholic fatty liver disease and liver fat using metabolic and genetic factors. Gastroenterology 2009;137:865–72. [DOI] [PubMed] [Google Scholar]
- [17].Vallet-Pichard A, Mallet V, Nalpas B, et al. FIB-4: an inexpensive and accurate marker of fibrosis in HCV infection. Comparison with liver biopsy and fibrotest. Hepatology 2007;46:32–6. [DOI] [PubMed] [Google Scholar]
- [18].Angulo P, Hui JM, Marchesini G, et al. The NAFLD fibrosis score: a noninvasive system that identifies liver fibrosis in patients with NAFLD. Hepatology 2007;45:846–54. [DOI] [PubMed] [Google Scholar]
- [19].Matthews DR, Hosker JP, Rudenski AS, et al. Homeostasis model assessment: insulin resistance and beta-cell function from fasting plasma glucose and insulin concentrations in man. Diabetologia 1985;28:412–9. [DOI] [PubMed] [Google Scholar]
- [20].Levey AS, Stevens LA, Schmid CH, et al. A new equation to estimate glomerular filtration rate. Ann Intern Med 2009;150:604–12. [DOI] [PMC free article] [PubMed] [Google Scholar]
- [21].Shaw AB, Risdon P, Lewis-Jackson JD. Protein creatinine index and Albustix in assessment of proteinuria. Br Med J (Clin Res Ed) 1983;287:929–32. [DOI] [PMC free article] [PubMed] [Google Scholar]
- [22].Levey AS, Eckardt K-U, Tsukamoto Y, et al. Definition and classification of chronic kidney disease: a position statement from Kidney Disease: Improving Global Outcomes (KDIGO). Kidney Int 2005;67:2089–100. [DOI] [PubMed] [Google Scholar]
- [23].Halimi JM, Matthias B, Al-Najjar A, et al. Respective predictive role of urinary albumin excretion and nonalbumin proteinuria on graft loss and death in renal transplant recipients. Am J Transplant 2007;7:2775–81. [DOI] [PubMed] [Google Scholar]
- [24].Fraser S, Roderick P, McIntyre N, et al. Assessment of proteinuria in patients with chronic kidney disease stage 3: albuminuria and non-albumin proteinuria. PLoS One 2014;9:e98261. [DOI] [PMC free article] [PubMed] [Google Scholar]
- [25].Han E, Kim MK, Lee YH, et al. Association between nonalbumin proteinuria and renal tubular damage of N-acetyl-beta-d-glucosaminidase and its clinical relevance in patients with type 2 diabetes without albuminuria. J Diabetes Complications 2019;33:255–60. [DOI] [PubMed] [Google Scholar]
- [26].Yeung MW, Wong GL, Choi KC, et al. Advanced liver fibrosis but not steatosis is independently associated with albuminuria in Chinese patients with type 2 diabetes. J Hepatol 2017;8278:32334–6. [DOI] [PubMed] [Google Scholar]
- [27].Wang TJ, Evans JC, Meigs JB, et al. Low-grade albuminuria and the risks of hypertension and blood pressure progression. Circulation 2005;111:1370–6. [DOI] [PubMed] [Google Scholar]
- [28].Han E, Lee YH, Kim G, et al. Sarcopenia is associated with albuminuria independently of hypertension and diabetes: KNHANES 2008-2011. Metabolism 2016;65:1531–40. [DOI] [PubMed] [Google Scholar]
- [29].Kim KS, Lee BW, Kim YJ, et al. Nonalcoholic fatty liver disease and diabetes: Part II: treatment. Diabetes Metab J 2019;43:127–43. [DOI] [PMC free article] [PubMed] [Google Scholar]
- [30].Namkung J, Shong KE, Kim H, et al. Inhibition of serotonin synthesis induces negative hepatic lipid balance. Diabetes Metab J 2018;42:233–43. [DOI] [PMC free article] [PubMed] [Google Scholar]
- [31].Huh JH, Lee M, Park SY, et al. Glycated albumin is a more useful glycation index than hba1c for reflecting renal tubulopathy in subjects with early diabetic kidney disease. Diabetes Metab J 2018;42:215–23. [DOI] [PMC free article] [PubMed] [Google Scholar]
- [32].Han E, Lee YH, Kim BK, et al. Sarcopenia is associated with the risk of significant liver fibrosis in metabolically unhealthy subjects with chronic hepatitis B. Aliment Pharmacol Ther 2018;48:300–12. [DOI] [PubMed] [Google Scholar]
- [33].Day CP, James OF. Steatohepatitis: a tale of two “hits”? Gastroenterology 1998;114:842–5. [DOI] [PubMed] [Google Scholar]
- [34].Katayev A, Zebelman AM, Sharp TM, et al. Prevalence of isolated non-albumin proteinuria in the US population tested for both, urine total protein and urine albumin: an unexpected discovery. Clin Biochem 2017;50:262–9. [DOI] [PubMed] [Google Scholar]
- [35].Cho Y, Lee YH, Kang ES, et al. Glucometabolic characteristics and higher vascular complication risk in Korean patients with type 2 diabetes with non-albumin proteinuria. J Diabetes Complicat 2019;33:585–91. [DOI] [PubMed] [Google Scholar]
- [36].De Nicola L, Gabbai FB, Liberti ME, et al. Sodium/glucose cotransporter 2 inhibitors and prevention of diabetic nephropathy: targeting the renal tubule in diabetes. Am J Kidney Dis 2014;64:16–24. [DOI] [PubMed] [Google Scholar]
- [37].Nangaku M. Chronic hypoxia and tubulointerstitial injury: a final common pathway to end-stage renal failure. J Am Soc Nephrol 2006;17:17–25. [DOI] [PubMed] [Google Scholar]
- [38].Rhee SY, Kim YS. The role of advanced glycation end products in diabetic vascular complications. Diabetes Metab J 2018;42:188–95. [DOI] [PMC free article] [PubMed] [Google Scholar]
- [39].Arroyo V, Gines P, Gerbes AL, et al. Definition and diagnostic criteria of refractory ascites and hepatorenal syndrome in cirrhosis. International Ascites Club. Hepatology 1996;23:164–76. [DOI] [PubMed] [Google Scholar]
- [40].Kim SR, Lee Y-h, Lee S-G, et al. The renal tubular damage marker urinary N-acetyl-β-d-glucosaminidase may be more closely associated with early detection of atherosclerosis than the glomerular damage marker albuminuria in patients with type 2 diabetes. Cardiovasc Diabetol 2017;16:16. [DOI] [PMC free article] [PubMed] [Google Scholar]