Supplemental Digital Content is available in the text
Keywords: h-index, Kano model, research achievement, top one impact coefficient, x-indx
Abstract
Background:
Individual researchers’ achievements (IRA) are determined by both personal publications and article citations such as Author Impact Factor, h-index, and x-index. Due to those indicators not truly supporting a normal distribution, the traditional t-test and Analysis of variance are not allowed for RA comparison in groups. The objective of this study is to use the bootstrapping method to verify whether hospital physicians have different h-indexes.
Methods:
We downloaded 63,266 journal articles with their corresponding citations for 2128 researchers from a Taiwan university website on December 10, 2019. Their IRAs were assessed using the bibliometric h-index. A pyramid plot was used to compare the h-index patterns between institutes. The x-index and the Kano model were found to be complemental to the h-index for identifying the group IRA characteristics and rankings, including colleges and departments in the university study, the School of Medicine, and the Affiliated Hospital. The bootstrapping method was applied with an estimated 95% confidence interval (CI) to distinguish the differences in physicians between the Internal Medicine and Surgery departments. The stronger-than-the-next coefficient (SC) for the highest represents the RA strength.
Results:
The highest h-indices were found in the College of Engineering, School of Medicine, and the Department of Internal Medicine in groups of colleges (SC = 0.71), all departments (SC = 0.83), the School of Medicine (SC = 0.74), and the Affiliated Hospital (SC = 0.56), respectively. No difference in h-index for hospital physicians was found between departments in Internal Medicine (Mean = 2.14, 95% CI = 1.02,3.26) and Surgery (mean = 2.5, 95%CI = 1.48, 3.52).
Conclusions:
The x-index and the Kano models can complement the h-index for identifying group IRA characteristics. The bootstrapping method allows estimation of the sampling distribution for almost any statistic using random sampling methods and gains measures of accuracy (as defined by 95% CI). The finding of no difference in h-index for hospital physicians between departments in Internal Medicine and Surgery requires further investigation in the future.
Highlights:
-
(1)
The bootstrapping method was applied to discriminate the difference in research achievements with h-index that is not suitable for using t-test or ANOVA due to data not distributed by normalization.
-
(2)
The stronger-than-the-next coefficient (SC) was used for understanding the strength of the highest one in a group.
-
(3)
We illustrated the complement of h-index using x-index to display the visual representation in a diagram using the Kano model to display.
1. Introduction
The h-index was proposed as an indicator of individual research achievement (IRA).[1] Its use has spread throughout the global scientific community.[2] The original paper[1] had been cited 552 times in Pubmed Central as of December 21, 2019. Over 328 and 98 articles were searched with the term “(bibliometric[MeSH Major Topic]) AND h-index”[All Fields] and only in title, respectively, in Pubmed Central.
The h-index is defined as follows: a scientist has index h if h of his or her Np papers have at least h citations each, and the other (Np-h) papers have ≤ h citations each.[1–3] For example, an h-index of 5 means that a scientist has published 5 papers that each has at least 5 citations.[3] One strength of the h-index is that it evaluates 2 surrogate measures:
-
(1)
quantity (ie, evaluated by the number of publications); and
-
(2)
quality (ie, assessed by the number of citations of publications) as a single integer number to denote the IRA.
The h-index is thus little affected by those with a high volume of low-impact papers or only a few high-impact articles.[3]
Numerous studies have reported the IRAs with h-index in academic rank, such as
-
(1)
median h-indices in editorial board membership for assistant professors (6.5), associate professors (7), and full professors (14)[4];
-
(2)
mean (SD) h-indices
-
(3)
in general surgeons of Ontario for lecturers = 1.0 (1.8), assistant professors 2.9 (4.1), associate professors = 7.3 (6.1), and full professors = 23.1 (13.6)[5]; and mean h indices in the field of neurosurgery in the US for assistant professors = 4.9 (95% confidence interval [CI] 2.5–9.3), associate professors = 8.3 (95% CI 5.9–10.7), professors = 10.1 (95% CI 7.7–12.5), and chairpersons = 14.8 (95% CI 12.5–17.2).[6]
From the results above, we can see that all studies assumed h-indices following normal distribution and then used 95% CI (CI = mean +/- 2∗SD) to identify the difference between groups. The assumption is no evidence basis, particularly for the CI that should be computed by mean +/- 2∗SE (=standard error instead of standard deviation) as the study did in ref.[6] The bootstrapping method7 allows estimation of the sampling distribution of almost any statistic using random sampling methods, gains measures of accuracy (defined by 95% CI) and is worthy of comparing h-indices between groups.
Not only has the h index begun to be reported for authors in the medical profession,[3,5–7] but it also can be readily calculated using such tools as the Web of Science database, Scopus, and Google Scholar, and thus may come into more frequent use in academics. We proposed to calculate an approximation of h index values for faculty in 1 university at various points in their careers to provide some general guidelines from which to consider the use of the bootstrapping method to compare h index values for selected physicians.
In studies of hospital physicians’ work-time,[8] 46% of inpatient working time was spent in direct contact with patients. More than half of inpatient work-time was occupied by tasks carried out away from patients. The amount of time taken up by direct patient care varied from 35% to 60% among the disciplines studied. As such, we were motivated to use the bootstrapping method to verify whether hospital physicians had different h-indices in their career lives.
2. Methods
2.1. Data source
We downloaded 63,266 journal articles along with their corresponding citations from a Taiwan university website[9] on December 10, 2019, including 37 1st tier departments (eg, Affiliated Hospital, College of Medicine), 157 2nd tier departments (eg, Departments in the Affiliated Hospital, School of Medicine), and 28 3rd tier departments (eg, Department of Anesthesiology in School of Medicine).
All faculty member names were uniquely identified by the website (eg, the name assigned at the end with -2, -3, or more in the system if the full name was duplicated), see Supplemental Digital Content 1. The biographical characteristics of a total of 2128 researchers, including their citations on each article, were collected. The IRAs were assessed by the bibliometric h-index. Only articles or review articles were included in computing h-index. That is those documents in conferences and other letters to editors were excluded from this study.
We created an Excel Visual Basic for Applications (Microsoft Corp) module to handle the data. Ethical approval was not necessary for this study as no human subjects or personal data were involved.
2.2. Representations of the research results
2.2.1. Pyramid plot for comparing the h-index hierarchies between institutes
The h = index hierarchies for four typical institutes were drawn using a pyramid plot.
2.2.2. Kano diagrams and x-indices complemental to display h-indices in comparison
The Kano Model[10] with 3 main categories of quality (ie, basic requirement, 1-dimensional quality, and exciting feature) was created to display the association between publications and citations at the x-index[11] core on axes X and Y.
All author (or institute) citation numbers for each (or each member's) article are displayed in descending order along with the ascending sequential integral number (i) from 1 to n. The x-indexes [=  where all of the cited papers are denoted by ci] based on the x-core publications at i,[11] were applied to obtain the IRA for affiliated institutes and authors, respectively. Bubbles sized by the h-index for each entity will be displayed on the Kano diagram using the publications and the citations in the x-index core to interpret the entity features toward the citation-oriented, the performance quality, or the production-oriented.
2.2.3. The stronger-than-the-next coefficient (SC) for the highest entity in the IRA
The SC is defined as that applied on the logic of scree plots to a ratio by computing the first- and second-largest values (R12 = v1/v2) with that of the second and third ones (R23 = v2/v3).[12–14] The SC ranges from 0 to 1.0; the higher means the tendency toward a 100% monopoly for the Top 1 entity. The cutting point is set at 0.67[14] for discriminating whether the top 1 has significantly different values from the following 2.
We will plot 4 Kano diagrams and compute the SC for each Top 1 entity in the respective groups (ie, college, department in the study university, School of Medicine, and Affiliated Hospital).
2.2.4. Whether hospital physicians have different h-indexes
The bootstrapping method[15] was performed to verify the difference in h-indices for hospital physicians among departments in the Affiliated Hospital. A total of 1000 median metrics were retrieved from random samples of 100 repetitions of median values for each h-index in each department. Thus, the mean and 95% CI were obtained to compare differences in h-index among departments by inspecting whether 2 95% CI bands were not overlaid.
2.3. Creating Dashboards on Google Maps
All Figures but the pyramid were shown by author-made modules in Excel (Microsoft Corp). We created pages of HTML used for Google Maps. All relevant h-index information on the entities can be linked to dashboards on Google Maps.
3. Results
3.1. h-index hierarchies for typical institutes on a pyramid plot
h-index hierarchies for 4 typical institutes are present in Figure 1. We can see the highest h-index (=84) was in the College of Management, followed by 2 with 74 and 73 in the College of Engineering. The lowest h-index at the top 1 in the group was in the Affiliated Hospital. The h-index and the x-index for the study university are estimated at 176 and 235, respectively.
Figure 1.
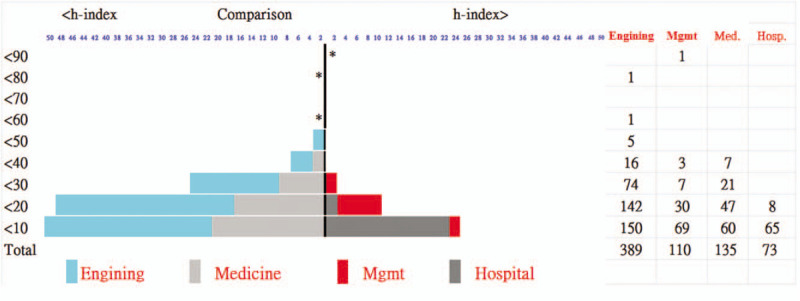
Distribution of h-index hierarchies for 4 typical institutes.
3.2. The highest h-index in each study subsample
The highest h-indices were found in the College of Engineering, School of Medicine, and Department of Internal Medicine in groups of colleges (SC=0.71), all departments (SC = 0.83), School of Medicine (SC = 0.74), and the Affiliated Hospital (SC = 0.56), respectively (see Figs. 2–5). The Kano diagrams clearly display the ones that are oriented toward citations in green bubbles and productivity in red bubbles. Traditionally, the h-index cannot present the feature as we did with Kano diagrams to display the x-index core.
Figure 2.
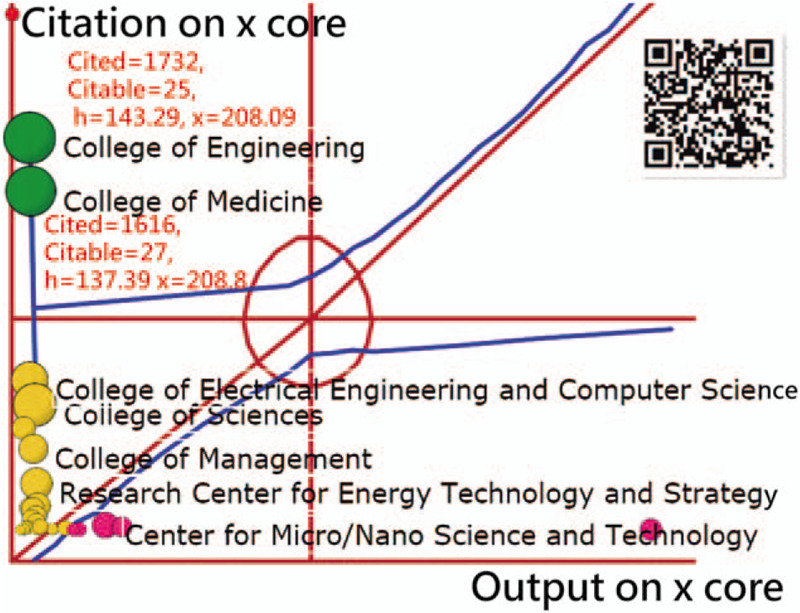
Comparison of h-index for colleges and schools.
Figure 5.
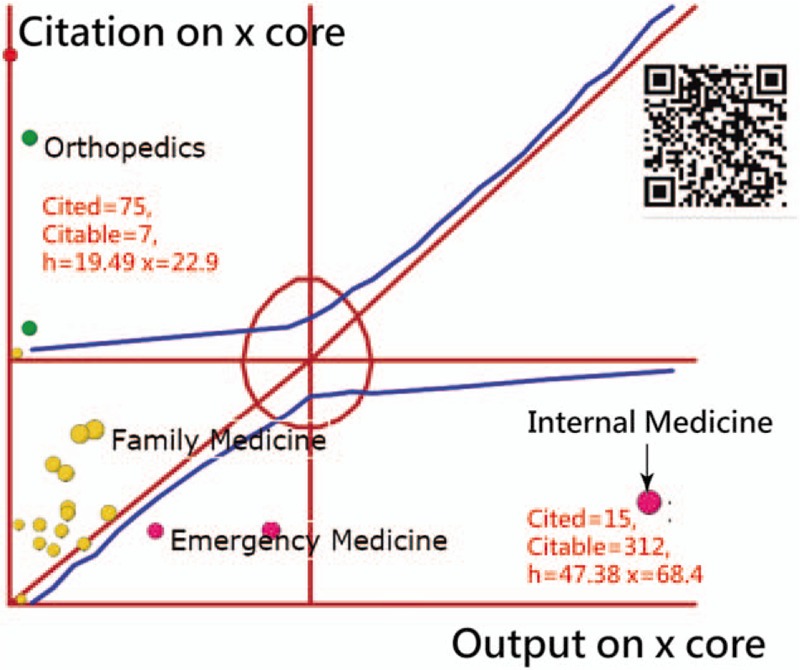
Comparison of h-indexes based on whole units among hospital departments.
Figure 3.
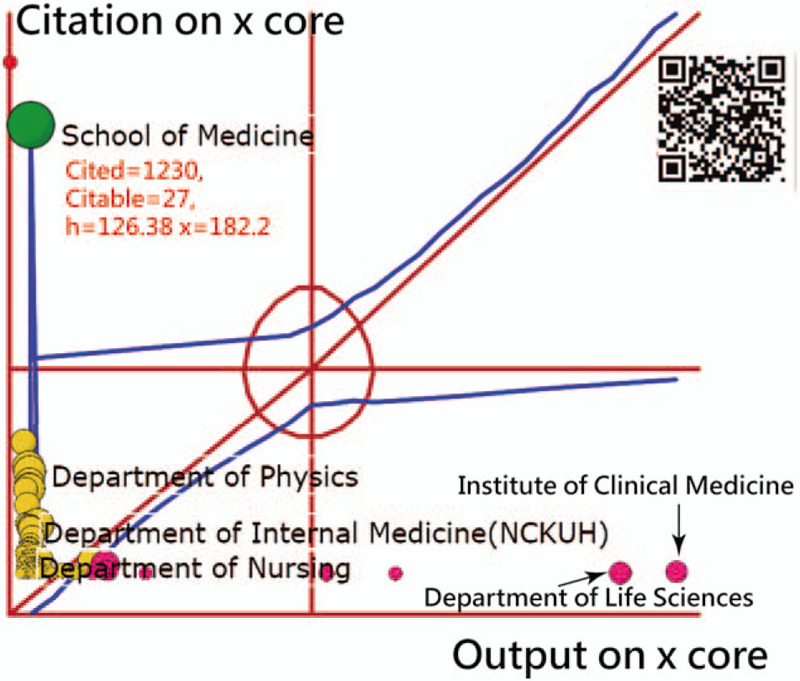
Comparison of h-index for departments.
3.3. Whether hospital physicians have different h-indexes
No difference in h-index for hospital physicians was found between departments in Internal Medicine (mean = 2.14, 95% CI = 1.02,3.26) and Surgery (mean = 2.5, 95%CI = 1.48, 3.52). The highest mean h-index for hospital physicians was found in the Department of Radiation Oncology (mean = 6.45, 95% CI = 3.64, 9.27) in comparison to the lowest 1 in the Department of Dentistry (mean = 0, 95% CI = 0, 0.03) (Fig. 6). The cutting point is set at 0.67[14] for discriminating whether the top 2 have significantly different values.
Figure 6.
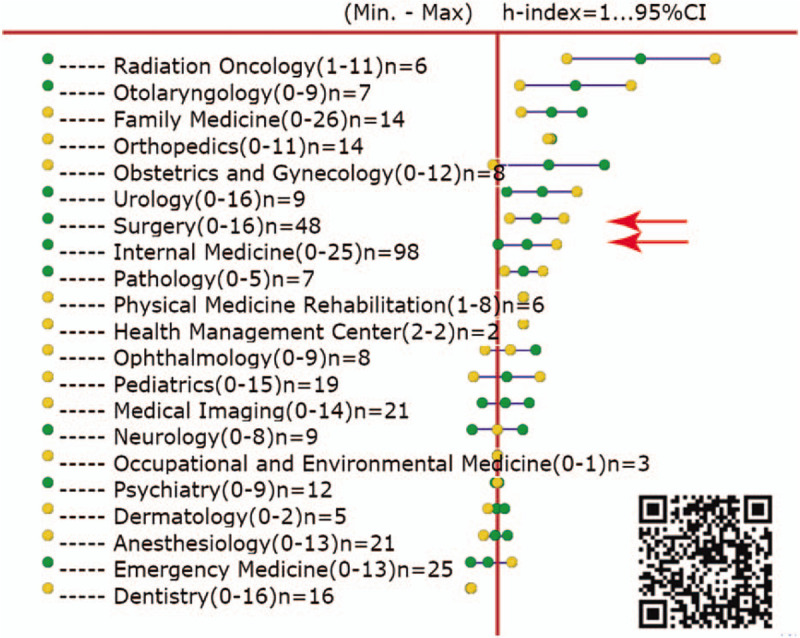
Comparison of h-indexes based on individuals among hospital departments.
In comparison to Figure 5, we computed the SC for the 3 departments of Internal Medicine (1, h-index = 47), Surgery (4, h-index = 28), Anesthesiology (5, h-index = 22.56) with the formula [=1.35/(1 + 1.45), where 1.35 = (47/28)/(28/22.56)], indicating no substantial difference in h = indices exists between departments of Internal Medicine and Surgery. Interested individuals are invited to scan the QR-code in Figure 4 and click the bubble of interest to view details about the bibliometric indices, such as h-/x-index and the ranking placement.
Figure 4.
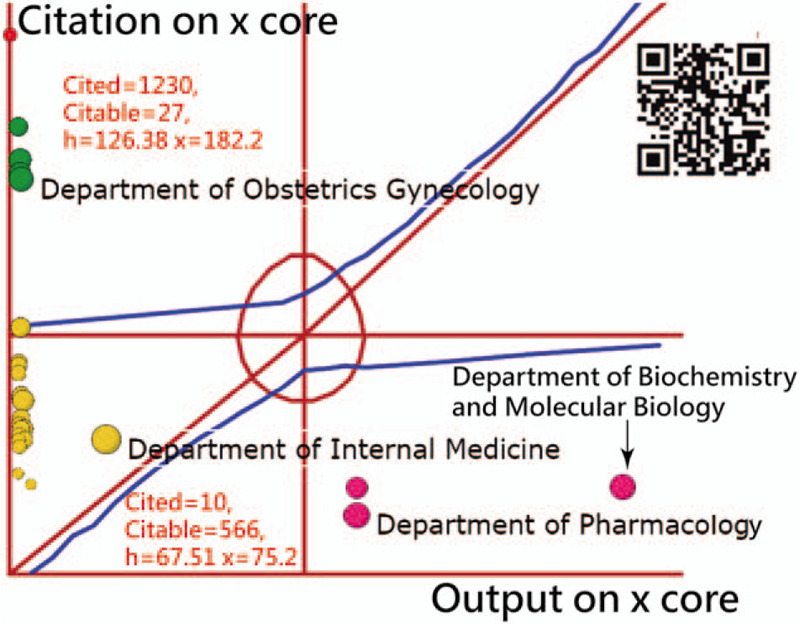
Comparison of h-index for the School of Medicine.
4. Discussion
4.1. Principal findings
The highest h-indices were found in the College of Engineering, School of Medicine, and the Department of Internal Medicine in groups of colleges (SC = 0.71), all departments (SC = 0.83), the School of Medicine (SC = 0.74), and the Affiliated Hospital (SC = 0.56), respectively. No difference in h-index for hospital physicians was found between departments in Internal Medicine (Mean = 2.14, 95% CI = 1.02,3.26) and Surgery (mean = 2.5, 95%CI = 1.48, 3.52).
4.2. Study features
The first feature is the display of h-index hierarchies for 4 typical institutes using the pyramid plot, which has never been seen before in the literature, to compare the h-index structure for research institutes of a university. One picture is worth ten thousand words.[16]
The second feature is the application of the Kano model[10] to interpret the features for each entity's IRA using a visual representation. In particular, the dashboard-type display allows us to see details about the bibliometric indices while scanning the QR-code and clicking the entity of interest in Google Maps.
The reasons for using x-index on 2 axes in Figures from 2 to 5 are
-
(1)
closely correlated to h-index[11];
-
(2)
newly developed in 2018.
The reason, without considering h-index as the metric, has been discussed using examples.[11] The x-index was thus used to complement h-index for clearly interpreting the entity feature toward the citation-oriented or the productively-oriented.
The third feature is the Kano diagrams combined with the x-index on a dashboard using Google Maps to display, which is harder to create using the traditional method.[17]
The fourth feature includes all publications of faculty members in a university found using web-scrawling techniques.[18,19] In particular, many universities (eg, Elsevier, Amsterdam, the Netherlands) have launched research systems linked to the Scopus database in recent years. Interested readers are invited to search the keyword “find research outputs —" on Google Search to read the list of universities, see Supplemental Digital Content 2 and Supplemental Digital Content 3.
Finally, we developed the SC for understanding the strength of the Top 1 entity relative to the next using the formula (R23 = v2/v3).[12–14] The cutting point (=0.67) is used to discriminate the substantial difference between the 2 entities. Otherwise, it is hard to identify the top role by importance.
4.3. Limitations and suggestions
Although findings are based on the above analysis, several potential limitations may encourage further research efforts. First, this study only focused on 1 university, and the results cannot be generalized to other universities.
Second, certain biases may have existed during citation extractions because the number of citations increased with the elapsed date. That is, the author IRA might differ if the time periods and the citation sources of the data are disparate.
Third, many faculty members simultaneously work for several departments. Only the first unit was involved in this study. The results of h-index in comparison in Figures 2–6 might be biased if the author-weighted scheme[20–25] was applied.
Fourth, although our suggested SC was proposed for displaying the extent to which the entity had a monopoly within a group, many similar indicators have been used to compare the inequality of the data, such as the Herfindahl index (also known as Herfindahl–Hirschman Index, or sometimes Herfindahl–Hirschman Index-score)[2] and the Gini coefficient.[23,24]
Finally, although we considered the h-index as not normally distributed in nature, the bootstrapping method we used in this study is merely selecting the mean from random samples of 100 repetitions of median values for each h-index in each department. The 95% CI would be different if the median was retrieved from 100 repetitions of median values for each department. Future studies are recommended to compare the difference between the methods of using the mean and the median in this bootstrapping method.
5. Conclusions
The x-index and the Kano models can complement the h-index for identifying group IRA characteristics. The bootstrapping method allows estimation of the sampling distribution for almost any statistic using random sampling methods and gains measures of accuracy (as defined by 95% CI). The finding of no difference in h-index for hospital physicians between departments in Internal Medicine and Surgery requires further investigation in the future.
Acknowledgments
We thank Enago (www.enago.tw) for the English language review of this manuscript. All authors declare no conflicts of interest.
Author contributions
SC developed the study concept and design. TWC, TY, and JCJ analyzed and interpreted the data. WC monitored the process of this study and helped in responding to the reviewers’ advice and comments. TWC drafted the manuscript, and all authors provided critical revisions for important intellectual content. The study was supervised by WC. All authors read and approved the final manuscript.
Conceptualization: Sheng-Chun Kung.
Data curation: Jui-Chung John Lin.
Formal analysis: Sheng-Chun Kung.
Methodology: Jui-Chung John Lin.
Supplementary Material
Supplementary Material
Supplementary Material
Footnotes
Abbreviations: CI = confidence interval, IRA = individual research achievement, SC = stronger-than-the-next coefficient.
How to cite this article: Kung SC, Chien TW, Yeh YT, Lin JC, Chou W. Using the bootstrapping method to verify whether hospital physicians have different h-indexes regarding individual research achievement: a bibliometric analysis. Medicine. 2020;99:33(e21552).
Ethics approval and consent to participate
All data were downloaded from the MEDLINE database at pubmed.com.
All data used in this study are available in Supplemental Digital Content files.
The authors have no funding and conflicts of interest to disclose.
The datasets generated during and/or analyzed during the current study are publicly available.
References
- [1].Hirsch JE. An index to quantify an individual's scientific research output. Proc Natl Acad Sci U S A 2005;102:16569–72. [DOI] [PMC free article] [PubMed] [Google Scholar]
- [2].Nowak JK, Lubarski K, Kowalik LM, et al. H-index in medicine is driven by original research. Croat Med J 2018;59:25–32. [DOI] [PMC free article] [PubMed] [Google Scholar]
- [3].Doja A, Eady K, Horsley T, et al. The h-index in medical education: an analysis of medical education journal editorial boards. BMC Med Educ 2014;14:251. [DOI] [PMC free article] [PubMed] [Google Scholar]
- [4].Panduro A, Ojeda-Granados C, Rivera H, et al. h Index and scientific output of researchers in medicine from the University of Guadalajara. Mexico Rev Med Inst Mex Seguro Soc 2015;53:716–21. [PubMed] [Google Scholar]
- [5].Sharma B, Boet S, Grantcharov T, et al. The h-index outperforms other bibliometrics in the assessment of research performance in general surgery: a province-wide study. Surgery 2011;153:493–501. [DOI] [PubMed] [Google Scholar]
- [6].Lee J, Kristin KL, Couldwell WT. Use of the h index in neurosurgery. J Neurosurg 2009;111:387–92. [DOI] [PubMed] [Google Scholar]
- [7].van Haselen R. The h-index: a new way of assessing the scientific impact of individual CAM authors. Complement Ther Med 2007;15:225–7. [DOI] [PubMed] [Google Scholar]
- [8].Wolff J, Auber G, Schober T, et al. Work-time distribution of physicians at a German University Hospital. Dtsch Arztebl Int 2017;114:705–11. [DOI] [PMC free article] [PubMed] [Google Scholar]
- [9].Research NCKU. Author research publications incorporated with Scopus database online in a university.2019/12/3 available at: https://researchoutput.ncku.edu.tw/en/organisations/. [Google Scholar]
- [10].Kano N, Seraku N, Takahashi F, et al. Attractive quality and must-be quality. JSQC 1984;41:39–48. [Google Scholar]
- [11].Fenner T, Harris M, Levene M, et al. A novel bibliometric index with a simple geometric interpretation. PLoS One 2018;13:e0200098. [DOI] [PMC free article] [PubMed] [Google Scholar]
- [12].Divgi DR. Dimensionality of binary items: use of a mixed model. Paper presented at the annual meeting of the National Council on Measurement in Education. Boston, MA, 1980. [Google Scholar]
- [13].Lord FM. Applications of item response theory to practical testing problems. Hillside, NJ: Erlbaum; 1980. [Google Scholar]
- [14].Chien TW. Cronbach's alpha with the dimension coefficient to jointly assess a scale's quality. Rasch Measurement Transactions 2012;26:1379. [Google Scholar]
- [15].Efron B. Bootstrap methods: another look at the jackknife. Ann Stat 1979;7:1–26. [Google Scholar]
- [16].Hepting DH. The history of a picture's worth. 2019/12/21 available at: http://www2.cs.uregina.ca/∼hepting/projects/pictures-worth/. [Google Scholar]
- [17].Persson O. Analyzing bibliographic data to visualize representations. 2019/12/20 available at: https://homepage.univie.ac.at/juan.gorraiz/bibexcel/index.html%3ffbclid=IwAR0FCL3Tjjmx2XyUI_ZKxfv12DYTGhGsStmU-MKzOECxQ2kJEglfouO_2aQ?fbclid=IwAR2SMJF-pnZ7dRDXzy8VgqPW0fzMZ0CIyGDNmtVPtsnDVOABx7WqfHTgyNE. [Google Scholar]
- [18].Xu S, Yoon HJ, Tourassi G. A user-oriented web crawler for selectively acquiring online content in e-health research. Bioinformatics 2014;30:104–14. [DOI] [PMC free article] [PubMed] [Google Scholar]
- [19].Yugandhara P, Sonal P. Review of web crawlers with specification and working. IJARCCE 2016;5:4. [Google Scholar]
- [20].Chien TW, Wang HY, Lai Fj. Applying an author-weighted scheme to identify the most influential countries in research achievements on skin cancer: observational study. JMIR Dermatol 2018;2:e11015. [Google Scholar]
- [21].Vavryčuk V. Fair ranking of researchers and research teams. PLoS One 2018;13:e0195509. [DOI] [PMC free article] [PubMed] [Google Scholar]
- [22].Catherine LH, Alan P. Inventive concentration: an analysis of fuel cell patents. Science and Public Policy 2004;31:15–25. [Google Scholar]
- [23].Gini C. Concentration and dependency ratios (in Italian). English translation in Rivista di Politica Economica 1909;87:769–89. [Google Scholar]
- [24].Chien TW, Chow JC, Chang Y, et al. Applying Gini coefficient to evaluate the author research domains associated with the ordering of author names: a bibliometric study. Medicine 2018;97:e12418. [DOI] [PMC free article] [PubMed] [Google Scholar]
- [25].Rousseau R, Leuven KU. Reflections on recent developments of the h-index and h-type indices. COLLNET Journal of Scientometrics and Information Management 2008;2:1–8. [Google Scholar]
Associated Data
This section collects any data citations, data availability statements, or supplementary materials included in this article.


