Fig. 5.
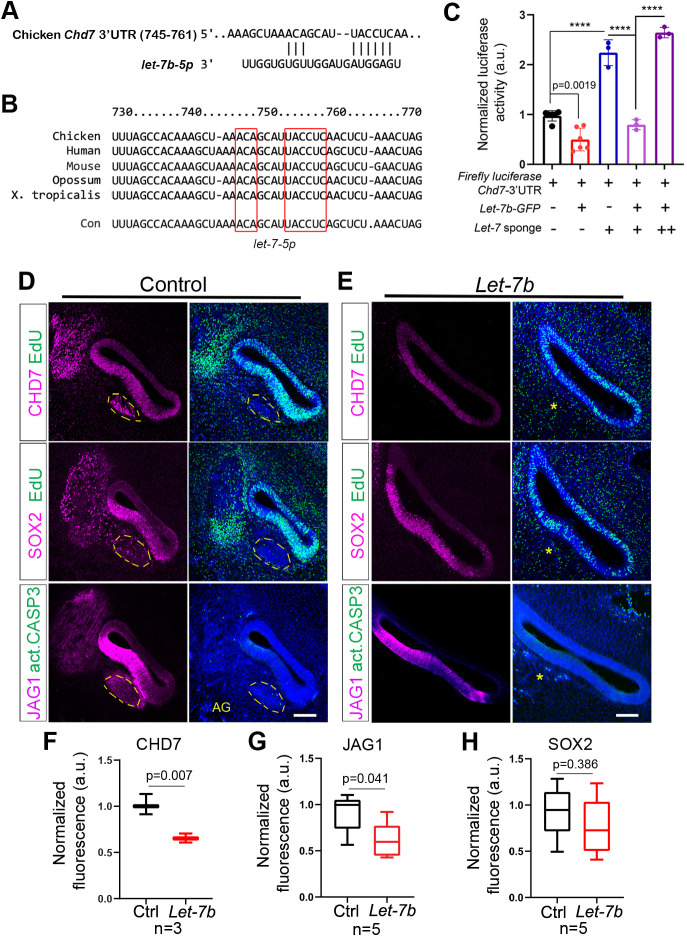
let-7 miRNAs negatively regulate CHD7 expression in the developing BP. (A,B) Chd7 is an evolutionarily conserved let-7 target gene. TargetScan Release 7.2 software was used to identify conserved let-7-5p binding sites in regulatory genes. The 3′UTR-sequence of the chicken Chd7 gene (ENST00000423902.2) contains a high probability let-7b-5p-binding site, including an exact match to positions 2-7 (seed sequence) of mature let-7 miRNAs (red boxes) (A). The let-7-5p-binding site within the Chd7 gene is highly conserved across vertebrate species (red boxes) (B). (C) let-7b represses murine Chd7 expression by targeting its 3′UTR. Equal amounts of firefly-luciferase-Chd7-3′UTR and Renilla luciferase plasmids were co-transfected into HEK 293T cells with (+) or without (−) let-7b-GFP and with (+) or without (−) let-7 sponge plasmids (++ indicates that twice the amount of let-7 sponge plasmid was used). Firefly-luciferase-reporter activity and Renilla luciferase activity was measured 48 h after transfection and Renilla luciferase activity was used to normalize firefly luciferase activity. Data are mean±s.d. Individual data points represent biological replicates. For each condition, a minimum of three independent samples were analyzed. P-values were calculated using one-way ANOVA, with Tukey's correction, ****P<0.0001 (P<0.05 is deemed not significant). (D-H) 18 h after electroporation and EdU treatment at E4.5, let-7b-treated BPs and corresponding control BPs were harvested and adjacent cross-sections were co-stained for CHD7 and EdU (top panel), SOX2 and EdU (middle panel), and JAG1 and activated caspase 3 (act-CASP3) (bottom panel). (D,E) Representative confocal images of cross-sections through the mid-apical region of control BPs (D) and let-7b-treated BPs (E). SOX2 and JAG1 immunostaining mark the pro-sensory/sensory domain. Act-CASP3 (green) immunostaining labels apoptotic cells, EdU (green) labels mitotic cells. The size of the acoustic ganglion (AG), marked by dashed yellow lines in control BPs, is severely reduced in let-7b-treated BPs (yellow asterisks). (F-H) Relative intensity of CHD7 (F), JAG1 (G) and SOX2 (H) immunofluorescence within the pro-sensory/sensory domain of control (black bars) and let-7b-treated (red bars) BPs. Box plots representing the sample median, first and third quartiles, and whiskers are drawn from minimum to maximum (n=number of animals per group, P-value calculated using unpaired two-tailed Student's t-test, P≤0.05 deemed significant). Ctrl, control. Scale bars: 100 µm.

