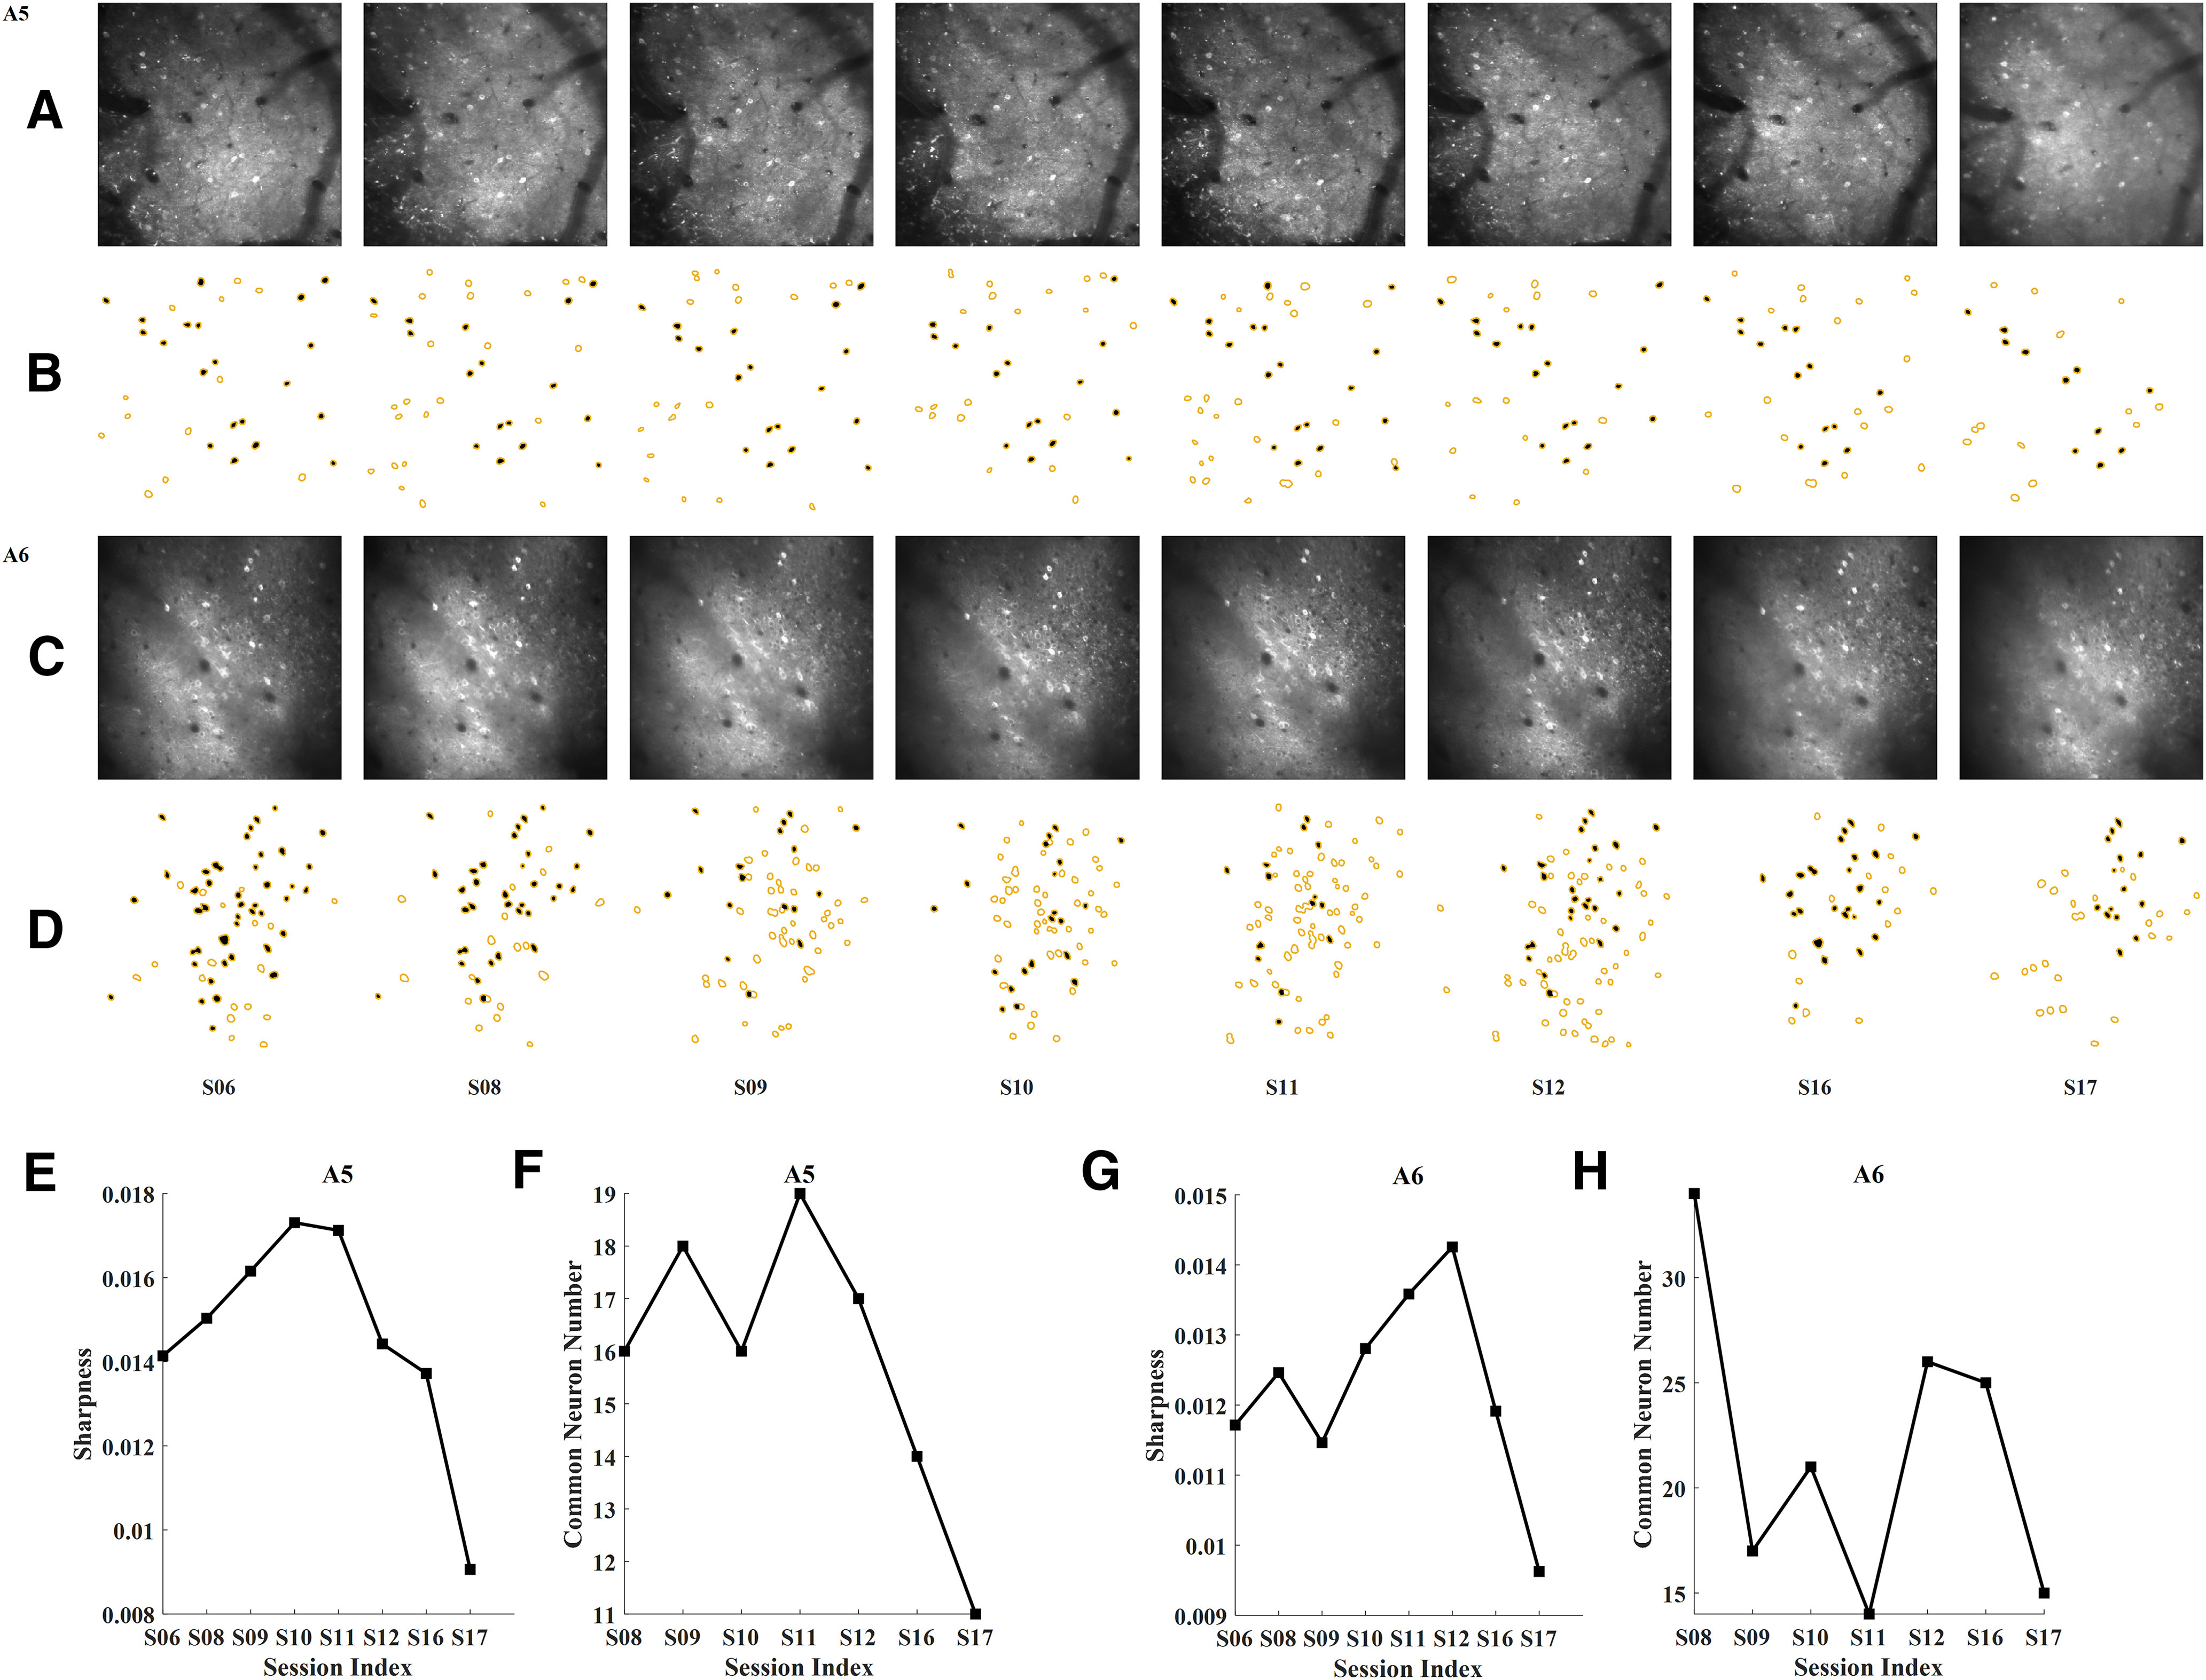
Figure 2.

Basic information of the collected FOV images. A, The FOV image of each session from RFA, labeled as A5. B, The ROIs mask of each session from A5. C, The FOV image of each session from CFA, labeled as A6. D, The ROIs mask of each session from A6. The yellow circles represent the detected neurons in each FOV image. The yellow circles filled with black color represent the neurons common to each and . n defines the session index. S is short for session. E, The sharpness metrics of each session for A5. The lower the value, the more blurred the FOV image. F, Number of neurons common to each and for A5. G, The sharpness metrics of each session for A6. H, Number of neurons common to each and for A6.
