Abstract
Background
Surgical outcome prediction models are useful for many purposes, including informed consent, shared decision making, preoperative mitigation of modifiable risk, and risk-adjusted quality measures. The recently reported Surgical Risk Preoperative Assessment System (SURPAS) universal risk calculators were developed using 2005-2012 American College of Surgeons National Surgical Quality Improvement Program (ACS-NSQIP), and they demonstrated excellent overall and specialty-specific performance. However, surgeons must assess whether universal calculators are accurate for the small subset of procedures they perform. To our knowledge, SURPAS has not been tested in a subset of patients undergoing lower-extremity total joint arthroplasty (TJA).
Questions/purposes
How accurate are SURPAS models’ predictions for patients undergoing TJA?
Methods
We identified an internal subset of patients undergoing non-emergency THA or TKA from the 2012 ACS-NSQIP, the most recent year of the SURPAS development dataset. To assess the accuracy of SURPAS prediction models, 30-day postoperative outcomes were defined as in the original SURPAS study: mortality, overall morbidity, and six complication clusters—pulmonary, infectious, cardiac or transfusion, renal, venous thromboembolic, and neurologic. We calculated predicted outcome probabilities by applying coefficients from the published SURPAS logistic regression models to the TJA cohort. Discrimination was assessed with C-indexes, and calibration was assessed with Hosmer-Lemeshow 10-group chi-square tests and decile plots.
Results
The 30-day postoperative mortality rate for TJA was 0.1%, substantially lower than the 1% mortality rate in the SURPAS development dataset. The most common postoperative complications for TJA were intraoperative or postoperative transfusion (16%), urinary tract infection (5%), and vein thrombosis (3%). The C-indexes for joint arthroplasty ranged from 0.56 for venous thromboembolism (95% CI 0.53 to 0.59 versus SURPAS C-index 0.78) to 0.82 for mortality (95% CI 0.76 to 0.88 versus SURPAS C-index 0.94). All joint arthroplasty C-index estimates, including CIs, were lower than those reported in the original SURPAS development study. Decile plots and Hosmer-Lemeshow tests indicated poor calibration. Observed mortality rates were lower than expected for patients in all risk deciles (lowest decile: no observed deaths, 0.0% versus expected 0.1%; highest decile: observed mortality 0.7% versus expected 2%; p < 0.001). Conversely, observed morbidity rates were higher than expected across all risk deciles (lowest decile: observed 12% versus expected 8%; highest decile: observed morbidity 32% versus expected 25%; p < 0.001)
Conclusions
The universal SURPAS risk models have lower accuracy for TJA procedures than they do for the wider range of procedures in which the SURPAS models were originally developed.
Clinical Relevance
These results suggest that SURPAS model estimates must be evaluated for individual surgical procedures or within restricted groups of related procedures such as joint arthroplasty. Given substantial variation in patient populations and outcomes across numerous surgical procedures, universal perioperative risk calculators may not produce accurate and reliable results for specific procedures. Surgeons and healthcare administrators should use risk calculators developed and validated for specific procedures most relevant to each decision. Continued work is needed to assess the accuracy of universal risk calculators in more narrow procedural categories based on similarity of outcome event rates and prevalence of predictive variables across procedures.
Introduction
Surgical outcome prediction models estimate patients’ risks of postoperative morbidity and mortality based on preoperative information. Prediction models could be useful for many aspects of surgical care, including informed consent, shared decision making, preoperative mitigation of modifiable risk, and risk-adjusted quality measures [15, 17, 19]. Adoption of previously developed risk prediction models in modern surgical practice has been inconsistent, in part because of a lack of electronic health record integration and burdensome data entry requirements [2, 14]. The large number of available options may also hinder adoption because there are universal surgical population models that incorporate many surgical procedures and procedure-specific models that are only relevant for one type or a limited group of procedures.
Recently, the Surgical Risk Preoperative Assessment System (SURPAS), a set of universal surgical morbidity and mortality prediction models, was developed using the American College of Surgeons National Surgical Quality Improvement Program (ACS-NSQIP) database [14]. A 30-day mortality prediction model was developed with data across surgical procedures in nine specialties (general, vascular, orthopaedic, thoracic, plastic, urologic, otolaryngologic, gynecologic, and neurosurgery) and included 28 preoperative predictor variables. A morbidity model included 40 preoperative predictor variables. Reduced models were also developed with only seven to 11 covariates that accounted for more than 99% of the full-model C-indexes. The full models demonstrated excellent performance across a broad range of surgical procedures (C-indexes: mortality 0.94, overall morbidity 0.81). However, surgeons must assess whether the SURPAS models or any other universal risk calculators are accurate for the small subset of surgical procedures they perform. We wished to assess the SURPAS models’ accuracy in non-emergency THA and TKA because these procedures are among the most common and costly major surgeries in the United States [20, 21], and because THA and TKA have low variability on most SURPAS model inputs and relatively low rates of most postoperative complications.
We therefore sought to determine the accuracy of the SURPAS models for specific procedures that differed from the overall SURPAS development sample, using total joint arthroplasty (TJA) as an exemplar. Specifically, we asked: How accurate are SURPAS models’ predictions for patients undergoing TJA?
Materials and Methods
Data Source
The two phases of risk prediction model research include: (1) model development, in which regression models are created and model coefficients are calculated, and (2) model validation, in which the model coefficients are applied to observations and the predictions are compared to observed outcomes. Internal validation studies test the models on observations from the same data source used in model development, whereas external validation studies test the models on new observations from an external data source. Our study was a type of internal validation using a targeted subset of the SURPAS models, previously developed and published by Meguid et al. [14]. For this internal validation study, we selected the ACS-NSQIP 2012 Participant Use Data File because it was the most recent year of the dataset used for development of the SURPAS risk prediction models [14]. The ACS-NSQIP is a surgical quality clinical registry that contains preoperative, intraoperative, and postoperative information on a portion of surgeries from participating sites (374 hospitals in 2012) [1]. Procedures are systematically sampled for inclusion in the ACS-NSQIP using an 8-day cycle to ensure that surgeries from each day of the week have an equivalent chance of selection. Each site has at least one trained, certified surgical clinical reviewer who captures the ACS-NSQIP data using medical record abstraction, direct patient communication, and a variety of other methods. Intensive training is provided for surgical clinical reviewers, and inter-rater reliability audits are periodically conducted to ensure data accuracy.
Cohort Selection
The Stanford University institutional review board determined that this observational cohort study with de-identified data was exempt from review. The 2012 ACS-NSQIP Participant Use Data File database was queried for patients who underwent primary THA (Current Procedural Terminology [CPT] code 27130) or TKA (CPT code 27447) by an orthopaedic surgeon, as designated by the “SURGSPEC” variable [1]. Emergency procedures were excluded using the “EMERGNCY” variable [1].
Outcomes
Outcome variables were defined as in the original SURPAS models development study because our research question focused on assessing accuracy of the published SURPAS models [14]. Postoperative mortality and morbidity were measured 30 days after the surgical procedure. Overall morbidity included the occurrence of one or more of 18 postoperative complications, categorized into six clusters: pulmonary, infectious, cardiac or transfusion, renal, venous thromboembolic events, and neurologic. Some clustered endpoints required combining events of dissimilar occurrence frequencies and importance to the patient, which may lead to misinterpretation of the results if the magnitude of the effect differs between component events.[4] For example, venous thromboembolic complications included vein thrombosis requiring therapy and pulmonary embolism.
Statistical Analysis
We present descriptive statistics for the TJA and SURPAS cohorts including frequencies, proportions, means and SDs. As the TJA cohort is a subset of the full SURPAS cohort, p values are not provided for population comparisons between cohorts. We calculated the predicted probabilities of experiencing postoperative mortality, overall morbidity, and complications in each of the six clusters by applying coefficients and patient factors from published risk models [14]. The original SURPAS overall mortality and morbidity models were first developed using all 28 nonlaboratory variables from the ACS-NSQIP (full models), and reduced models were calculated that included only the first seven to 11 variables and accounted for more than 99% of the maximal C-indexes [14]. We compared the predicted probabilities from the full and reduced models with the observed events to determine the accuracy and discrimination of the SURPAS predictive models specific to the cohort of non-emergency TJAs. We calculated accuracy for 10 models: full mortality, reduced mortality, full morbidity, reduced morbidity, and full models for each of the six complication clusters.
To obtain predicted probabilities, we determined odds ratios for each model’s predictor variables and transformed them into beta coefficients by calculating the log-odds. We obtained the predicted probabilities of model outcomes for each patient by summing the products of each beta coefficient and the corresponding predictive factor. We assessed two important dimensions of model performance: discrimination and calibration [16]. The discrimination of each predictive model—the model’s ability to predict the occurrence of mortality or morbidity—was assessed by calculating the C-index (or area under the receiver operating characteristic curve) with associated 95% CIs. A C-index of 0.5 suggested the model’s predictive ability was no better than random chance, and a C-index approaching 1.0 indicated the model could perfectly discriminate an occurrence versus non-occurrence in any pair of individuals. Generally, C-indexes can be classified into the following categories: excellent (0.9-1.0), good (0.8-0.89), fair (0.7-0.79), poor (0.6–0.69), or no discriminatory capacity (0.5-0.59) [5, 9]. The original SURPAS analysis used a hold-back set whereby the authors developed the models on a developmental dataset with a randomly-selected 50% of records, and the C-index estimates were calculated using the other half of the dataset (the validation dataset) [14]. In the current study, we compared the C-indexes for the TJA sample to the validation (test) C-indexes reported for the SURPAS models. TJA C-index asymptotic normal CIs were estimated using DeLong’s standard error calculation [3]; C-index confidence intervals are presented instead of p values because the TJA cohort is a subset of the full SURPAS cohort. Calibration, or how well the predicted probabilities align with the observed probabilities of morbidity or mortality, was assessed using Hosmer-Lemeshow calibration decile plots of observed and predicted outcomes by predicted risk deciles, as well as associated 10-group chi-squares and p values [13]. Brier scores with Spiegelhalter’s z-statistics were also calculated, representing the squared differences between observed and predicted outcomes. The Brier score ranges from 0 for a perfect-fit model to 0.25 for a noninformative model with a 50% outcome incidence; models with a lower incidence of the outcome have a lower maximum Brier score [16].
Statistical significance was assessed at the level of α = 0.05 such that p values were considered significant if p ≤ 0.05. The risk prediction estimation was performed in SAS version 9.4 (SAS Institute, Cary, NC, USA). C-index CIs, Hosmer-Lemeshow chi-squares, and Brier scores were calculated using Stata/MC version 14.2 (Stata Corp, College Station, TX, USA).
Results
Comparison with the Original Study
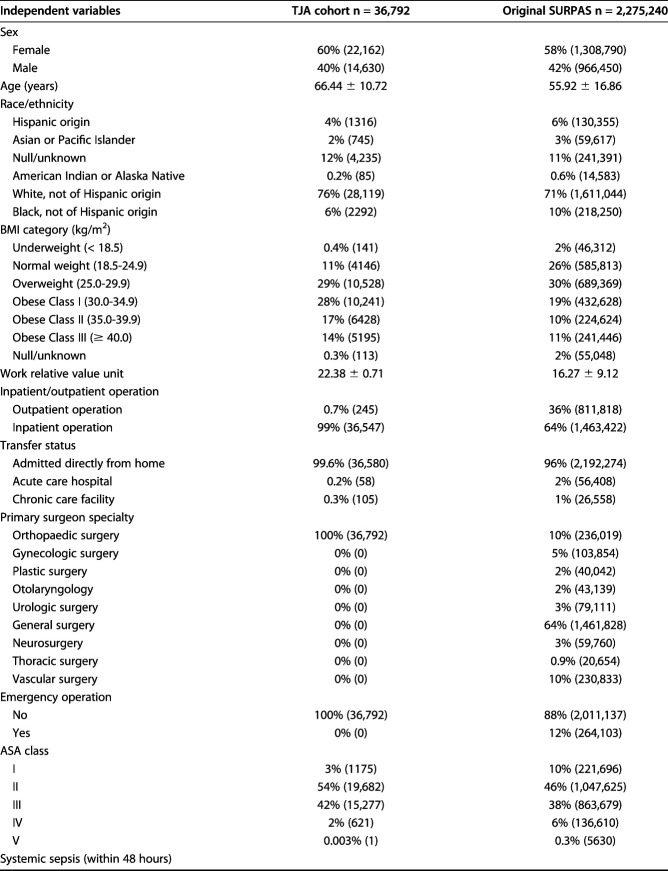
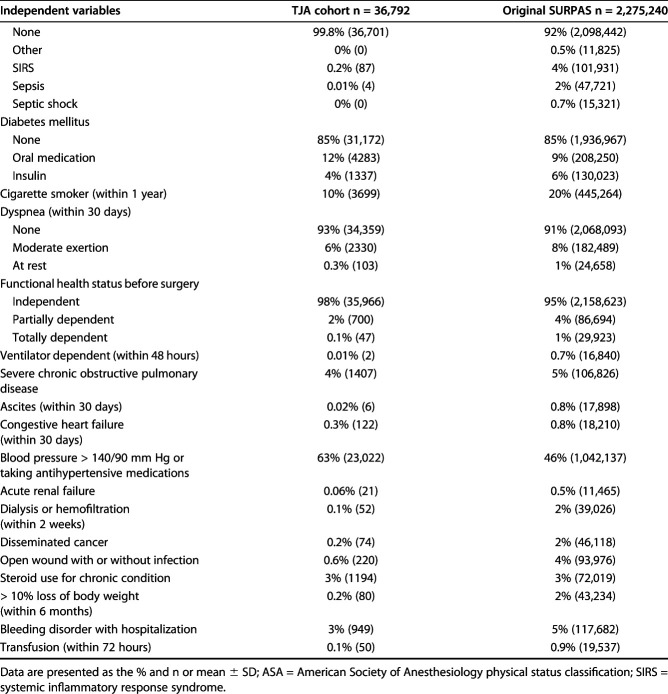
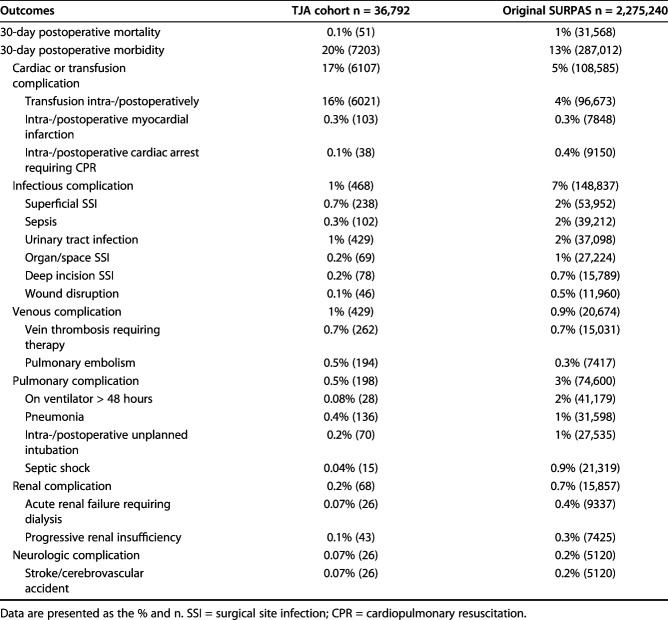
The TJA and SURPAS cohorts had dissimilar distributions of some independent variables used in the models (Table 1). Compared with the full SURPAS cohort, patients who underwent TJA in 2012 were older and more likely to be white and obese. Outcome variable frequencies also differed between the TJA and SURPAS cohorts (Table 2). The TJA cohort had a substantially lower mortality rate and a higher overall morbidity rate than the original SURPAS dataset. The most common postoperative complications contributing to the TJA morbidity rate were intraoperative or postoperative transfusion (16%), urinary tract infection (5%), and vein thrombosis requiring therapy (3%). The C-indexes for the SURPAS full models, including all nonlaboratory variables applied to the TJA sample, ranged from 0.56 for venous thromboembolism (95% CI 0.53 to 0.59 versus SURPAS C-index 0.78) to 0.82 for mortality (95% CI 0.76 to 0.88 versus SURPAS C-index 0.94) (Fig. 1). All C-index estimates for the TJA sample, including the confidence intervals, were lower than those reported in the original SURPAS development study.
Table 1.
Prevalence of independent variables in the TJA cohort and original SURPAS dataset
Table 2.
Prevalence of model outcome measures in the TJA cohort and original SURPAS dataset
Fig. 1.
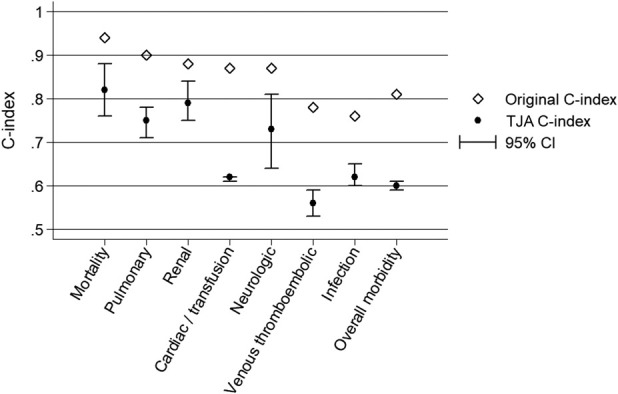
Discrimination results of the full models were compared between the original SURPAS procedures and the TJA procedures for mortality, overall morbidity, and six complication clusters.
Mortality
Overall 30-day postoperative mortality for the TJA procedures was 0.1%, which is substantially lower than the 1% mortality rate in the development dataset. The full 28-variable predictive model of postoperative mortality resulted in good discrimination, with a C-index of 0.82 (95% CI 0.75 to 0.88). The reduced model with eight predictive variables also demonstrated strong discrimination, with a C-index of 0.82 (95% CI 0.76 to 0.88).
The Hosmer-Lemeshow decile plot demonstrated that observed 30-day mortality rates were substantially lower than predicted by the full model, especially at higher levels of predicted risk (Fig. 2). The Hosmer-Lemeshow chi-square statistic indicated the model was a poor fit to the data, with lower observed mortality rates than expected in all risk deciles. Patients in the lowest risk decile had no deaths (0%) versus an expected 0.1%, and patients in the highest risk decile had an observed mortality rate of 0.7% versus an expected 2% (p < 0.001).
Fig. 2.
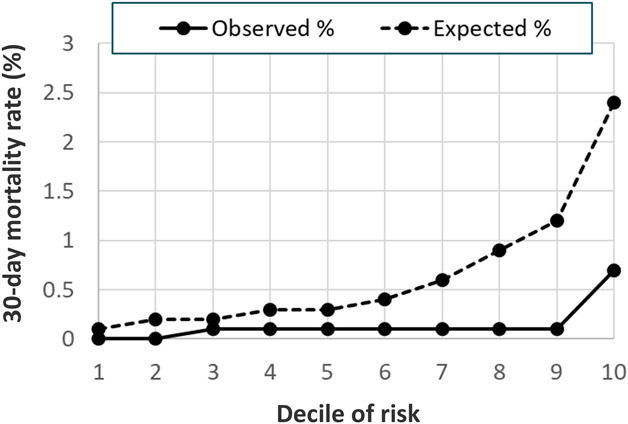
A 30-day postoperative mortality model Hosmer-Lemeshow calibration decile plot of observed and expected mortality event rates is shown here.
Morbidity
The 30-day postoperative morbidity rate for the TJA procedures was 20%, higher than the 13% morbidity rate in the original SURPAS development dataset. The predictive model of 30-day postoperative morbidity had poor discrimination, with a C-index of 0.60 (95% CI 0.59 to 0.60). The reduced model with nine predictive variables demonstrated a similar level of discrimination to the full model, with a C-index of 0.60 (95% CI 0.59 to 60). The Hosmer-Lemeshow decile plot indicated that observed morbidity rates were consistently higher than predicted by the model (Fig. 3). Patients in the lowest risk decile had 12% observed morbidity versus an expected 8%, and patients in the highest risk decile had an observed morbidity rate of 32% versus an expected 25% (p < 0.001).
Fig. 3.
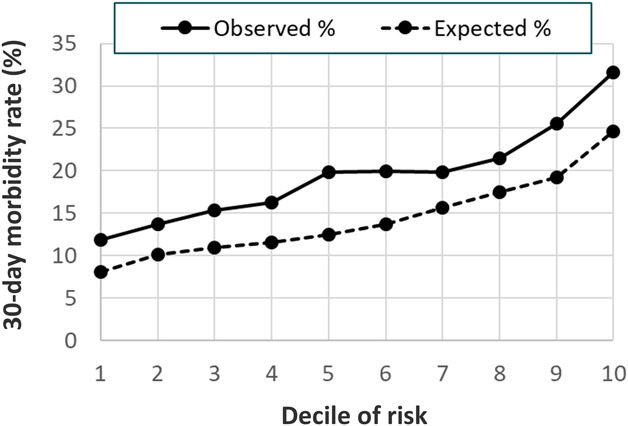
This chart shows the 30-day postoperative combined morbidity model Hosmer-Lemeshow calibration decile plot of observed and expected mortality event rates.
Complication Clusters
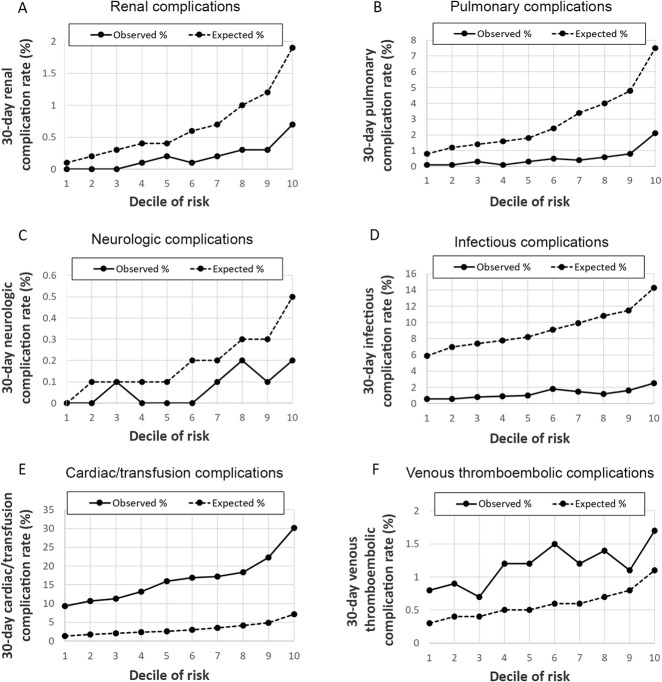
Among TJA patients, event rates for the six complication clusters varied from 0.18% for renal complications to 17% for cardiac and transfusion complications (Table 2). Among patients with cardiac and transfusion complications, 98.6% had intraoperative or postoperative transfusions. Compared with the SURPAS sample, TJA patients had lower rates of infectious, pulmonary, renal and neurologic complications but higher rates of cardiac/transfusion and venous complications. Predictive models of 30-day complication clusters ranged from good discrimination for renal complications, with a C-index of 0.79 (95% CI 0.75 to 0.84), to poor discrimination for venous thromboembolism complications, with a C-index of 0.56 (95% CI 0.53 to 0.59) (Fig. 4A-F). Hosmer-Lemeshow decile plots suggested poor calibration for complication clusters. Renal, pulmonary, neurologic, and infectious complications were observed at substantially lower rates in the TJA dataset than in the SURPAS models. Conversely, cardiac and transfusion and venous thromboembolic complications occurred at higher rates in TJA than predicted by the SURPAS data.
Fig. 4A-F.
Shown here are the 30-day postoperative complication models Hosmer-Lemeshow calibration decile plots of observed and expected complication rates for six complication clusters: (A) renal, (B) pulmonary, (C) neurologic, (D) infectious, (E) cardiac/transfusion, (F) venous thromboembolic.
Discussion
Surgical outcome prediction models are increasingly used for multiple purposes. As an aid for surgeon-patient discussions, risk prediction models can guide shared decision making, improve informed consent, and facilitate preoperative mitigation of modifiable risks [17]. Risk-adjusted quality measures for hospitals and physicians must adequately account for variability in patient mix to ensure a fair “level playing field” [15, 19]. The recently reported SURPAS universal risk prediction models had excellent overall and specialty-specific performance across a wide range of surgical procedures, but the models’ performance had not previously been assessed in TJA patients. We aimed to answer the question: how accurate are SURPAS models’ predictions for patients undergoing TJA? We found substantial differences between outcome rates in TJA procedures compared with outcome rates in the original SURPAS model development dataset. The SURPAS models’ discrimination ability for TJA patients varied substantially across measured outcomes, ranging from no discriminatory capacity for venous thromboembolism to good discrimination for mortality. Measures of SURPAS models accuracy for the TJA procedures were all lower than those reported in the original development study. The results suggest that the universal SURPAS surgical risk models have diminished accuracy when used for TJA procedures compared with the original SURPAS dataset.
This study had several limitations. First, SURPAS models assessed composite complication endpoints by combining anatomically and biologically similar categories, such as infectious complications, cardiac/transfusion complications, and venous complications. Our research question focused on assessing the accuracy of the published SURPAS models, therefore we adhered to the composite endpoints as calculated in the original SURPAS study to maintain fidelity to the SURPAS models. However, some composite endpoints in this study may combine complications of differing importance to patients into a single outcome variable, leading to “qualitative heterogeneity” [4]. For example, transfusion events may be of relatively lower importance to patients, whereas myocardial infarction events represent a serious complication of high importance to patients. Interpretation of composite endpoints may also be problematic when event rates of the individual component complications substantially differ, leading to “quantitative heterogeneity” [4] (for example, 16% of TJA patients required transfusions and only 0.3% experienced a myocardial infarction). Consumers of prediction models with composite endpoints should evaluate both qualitative and quantitative heterogeneity and consider whether underlying pathophysiologic processes are similar for the component complication endpoints. When a composite endpoint is comprised of less-important components occurring much more frequently than high-importance components, the model results will be primarily driven by those less-important, more-frequent components.
In addition, although the ACS-NSQIP dataset includes a wide range of hospitals, most hospitals enrolled in the ACS-NSQIP database are large academic centers, so the results may not be generalizable to smaller rural hospitals. The analyses were further limited by the lack of a facility indicator in the ACS-NSQIP database to account for hospital-level clustering of patients. We were unable to determine surgical indications (for example, osteoarthritis or hip fracture) as this information is not available in the 2012 ACS-NSQIP Participant Use Data File.
Consumers of risk prediction models (physicians, patients, and administrators) should be cautious in interpreting the reported accuracy of models in the published literature, even when risk models are expertly and transparently developed, as is the case for SURPAS. It is critical for consumers to ask whether the input and outcome distributions of the development sample are similar to the patient population undergoing the procedure of interest [7]. The original validation of the SURPAS models included an evaluation of a wide range of procedures in specific specialties, including orthopaedic surgery [14]. However, as we found in these analyses, the input and outcome distributions and model accuracy for a broad specialty does not necessarily apply to all specific procedures in the specialty. Surgeons who use risk prediction models to guide preoperative discussions and decision making with patients should only apply models that have been validated for the specific, applicable procedures and patients. Healthcare administrators, payers, and organizations measuring risk-adjusted outcomes should use models tailored for the specific procedures and populations being measured.
Studies in other clinical areas have demonstrated that procedure-specific risk prediction models are more accurate for certain populations and outcome measures. An ACS-NSQIP analysis of postoperative outcomes after emergency colectomy in elderly patients found higher discriminating power for procedure-specific risk prediction models, leading the authors to conclude that customization of preoperative risk models for specific procedures may be necessary [12]. After the development of the Portsmouth Physiological and Operative Severity Score for the enUmeration of Mortality and morbidity, researchers determined that a colorectal (CR) procedure-specific model, the CR-Portsmouth Physiological and Operative Severity Score for the enUmeration of Mortality and morbidity, had improved accuracy for predicting mortality in patients undergoing colorectal surgery [18]. Procedure-specific models are recommended to improve the accuracy of predicting outcomes in certain cardiac procedures such as coronary artery bypass grafting and aortic valve replacement [8]. In postoperative pain management, procedure-specific pain prediction models are recommended because the analgesic effectiveness of medications differs substantially by surgical procedure [6, 11]. These studies across diverse specialties suggest that procedure-specific risk models are more accurate than universal models, and that further validation of the SURPAS model in additional procedure subsets would be informative.
One important challenge in the development of procedure-specific risk prediction models is choosing the appropriate limits for included procedures. Our study focused on TJA, which encompasses at least two sub-procedures, THA and TKA. Procedural coding systems provide a convenient and standardized approach to defining procedures; however, the two most commonly used procedure coding systems, CPT and the International Classification of Diseases, 10 Revision Procedure Coding system (ICD-10-PCS), substantially differ in their levels of specificity. CPT includes approximately 11,000 total procedure codes, while the ICD-10-PCS includes 87,000 codes. In the current study, we identified relevant procedures using a single CPT code for THA, while there are at least 18 ICD-10-PCS codes for THA that differentiate laterality, cemented versus uncemented procedures, and prosthetic materials (for example, metal-on-metal, metal-on-polyethylene, and ceramic-on-ceramic). Some researchers have proposed that patient circumstances should also be considered to further specify risk prediction model populations (for example, emergency procedures in elderly individuals) [12].
In conclusion, the results of this study suggest that the universal SURPAS surgical outcome prediction models have reduced accuracy for TJA procedures compared with the original model development dataset that included a broad range of procedures. The usefulness of SURPAS may be reconsidered if the robustness of the models to different surgical procedures cannot be established. With considerable variation in patient populations and outcomes across numerous surgical procedures, universal perioperative calculators may not produce accurate and reliable risk predictions for application to specific procedures. Surgeons and healthcare administrators should aim to use risk prediction models that were developed and validated in the specific procedures and patient subsets most relevant to the clinical decisions at hand. Future research should focus on testing existing universal risk prediction models for procedure-specific applications and the development of new procedure-specific prediction models [8, 10]. Development of new procedure-specific models should carefully consider which procedures will be included based on similarity of outcome event rates and prevalence of predictive variables across procedures. Larger datasets are necessary to perform procedure-specific analyses. In the current era of big data, these analyses are becoming more feasible.
Acknowledgments
We thank Hyrum Eddington for proofreading and editing the manuscript.
Footnotes
Each author certifies that neither he or she, nor any member of his or her immediate family, has funding or commercial associations (consultancies, stock ownership, equity interest, patent/licensing arrangements, etc.) that might pose a conflict of interest in connection with the submitted article.
The institution of one of the authors (AHSH) has received, during the study period, funding from a VA HSR & D Service grant (RCS14-232).
All ICMJE Conflict of Interest Forms for authors and Clinical Orthopaedics and Related Research® editors and board members are on file with the publication and can be viewed on request.
Each author certifies that his or her institution waived approval for the human protocol for this investigation and that all investigations were conducted in conformity with ethical principles of research.
This work was performed at Stanford–Surgery Policy Improvement Research and Education Center (S-SPIRE), Department of Surgery, Stanford University School of Medicine, Stanford, CA, USA.
References
- 1.American College of Surgeons National Surgical Quality Improvement Program. User guide for the 2012 ACS NSQIP participant use data file. October 2013. Available at: https://www.facs.org/∼/media/files/quality%20programs/nsqip/ug12.ashx. Accessed May 2, 2019.
- 2.Bilimoria KY, Liu Y, Paruch JL, Zhou L, Kmiecik TE, Ko CY, Cohen ME. Development and evaluation of the universal ACS NSQIP surgical risk calculator: a decision aid and informed consent tool for patients and surgeons. J Am Coll Surg. 2013;217:833-842. [DOI] [PMC free article] [PubMed] [Google Scholar]
- 3.DeLong ER, DeLong DM, Clarke-Pearson DL. Comparing the areas under two or more correlated receiver operating characteristic curves: a nonparametric approach. Biometrics. 1988;44:837-845. [PubMed] [Google Scholar]
- 4.Ferreira-González I, Permanyer-Miralda G, Busse JW, Bryant DM, Montori VM, Alonso-Coello P, Walter SD, Guyatt GH. Methodologic discussions for using and interpreting composite endpoints are limited, but still identify major concerns. J Clin Epidemiol. 2007;60:651-657. [DOI] [PubMed] [Google Scholar]
- 5.Fischer JE, Bachmann LM, Jaeschke R. A readers' guide to the interpretation of diagnostic test properties: clinical example of sepsis. Intensive Care Med. 2003;29:1043-1051. [DOI] [PubMed] [Google Scholar]
- 6.Gray A, Kehlet H, Bonnet F, Rawal N. Predicting postoperative analgesia outcomes: NNT league tables or procedure-specific evidence? Br J Anaesth. 2005;94:710-714. [DOI] [PubMed] [Google Scholar]
- 7.Harris AH. Three critical questions that should be asked before using prediction models for clinical decision support. JAMA Netw Open. 2019;2:e196661. [DOI] [PubMed] [Google Scholar]
- 8.Head SJ, Osnabrugge RL, Howell NJ, Freemantle N, Bridgewater B, Pagano D, Kappetein AP. A systematic review of risk prediction in adult cardiac surgery: considerations for future model development. Eur J Cardiothorac Surg. 2013;43:e121-e129. [DOI] [PubMed] [Google Scholar]
- 9.Hosmer DW, Lemeshow S. Applied Logistic Regression. New York, NY: John Wiley and Sons, Inc.; 2000. [Google Scholar]
- 10.Howell NJ, Head SJ, Freemantle N, van der Meulen TA, Senanayake E, Menon A, Kappetein AP, Pagano D. The new EuroSCORE II does not improve prediction of mortality in high-risk patients undergoing cardiac surgery: a collaborative analysis of two European centres. Eur J Cardiothorac Surg. 2013;44:1006-1011. [DOI] [PubMed] [Google Scholar]
- 11.Kehlet H, Wilkinson RC, Fischer HB, Camu F, Prospect Working Group. PROSPECT: evidence-based, procedure-specific postoperative pain management. Best Pract Res Clin Anaesthesiol. 2007;21:149-159. [DOI] [PubMed] [Google Scholar]
- 12.Kwok AC, Lipsitz SR, Bader AM, Gawande AA. Are targeted preoperative risk prediction tools more powerful? A test of models for emergency colon surgery in the very elderly. J Am Coll Surg. 2011;213:220-225. [DOI] [PubMed] [Google Scholar]
- 13.Lemeshow S, Hosmer DW., Jr A review of goodness of fit statistics for use in the development of logistic regression models. Am J Epidemiol. 1982;115:92-106. [DOI] [PubMed] [Google Scholar]
- 14.Meguid RA, Bronsert MR, Juarez-Colunga E, Hammermeister KE, Henderson WG. Surgical risk preoperative assessment system (SURPAS). Ann Surg. 2016;264:10-22. [DOI] [PubMed] [Google Scholar]
- 15.Saleh A, Faour M, Sultan AA, Brigati DP, Molloy RM, Mont MA. Emergency department visits within thirty days of discharge after primary total hip arthroplasty: a hidden quality measure. J Arthroplasty. 2019;34(1):20-6. [DOI] [PubMed] [Google Scholar]
- 16.Steyerberg EW, Vickers AJ, Cook NR, Gerds T, Gonen M, Obuchowski N, Pencina MJ, Kattan MW. Assessing the performance of prediction models: a framework for some traditional and novel measures. Epidemiology. 2010;21:128-138. [DOI] [PMC free article] [PubMed] [Google Scholar]
- 17.Stones J, Yates D. Clinical risk assessment tools in anaesthesia. BJA Education. 2019;19:47-53. [DOI] [PMC free article] [PubMed] [Google Scholar]
- 18.Tekkis PP, Prytherch DR, Kocher HM, Senapati A, Poloniecki JD, Stamatakis JD, Windsor AC. Development of a dedicated risk‐adjustment scoring system for colorectal surgery (colorectal POSSUM). Br J Surg. 2004;91:1174-1182. [DOI] [PubMed] [Google Scholar]
- 19.Trimba R, Laughlin RT, Krishnamurthy A, Ross JS, Fox JP. Hospital-based acute care after total hip and knee arthroplasty: implications for quality measurement. J Arthroplasty. 2016;31:573-578. [DOI] [PubMed] [Google Scholar]
- 20.Williams SN, Wolford ML, Bercovitz A. Hospitalization for total knee replacement among inpatients aged 45 and over: United States, 2000-2010 [NCHS Data Brief No. 210]. September 2015. Available at: https://www.cdc.gov/nchs/data/databriefs/db210.pdf. Accessed May 2, 2019. [PubMed] [Google Scholar]
- 21.Wolford ML, Palso K, Bercovitz A. Hospitalization for total hip replacement among inpatients aged 45 and over: United States, 2000-2010 [NCHS Data Brief No. 186]. February 2015. Available at: https://www.cdc.gov/nchs/data/databriefs/db186.pdf. Accessed May 2, 2019. [PubMed] [Google Scholar]


