Abstract
The unbiased selection of peptide precursors makes data-independent acquisition (DIA) an advantageous alternative to data-dependent acquisition (DDA) for discovery proteomics, but traditional multiplexed quantification approaches employing mass difference labeling or isobaric tagging are incompatible with DIA. Here, we describe a strategy that permits multiplexed quantification by DIA using mass defect-based N,N-dimethyl leucine (mdDiLeu) tags and high-resolution tandem mass spectrometry (MS2) analysis. Millidalton mass differences between mdDiLeu isotopologues produce fragment ion multiplet peaks separated in mass by as little as 5.8 mDa, enabling up to 4-plex quantification in DIA MS2 spectra. Quantitative analysis of yeast samples displayed comparable accuracy and precision for MS2-based DIA and MS1-based DDA methods. Multiplexed DIA analysis of cerebrospinal fluid revealed the dynamic proteome changes in Alzheimer’s disease, demonstrating its utility for discovery of potential clinical biomarkers. We show that the mdDiLeu tagging approach for multiplexed DIA is a viable methodology for investigating proteome changes, particularly for low-abundance proteins, in different biological matrices.
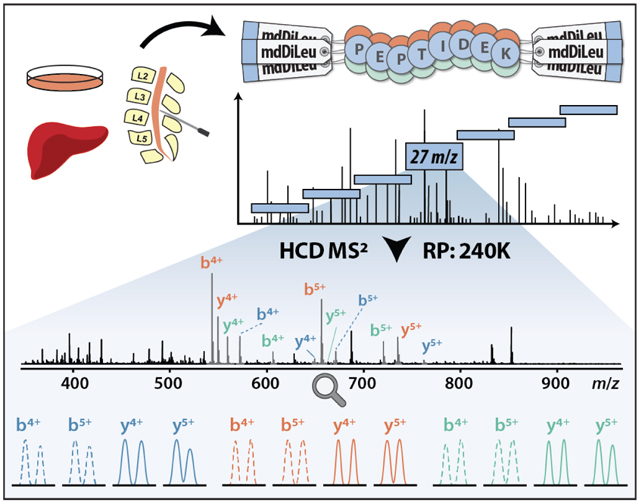
Graphicla Abstract
INTRODUCTION
In discovery proteomics, the most widely used instrument method is data-dependent acquisition (DDA), in which precursor ions detected in a survey scan (MS1) are individually selected for subsequent tandem mass spectrometry analysis (MS2).1,2 The major bottleneck of DDA is its favor towards high-abundance species, leading to stochastic and irreproducible precursor selection for fragmentation.3,4 The dominance of highly abundant species across the full mass range limits detection of low-abundance proteins by standard shotgun proteomics methods.5 Alternatively, data-independent acquisition (DIA) does not directly select precursor ions in MS1 scan, instead fragmenting all ionized precursors within predefined isolation windows, yielding unbiased MS2 spectra for peptide identification.6–9 This provides DIA methods with improved reproducibility, greater sensitivity, and fewer missing values compared to DDA, all of which are especially meaningful for large-scale analysis of complex clinical samples (e.g., plasma and cerebrospinal fluid) that contain a wide dynamic range of proteins.
To leverage the unbiased sampling of DIA, it is desirable to further expand its application to multiplexed quantitative proteomics by coupling DIA with stable isotope labeling, but traditional approaches that rely on either mass difference or isobaric tags for quantification by DDA are unsuitable for DIA. Mass difference labels introduce mass additions to precursor ions to permit relative quantification in MS1 spectra,10–12 but the multi-dalton spacing between the labeled precursors can isolate the multiple isotopic clusters into different DIA windows, preventing subsequent co-isolation and quantification. Isobaric tags (e.g., TMT, iTRAQ) introduce a single mass addition at the MS1 level and yield discrete reporter ions in the low mass range of MS2 spectra for relative quantification,13 but co-fragmentation of multiple precursors within the wide DIA isolation windows yields ambiguous reporter ion information, from which the relative abundances of specific peptides cannot be determined. Modern quantitative approaches that achieve multiplexing through mass defect-based neutron encoding (NeuCode) to impart millidalton mass differences have been shown to be compatible with DIA analysis. The NeuCode SILAC strategy metabolically incorporates millidalton mass differences into isotopologues of lysine, enabling multiplex quantification in DIA by high-resolution MS/MS analysis.14,15 Another approach, termed MdFDIA, permits 4-plex quantification by combining NeuCode SILAC with dimethyl labeling.16 Both methods have successfully coupled isotope labeling with DIA, but the dependence on metabolic labeling restricts their application primarily to cell culture. The NeuCode signatures embedded into isotopologues of lysine require specific Lys-C digestion to generate fragments containing a lysine residue for quantification, leading to a decrease of the number of identified proteins compared to trypsin digestion.17,18 An amine-reactive chemical tag that labels both lysine side chains and peptide N-termini would address these limitations by providing sample and enzyme flexibility.
Custom 12-plex isobaric N,N-dimethylated leucine (DiLeu) and duplex mass defect-based DiLeu (mdDiLeu) tags have been developed for protein and metabolite quantification using DDA.19–21 Here, we describe the use of mdDiLeu for DIA analysis to increase the analytical throughput of DIA as an MS2-centric quantification method. Heavy stable isotopes (13C, 2H, 15N, and 18O) are incorporated into the mdDiLeu tag structure (Figure 1A) to impart minimum mass differences of 18.0, 8.3, and 5.8 mDa between neighboring channels to permit duplex, triplex, and 4-plex quantification, respectively (Figure 1B). The mdDiLeu mass signatures of product ions are readily resolvable by high-resolution MS/MS analysis, enabling multiplexed quantification without increased spectral complexity in the survey scan. Each set of mdDiLeu tags were used to label yeast protein tryptic digest samples to demonstrate the feasibility of multiplexed quantification by DIA on high-resolution, accurate mass instrumentation. We further applied this quantification strategy to evaluate the proteomic changes in cerebrospinal fluid (CSF) of Alzheimer’s disease (AD) patients and healthy controls.
Figure 1.
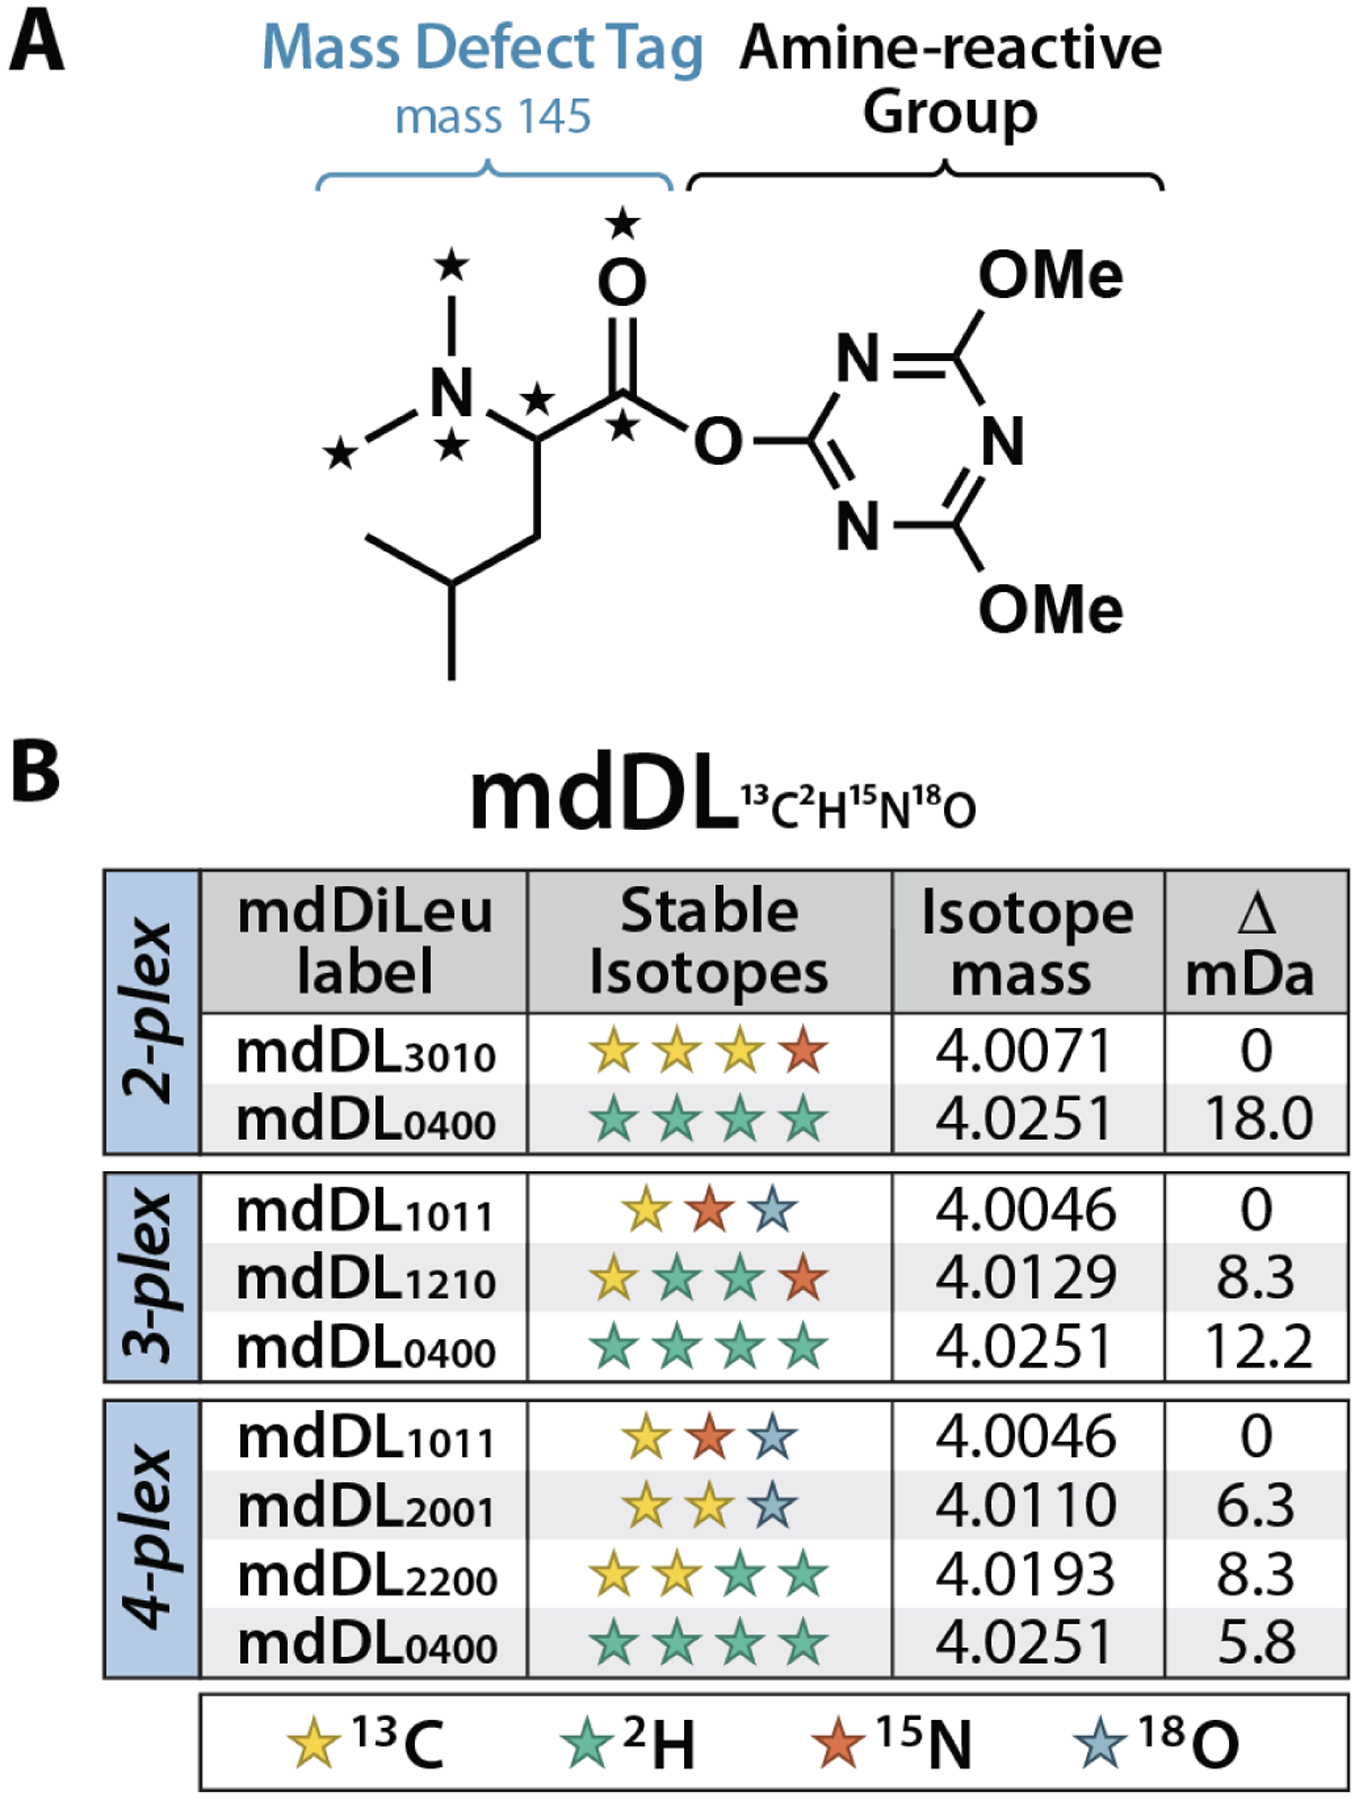
Structure and isotopic configurations of multiplex mdDiLeu tags. (A) The mdDiLeu labeling reagent consists of a dimethyl leucine mass defect tag (Δm = +145 Da) and an amine-reactive triazine ester group. Stars indicate positions of isotopic substitution. (B) Four heavy stable isotopes (13C, 2H, 15N, 18O) are incorporated into the mass defect tag in differing configurations to create 2-, 3-, and 4-plex sets with respective minimum mass differences of 18.0, 8.3, and 5.8 mDa. Each tag is notated as mdDL#13C #2H #15N #18O.
MATERIALS AND METHODS
Chemicals.
All isotopic reagents used for the synthesis of mdDiLeu labels were purchased from Isotec (Miamisburg, OH). ACS grade and Optima LC/MS grade solvents were purchased from Fisher Scientific (Pittsburgh, PA). MS grade trypsin/Lys-C mix and yeast protein extract were purchased from Promega (Madison, WI). All other chemicals were purchased from Sigma-Aldrich (St. Louis, MO).
Yeast Protein Extract Digestion.
Saccharomyces cerevisiae protein extracts were digested by trypsin/Lys-C mix according to the manufacturer’s protocol and desalted using SepPak C18 cartridges (Waters, Milford, MA). Digested peptides were dried in vacuo prior to mdDiLeu labeling.
Cerebrospinal Fluid Sample Preparation.
Three cognition-normal individuals at late middle age and three individuals at AD dementia enrolled in Wisconsin Alzheimer’s Disease Research Center (ADRC) participated in this study. A comprehensive neuropsychological test battery, amyloid-beta accumulation on 11C Pittsburgh Compound B positron emission tomography (PET) imaging, and hypometabolism on 18F Fluoro-2-deoxy-glucose (FDG)-PET were used to classify participants as cognitively normal or AD dementia.22,23 The University of Wisconsin Institutional Review Board approved all study procedures. All participants provided signed informed consent.
0.5 mL of CSF from each subject was collected by lumbar puncture and centrifuged at 2000 xg for 10 min. The supernatant was dried in vacuum centrifugation with a SpeedVac concentrator and reconstituted in 100 μL of 8M urea (50mM Tris-HCl, pH 8). Protein concentration was determined by bicinchoninic acid (BCA) protein assay (Thermo Scientific Pierce, Rockford, IL). 50 μg CSF protein from each sample was reduced by 5mM dithiothreitol (DTT), alkylated by 15 mM iodoacetamide. The protein mixture was diluted with 50mM Tris-HCl (pH 8) to a final 1M urea prior to trypsin/Lys-C digestion at a 50:1 ratio (protein:enzyme) by incubating at 37 °C for 18 h. The digestion reaction was quenched by acidification with 10% trifluoroacetic acid (TFA) to pH 3, followed by desalting with Bond Elut OMIX C18 pipette tips (Agilent Technologies, Santa Clara, CA) according to the following procedure: wash with 3×100 μL of acetonitrile, equilibrate with 3×100 μL of 0.1% TFA, load total volume of digest, wash with 3×100 μL of 0.1% TFA, and elute with 100 μL of 50% acetonitrile in 0.1% TFA and 100 μL of 80% acetonitrile in 0.1% TFA. Each sample was dried down in vacuo.
Protein Digest Labeling.
mdDiLeu tags were synthesized as described previously.19 Each tag was combined with 50 μL activation buffer containing 0.7x molar ratio amounts of 4-(4,6-dimethoxy-1,3,5-triazin-2-yl)-4-methylmorpholinium tetra-fluoroborate (DMTMM) and N-methylmorpholine (NMM) in anhydrous N,N-dimethylformamide (DMF) and incubated at ambient temperature for 45 min. Immediately following activation, tags were added to protein digest samples in 0.5M triethylammonium bicarbonate buffer at a tag to protein digest ratio of 20:1 (w/w), DMF was added to an organic:aqueous solution ratio of 75:25, and the labeling reaction was proceeded for one hour. The reaction was quenched by addition of hydroxylamine to a concentration of 0.25%. mdDiLeu-labeled yeast peptides were combined in known ratios by concentration (1:1, 1:2, 1:5, 1:10 for 2-plex, 1:1:1 and 1:5:10 for 3-plex, 1:1:1:1 and 1:2:5:10 for 4-plex). 2-plex mdDiLeu-labeled CSF peptides were combined in unit ratio. Pooled samples were cleaned by SCX SPE and desalted by C18 SPE.
NanoLC-MS Acquisition.
Samples were analyzed by nanoLC-MS/MS using a Dionex Ultimate 3000 UPLC system coupled to a Thermo Scientific Orbitrap Fusion Lumos mass spectrometer. Labeled peptide samples were dried in vacuo and dissolved in 3% acetonitrile, 0.1% formic acid to make a final concentration of 0.5 μg/μL. 1 μg of labeled peptides were loaded onto a 75 μm inner diameter microcapillary column fabricated with an integrated emitter tip and packed with 15 cm of BEH C18 particles (1.7 μm, 130Å, Waters). Mobile phase A was composed of water and 0.1% formic acid. Mobile phase B was composed of acetonitrile and 0.1% formic acid. Separation was performed using a gradient of 3–35% solvent B in 92 min, 35–75% solvent B in 10 min, 75–95% solvent B in 10 min, followed by a equilibration step of 3% solvent B for 15 min at a flow rate of 300 nL/min. Data acquisition was performed with an ion spray voltage of 2000 V and a ion transfer tube temperature of 300 °C.
The instrument method for 2-plex mdDiLeu MS1 quantification by DDA consisted of a survey scan (450–950 m/z) acquired in the Orbitrap at a resolving power (RP) of 240K. The most intense precursors were selected for rapid scan high-energy C-trap dissociation (HCD) ITMS2 analysis in top speed mode with a cycle time of 4 s, an isolation width of 1.0 Da, a normalized collision energy (NCE) of 30, an AGC target of 1 × 10⁴, and a maximum injection time of 35 ms. MS2 analysis was performed at low resolution in the ion trap in order to measure product ions as peaks with single m/z values rather than as multiplets. DIA-based MS2 quantification relies on a spectral library constructed from a preceding DDA analysis. For the DDA analysis, survey scans were acquired at RP 60K and the top 20 precursors were selected for HCD FTMS2 analysis (NCE 30) at RP 15K. For the following DIA analysis, acquisition alternated between a survey scan (450–950 m/z for yeast; 400–1200 m/z for CSF samples) in the Orbitrap at RP 60K and a series of FTMS2 scans at RP 240K for 2-plex mdDiLeu and at RP 500K for 3- and 4-plex mdDiLeu experiments to measure product ions as resolved multiplets. Variable DIA isolation windows were specified based on the sample complexity: the scan range for yeast peptides consisted of an isolation width of 27 m/z for 450–850 m/z and isolation width of 52 m/z for 850–950 m/z; the scan range for CSF peptides consisted of an isolation width of 52 m/z for 400–900 m/z and isolation width of 102 m/z for 900–1200 m/z. An overlapping isolation window of 2 Th was used for optimal ion transmission efficiency of the entire isotopic pattern,8 particularly for precursor ions at the edge of an isolation window (e.g. 400–427 m/z, 425–452 m/z, 450–477 m/z, 475–502 m/z). Normalized stepped collision energy was set to 22, 27, and 32.
Data Analysis.
Protein identification and quantification were performed using MaxQuant (1.5.6.5) for the DDA-based MS1 quantification strategy.24 Raw mass spectra files were searched against the UniProt Saccharomyces cerevisiae reviewed database (2018–04) using Andromeda. mdDL3010 (+145.1225 Da) and mdDL0400 (+145.1405 Da) were configured as light and heavy isotope labels. Static modifications consisted of carbamidomethylation of cysteine residues and variable modification included oxidation of methionine (+15.995 Da) and acetylation (+42.011 Da) of protein N-termini. The mass tolerances for the first and main peptide searches were 5 and 3 ppm, respectively.
To construct the spectral library, peptide and protein identification were performed using Proteome Discoverer (PD; version 2.1, Thermo Scientific). Raw mass spectra files were searched against the UniProt Saccharomyces cerevisiae or Homo sapiens reviewed database (2018–04) using Sequest HT. The error tolerance was 25 ppm for precursor mass and 0.02 Da for fragment mass. Static modifications consisted of carbamidomethylation of cysteine residues (+57.02146 Da) and mdDiLeu tags (+145.1225 Da [mdDL3010] and +145.1405 Da [mdDL0400] for 2-plex mdDiLeu; +145.1200 Da [mdDL1011], +145.1283 Da [mdDL1210], and +145.1405 Da [mdDL0400] for 3-plex mdDiLeu; +145.1200 Da [mdDL1011], +145.1263 Da [mdDL2001], +145.1346 Da [mdDL2200], and +145.1405 Da [mdDL0400] for 4-plex mdDiLeu) on peptide N-termini and lysine (K) residues. Dynamic modifications consisted of oxidation of methionine (+15.995 Da) and acetylation (+42.011 Da) of protein N-termini. Peptide spectral matches (PSMs) were validated based on q-values to 1% FDR using percolator and further filtered at 1% protein FDR.
MS2 quantification of peptides identified by PD was performed using Skyline (4.2). The corresponding MSF files from PD containing the identified proteins were imported into Skyline to build the spectral library. The light channel of each label scheme was specified as a structural modification on peptide N-termini and lysine residues while the heavy channel was categorized as an isotope modification. To confirm the association between the peak group from DIA analysis and target peptide in the spectral library, the minimum relative intensity correlation of fragment ion (dotp) was set to 0.8, and a minimum of four transitions was required for each precursor. The calculation of q-values was performed using the mProphet algorithm in Skyline (Supplemental Note). Peptide quantification was performed using the average of intensities of the four transitions and the protein abundance ratio was determined using the median of peptide ratios. Gene ontology enrichment analysis was performed using the Database for Annotation, Visualization and Integrated Discovery (DAVID).
RESULTS AND DISCUSSION
mdDiLeu Tagging for Data-Independent Acquisition
The mdDiLeu tags selectively label peptide N-termini and lysine side chains through an amine-reactive triazine ester group. Unique combinations of four heavy stable isotopes in the dimethyl leucine tag structure yield subtle mass differences between mdDiLeu tag isotopologues (Figure S1). The mass difference between the light (mdDL3010) and heavy (mdDL0400) channels of the 2-plex set is 18.0 mDa (Figure 1B), which is distinguishable at a resolving power of 240K (at m/z 200), as demonstrated in a previous approach.25 In this work, 3-plex (mdDL1011, mdDL1210, and mdDL0400) and 4-plex (mdDL1011, mdDL2001, mdDL2200, and mdDL0400) sets with respective minimum mass differences of 8.3 and 5.8 mDa are also employed (Figure 1B). Upon HCD fragmentation of mdDiLeu-labeled peptides, those containing a C-terminal lysine residue generate quantifiable fragment ion multiplets for both b- and y-ions, and those containing a C-terminal arginine or other residue generate quantifiable multiplets for b-ions. This is a notable advantage for the mdDiLeu chemical labeling approach over current metabolic options that produce only quantifiable y-ions for all peptides, as the greater number of quantifiable fragment ions can increase statistical confidence of peptide quantification.
To evaluate the feasibility of employing mdDiLeu for multiplexed quantification using fragment ions, we calculated the percentage of b- and y-type fragment ions containing mdDiLeu tags that can be resolved at full width at 10% maximum peak height (FWTM) at Orbitrap resolving powers of 120K, 240K, and 500K in order to determine suitable resolving powers for analysis of tryptic peptide samples labeled with 2-, 3-, or 4-plex mdDiLeu tags . The calculations, previously described by Coon and co-workers,14,15 considered the minimum mDa mass differences between channels for each multiplex set and were made using a library of detected b and y-ions (z: 1+, 2+) from ~45000 HCD MS2 spectra of mdDiLeu-labeled yeast tryptic peptides identified by DDA analysis on the Orbitrap Fusion Lumos mass spectrometer. This dataset included ~7400 unique peptide sequences containing a C-terminal lysine residue, from which b- and y- ions containing a single mdDiLeu tag located on either the peptide N-terminus or lysine side chain were considered, and ~6200 unique peptide sequences containing a C-terminal arginine residue, from which b-ions containing a single mdDiLeu tag located on the peptide N-terminus were considered. The distributions of sequence lengths of unique peptide sequences and identified fragment ions (by number of amino acid residues) are summarized in Figure S2A–B. The percentages of b- and y-type fragment ion multiplets that can be resolved (FWTM) at RP 120K, 240K, and 500K are plotted in Figure 2. Analysis of duplex mdDiLeu-labeled tryptic peptides may be performed sufficiently at RP 120K with over 83% of ions containing up to 4 amino acid residues (8 doublets) resolved, while RP 240K permits resolving over 96% of ions up to 7 residues (14 doublets) for increased statistical condifence of quantification. Analysis of triplex mdDiLeu-labeled tryptic peptides is best performed at 500K to resolve over 91% of ions containing up to 7 residues (14 triplets), and analysis of 4-plex mdDiLeu-labeled tryptic peptides at RP 500K permits resolving over 94% of ions containing up to 5 residues (10 quadruplets). From the DDA dataset of mdDiLeu-labeled yeast tryptic peptides, 89% of all fragment ions used for sequence identification contain 8 or fewer residues, and quantification of peptides does not require that all fragment multiplets are resolved. The cumulative percentages of identified fragment ion multiplets that are resolvable for 2-, 3-, and 4-plex mdDiLeu-labeled tryptic peptides at RP 120K, 240K, and 500K are summarized for the DDA dataset in Figure S2C.
Figure 2.
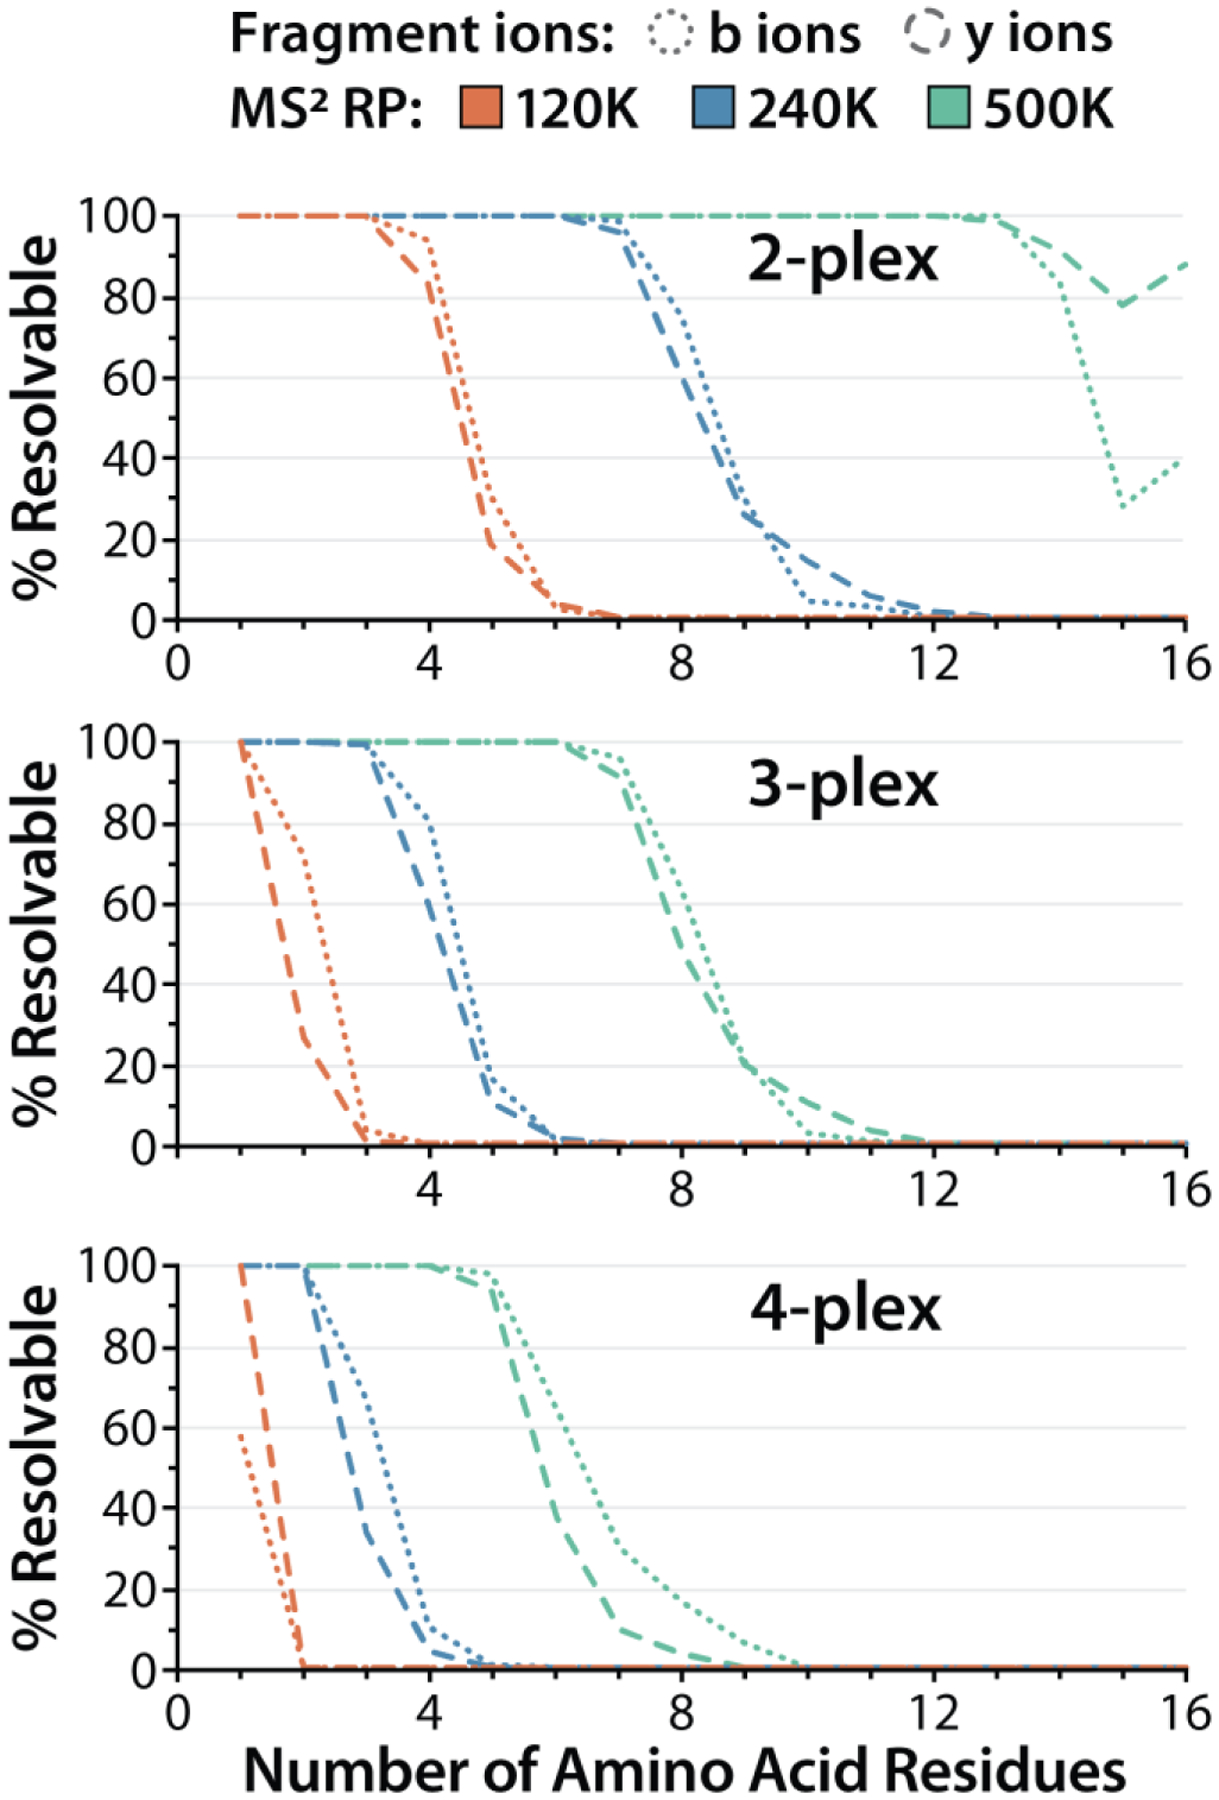
Theoretical calculations predicting the percentages of multiplex mdDiLeu-labeled tryptic peptide fragment ions (b- and y-type, z:1+ and 2+) that are resolved and quantifiable in HCD MS2 spectra acquired at Orbitrap resolving powers of 120K, 240K, and 500K (full width at 10% maximum peak height). Ion series position (x-axis) indicates the number of amino acid residues that constitutes the fragment ion.
To test the practical utility of mdDiLeu tags for multiplexed quantification by DIA, we performed proof-of-principle experiments by labeling yeast protein digest samples with 2-plex mdDiLeu tags (mdDL3010 and mdDL0400), combining at 1:1 ratio, and analyzing by LC-MS2 on an Orbitrap Fusion Lumos system. The DIA scan sequence consisted of an FTMS survey scan with the range of 450–950 m/z and subsequent HCD FTMS2 scans that repeatedly cycled through 18 consecutive isolation windows (window size of 27 m/z for 450–850 m/z and 52 m/z for 850–950 m/z). Through the generation of fragment ion extracted ion chromatograms (XICs) in Skyline,26,27 only peptides containing at least four fragment ions with each ion showing a high correlation to the spectral library (dotp >0.8) were considered for quantification. Example spectra from the mdDiLeu-based multiplexed DIA anslysis are shown in Figure 3. Three precursor ions at m/z 478.3000, 496.6307, and 498.3128 for peptides QLNAVLEEVK3+, DPANLPWGSLK3+, and LEFANLTPGLK3+ coeluted over a 40 s retention time window and cofragmented in the same isolation window (475–502 m/z). The mdDiLeu doublets of both y ions and b ions are baseline resolvable for quantification consistent with the 1:1 mixing ratio. LC-MS2 analyses were performed at different resolving powers to evaluate the resolution of peak pairs for accurate MS2-centric protein quantification and determine the compromise in numbers of identified proteins resulting from increased MS2 scan times at higher resolving powers. Following the filtering of all fragment ions, DIA analysis resulted in quantification of 4116, 3442, and 1722 peptides corresponding to 1246, 1092, and 689 proteins at RP 120K, 240K, and 500K, respectively. The median ratios of all resolvable fragment ions were 0.951, 0.996, and 1.046 for RP 120K, 240K, and 500K, respectively, suggesting that analysis at RP 240K yields the greatest quantitative accuracy (Figure S3).
Figure 3.
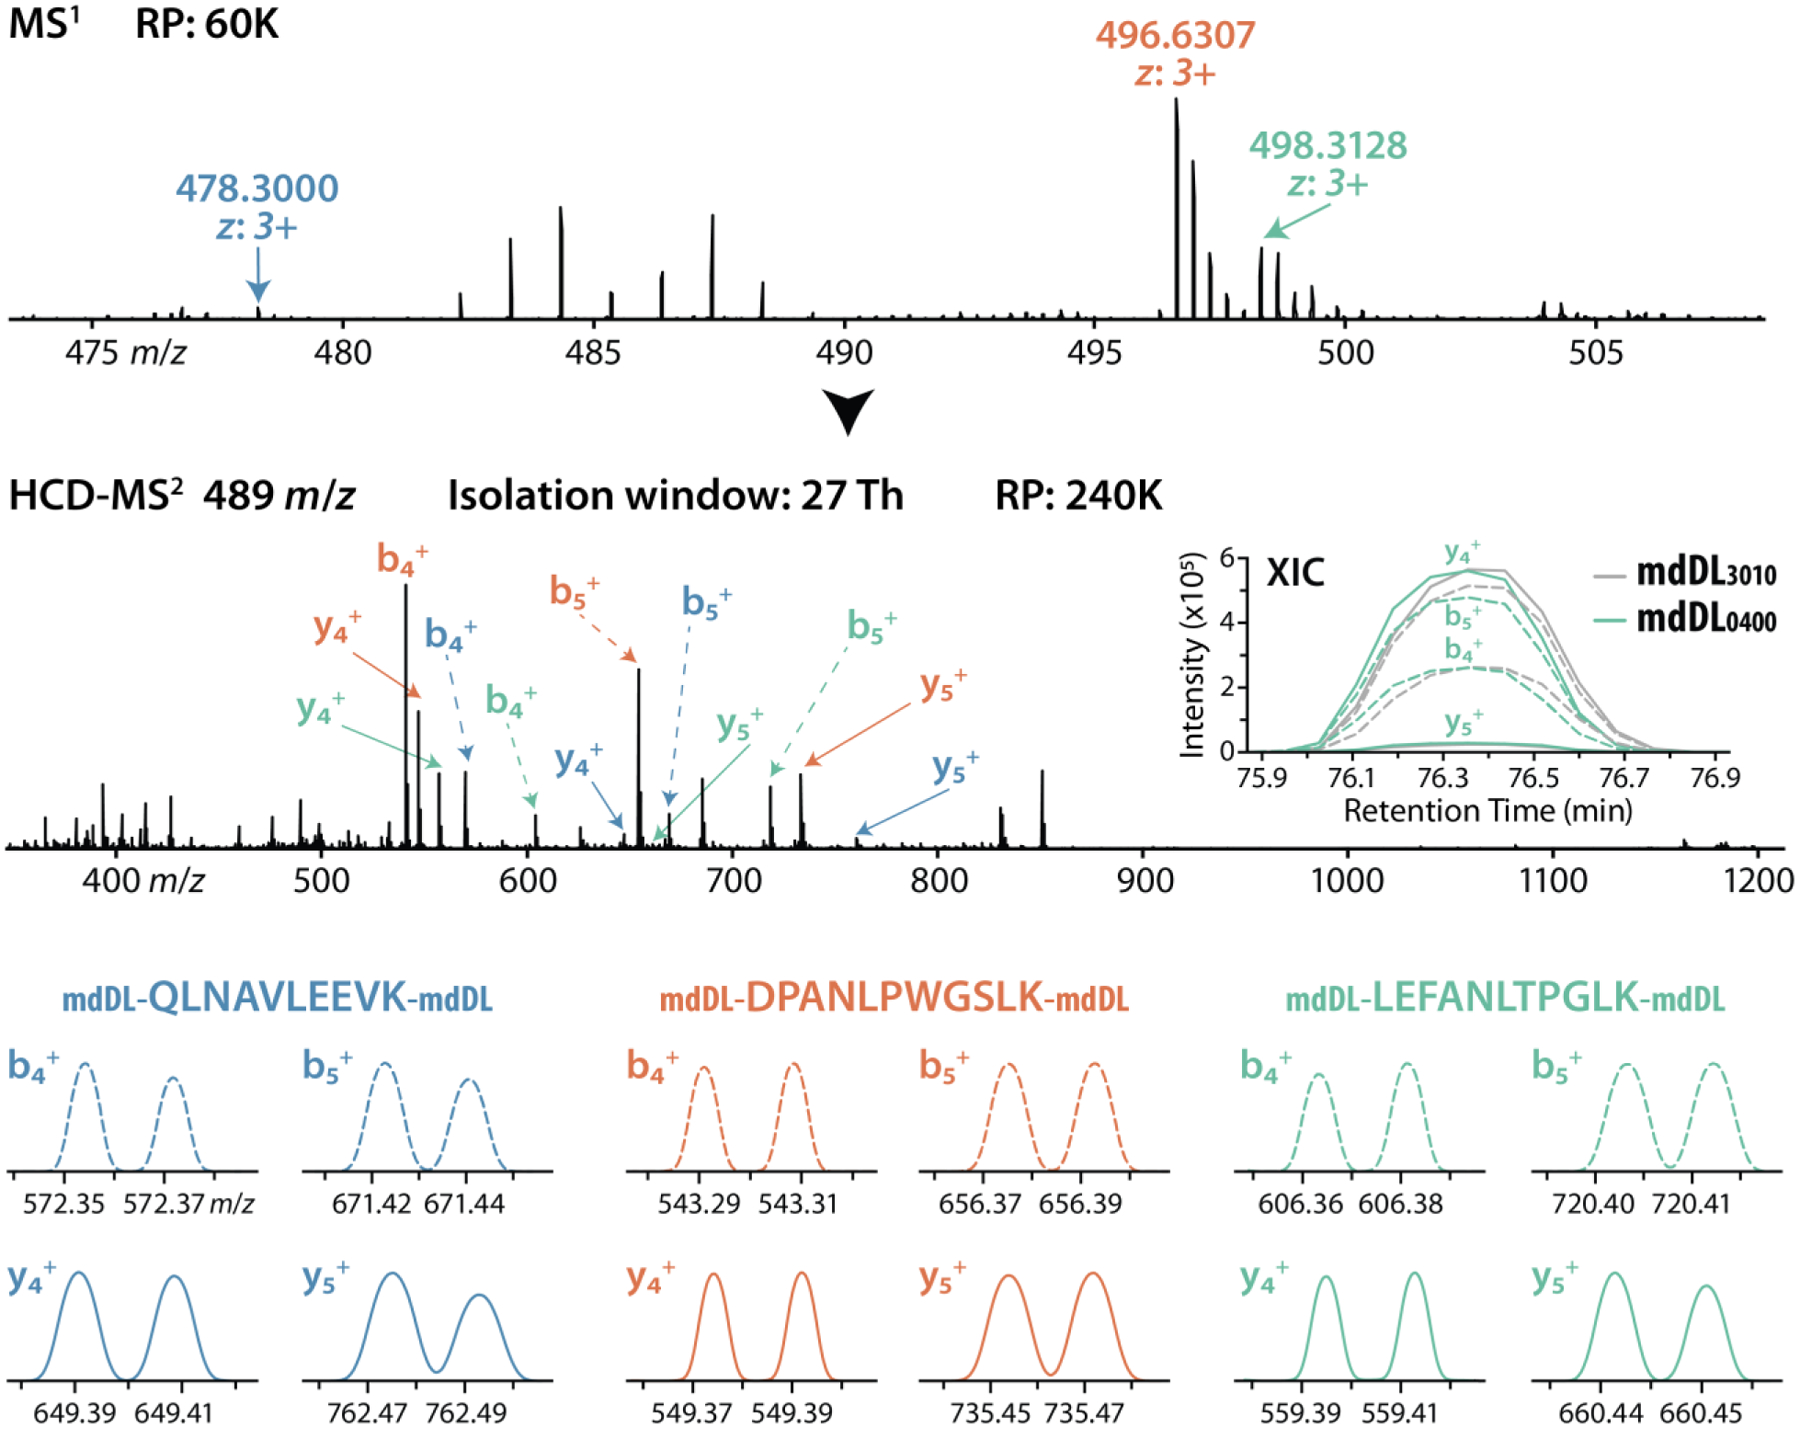
Example spectra of 2-plex mdDiLeu-labeled yeast tryptic peptides: QLNAVLEEVK3+, DPANLPWGSLK3+, and LEFANLTPGLK3+ coeluted over 40s retention time window and were cofragmented within the same isolation window (27 m/z width centered at m/z 489; RP 240K). Extracted ion chromatograms (XICs) of MS2 fragment ions for peptide quantification (LEFANLTPGLK3+) are shown.
Quantification Performance of mdDiLeu
To evaluate quantitative performance, DIA-based MS2-centric quantification was compared with DDA-based MS1-centric quantification strategy on the basis of the number of quantifiable proteins and quantification accuracy and precision using 2-plex mdDiLeu-labeled yeast tryptic peptides mixed at ratios of 1:1 and 10:1. To discern the embedded mdDiLeu doublets for MS1 quantification by DDA, the analysis employs a high-resolution (240K) MS1 scan acquired in the Orbitrap and subsequent low-resolution MS2 spectra acquired in the ion trap. Following triplicate analyses of 1:1 mixed 2-plex mdDiLeu-labeled yeast peptide samples, 652 (51%) and 1066 (67%) proteins were quantified across technical replicates for the MS1 quantification by DDA method and the MS2 quantification by DIA method, respectively. Among them, 1036 (57%) quantified proteins were shared between the MS1 DDA and MS2 DIA methods (Figure 4A). The distribution of standard deviations across the log2-transformed peptide ratios were obtained for the MS1 DDA and MS2 DIA analyses. Given that the number of peptides quantified by the MS2 DIA method (3442) is nearly three times that of the MS1 DDA method (1200), there are more outliers in the MS2 DIA method, but the majority (76.9%) is still within a standard deviation <0.5 (Figure S4). 1015 and 1864 peptides were quantified by MS1 DDA and MS2 DIA with coefficient of variation <20% among triplicated analyses, respectively (Figure S5). These results demonstrate substantially greater reproducibility and more quantifiable proteins for the MS2 DIA strategy compared to the MS1 DDA strategy. For the 1:1 mixture, the median ratios for quantified peptides were 0.95 and 1.03 with standard deviations of 0.10 and 0.21 for MS1 DDA and MS2 DIA, respectively (Figure 4B). For the 10:1 mixture, the median peptide ratios were 9.55 and 10.78 with standard deviations of 3.35 and 2.90 for MS1 DDA and MS2 DIA, respectively. The median ratios for quantified proteins were also comparable between methods with 0.95 vs. 1.01 and 9.63 vs. 10.48 for the 1:1 and 10:1 mixtures, respectively. These results display the high quantification accuracy and precision of both DDA and DIA quantification methods using mdDiLeu tagging.
Figure 4.
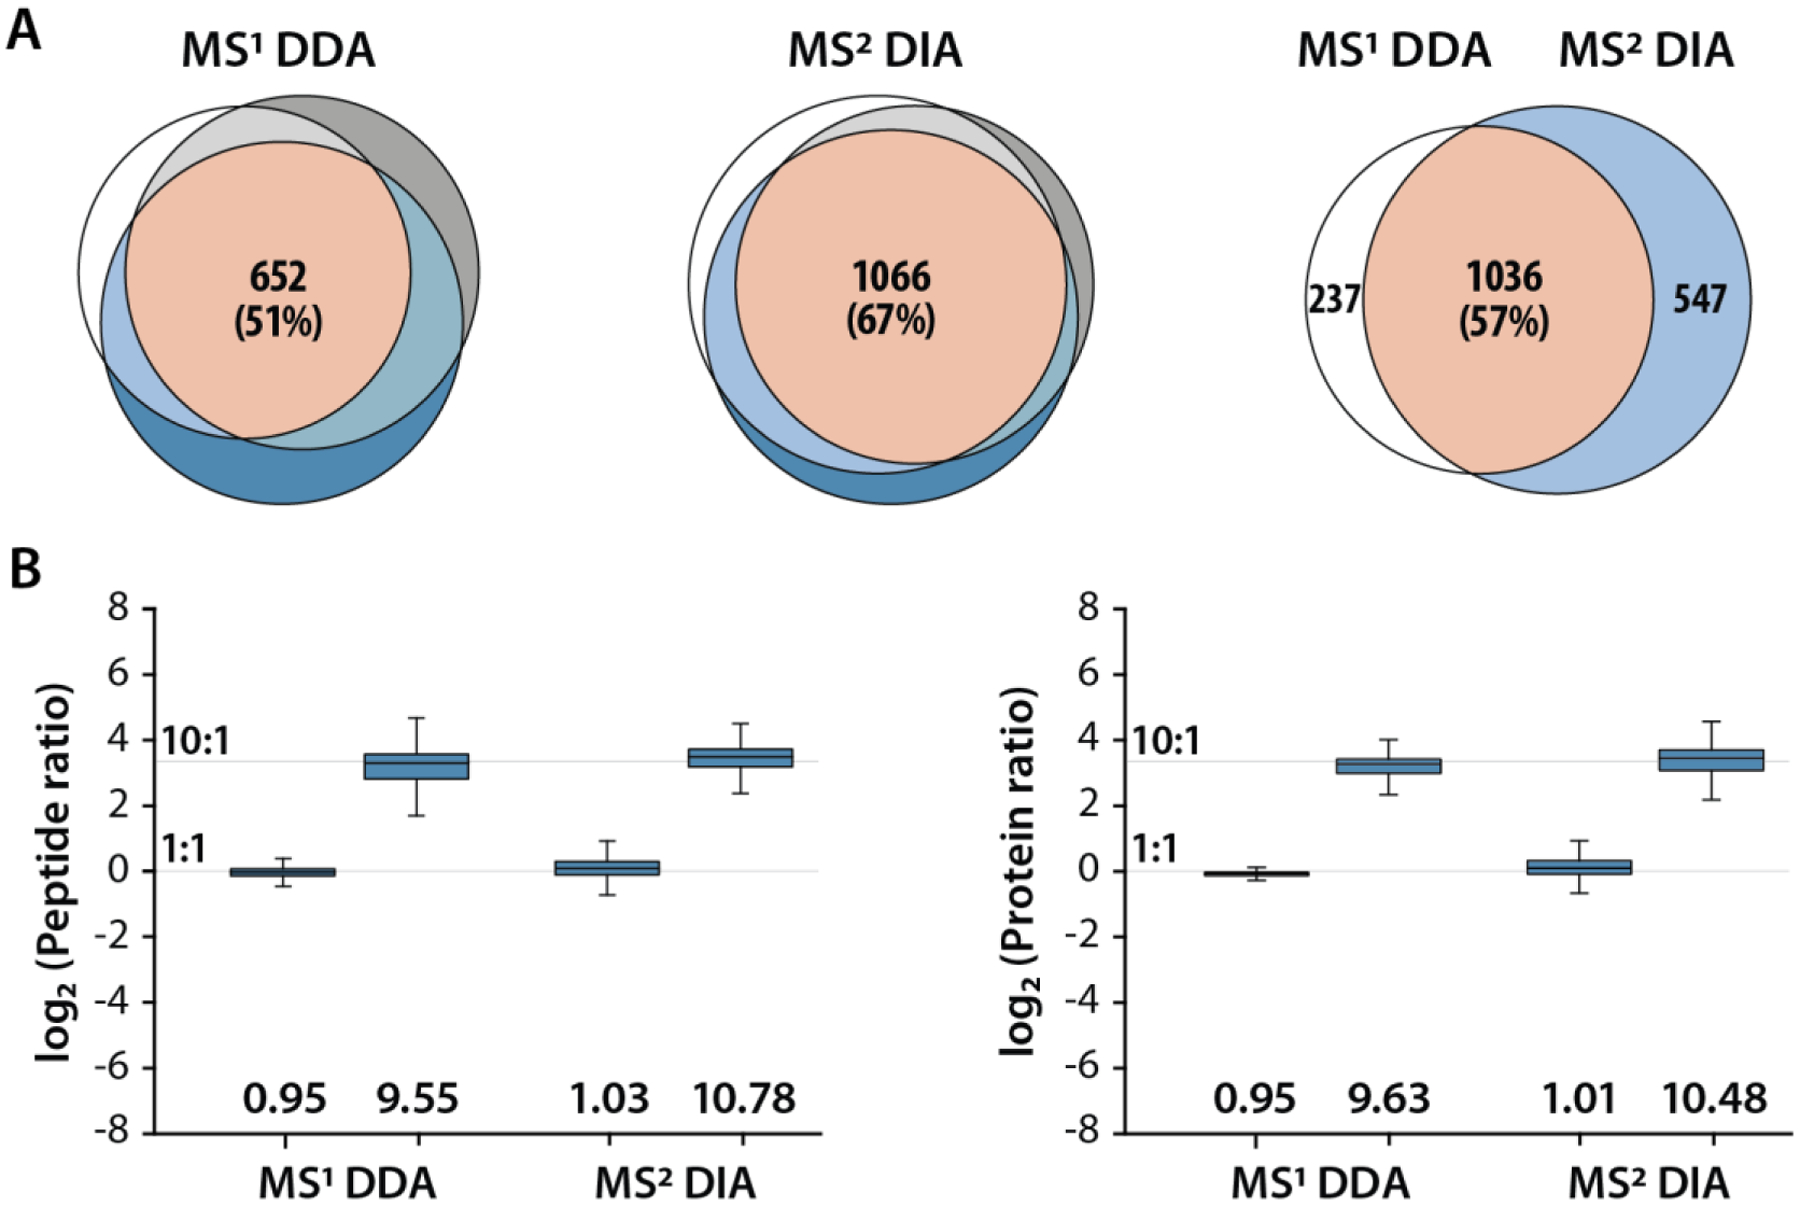
(A) Yeast tryptic peptides labeled with 2-plex mdDiLeu tags were combined at a ratio of 1:1 (mdDL3010:mdDL0400) and analyzed at RP 240K. The overlap of quantified proteins across triplicate analyses are highlighted for the MS1 quantification by DDA method (left) and the MS2 quantification by DIA method (middle). The total number of unique and shared quantified proteins between MS1 DDA and MS2 DIA methods are shown on the right. (B) Measured ratios of peptides and proteins quantified by MS1 DDA and MS2 DIA analyses (1:1 and 10:1 ratios). Median peptide and protein ratios are provided below the boxplots, respectively. Boxplots demarcate the median (line), the 25th and 75th percentile (interquartile range; box), and 1.5 times the interquartile range (whiskers).
Following the evaluation of 2-plex mdDiLeu tags, we prepared 3-plex and 4-plex mdDiLeu-labeled yeast digest samples and acquired them using the DIA method at RP 500K. The 3-plex mdDiLeu samples were combined at 1:1:1 and 1:5:10 ratios between light:medium:heavy channels (mdDL1011:mdDL1210:mdDL0400). A representative MS2 spectrum of peptide TASGNIIPSSTGAAK2+ confirms that RP 500K was sufficient for baseline resolution and quantification of the triplet peaks detected for four singly charged fragments ions (b5+, y5+, y6+, and b6+) (Figure 5A). Median ratios for proteins quantified in the 1:1:1 sample were 1.19 and 1.16 with standard deviations of 0.37 and 0.21 for medium:light and heavy:medium, respectively; for proteins quantified in the 1:5:10 sample, median ratios were 6.07 and 2.43 for medium:light (5:1) and heavy:medium (2:1) with standard deviations of 3.37 and 0.43 (Figure 5B). Four singly charged fragment ions (y3+, y4+, b4+, and b5+) detected as quadruplet peaks in the MS2 spectrum of peptide TASGNIIPSSTGAAK2+ are shown in Figure 5C. The median ratios for quantified proteins were 1.79, 3.14, and 2.39 with standard deviations of 0.37, 0.84, and 0.56 for mdDL2001:mdDL1011, mdDL2200:mdDL2001, and mdDL0400:mdDL2200 in the relative mixing ratios of 2:1, 2.5:1 and 2:1 (Figure 5D). For these example peptides, RP 500K is sufficient for discerning triplets of fragment ions containing 7 or fewer residues for quantification but falls short of adequately resolving quadruplets of fragment ions containing 6 or more residues.
Figure 5.
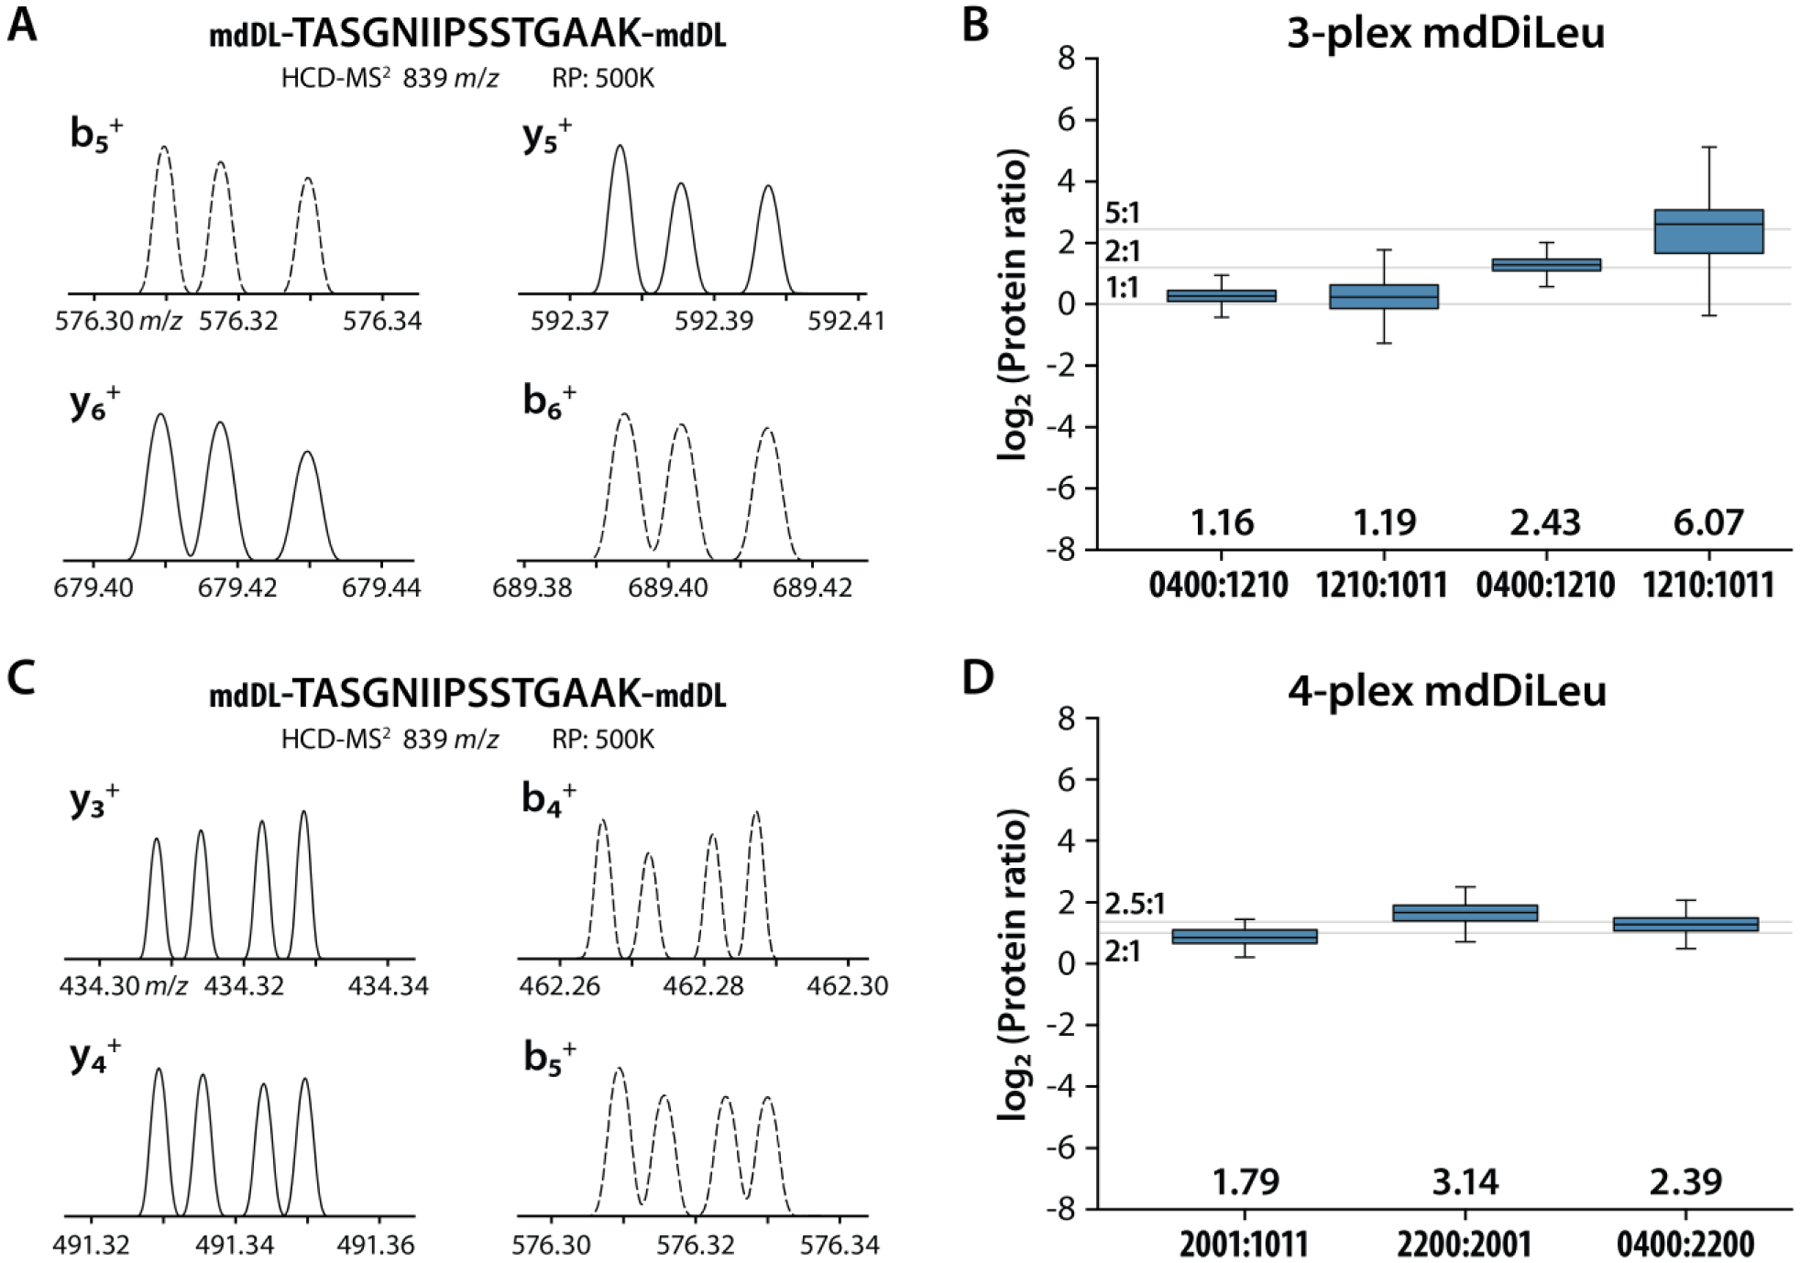
Quantitative results of 3-plex mdDiLeu-labeled yeast tryptic peptides: (A) MS2 spectra of peptide TASGNIIPSSTGAAK2+ averaged over the 38s retention time window (RP 500K; 27 m/z width centered at m/z 839). (B) Measured quantitative ratios for DIA-based MS2 quantification at 1:1:1 and 1:5:10 mixtures (mdDL1011:mdDL1210:mdDL0400). Quantitative results of 4-plex mdDiLeu-labeled yeast tryptic peptides: (C) MS2 spectra of peptide TASGNIIPSSTGAAK2+ averaged over 48s (RP 500K; 27 m/z width centered at m/z 589); (D) Measured quantitative ratios for DIA-based MS2 quantification at a known mixing ratio of 1:2:5:10 (mdDL1011: mdDL2001:mdDL2200:mdDL0400).
Application Using CSF Samples
We further applied the DIA-based MS2 quantification strategy to evaluate the proteome changes in cerebrospinal fluid (CSF) of Alzheimer’s Disease (AD) using 2-plex mdDiLeu tags. The average age (standard deviation) of healthy controls was 67.8 (±1.39) years, which was comparable to the AD patients at an age of 68.2 (±2.39). The three pairs of labeled healthy control and AD patient samples were combined at a 1:1 ratio by mass of protein, individually. The DIA analysis consisted of a survey scan with a mass range of 400–1200 m/z and subsequent HCD fragmentation by repeatedly cycling through 13 consecutive isolation windows (window size of 52 m/z for 400–900 m/z and 102 m/z for 900–1200 m/z). As shown in Figure S6, two mdDiLeu-labeled CSF peptides, AADDTWEPFASGK2+ derived from transthyretin and AGALNSNDAFVLK2+ derived from gelsolin, coeluted and cofragmented during the analysis to reveal a ten-fold abundance difference between the two proteins. Overall, 51.4% of identified peptides (3393), corresponding to 64.4% of identified proteins (947), were quantified by the multiplexed DIA analysis. Gene ontology (GO) enrichment analysis of biological process from quantifiable proteins is summarized in Figure S7A, which highlights the enriched terms such as platelet degranulation, negative regulation of endopeptidase activity, complement activation, and cell adhesion, consistent with the previous label-free-based DDA analysis.28 Platelet degranulation played a central role in platelet mediated amyloid-beta (Aβ) oligomerization in AD.29 Down-regulation of Aβ-degrading endopeptidase possibly elevated Aβ level at and around neuronal synapses.30 Aβ and neurofibrillary tangles have been reported to activate the classical and alternative complement pathway in AD.31,32 Cell adhesion molecules, such as neural cell adhesion molecule L1 (L1CAM), neural cell adhesion molecule (NCAM), amyloid-beta precursor protein (A4), and contactin-1 (CNTN1), participate in nervous system development and synaptic plasticity, showing decreased levels in CSF of AD patients.33–35 Protein expression fold changes are displayed for the representative biological processes (Figure S7B). Notably, the average standard deviations of protein expression across the three pairs of CSF samples were 13%, 13%, 11%, and 11% for the four most enriched biological processes, demonstrating the high reproducibility of DIA analysis for CSF sample analysis. These results demonstrate the feasibility of the multiplexed DIA strategy in clinical sample analysis, which further extends its utility.
CONCLUSION
We have described an mdDiLeu labeling strategy for multiplexed MS2 quantification by DIA that aims to improve the analytical throughput of DIA and address the limitations of current methodologies. Selective modification of peptide N-termini and lysine side chains with mdDiLeu chemical tags permits convenient analysis of different types of samples including cell culture extracts, tissues, and biofluids. The unique characteristics of mdDiLeu tags enable multiplexed DIA analysis via the subtle mass difference between tags, thus avoiding isolation of multiple isotopic clusters into different windows. Through proof-of-principle quantitative analyses of yeast protein extract digest samples, MS2-based quantification by DIA and MS1-based quantification by DDA strategies both exhibited high consistency in terms of quantitative accuracy and precision, but DIA outperformed DDA with regard to reproducibility and number of quantifiable proteins resulting from unbiased precursor ion selection. The application of mdDiLeu tags to multiplexed DIA proteomic analysis of CSF highlighted the expected biological process involved in AD. While the approach demonstrated in this work relied upon spectral libraries generated by DDA data and Skyline software for peptide identification, open source software tools that permit library-free analysis, such as DIA-Umpire,36 could incorporate support for mass defect-based labeling strategies in the future to make multiplexed DIA analysis more sensitive, comprehensive, and accessible. Future efforts could also endeavor to develop mass defect-based tags with greater mDa mass differences between channels to either increase multiplexing capacity or improve proteomic depth by reducing the resolving power required to distinguish and quantify labeled samples.
Supplementary Material
ACKNOWLEDGMENTS
The authors thank Wisconsin Alzheimer’s Disease Research Center for providing cerebrospinal fluid samples. This research was supported in part by the National Institutes of Health (NIH) grants RF1AG052324, 1P50AG033514, R01DK071801, and P41GM108538. The Orbitrap instruments were purchased through the support of an NIH shared instrument grant (NIH-NCRR S10RR029531) and Office of the Vice Chancellor for Research and Graduate Education at the University of Wisconsin-Madison. L.L. acknowledges a Vilas Distinguished Achievement Professorship and Charles Melbourne Johnson Distinguished Chair Professorship with funding provided by the Wisconsin Alumni Research Foundation and University of Wisconsin-Madison School of Pharmacy.
Footnotes
Supporting Information
The Supporting Information is available free of charge at https://pubs.acs.org
Isotope configurations of mdDiLeu tags; mdDiLeu-labeled yeast tryptic peptides and fragment ions identified by DDA analysis; Quantification performance at the resolving power of 120K, 240K, and 500K; Distribution of standard deviations; Distribution of coefficient of variation; Example spectra of 2-plex mdDiLeu-labeled CSF peptides; Gene ontology analysis of proteins quantified using multiplexed DIA; Supplemental Note.
The authors declare no competing financial interest.
REFERENCES
- 1.Aebersold R; Mann M Nature 2003, 422 (6928), 198–207. [DOI] [PubMed] [Google Scholar]
- 2.Domon B; Aebersold R Science (80-.) 2006, 312 (5771), 212–217. [DOI] [PubMed] [Google Scholar]
- 3.Michalski A; Cox J; Mann MJ Proteome Res. 2011, 10 (4), 1785–1793. [DOI] [PubMed] [Google Scholar]
- 4.Liu H; Sadygov RG; Yates JR Anal. Chem 2004, 76 (14), 4193–4201. [DOI] [PubMed] [Google Scholar]
- 5.Meier F; Geyer PE; Virreira Winter S; Cox J; Mann M Nat. Methods 2018, 15 (6), 440–448. [DOI] [PubMed] [Google Scholar]
- 6.Collins BC; Gillet LC; Rosenberger G; Röst HL; Vichalkovski A; Gstaiger M; Aebersold R Nat. Methods 2013, 10 (12), 1246–1253. [DOI] [PubMed] [Google Scholar]
- 7.Ludwig C; Gillet L; Rosenberger G; Amon S; Collins BC; Aebersold R Mol. Syst. Biol 2018, 14 (8), e8126. [DOI] [PMC free article] [PubMed] [Google Scholar]
- 8.Gillet LC; Navarro P; Tate S; Röst H; Selevsek N; Reiter L; Bonner R; Aebersold R Mol. Cell. Proteomics 2012, 11 (6), O111.016717. [DOI] [PMC free article] [PubMed] [Google Scholar]
- 9.Collins BC; Hunter CL; Liu Y; Schilling B; Rosenberger G; Bader SL; Chan DW; Gibson BW; Gingras A-C; Held JM; Hirayama-Kurogi M; Hou G; Krisp C; Larsen B; Lin L; Liu S; Molloy MP; Moritz RL; Ohtsuki S; Schlapbach R; Selevsek N; Thomas SN; Tzeng S-C; Zhang H; Aebersold R Nat. Commun 2017, 8 (1), 291. [DOI] [PMC free article] [PubMed] [Google Scholar]
- 10.Ong S-E; Blagoev B; Kratchmarova I; Kristensen DB; Steen H; Pandey A; Mann M Mol. Cell. Proteomics 2002, 1 (5), 376–386. [DOI] [PubMed] [Google Scholar]
- 11.Chen X; Smith LM; Bradbury EM Anal. Chem 2000, 72 (6), 1134–1143. [DOI] [PubMed] [Google Scholar]
- 12.Robinson RAS; Evans AR Anal. Chem 2012, 84 (11), 4677–4686. [DOI] [PubMed] [Google Scholar]
- 13.Rauniyar N; Yates JR J. Proteome Res 2014, 13 (12), 5293–5309. [DOI] [PMC free article] [PubMed] [Google Scholar]
- 14.Hebert AS; Merrill AE; Bailey DJ; Still AJ; Westphall MS; Strieter ER; Pagliarini DJ; Coon JJ Nat. Methods 2013, 10 (4), 332–334. [DOI] [PMC free article] [PubMed] [Google Scholar]
- 15.Minogue CE; Hebert AS; Rensvold JW; Westphall MS; Pagliarini DJ; Coon JJ Anal. Chem 2015, 87 (5), 2570–2575. [DOI] [PMC free article] [PubMed] [Google Scholar]
- 16.Di Y; Zhang Y; Zhang L; Tao T; Lu H Anal. Chem 2017, 89 (19), 10248–10255. [DOI] [PubMed] [Google Scholar]
- 17.Dayon L; Sonderegger B; Kussmann MJ Proteome Res. 2012, 11 (10), 5081–5089. [DOI] [PubMed] [Google Scholar]
- 18.Swaney DL; Wenger CD; Coon JJ J. Proteome Res 2010, 9 (3), 1323–1329. [DOI] [PMC free article] [PubMed] [Google Scholar]
- 19.Frost DC; Greer T; Li L Anal. Chem 2015, 87 (3), 1646–1654. [DOI] [PMC free article] [PubMed] [Google Scholar]
- 20.Hao L; Johnson J; Lietz CB; Buchberger A; Frost D; Kao WJ; Li L Anal. Chem 2017, 89 (2), 1138–1146. [DOI] [PMC free article] [PubMed] [Google Scholar]
- 21.Zhong X; Yu Q; Ma F; Frost DC; Lu L; Chen Z; Zetterberg H; Carlsson C; Okonkwo O; Li L Anal. Chem 2019, 91 (3), 2112–2119. [DOI] [PMC free article] [PubMed] [Google Scholar]
- 22.Almeida RP; Schultz SA; Austin BP; Boots EA; Dowling NM; Gleason CE; Bendlin BB; Sager MA; Hermann BP; Zetterberg H; Carlsson CM; Johnson SC; Asthana S; Okonkwo OC JAMA Neurol. 2015, 72 (6), 699–706. [DOI] [PMC free article] [PubMed] [Google Scholar]
- 23.McKhann GM; Knopman DS; Chertkow H; Hyman BT; Jack CR; Kawas CH; Klunk WE; Koroshetz WJ; Manly JJ; Mayeux R; Mohs RC; Morris JC; Rossor MN; Scheltens P; Carrillo MC; Thies B; Weintraub S; Phelps CH Alzheimer’s Dement. 2011, 7 (3), 263–269. [DOI] [PMC free article] [PubMed] [Google Scholar]
- 24.Cox J; Mann M Nat Biotechnol 2008, 26 (12), 1367–1372. [DOI] [PubMed] [Google Scholar]
- 25.Zhong X; Frost DC; Li L Anal. Chem 2019, 91 (13), 7991–7995. [DOI] [PMC free article] [PubMed] [Google Scholar]
- 26.MacLean B; Tomazela DM; Shulman N; Chambers M; Finney GL; Frewen B; Kern R; Tabb DL; Liebler DC; MacCoss MJ Bioinformatics 2010, 26 (7), 966–968. [DOI] [PMC free article] [PubMed] [Google Scholar]
- 27.Egertson JD; MacLean B; Johnson R; Xuan Y; MacCoss MJ Nat. Protoc 2015, 10, 887. [DOI] [PMC free article] [PubMed] [Google Scholar]
- 28.Zhong X; Wang J; Carlsson C; Okonkwo O; Zetterberg H; Li L Frontiers in Molecular Neuroscience. 2019, p 483. [DOI] [PMC free article] [PubMed] [Google Scholar]
- 29.Donner L; Fälker K; Gremer L; Klinker S; Pagani G; Ljungberg LU; Lothmann K; Rizz F; Schaller M; Gohlke H; Willbold D; Grenegard M; Elvers M Sci. Signal 2016, 9 (429), 1–17. [DOI] [PubMed] [Google Scholar]
- 30.Fukami S; Watanabe K; Iwata N; Haraoka J; Lu B; Gerard NP; Gerard C; Fraser P; Westaway D; George-Hyslop P St.; Saido TC Neurosci. Res 2002, 43 (1), 39–56. [DOI] [PubMed] [Google Scholar]
- 31.Rogers J; Cooper NR; Webster S; Schultz J; McGeer PL; Styren SD; Civin WH; Brachova L; Bradt B; Ward P Proc. Natl. Acad. Sci 1992, 89 (21), 10016–10020. [DOI] [PMC free article] [PubMed] [Google Scholar]
- 32.Akiyama H; Barger S; Barnum S; Bradt B; Bauer J; Cole GM; Cooper NR; Eikelenboom P; Emmerling M; Fiebich BL; Finch CE; Frautschy S; Griffin WST; Hampel H; Hull M; Landreth G; Lue L; Mrak R; Mackenzie IR; McGeer PL; O’Banion MK; Pachter J; Pasinetti G; Plata–Salaman C; Rogers J; Rydel R; Shen Y; Streit W; Strohmeyer R; Tooyoma I; Van Muiswinkel FL; Veerhuis R; Walker D; Webster S; Wegrzyniak B; Wenk G; Wyss–Coray T Neurobiol. Aging 2000, 21 (3), 383–421. [DOI] [PMC free article] [PubMed] [Google Scholar]
- 33.Wang J; Cunningham R; Zetterberg H; Asthana S; Carlsson C; Okonkwo O; Li L Proteomics Clin. Appl 2016, 10 (12), 1225–1241. [DOI] [PubMed] [Google Scholar]
- 34.Cotman CW; Hailer NP; Pfister KK; Soltesz I; Schachner M Prog. Neurobiol 1998, 55 (6), 659–669. [DOI] [PubMed] [Google Scholar]
- 35.K.R. W; S.P. S; A.M. S; D. A; Y. Z; J. H; S. K; W.R. M; L.A. H; Wildsmith KR; Schauer SP; Smith AM; Arnott D; Zhu YD; Haznedar J; Kaur S; Mathews WR; Honigberg LA Mol. Neurodegener 2014, 9 (1), 22.24902845 [Google Scholar]
- 36.Tsou CC; Avtonomov D; Larsen B; Tucholska M; Choi H; Gingras AC; Nesvizhskii AI Nat. Methods 2015, 12 (3), 258–264. [DOI] [PMC free article] [PubMed] [Google Scholar]
Associated Data
This section collects any data citations, data availability statements, or supplementary materials included in this article.


