

Abstract
We describe a set of simple devices for surface-induced dissociation of protein complexes on three instrument platforms. All of the devices use a novel yet simple split lens geometry that is minimally invasive (requiring a few mm along the ion path axis) and is easier to operate than prior generations of devices. The split lens is designed to be small enough to replace the entrance lens of a Bruker FT-ICR collision cell, the dynamic range enhancement (DRE) lens of a Waters Q-IM-TOF, or the exit lens of a transfer multipole of a Thermo Scientific Extended Mass Range (EMR) Orbitrap. Despite the decrease in size and reduction in number of electrodes to 3 (from 10–12 in Gen 1 and ~6 in Gen 2), we show sensitivity improvement in a variety of cases across all platforms while also maintaining SID capabilities across a wide mass and energy range. The coupling of SID, high resolution, and ion mobility is demonstrated for a variety of protein complexes of varying topologies.
Keywords: surface-induced dissociation, protein complex, native mass spectrometry, split lens
Graphical Abstract
Introduction
Surface-induced dissociation (SID) as an analytical technique dates back to landmark 1975 and 1985 papers from Cooks’ laboratory.1,2 SID was originally studied as an alternative activation method to the more commonly employed collision-induced dissociation (CID), with d3-acetophenone and ethylphenyl ether as the initial case studies. Although fragment ions of the same m/z were produced by SID and CID, greater energy deposition was noted for the former, giving rise to measurable differences in relative abundances of fragment ions. Other key features of SID are narrow internal energy distributions compared to CID3 and less ion restructuring (particularly of proteins and protein complexes) which is presumably due to the single-collision, high energy input nature of SID.4
Although early SID development and applications involved small molecular cations and peptide fragmentation models,5–8 protein complexes have emerged over the past decade as promising analytes for interrogation. Native protein complexes are particularly difficult to probe by mass spectrometry. Because they are in low charge states and typically have more folded structures than denatured proteins, they generally resist electron-based fragmentation methods (electron transfer dissociation, electron capture dissociation, and electron ionization dissociation),9–11 and in cases where fragments are observed, they are typically formed from surface-exposed residues of the native complex or from the restructured, non-native complex after collisional activation.12,13 Moreover, these methods generally do not produce subcomplexes from intact macromolecular species and so are of limited utility for deducing quaternary structure. Collision-induced dissociation of protein complexes produces restructured monomer in many cases and (n-1)mer with asymmetric charge partitioning but does not directly generate subcomplexes consistent with intersubunit connectivity.14–16 Ultraviolet photodissociation17 can result in production of subcomplexes in some cases,18 but like infrared multiphoton dissociation19 it is usually used to produce extensive sequence fragments. Surface-induced dissociation can create both sequence fragments (usually b/y ions from peptides) and subcomplexes (from protein complexes) that are consistent with protein quaternary structure.4,20–22 Moreover, SID can be utilized to deduce a wide array of protein complex characteristics including topology,23,24 intersubunit interaction strength25 and ligand binding.26
Despite nearly 35 years of SID development from a variety of research groups, SID is not yet a commercialized or widely available technique, in contrast to CID. Its applicability to protein complexes4,21,22,27 has only recently been possible due to improvements in instrumentation for native MS.14,28–31 Many SID device designs have been tested over the years. SID can be implemented in triple quadrupole geometries in a variety of ways,32 with the quadrupoles mounted either orthogonally or collinearly and a surface placed in between.33,34 SID can be accomplished in a quadrupole ion trap by pulsing the endcaps to a high potential, causing the ions to collide with the ring electrode.35 Surfaces can be placed inside electrostatic linear ion traps36 or reflectrons37 in order to cause collisions. In FT-ICR instruments, ions can be made to collide with a surface on a direct-insertion probe placed inside the FT-ICR cell,38,39 a mesh electrode substituted for the front endcap, 40 or the rear endcap of the FT-ICR cell itself.41 Notably, none of these configurations have been tested with protein complexes and so their applicability to macromolecular species remains unclear.28
A 10-lens in-line SID device (termed ‘Gen 1’ in this paper, Figure 1) was built and installed in several Waters Synapt Q-IM-TOF platforms in our laboratory27 and has been successfully used for fragmentation of protein complexes over a wide mass and energy range. This design was then translated to Thermo Scientific Extended Mass Range (EMR) Orbitrap42 and Bruker FT-ICR43 platforms (also termed ‘Gen 1’ devices) and subsequently simplified to ~6-lens systems with tilted surfaces as a second generation (‘Gen 2’) of devices in the Synapt44 and FT-ICR.45 Nonetheless, there is still a desire to simplify and minimize SID device design further while also improving sensitivity.
Figure 1:

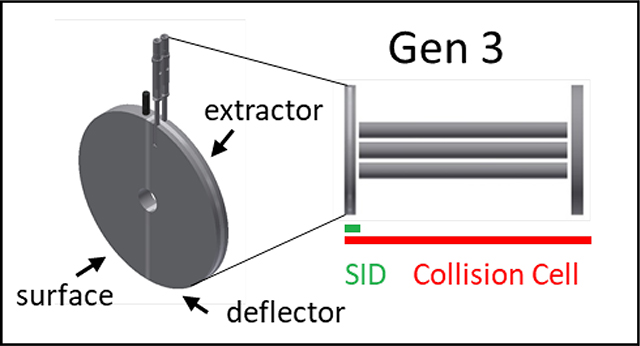
Three generations of SID designs developed in the Wysocki laboratory. ‘Gen 1’ devices have SID lengths >3 cm and consist of 10–12 SID electrodes. ‘Gen 2’ devices consist of tilted surfaces with fewer electrodes and occupy approximately half the volume as their ‘Gen 1’ counterparts. ‘Gen 3’ devices, reported here, occupy approximately 3 mm along the ion path and consist of only three lenses, surface, deflector, and extractor. SRIG = stacked ring ion guide. SID = surface-induced dissociation cell. IM = ion mobility.
In this work, we describe simple and minimally invasive devices for surface-induced dissociation of protein complexes across multiple instrument platforms, namely a Bruker solariX XR FT-ICR, Waters Synapt G1 and G2 Q-IM-TOF mass spectrometers, and a Thermo Scientific Extended Mass Range (EMR) Orbitrap. The SID device across all platforms is a simple yet novel doubly-split lens that can replace the entrance lens of a multipole, quadrupole, or collision cell or can replace split lenses used for ion gating or ion beam attenuation.
Experimental
Chemicals
Ammonium acetate, triethylammonium acetate (TEAA), ethylenediamine diacetate (EDDA), perfluoroheptanoic acid (PFHA), cesium bicarbonate, cesium iodide, and glutamate dehydrogenase (GDH) were purchased from Sigma-Aldrich (St. Louis, MO). Pyruvate kinase from rabbit and C-reactive protein were purchased from Lee Biosolutions (Maryland Heights, MO, USA). HFQ65, HFQ102, toyocamycin nitrile hydratase (TNH), and Trp RNA binding attenuation protein (TRAP) were obtained from collaborator laboratories (HFQ65 and HFQ102 from the Woodson group, Johns Hopkins University; TNH from the Bandarian group, The University of Utah; and TRAP from the Foster group, The Ohio State University and the Gollnick group, State University of NY, Buffalo). Protein complexes were buffer exchanged twice into 200 mM ammonium acetate using size exclusion chromatography spin columns (Bio-Rad) with a 6 kDa cutoff and further diluted in 200 mM ammonium acetate to 5–10 μM concentration of protein complex. TEAA and EDDA were used as charge reducing agents and were added to protein solutions at a final concentration of 60 mM reducing agent and 140 mM ammonium acetate. Perfluoroheptanoic acid (PFHA) and cesium bicarbonate were used for mass calibration on the FT-ICR (CsI was used on the other platforms) and prepared together at a 10 mM working concentration in water.
Ionization
Nanoelectrospray ionization at ~1 kV was used to generate ions of native protein complexes for analysis. Borosilicate nanospray capillaries with ~2 μm tip diameter were prepared in house using a Sutter Instrument P-97 tip puller (Novato, CA).
Instrumentation
A Bruker solariX XR 15 T FT-ICR mass spectrometer equipped with a nanoelectrospray ionization source was used for part of this work. All rf devices were set to their highest voltages and lowest frequencies, aside from the transport multipole between the collision cell and the FT-ICR cell, which was set at 2 MHz. The collision cell was filled with argon for collisional cooling and ion activation. Most spectra were acquired as an average of 10 scans (unless otherwise noted), generally with a mass range of m/z 1,000 to m/z 20,000, 1 M transient length (~2.2 s), and time-of-flight in the range of 1.5–2 ms, depending on the m/z range of the analyte ions. Higher-resolution spectra were acquired with 4 M transient length and low m/z of 1,000 (~9 s transient).
Experiments were also conducted on Waters Synapt G1 and Synapt G2 Q-IM-TOF platforms equipped with a nanoelectrospray ionization source. Typical settings for TOF mode (no ion mobility) were as follows: capillary voltage, 700 V; source temperature, 20° C; sampling cone, 40 V; extraction cone, 1.0 V; backing pressure, 4–8 mbar (depending on the size of the protein complex); trap pressure, 1.13e-2 mbar; trap CE, 4 V (varies with SID energy); transfer CE, 4 V; ion energy (resolving quadrupole), 0.5 V; trap entrance DC bias, 2.0 V; trap bias, 10 V; trap exit bias, 5 V. Experiments were also conducted in mobility mode with the IM gas flow generally set to 20 mL/min (G1) and 60 mL/min (G2).
A third instrument platform we modified was a Thermo Scientific EMR Orbitrap (modified Exactive Plus) that was previously modified inhouse by the addition of a selection quadrupole and our traditional ‘Gen 1’ SID device.42 Typical settings are as follows: resolution setting, 35k (128 ms transient); trap gas, 5 (10 for glutamate dehydrogenase and GroEL); rf voltages set to maximum; source voltage, 1 kV; source temperature, 200° C; source DC offset, 7 V; injection flatapole, 7 V; interflatapole lens, 6 V; bent flatapole offset, 5 V; transfer guide offset, 5 V; HCD mode, on (i.e. ions were trapped in the HDC cell prior to transfer to the C-trap); C-trap entrance lens, 2 V; C-trap exit lens, 20 V. Note that the C-trap entrance and exit lenses as well as the C-trap bias varied with SID collision energy.
Results & Discussion
Device Design
Gen 3 takes a minimalistic approach not only to significantly shorten the SID device but also to simplify SID tuning and improve the collection efficiency of protein complexes after surface collision. The last row in Figure 1 showcases the three new SID designs tested in this work. The SID cell in each case is a doubly-split lens, i.e. a single lens that has been split into 3 components: a deflector and an extractor on one side and a stainless steel surface on the other side. The surface is polished and cleaned but otherwise has no surface modifications. While the Wysocki group and others have shown that fluorocarbon SAM films vs hydrocarbon SAM films can lead to different onset energies for dissociation, untreated metal surfaces coated with adventitious hydro or fluorocarbon coatings in the vacuum chamber are effective SID surfaces46 even for peptides and protein complexes as demonstrated by Stiving et al.47 Although SAM films can also prevent ion neutralization on the surface, we have previously reported little difference in sensitivity when using stainless steel surfaces for fragmentation of protein complexes.47 In the case of the Q-IM-TOF platform, the dynamic range enhancement lens after the quadrupole and before the Trap SRIG was reconfigured as shown in Figure 1, Gen 3. This device does not necessitate truncation of the Trap as has been required with Gen 1 and Gen 2 designs. On the FT-ICR, the front lens of the collision cell was split into the three requisite electrodes. That is, SID is accomplished in the front lens of the collision cell on this platform, and so the commercial collision cell need not be truncated. On the Orbitrap, the transfer multipole prior to the C-trap is replaced with a truncated hexapole of the same inscribed diameter (discussed later) with a split lens SID device placed just prior to the C-trap. In general, the Gen 3 devices use the same or similar aperture diameters as the elements they replace (Synapt and FT-ICR; 2.5 mm and 5.0 mm, respectively), or in the case of the EMR the aperture diameter is only slightly smaller than the C-trap aperture (2.5 mm) at 2.0 mm. The surface electrodes were ~3.0 mm thickness and the deflector and extractor had 1.0 mm thickness.
Gen 3 SID in an FT-ICR
Figures 1 and S1a, b show the simplicity of Gen 3 on the FT-ICR in comparison to earlier devices; it consists of only three electrodes - surface, deflector, and extractor - and a single nonconductive (PEEK or ceramic) spacer. This thin device replaces the original front endcap of the Bruker collision cell (Figure S1c), while the remaining portion of the collision cell as well as the rest of the instrument (Figure S2) remains untouched. The entire SID device is 3.25 mm in length (matching the thickness of the original endcap electrode), representing an order of magnitude reduction in size compared to Gen 1 and a 5x decrease in size compared to Gen 2 (Figure S1a).
Based on the simulations performed prior to device testing (described in the Supplemental Information, Figure S3 and S4, and Table S1), we hypothesized that the Gen 3 device would be more sensitive in SID mode compared to the Gen 2 device on the FT-ICR. The SID signal intensity was profiled using four different protein complexes: 53 kDa charge-reduced streptavidin tetramer, 115 kDa charge-reduced C-reactive protein pentamer, 230 kDa pyruvate kinase tetramer, and 330 kDa glutamate dehydrogenase (GDH) hexamer. The same nanospray tip was used to record full MS and SID intensities as a function of accumulation time for both Gen 2 and Gen 3. The quadrupole was purposely placed in rf-only mode (placing m/z 1,000 at q = 0.706) for these experiments, as the quadrupole can stretch the ion beam in the radial dimension with application of a resolving DC voltage.
A comparison of SID signal intensity across the usable energy range was first accomplished using streptavidin in EDDA (mainly 12+ and 13+ charge state precursors). Figure 2a compares the signal intensity observed in flythrough mode as well as SID at 25 V, 40 V, 80 V, and 150 V (approximately 300–1950 eV). In all cases the Gen 3 signal is significantly higher. Gen 3 especially outperforms Gen 2 at the lower energies, 25 V and 40 V, where Gen 1 and Gen 2 devices have historically struggled based on our experience and which will be evident on the other platforms discussed later. The capture efficiency after collision is clearly higher with the new design, as was indicated by the SIMION simulations. The spectra obtained at 40 V acceleration potential are overlaid in Figure 2b. The Gen 3 spectrum in purple is noticeably higher in signal-to-noise.
Figure 2:

Comparison of sensitivity of Gen 2 and Gen 3 SID devices on the FT-ICR using streptavidin in EDDA (mainly 12+ and 13+ precursors, no isolation): (a) Comparison of flythrough and SID intensities under comparable conditions, and (b) comparison of representative SID spectra at 40 V acceleration (Q (tetramer) produces two dimers, D (e.g., Q12+ → 2 D6+ and Q13+ → D6+ plus D7+), and monomer (M) plus trimer (T).)
For the comparisons of larger protein complexes the following acceleration voltages were used for illustration: C-reactive protein, 85 V; pyruvate kinase and GDH, 135 V. Figure S5 shows a comparison of absolute signal intensities for surface-induced dissociation of (a) C-reactive protein pentamer, (b) pyruvate kinase tetramer, and (c) GDH hexamer on both devices (Gen 2, green; Gen 3, purple) as a function of accumulation time. In all cases, Gen 3 achieves higher signal intensity at each accumulation time. Panels (d,e,f) show spectra that correspond to the accumulation times highlighted by the black boxes. For C-reactive protein, approximately double the ion intensity was observed at 0.3 s accumulation time. For GDH and pyruvate kinase, the intensity was nearly 5x higher for Gen 3 in both cases (at 1 s and 2 s accumulation times, respectively), which is evident from the spectral comparisons in panels (e) and (f).
The spectral quality for pyruvate kinase is lower than C-reactive protein because it is well known to have 12 post-translational modifications and several adducts of allosteric regulator 2,5-anhydro-d-glucitol, 1,6 bisphosphate (GBP) that are resistant to removal by collisional activation, as documented by Kelleher group.48 Both large complexes will retain salt and solvent adducts under the ‘cold’ source conditions we intentionally use to preserve native non-covalent interactions so as to generate SID fragments consistent with native subunit connectivity. Source conditions vary by instrument, with more modern instruments providing robust desolvation/desalting conditions which yield cleaner spectra. The instruments retrofitted with SID in this work are all several years old and so do not necessarily provide optimum source conditions for large protein complexes. Glutamate dehydrogenase generally only produces small amounts of trimer with low secondary ion yield from SID as it has been documented to be a sturdy complex, that is, resistant to fragmentation by both CID and SID except at high energies. For example, Ma et al. found that CID of GDH 39+ at 200 V, the maximum collision energy on a Synapt G2, produced only small amounts of highly charged monomer (the authors magnified the low m/z region by 30x),49 and the Robinson group found that GDH was highly resistant to CID except when supercharged in solution.50 Similar to the present work, SID at 130 V produced a small but detectable amount of GDH trimer consistent with the stacked trimer topology of the complex. Similarly, pyruvate kinase predominantly produces dimers due to its dimer-of-dimers topology. Both SID spectra from Gen 3 are consistent in quality with several prior publications from our laboratory.25,45,49 Improved spectra, in terms of S/N and peak width could be obtained with more optimal source and instrument conditions, i.e. by utilizing a newer instrument (e.g. Thermo UHMR) that would yield higher apparent resolving power.
Surface-induced dissociation coupled to ultrahigh (FT-ICR) resolution
The 15 T FT-ICR provides resolution far exceeding other mass analyzers. We chose several cyclic protein complexes to demonstrate the utility of ultrahigh resolution (and, later, ion mobility on the Q-IM-TOF), as these tend to dissociate by SID into all possible oligomeric states and so overlap in m/z due to symmetric charge partitioning.
HFQ65 is a cyclic 43 kDa homohexameric RNA chaperone that is a truncated form of HFQ102.51,52 The full scan of the precursor (charge reduced using TEAA) in Figure 3a shows 8+ through 12+ hexamers as prominent native species. Because the complex is cyclic, the SID spectrum of the isolated 10+ hexamer using a 35 V potential difference yields monomer through pentamer, and many peaks consist of multiple oligomeric states which require either ion mobility or isotopic resolution to deconvolute. The peak at m/z 3594, for example, clearly consists of monomer 2+, dimer 4+, and trimer 6+, all of which are resolved with a 9 s transient.
Figure 3:

Full scans and surface-induced dissociation spectra of hexameric (a) HFQ65 and (b) HFQ102 using the Gen 3 device on the FT-ICR. The four bottom spectra are zoomed in to show the isotopic resolution of the 15 T ICR using a 9 s transient. The SID spectra are an average of 30 scans at 4 M transient length (low m/z 1,000); the full scans are an average of 10 at 1 M transient length. M = monomer, D = dimer, T = trimer, Q = tetramer, P = pentamer, H = hexamer
HFQ102 (66 kDa) is similarly a homohexameric protein complex but has molecular ‘tails’ on each subunit, which are not present on HFQ65. Figure 3b shows the full scan and SID spectrum of the charge-reduced complex, with hexamer 10+ through 13+ observed as precursors. The peak m/z 5518 consists of several species, monomer 2+, dimer 4+, trimer 6+, and tetramer 8+. While monomer through trimer are baseline resolved from each other, there is overlap once a fourth oligomer is added to the mix, particularly as the FT-ICR’s resolution decreases at higher m/z. Nevertheless, these examples highlight the utility of ultrahigh resolution for analyzing SID products of protein complexes.
Trp RNA binding attenuation protein (TRAP) is a 91 kDa homo-11mer that binds tryptophan and participates in allosteric gene regulation. TRAP is another cyclic protein complex whose structure is conserved in the gas phase.53,54 The mass spectrum of the holoRAP protein complex with 14 equivalents of Trp (i.e. Trp in excess) in 200 mM EDDA in Figure S6a indicates primary charge states of 16+ through 20+. As expected, the collision-induced dissociation spectrum of the 18+ charge state in Figure S6b shows asymmetrically charged monomers and decamers. On average, the monomers take approximately 1/3 of the charge despite making up only 1/11 of the mass of the total complex. Despite the many possible cleavages of the protein, no oligomers beyond decamer and monomer were observed, highlighting the limited utility of CID in this particular case. Surface-induced dissociation of the 18+ charge state (Figure S6c), on the other hand, yields a wide variety of symmetrically charged products ranging from monomer through decamer, though most of the ion intensity is monomer through heptamer. The observation of every oligomeric fragment is consistent with a cyclic 11mer. The insets in panels (d-f) show expanded views of various peaks obtained at higher resolution (9 s transient).
The Gen 3 device can also fragment monomeric protein complexes to produce primarily b and y ions. For example, the 7+ charge state of cytochrome C (Figure S7a) was selected and subject to CID at 60 V and SID at 50 V. Both collisional activation methods produced predominantly y ions with similar cleavage locations along the protein backbone. CID yielded approximately 26% sequence coverage, comparable to the 28% coverage afforded by SID. The higher energy deposition by SID is evident from the greater precursor ion depletion even when using a lower collision energy (50 V SID vs. 60 V CID).
Implementation of a split lens SID design on a Q-IM-TOF platform
Because the split lens SID design is minimalistic and small (~3 mm length), it is easier to install in various MS platforms compared to prior device designs from our laboratory. We reconfigured the dynamic range enhancement (DRE) lens in Waters Synapt G1 and G2 Q-IM-TOF mass spectrometers to perform SID experiments (Figure 1, bottom left). An instrument schematic of the Synapt G2 is given in Figure S8a. The DRE lens is located behind the quadrupole mass filter and in front of the trap SRIG; it is composed of a split lens followed by a second lens (Figure S8b, top). The DRE lens reconfigured for SID consists of two of the original lens elements which previously comprised a split lens but are now used as deflector and extractor for SID (Figure 4a and Figure S8b, bottom). Only a single stainless-steel electrode was fabricated and inserted as the surface opposite the deflector and extractor. The replacement of the DRE lens did not affect flythrough signal for C-reactive protein (Figure S9) over three replicate nESI tips.
Figure 4:

Gen 3 SID on a Synapt G2 platform. (a) photograph of DRE (dynamic range enhancement) lens reconfigured to perform SID, (b) SID spectrum of the 10+ charge state of HFQ65 (with TEAA as charge reducing reagent) in IM-TOF mode recorded on the G2, and (c) mobiligram associated with the SID spectrum.
To reduce nanospray variability on the Synapt G2, both Gen 1 and Gen 3 SID devices were kept in the instrument simultaneously. A comparison was made between SID spectra and signal intensities for Gen 1 and Gen 3 SID devices by using 53 kDa streptavidin tetramer in EDDA (average charge state 13+) and IM-TOF mode across a wide range of energies. The spectra were again obtained without quadrupole isolation to remove any quadrupole effects from the comparison. The measured Gen 3 signal intensities were significantly higher at the lower energies (SID 25 V and 40 V comparison are shown in Figure S10a,b) and the highest energy (150 V) – in agreement with our observations on the FT-ICR – but the spectra obtained at 80 V were comparable. This comparison is summarized in Figure S10c.
Signal improvement was also noticeable with larger protein complexes. SID of both pyruvate kinase (PK) and glutamate dehydrogenase (GDH) yielded higher absolute signal than with the Gen 1 device. For pyruvate kinase (average charge state 29+) the SID signal at 135 V increased by ~30%, and at 200 V the signal increased by ~20% (Figure S11a). For SID of GDH (average charge state 40+) at 135 V the signal increased by ~50% (Figure S11b). Both examples of increased S/N are evident in the spectral comparisons in panels (c) and (d). Only a small difference in capture efficiency is noted for very high m/z (>16,000) in the GDH spectra, but this is more than offset by the ~2.5x increase in S/N for most peaks. Clearly the Gen 3 SID device can both transmit and fragment large protein complexes efficiently. The small differences in signal intensity > m/z 16,000 can be explained by the fact that the ion mobility cell behind the Gen 1 device sits at 2 orders of magnitude higher pressure than the trap, leading to greater capture efficiency only at very high m/z. This can be mitigated by corresponding increases to the trap pressure or use of a heavier collision gas.
On the FT-ICR the ultrahigh resolution could be used to determine oligomeric states of subcomplexes generated after SID through isotopic spacings; on the G2, traveling wave ion mobility is used to a similar effect. Figure 4b shows the SID spectrum of charge reduced HFQ65 in IM-TOF mode with quadrupole selection of the 10+ charge state. Clear separation is observed in the ion mobility spectrum in Figure 4c, and there is good agreement between FT-ICR and Q-IM-TOF spectra.
This experiment was repeated with the 11mer holoTRAP complex (with 14 eq Trp in 200 mM EDDA) also investigated on the FT-ICR, and the results are shown in Figure 5 with the isolated 18+ charge state. On the G2 all oligomeric fragments, from monomer through decamer, were observed after SID and are more clearly separated in ion mobility space than with the ultrahigh resolution of the FT-ICR. Clearly, the replacement of the DRE lens does not affect the ion mobility capabilities of the instrument.
Figure 5:

SID-IM-TOF of the 18+ charge state of holoTRAP 11mer (in 200 mM EDDA with 14 equivalents of trp) using Gen 3 on the Synapt G2. All oligomeric fragments are observed in mobility space, consistent with the cyclic arrangement of the subunits.
Gen 3 was also installed on a Synapt G1 to demonstrate the wide applicability of the current SID design on multiple Synapt platforms. apoTRAP 11mer was analyzed on the G1 in SID-IM-TOF mode (Figure S12). As before, due to the cyclic structure of the complex, many types of oligomer fragments are observed after surface collision of the charge reduced precursors. Note that no quadrupole selection was used in this case. These data are in good agreement with SID data from both the FT-ICR and the G2.
Implementation of a split lens SID design on an Orbitrap platform
A Gen 3 SID device was also installed into an Exactive EMR Orbitrap platform, previously modified to include a selection quadrupole. The first generation design (Figure 6, ‘Gen 1’) incorporated 12 dc-only electrodes26,42 arranged in a manner similar to the Gen 1 design on the FT-ICR and Synapts. The front and rear 3 elements (6 total) comprise Einzel lenses with the first and third electrodes of each trio electrically connected. Hence, the SID cell uses 10 independent voltages to power the 12 electrodes plus one more externally supplied voltage to vary the C-trap offset. The Gen 1 SID device replaced the transfer multipole prior to the C-trap (red star in the instrument diagram Figure S13a). While the device is robust and capable of SID across a large energy and mass range, reduction in the number of electrodes for SID would be beneficial for ease-of-use. We incorporated a Gen 3 SID design in the same location as the Gen 1 SID cell by designing and fabricating a truncated hexapole (rod diameter 4.75 mm, inscribed diameter 8.75 mm) to make room for the doubly-split lens SID device just prior to the C-trap (model shown in Figure 6, ‘Gen 3’; fabricated device shown in Figure S13b). Figure S13b also shows the original octupole that the device replaces.
Figure 6:

Surface-induced dissociation using a Gen 3 device on an EMR Orbitrap platform: (a) full scan mass spectrum of HFQ65 charge reduced using TEAA, (b) SID (315 eV) of the 9+ precursor using the 35k resolution setting (128 ms transient), and (c) SID (315 eV) of the 9+ precursor using the 140k resolution setting (512 ms transient). Insets show the peak at m/z 3594. A bias against the larger oligomers is observed at longer transient lengths due to the increased path length. A comparison is given to the FT-ICR SID spectra of the 10+ charge state with different transient lengths in Figure S19.
In transmission mode, very little difference in overall signal intensity and relative abundances was observed with a CsPFHA cluster calibration solution when comparing Gen 1 and Gen 3 on the EMR (Figure S14). Transmission of large protein complexes was similarly unaffected. Figure S15 shows transmission of 330 kDa glutamate dehydrogenase hexamer with Gen 1 and Gen 3 devices installed. Over three replicate tips, no measurable difference was observed.
The SID performance of Gen 1 and Gen 3 were compared with charge-reduced streptavidin (60 mM EDDA as reducing agent) without ion isolation to prevent quadrupole effects from convoluting the results. Although both devices return similar intensities in flythrough and SID 85 V spectra, Gen 3 is particularly notable for its increased performance at the lower energy (SID 45 V), an observation now made across three separate instrument platforms. An almost 4-fold increase in sensitivity was observed, (Figure S16).
SID spectra of the 13+ homopentamer of cholera toxin B were acquired on the EMR (Figure S17). The spectra are similar to those obtained on the FT-ICR (Figure S18) in that all oligomeric fragments are produced due to the cyclic arrangement of the subunits. While the FT-ICR can resolve overlapping oligomers by using greater transient lengths (e.g. Figure S18c,d), increasing the transient length on the Orbitrap to the 140k setting (512 ms transient, Figure S17c) results in substantial bias toward the lower mass fragments due to the high path length in the Orbitrap cell.42,55
Surface-induced dissociation of the 9+ charge state of HFQ65 on the EMR is given in Figure 6b,c with the full MS shown in Figure 6a. While the low-resolution Orbitrap spectrum in panel (b) agrees well with the spectrum obtained on the FT-ICR (Figure S19a), at higher resolution spectral biases are observed. Insets in panels (b) and (c) show the resolution achieved for m/z 3594 at the different transient lengths. Dimer is only resolved in the higher resolution spectrum, and trimer is not resolved in either spectrum. Comparable SID spectra of the isolated 10+ charge state (the most abundant) on the FT-ICR required a 2.2 s and 9 s transient (Figure S19a,b).
The SID spectrum of 11mer holoTRAP (Figure S20) was also similar to the spectra obtained on the FT-ICR and Synapt, with monomer through heptamer being the most prominent fragments, though note that all oligomeric fragments were again observed due to the cyclic structure of the protein complex.
Gen 3 on the EMR works with large complexes at high acceleration potentials as well. Figure S21 shows the full scan and SID spectra of the 38+ charge state of 330 kDa glutamate dehydrogenase at 5130 eV and 6650 eV. In both low and high energy cases, the predominant fragments are trimers, in agreement with the dimer of trimers arrangement of the subunits.42,45,49 Gen 3 on the EMR is therefore capable of transmitting and fragmenting ions over a wide range of masses and energies yet demonstrates a simpler SID design to increase usability and improve SID automation for data-dependent MS/MS analyses in the future.
Conclusion
A miniaturized split lens surface-induced dissociation device has been fabricated and experimentally compared to a previous SID design on an FT-ICR, Synapt G1 and G2 Q-IM-TOF mass spectrometers, and a modified (Q) Exactive EMR Orbitrap. In addition to a reduction in length to ~3 mm, the device exhibits up to 11x improvement in SID intensities compared to previous devices, with only small losses in high m/z (>16,000) transmission observed on the Synapt due to the positioning of the device prior to the lower pressure trap cell. Ultrahigh resolution coupled with surface-induced dissociation of lower mass protein complexes allows for the deconvolution of overlapping oligomers and can be particularly valuable in conjunction with corroborating results from ion mobility, as demonstrated here with TRAP 11mer and HFQ65. For high mass protein complexes (>150 kDa), the apparent FT-ICR resolving power is lower than desired, but that is a source and perhaps analyzer limitation and not a limitation of SID. Newer instruments are continually being optimized for transmission and desolvation of macromolecules, and heavy modification of legacy instrument ion sources and optics remains difficult to accomplish and justify. The SID design can be generalized to other multipole ion guides, collision cells, and stacked ring ion guides that have an entrance or exit lens large enough to accommodate the split lens electrodes and can more easily be implemented in other instrument platforms due to its reduced footprint. The reduction in the number of independent electrodes also simplifies tuning and paves the way for easier SID automation. The ease of incorporation of SID into a wide array of instrument platforms should enable its commercialization and widespread adoption as a standard technique in the native mass spectrometry workflow, where important structural biology questions can be answered by using the unique fragmentation characteristics of SID.
Supplementary Material
Acknowledgements
The authors thank the OSU Arts and Sciences College Machine Shop for fabricating the parts described in this manuscript. The authors also acknowledge helpful discussions with Bruker Corporation (Mel Park and Mark Ridgway in particular), Thermo Fisher Scientific, and Waters Corporation. We thank Jorjethe Roca (Johns Hopkins University) and Sarah Woodson (Johns Hopkins University) for the Hfq samples (NIH R01 GM120425), and Melody Holmquist, Mark Foster (OSU), and Paul Gollnick (SUNY Buffalo) for the TRAP sample (NIH R01 GM120923). The FT-ICR was purchased using funds from NIH Award S10 OD018507. This work was supported by the NIH P41 Resource for Native Mass Spectrometry Guided Structural Biology, P41GM128577.
References
- (1).Mabud MDA; Dekrey MJ; Cooks RG Surface-Induced Dissociation of Molecular Ions. Int J Mass Spectrom Ion Process. 1985, 67, 285–294. [Google Scholar]
- (2).Cooks RG; Terwilliger DT; Ast T; Beynon JH; Keough T Surface Modified Mass-Spectrometry. J. Am. Chem. Soc 1975, 97 (6), 1583–1585. 10.1021/ja00839a056. [DOI] [Google Scholar]
- (3).DeKrey MJ; Kenttämaa HI; Wysocki VH; Cooks RG Energy Deposition in [Fe(CO)5]+˙ upon Collision with a Metal Surface. Org. Mass Spectrom 1986, 21 (4), 193–195. 10.1002/oms.1210210405. [DOI] [Google Scholar]
- (4).Wysocki VH; Jones CM; Galhena AS; Blackwell AE Surface-Induced Dissociation Shows Potential to Be More Informative than Collision-Induced Dissociation for Structural Studies of Large Systems. J Am Soc Mass Spectrom 2008, 19 (7), 903–913. 10.1016/j.jasms.2008.04.026. [DOI] [PMC free article] [PubMed] [Google Scholar]
- (5).Laskin J; Futrell JH Surface-Induced Dissociation of Peptide Ions: Kinetics and Dynamics. J. Am. Soc. Mass Spectrom 2003, 14 (12), 1340–1347. [DOI] [PubMed] [Google Scholar]
- (6).Laskin J; Denisov E; Futrell J A Comparative Study of Collision-Induced and Surface-Induced Dissociation. 1. Fragmentation of Protonated Dialanine. J. Am. Chem. Soc 2000, 122 (40), 9703–9714. 10.1021/ja001384w. [DOI] [Google Scholar]
- (7).McCormack AL; Jones JL; Wysocki VH Surface-Induced Dissociation of Multiply Protonated Peptides. J. Am. Soc. Mass Spectrom 1992, 3 (8), 859–862. [DOI] [PubMed] [Google Scholar]
- (8).Wysocki VH; Joyce KE; Jones CM; Beardsley RL Surface-Induced Dissociation of Small Molecules, Peptides, and Non-Covalent Protein Complexes. J Am Soc Mass Spectrom 2008, 19 (2), 190–208. 10.1016/j.jasms.2007.11.005. [DOI] [PMC free article] [PubMed] [Google Scholar]
- (9).Rožman M; Gaskell SJ Charge State Dependent Top-down Characterisation Using Electron Transfer Dissociation. Rapid Commun. Mass Spectrom 2012, 26 (3), 282–286. 10.1002/rcm.5330. [DOI] [PubMed] [Google Scholar]
- (10).Breuker K; McLafferty FW Native Electron Capture Dissociation for the Structural Characterization of Noncovalent Interactions in Native Cytochrome c. Angew. Chem. Int. Ed 2003, 42 (40), 4900–4904. 10.1002/anie.200351705. [DOI] [PubMed] [Google Scholar]
- (11).Li H; Sheng Y; McGee W; Cammarata M; Holden D; Loo JA Structural Characterization of Native Proteins and Protein Complexes by Electron Ionization Dissociation-Mass Spectrometry. Anal. Chem 2017, 89 (5), 2731–2738. 10.1021/acs.analchem.6b02377. [DOI] [PMC free article] [PubMed] [Google Scholar]
- (12).Lermyte F; Williams JP; Brown JM; Martin EM; Sobott F Extensive Charge Reduction and Dissociation of Intact Protein Complexes Following Electron Transfer on a Quadrupole-Ion Mobility-Time-of-Flight MS. J. Am. Soc. Mass Spectrom 2015, 26 (7), 1068–1076. 10.1007/s13361-015-1124-z. [DOI] [PubMed] [Google Scholar]
- (13).Lermyte F; Sobott F Electron Transfer Dissociation Provides Higher-Order Structural Information of Native and Partially Unfolded Protein Complexes. PROTEOMICS 2015, 15 (16), 2813–2822. 10.1002/pmic.201400516. [DOI] [PubMed] [Google Scholar]
- (14).Sobott F; Robinson CV Characterising Electrosprayed Biomolecules Using Tandem-MS—the Noncovalent GroEL Chaperonin Assembly. Int J Mass Spectrom 2004, 236 (1–3), 25–32. 10.1016/j.ijms.2004.05.010. [DOI] [Google Scholar]
- (15).Light-Wahl KJ; Schwartz BL; Smith RD Observation of the Noncovalent Quaternary Associations of Proteins by Electrospray Ionization Mass Spectrometry. J. Am. Chem. Soc 1994, 116 (12), 5271–5278. 10.1021/ja00091a035. [DOI] [Google Scholar]
- (16).Versluis C; Heck AJR Gas-Phase Dissociation of Hemoglobin11Dedicated to Nico Nibbering with Many Thanks for His Support and Infectious Enthusiasm over the Years. Int. J. Mass Spectrom 2001, 210–211, 637–649. 10.1016/S1387-3806(01)00428-6. [DOI] [Google Scholar]
- (17).Brodbelt JS Ion Activation Methods for Peptides and Proteins. Anal Chem 2016, 88 (1), 30–51. 10.1021/acs.analchem.5b04563. [DOI] [PMC free article] [PubMed] [Google Scholar]
- (18).Sipe SN; Brodbelt JS Impact of Charge State on 193 Nm Ultraviolet Photodissociation of Protein Complexes. Phys. Chem. Chem. Phys 2019, 21 (18), 9265–9276. 10.1039/C9CP01144G. [DOI] [PMC free article] [PubMed] [Google Scholar]
- (19).Li H; Nguyen HH; Ogorzalek Loo RR; Campuzano IDG; Loo JA An Integrated Native Mass Spectrometry and Top-down Proteomics Method That Connects Sequence to Structure and Function of Macromolecular Complexes. Nat Chem 2018, 10 (2), 139–148. 10.1038/nchem.2908. [DOI] [PMC free article] [PubMed] [Google Scholar]
- (20).Quintyn RS; Zhou M; Yan J; Wysocki VH Surface-Induced Dissociation Mass Spectra as a Tool for Distinguishing Different Structural Forms of Gas-Phase Multimeric Protein Complexes. Anal Chem 2015, 87 (23), 11879–11886. [DOI] [PubMed] [Google Scholar]
- (21).Stiving AQ; VanAernum ZL; Busch F; Harvey SR; Sarni SH; Wysocki VH Surface-Induced Dissociation: An Effective Method for Characterization of Protein Quaternary Structure. Anal Chem 2019, 91 (1), 190–209. 10.1021/acs.analchem.8b05071. [DOI] [PMC free article] [PubMed] [Google Scholar]
- (22).Jones CM; Beardsley RL; Galhena AS; Dagan S; Cheng G; Wysocki VH Symmetrical Gas-Phase Dissociation of Noncovalent Protein Complexes via Surface Collisions. J Am Chem Soc 2006, 128 (47), 15044–15045. 10.1021/ja064586m. [DOI] [PubMed] [Google Scholar]
- (23).Song Y; Nelp MT; Bandarian V; Wysocki VH Refining the Structural Model of a Heterohexameric Protein Complex: Surface Induced Dissociation and Ion Mobility Provide Key Connectivity and Topology Information. ACS Cent Sci 2015, 1 (9), 477–487. 10.1021/acscentsci.5b00251. [DOI] [PMC free article] [PubMed] [Google Scholar]
- (24).Sahasrabuddhe A; Hsia Y; Busch F; Sheffler W; King NP; Baker D; Wysocki VH Confirmation of Intersubunit Connectivity and Topology of Designed Protein Complexes by Native MS. Proc Natl Acad Sci USA 2018, 115 (6), 1268–1273. [DOI] [PMC free article] [PubMed] [Google Scholar]
- (25).Harvey SR; Seffernick JT; Quintyn RS; Song Y; Ju Y; Yan J; Sahasrabuddhe AN; Norris A; Zhou M; Behrman EJ; Lindert S; Wysocki VH Relative Interfacial Cleavage Energetics of Protein Complexes Revealed by Surface Collisions. Proc Natl Acad Sci USA 2019, 116 (17), 8143–8148. 10.1073/pnas.1817632116. [DOI] [PMC free article] [PubMed] [Google Scholar]
- (26).Busch F; VanAernum ZL; Ju Y; Yan J; Gilbert JD; Quintyn RS; Bern M; Wysocki VH Localization of Protein Complex Bound Ligands by Surface-Induced Dissociation High-Resolution Mass Spectrometry. Anal Chem 2018, 90 (21), 12796–12801. 10.1021/acs.analchem.8b03263. [DOI] [PMC free article] [PubMed] [Google Scholar]
- (27).Galhena AS; Dagan S; Jones CM; Beardsley RL; Wysocki VH Surface-Induced Dissociation of Peptides and Protein Complexes in a Quadrupole/Time-of-Flight Mass Spectrometer. Anal Chem 2008, 80 (5), 1425–1436. 10.1021/ac701782q. [DOI] [PubMed] [Google Scholar]
- (28).Hernández H; Robinson CV Determining the Stoichiometry and Interactions of Macromolecular Assemblies from Mass Spectrometry. Nat. Protoc. 2007, 2 (3), 715. [DOI] [PubMed] [Google Scholar]
- (29).Benesch JL; Aquilina JA; Ruotolo BT; Sobott F; Robinson CV Tandem Mass Spectrometry Reveals the Quaternary Organization of Macromolecular Assemblies. Chem Biol 2006, 13 (6), 597–605. [DOI] [PubMed] [Google Scholar]
- (30).Rostom AA; Robinson CV Detection of the Intact GroEL Chaperonin Assembly by Mass Spectrometry. J Am Chem Soc 1999, 121 (19), 4718–4719. 10.1021/ja990238r. [DOI] [Google Scholar]
- (31).Fort KL; Van de Waterbeemd M; Boll D; Reinhardt-Szyba M; Belov ME; Sasaki E; Zschoche R; Hilvert D; Makarov AA; Heck AJ Expanding the Structural Analysis Capabilities on an Orbitrap-Based Mass Spectrometer for Large Macromolecular Complexes. Analyst 2018, 143 (1), 100–105. [DOI] [PubMed] [Google Scholar]
- (32).Wysocki VH; Ding J-M; Jones JL; Callahan JH; King FL Surface-Induced Dissociation in Tandem Quadrupole Mass Spectrometers: A Comparison of Three Designs. J Am Soc Mass Spectrom 1992, 3 (1), 27–32. [DOI] [PubMed] [Google Scholar]
- (33).Bier M; Amy J; Cooks R; Syka J; Ceja P; Stafford G A Tandem Quadrupole Mass Spectrometer for the Study of Surface-Induced Dissociation. Int J Mass Spectrom Ion Process 1987, 77 (1), 31–47. [Google Scholar]
- (34).Mohammed S; Chalmers MJ; Gielbert J; Ferro M; Gora L; Smith DC; Gaskell SJ A Novel Tandem Quadrupole Mass Spectrometer Allowing Gaseous Collisional Activation and Surface Induced Dissociation. J. Mass Spectrom. 2001, 36 (12), 1260–1268. [DOI] [PubMed] [Google Scholar]
- (35).Lammert SA; Cooks RG Surface-Induced Dissociation of Molecular Ions in a Quadrupole Ion Trap Mass Spectrometer. J Am Soc Mass Spectrom 1991, 2 (6), 487–491. 10.1016/1044-0305(91)80036-7. [DOI] [PubMed] [Google Scholar]
- (36).Hilger RT; Santini RE; McLuckey SA Tandem Mass Spectrometry in an Electrostatic Linear Ion Trap Modified for Surface-Induced Dissociation. Anal. Chem. 2014, 86 (17), 8822–8828. [DOI] [PubMed] [Google Scholar]
- (37).Williams ER; Fang L; Zare RN Surface Induced Dissociation for Tandem Time-of-Flight Mass Spectrometry. Int. J. Mass Spectrom. Ion Process. 1993, 123 (3), 233–241. [Google Scholar]
- (38).Chorush RA; Little DP; Beu SC; Wood TD; McLafferty FW Surface-Induced Dissociation of Multiply-Protonated Proteins. Anal Chem 1995, 67 (6), 1042–1046. [DOI] [PubMed] [Google Scholar]
- (39).Laskin J; Denisov EV; Shukla AK; Barlow SE; Futrell JH Surface-Induced Dissociation in a Fourier Transform Ion Cyclotron Resonance Mass Spectrometer: Instrument Design and Evaluation. Anal Chem 2002, 74 (14), 3255–3261. [DOI] [PubMed] [Google Scholar]
- (40).Williams ER; Henry KD; McLafferty FW; Shabanowitz J; Hunt DF Surface-Induced Dissociation of Peptide Ions in Fourier-Transform Mass Spectrometry. J Am Soc Mass Spectrom 1990, 1 (5), 413–416. 10.1016/1044-0305(90)85022-E. [DOI] [PubMed] [Google Scholar]
- (41).Ijames CF; Wilkins CL Surface-Induced Dissociation by Fourier Transform Mass Spectrometry. Anal. Chem. 1990, 62 (13), 1295–1299. [DOI] [PubMed] [Google Scholar]
- (42).VanAernum ZL; Gilbert JD; Belov ME; Makarov AA; Horning SR; Wysocki VH Surface-Induced Dissociation of Noncovalent Protein Complexes in an Extended Mass Range Orbitrap Mass Spectrometer. Anal Chem 2019, 91 (5), 3611–3618. 10.1021/acs.analchem.8b05605. [DOI] [PMC free article] [PubMed] [Google Scholar]
- (43).Yan J; Zhou M; Gilbert JD; Wolff JJ; Somogyi A; Pedder RE; Quintyn RS; Morrison LJ; Easterling ML; Pasa-Tolic L; Wysocki VH Surface-Induced Dissociation of Protein Complexes in a Hybrid Fourier Transform Ion Cyclotron Resonance Mass Spectrometer. Anal Chem 2017, 89 (1), 895–901. 10.1021/acs.analchem.6b03986. [DOI] [PubMed] [Google Scholar]
- (44).Stiving AQ; Gilbert JD; Wysocki VH Development of Ion Carpet-Surface Induced Dissociation (SID) Devices For Simplified Tuning; 2018.
- (45).Snyder DT; Panczyk E; Stiving AQ; Gilbert JD; Somogyi A; Kaplan D; Wysocki V Design and Performance of a Second-Generation Surface-Induced Dissociation Cell for Fourier Transform Ion Cyclotron Resonance Mass Spectrometry of Native Protein Complexes. Anal. Chem. 2019, 91 (21), 14049–14057. 10.1021/acs.analchem.9b03746. [DOI] [PMC free article] [PubMed] [Google Scholar]
- (46).Winger B; Julian R Jr; Cooks R; Chidsey C Surface Reactions and Surface-Induced Dissociation of Polyatomic Ions at Self-Assembled Organic Monolayer Surfaces. J Am Chem Soc 1991, 113 (23), 8967–8969. [Google Scholar]
- (47).Stiving AQ; Gilbert JD; Jones BJ; Wysocki VH A Tilted Surface and Ion Carpet Array for SID. J. Am. Soc. Mass Spectrom. 2019. 10.1021/jasms.9b00009. [DOI] [PMC free article] [PubMed] [Google Scholar]
- (48).Belov ME; Damoc E; Denisov E; Compton PD; Horning S; Makarov AA; Kelleher NL From Protein Complexes to Subunit Backbone Fragments: A Multi-Stage Approach to Native Mass Spectrometry. Anal Chem 2013, 85 (23), 11163–11173. 10.1021/ac4029328. [DOI] [PubMed] [Google Scholar]
- (49).Ma X; Zhou M; Wysocki VH Surface Induced Dissociation Yields Quaternary Substructure of Refractory Noncovalent Phosphorylase B and Glutamate Dehydrogenase Complexes. J Am Soc Mass Spectrom 2014, 25 (3), 368–379. 10.1007/s13361-013-0790-y. [DOI] [PubMed] [Google Scholar]
- (50).Hall Z; Hernández H; Marsh JA; Teichmann SA; Robinson CV The Role of Salt Bridges, Charge Density, and Subunit Flexibility in Determining Disassembly Routes of Protein Complexes. Structure 2013, 21 (8), 1325–1337. [DOI] [PMC free article] [PubMed] [Google Scholar]
- (51).Sauer E; Weichenrieder O Structural Basis for RNA 3’-End Recognition by Hfq. Proc Natl Acad Sci USA 2011, 108 (32), 13065–13070. 10.1073/pnas.1103420108. [DOI] [PMC free article] [PubMed] [Google Scholar]
- (52).Vogel J; Luisi BF Hfq and Its Constellation of RNA. Nat Rev Microbiol 2011, 9, 578 10.1038/nrmicro2615. [DOI] [PMC free article] [PubMed] [Google Scholar]
- (53).Kleckner IR; Gollnick P; Foster MP Mechanisms of Allosteric Gene Regulation by NMR Quantification of Microsecond–Millisecond Protein Dynamics. J Mol Biol 2012, 415 (2), 372–381. [DOI] [PMC free article] [PubMed] [Google Scholar]
- (54).Ruotolo BT; Giles K; Campuzano I; Sandercock AM; Bateman RH; Robinson CV Evidence for Macromolecular Protein Rings in the Absence of Bulk Water. Science 2005, 310 (5754), 1658–1661. 10.1126/science.1120177. [DOI] [PubMed] [Google Scholar]
- (55).Makarov A; Denisov E Dynamics of Ions of Intact Proteins in the Orbitrap Mass Analyzer. J. Am. Soc. Mass Spectrom. 2009, 20 (8), 1486–1495. [DOI] [PubMed] [Google Scholar]
Associated Data
This section collects any data citations, data availability statements, or supplementary materials included in this article.