

Abstract

Deficient ether lipid biosynthesis in rhizomelic chondrodysplasia punctata and other disorders is associated with a wide range of severe symptoms including small stature with proximal shortening of the limbs, contractures, facial dysmorphism, congenital cataracts, ichthyosis, spasticity, microcephaly, and mental disability. Mouse models are available but show less severe symptoms. In both humans and mice, it has remained elusive which of the symptoms can be attributed to lack of plasmanyl or plasmenyl ether lipids. The latter compounds, better known as plasmalogens, harbor a vinyl ether double bond conferring special chemical and physical properties. Discrimination between plasmanyl and plasmenyl ether lipids is a major analytical challenge, especially in complex lipid extracts with many isobaric species. Consequently, these lipids are often neglected also in recent lipidomic studies. Here, we present a comprehensive LC–MS/MS based approach that allows unequivocal distinction of these two lipid subclasses based on their chromatographic properties. The method was validated using a novel plasmalogen-deficient mouse model, which lacks plasmanylethanolamine desaturase and therefore cannot form plasmenyl ether lipids. We demonstrate that plasmanylethanolamine desaturase deficiency causes an accumulation of plasmanyl species, a too little studied but biologically important substance class.
In mammalia, more than 20% of all glycerophospholipids are considered to be ether lipids.1 These lipids carry an ether-linked fatty alcohol rather than an ester-linked fatty acid at the sn-1 position and occur abundantly within the lipid classes of phosphatidylethanolamines (PE) and phosphatidylcholines (PC). Plasmalogens are a subgroup of ether lipids and defined by a characteristic 1-O-alk-1′-enyl ether (vinyl ether) double bond (Figure 1A). Although their exact functional range still has to be fully uncovered, they have been shown to be involved in shaping membrane properties, to act as potent antioxidants, and to be involved in inflammatory signal transduction.2
Figure 1.

Ether lipid and plasmalogen metabolism. (A) Structures of diacyl-phosphatidylethanolamine (PE) and phosphatidylcholine (PC) ester lipids as well as ether lipids characterized by 1-O-alkyl and 1-O-alk-1′-enyl (plasmalogens) substitution at the sn-1 position. (B) Biosynthesis of ether lipids and plasmalogens crucially relies on functional peroxisomes and is dependent on fatty alcohol availability, which is controlled by a fatty acid reductase (FAR1). Plasmalogens are then formed in the endoplasmic reticulum by plasmanylethanolamine desaturase (PEDS). Further enzymes are GNPAT: glycerone phosphate O-acyltransferase; AGPS: alkylglycerone phosphate synthase; DHRS7B: alkyl/acyl DHAP reductase. Substrates: G3P: glyceraldehyde 3-phosphate; DHAP: dihydroxyacetone phosphate; CoA: coenzyme A. (C) Degradation routes of ether lipids require prior cleavage of sn-2 residues and/or polar headgroups by phospholipases (PLs). 1-O-Alkyl-glycerols are cleaved by alkylglycerol monooxygenase (AGMO), while plasmalogenases degrade plasmalogens. Both processes produce fatty aldehydes that are cleared by fatty aldehyde dehydrogenase (FALDH).
The biosynthesis of an ether lipid starts with the synthesis of 1-O-alkyl-glycero-3-phosphate in peroxisomes (Figure 1B) and is impaired in specific inherited enzyme/transporter deficiencies (rhizomelic chondrodysplasia punctata) as well as peroxisome biogenesis disorders (Zellweger spectrum disorders).3 Plasmalogens are subsequently formed in the endoplasmic reticulum from 1-O-alkyl-PE precursors by the action of the enzyme plasmanylethanolamine desaturase (PEDS), which was only recently identified to be encoded by TMEM189 (new gene name: Peds1).4,5 Some neurodegenerative conditions, including Alzheimer’s disease, are thought to be associated with impaired plasmalogen homeostasis.6 In contrast to ester-linked acyl side chains, alkyl and alk-1′-enyl residues cannot be readily remodeled; instead, these lipids have to be fully degraded by dedicated enzymatic routes (Figure 1C).7−9
A well-known problem for lipidomic analysis is the differentiation of isobaric phospholipid species, especially among ether lipids.10,11 While alkyl and acyl species can be differentiated using a high mass resolution, isomeric 1-O-alkyl (plasmanyl) and 1-O-alk-1′-enyl (plasmenyl) lipids cannot be distinguished by exact masses and fragmentation patterns alone. Especially in LC–MS/MS lipidomic experiments, this frequently leads to inaccurate or even incorrect annotations of lipid species. This problem is aggravated by a restricted selection of commercially available plasmanyl and plasmenyl standards. Importantly, automated analyses of LC–MS/MS datasets are particularly dependent on the databases used, which often prove to be incomplete with regard to ether lipids. Other analytical methods such as thin layer chromatography, on the other hand, are limited to measuring pools and ratios and cannot distinguish between individual molecular species,12 an important aspect that would be necessary to advance research in this field.
Here, we demonstrate that the chemical properties of 1-O-alk-1′-enyl and 1-O-alkyl ether lipids generate a highly predictable chromatographic behavior in reversed-phase LC–MS/MS experiments that can be readily used for the univocal differentiation between plasmalogens and other ether lipid species. The exact characterization of these properties was facilitated by a comparative lipidomic analysis of plasmalogen-free Peds1 knockout mice with littermate controls. Combined with the unique fragmentation properties of ether lipids, an exact molecular characterization of all relevant ether lipids could be carried out. This allowed us to map these lipids in detail across mouse tissues, thereby providing novel insights into their metabolism.
Experimental Section
Breeding of Peds1-Deficient Mice and Harvest of Mouse Tissues
Mice deficient in the PEDS enzyme (Tmem189tm1a(KOMP)Wtsi mice, Wellcome Sanger Institute, Hinxton, Cambridge, UK45) were bred according to ref (5) and approved by the Austrian Federal Ministry of Education, Science and Research (BMBWF-66.011/0100-V/3b/2019). For details, see the Supporting Information.
Sample Extraction and Preparation
Sample preparation, lipid extraction, and extract storage were performed as previously described.13 For details, see the Supporting Information.
LC–MS/MS Analysis
The PC/PE analysis was performed as described in ref (14) with the modifications described in ref (15). For details, see the Supporting Information. For general LC–MS parameters, see Tables S1 and S2.
Data Analysis
Raw data visualization was done in MZmine 2 version 2.53;16 for all further analysis steps, we utilized our in-house data extraction pipeline written in R.17−19 Data processing started with an initial feature recognition according to a retention time shift adjusted (linear weighted model using PC(34:1), PC/E(36:2), PC/E(36:4), PC(38:2), PE(34:2), PE(38:6), PE(O/P-36:2), PE(O/P-36:4)) peak list template (see Table S3), considering base and first isotope masses. For the boundary definition of peaks, we assumed Gaussian typologies. Next, all features were filtered for possible misassignments caused by isotope signals originating from interfering abundant lipid species. Features were then baseline corrected, followed by deconvolution and correct annotation of isobaric signals with comparable retention times according to reference peaks (standards and confirmed features). If a molecular species could not be automatically resolved in this manner, the peak was flagged and manually curated by consideration of MS2 data, retention time, and technical/biological replicates. The identity of each peak was thus confirmed by retention time, m/z, fragmentation behavior, and cross-validation with lipid standards. The standards used were purchased from Avanti Polar Lipids (Alabaster, Alabama) and included ether lipids (PC(P-18:0/18:1), PC(P-18:0/22:6), PC/E(O-16:0/18:1), PE(P-18:0/18:1), and PC(P-18:0/20:4)), as well as the diacyl lipids (PC/E(14:0/14:0), PC/E(18:1/18:1). To account for the nonlinear relationship between lipid concentration and peak area values, peak areas were transformed into semiquantitative values via an external standard series in a lipid-class-dependent manner by quadratic regression. A potential impact of side chain substitution and ester vs ether bond on the ionization efficiency was not measurable and thus lower than the technical variability. Finally, data was normalized to the total response in each lipid class per sample and then analyzed according to biological replicates and used for data visualization. If not stated otherwise, data is presented as mean ± standard deviation (SD). For principal component analysis (PCA), data was aggregated as indicated in Figure 5A,B and analyzed using the R stats prcomp function with scaled and centered values.18
Figure 5.
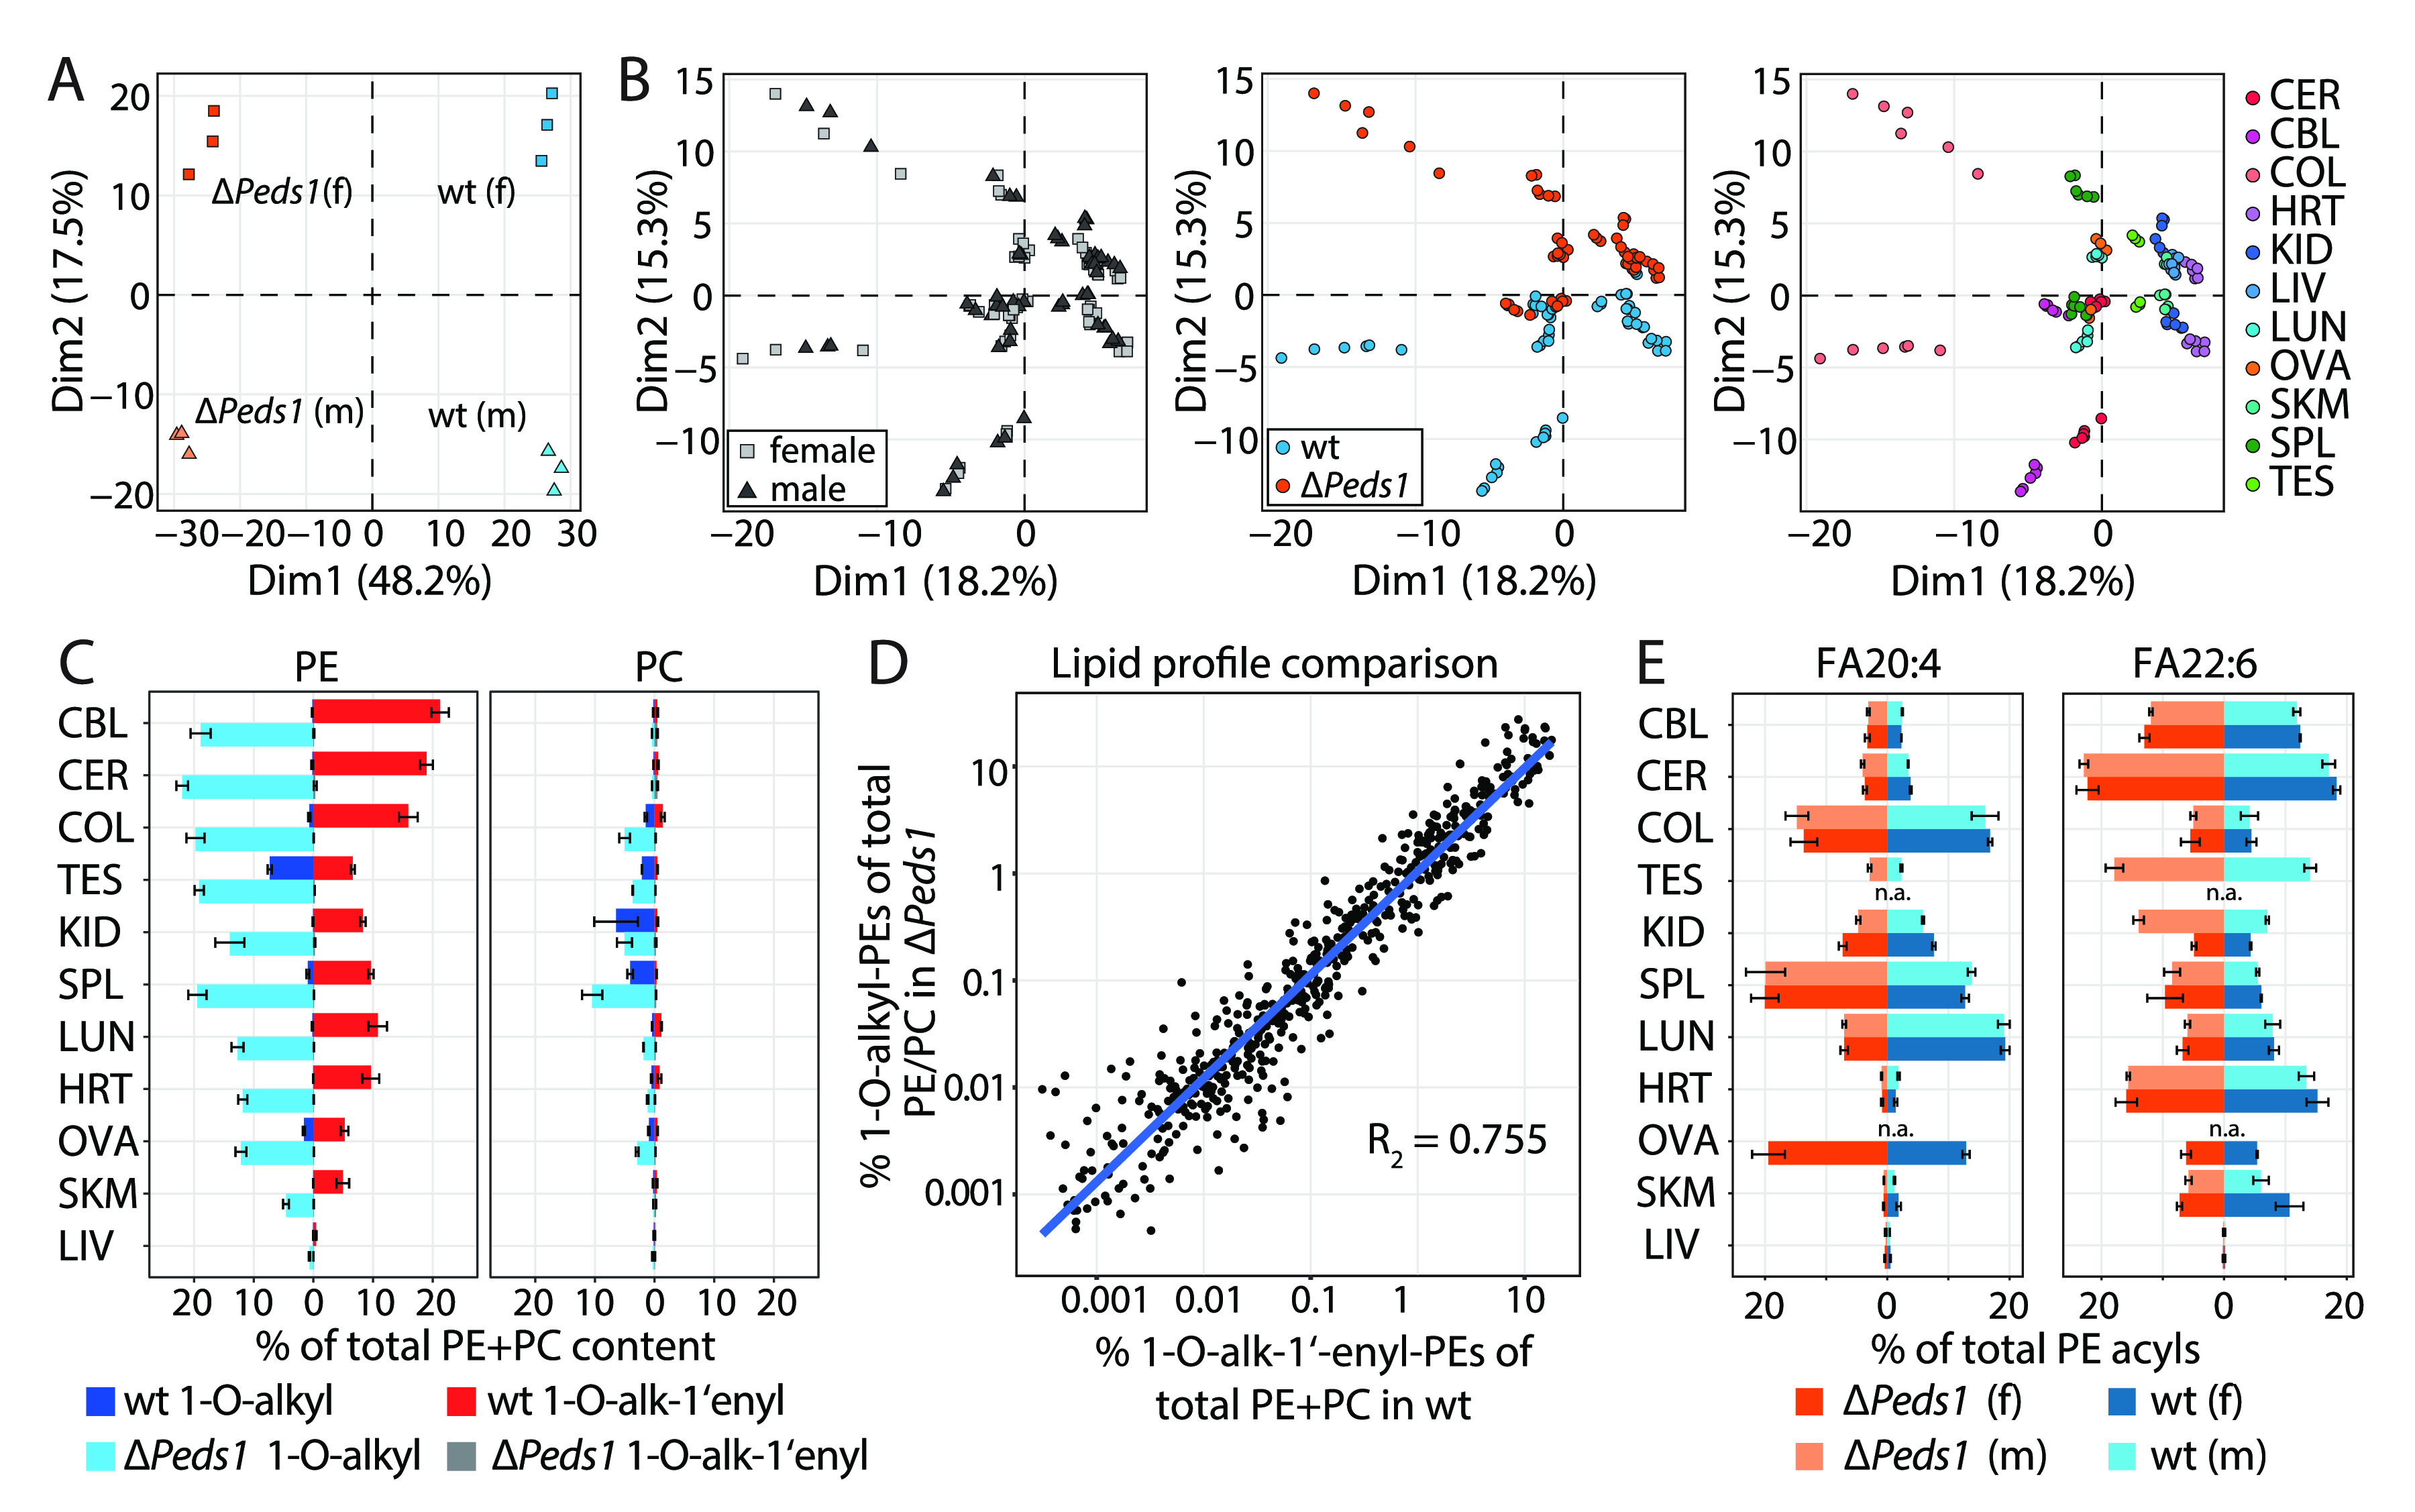
Ether lipid composition in wild type and Peds1-deficient mouse tissues. (A) Principal component analysis (PCA) of a mouse-centered lipidomic dataset separates Peds1-deficient (ΔPeds1) and wild type (wt) mice in principal component 1 (Dim1; 48.2% of variance) and female and male mice in principal component 2 (Dim2; 17.5% of variance). (B) PCA of individual tissue-centered dataset does not separate samples according to sexes (left) but discriminates between ΔPeds1 and wt tissues in principal component 2 (Dim2; 15.3% of variance; center). Additionally, the various tissues are separated by Dim2 and the principal component 1 (Dim1; 18.2% of variance; right). Tissues: CER: cerebrum, CBL: cerebellum; COL: colon; HRT: heart; KID: kidney; LIV: liver; LUN: lung; OVA: ovaries; SKM: skeletal muscle; SPL: spleen; TES: testes. (C) Content of ether lipids in wild type and ΔPeds1 tissues. Percentage of 1-O-alk-1′-enyl (red: wild type; gray: ΔPeds1) and 1-O-alkyl (blue: wild type; light blue: ΔPeds1) species related to total PE and PC lipids. Data shown as mean ± SD (n = 3). (D) Correlation between 1-O-alk-1′-enyl species in wild type and their corresponding 1-O-alkyl species in ΔPeds1 determined by linear regression. Each dot represents one 1-O-alk-1′-enyl–1-O-alkyl pair in a tissue. Data includes all tissues shown in (B) visualized as log10 values. (E) Content of fatty acyls (FA) 20:4 (left panel) and FA 22:6 (right panel), relative to the respective total PE acyl pool (excluding 1-O-alkyl and 1-O-alk-1-enyl residues), shown for all tissues listed in (B) ordered according to (C). Coloring scheme: red: ΔPeds1 female; light red: ΔPeds1 male; blue: wild type female; light blue: wild type male. Data shown as mean ± SD (n = 3).
Data Availability
Datasets have been deposited (see Dataset S1).
Results
Highly reliable reference material is required to validate the deconvolution of 1-O-alk-1′-enyl and 1-O-alkyl features in LC–MS/MS experiments. As the availability of commercial standards is limited, we here utilized tissue material of Peds1-deficient (ΔPeds1) mice that accumulate plasmanyl lipids instead of plasmalogens (Figure S1). We first focused on kidney lipid extracts, as this tissue presented the highest PEDS expression and activity levels.5
Phospholipids were extracted and analyzed by LC–MS/MS as described previously,15 and the retention time and m/z characteristics of all features were compared. While some m/z overlap problems between plasmenyl-PC and phosphatidylserines or PE species can be readily discriminated by measuring with resolving powers larger than 21 000 and 14 000, respectively (calculated via the IUPAC doublet method with 10% peak overlap20), the truly isomeric nature of plasmanyl and plasmenyl PE/PC species remains a major analytical challenge. The similarity of these functionally distinct lipids in terms of m/z ratio and fragmentation behavior makes it especially difficult for automated peak identification software to deliver correct results.
As illustrated in Figure 2A, wild type (wt) kidney samples contained high levels of plasmenyl-PEs (left panel: PE(P-38:4), PE(P-38:5), PE(P-38:6) in red), which were absent in ΔPeds1 kidneys, where instead the respective plasmanyl-PE species accumulated (right panel: PE(O-38:4), PE(O-38:5), PE(O-38:6) in blue). For other non-ether lipid species such as PE(36:2), PE(36:3), PE(36:4), and sphingomyelin(d34:1), we observed no differences in abundance (Figure 2A, center panel, black color). For PC ether lipids, a highly comparable behavior was observed (Figure 2B), however, with the striking difference that plasmanyl-PC species (PC(O-34:1), PC(O-34:2), PC(O-34:3)) were already much more abundant in the wild type compared to plasmenyl-PC lipids (PC(P-34:1), PC(P-34:2), PC(P-34:3)).
Figure 2.
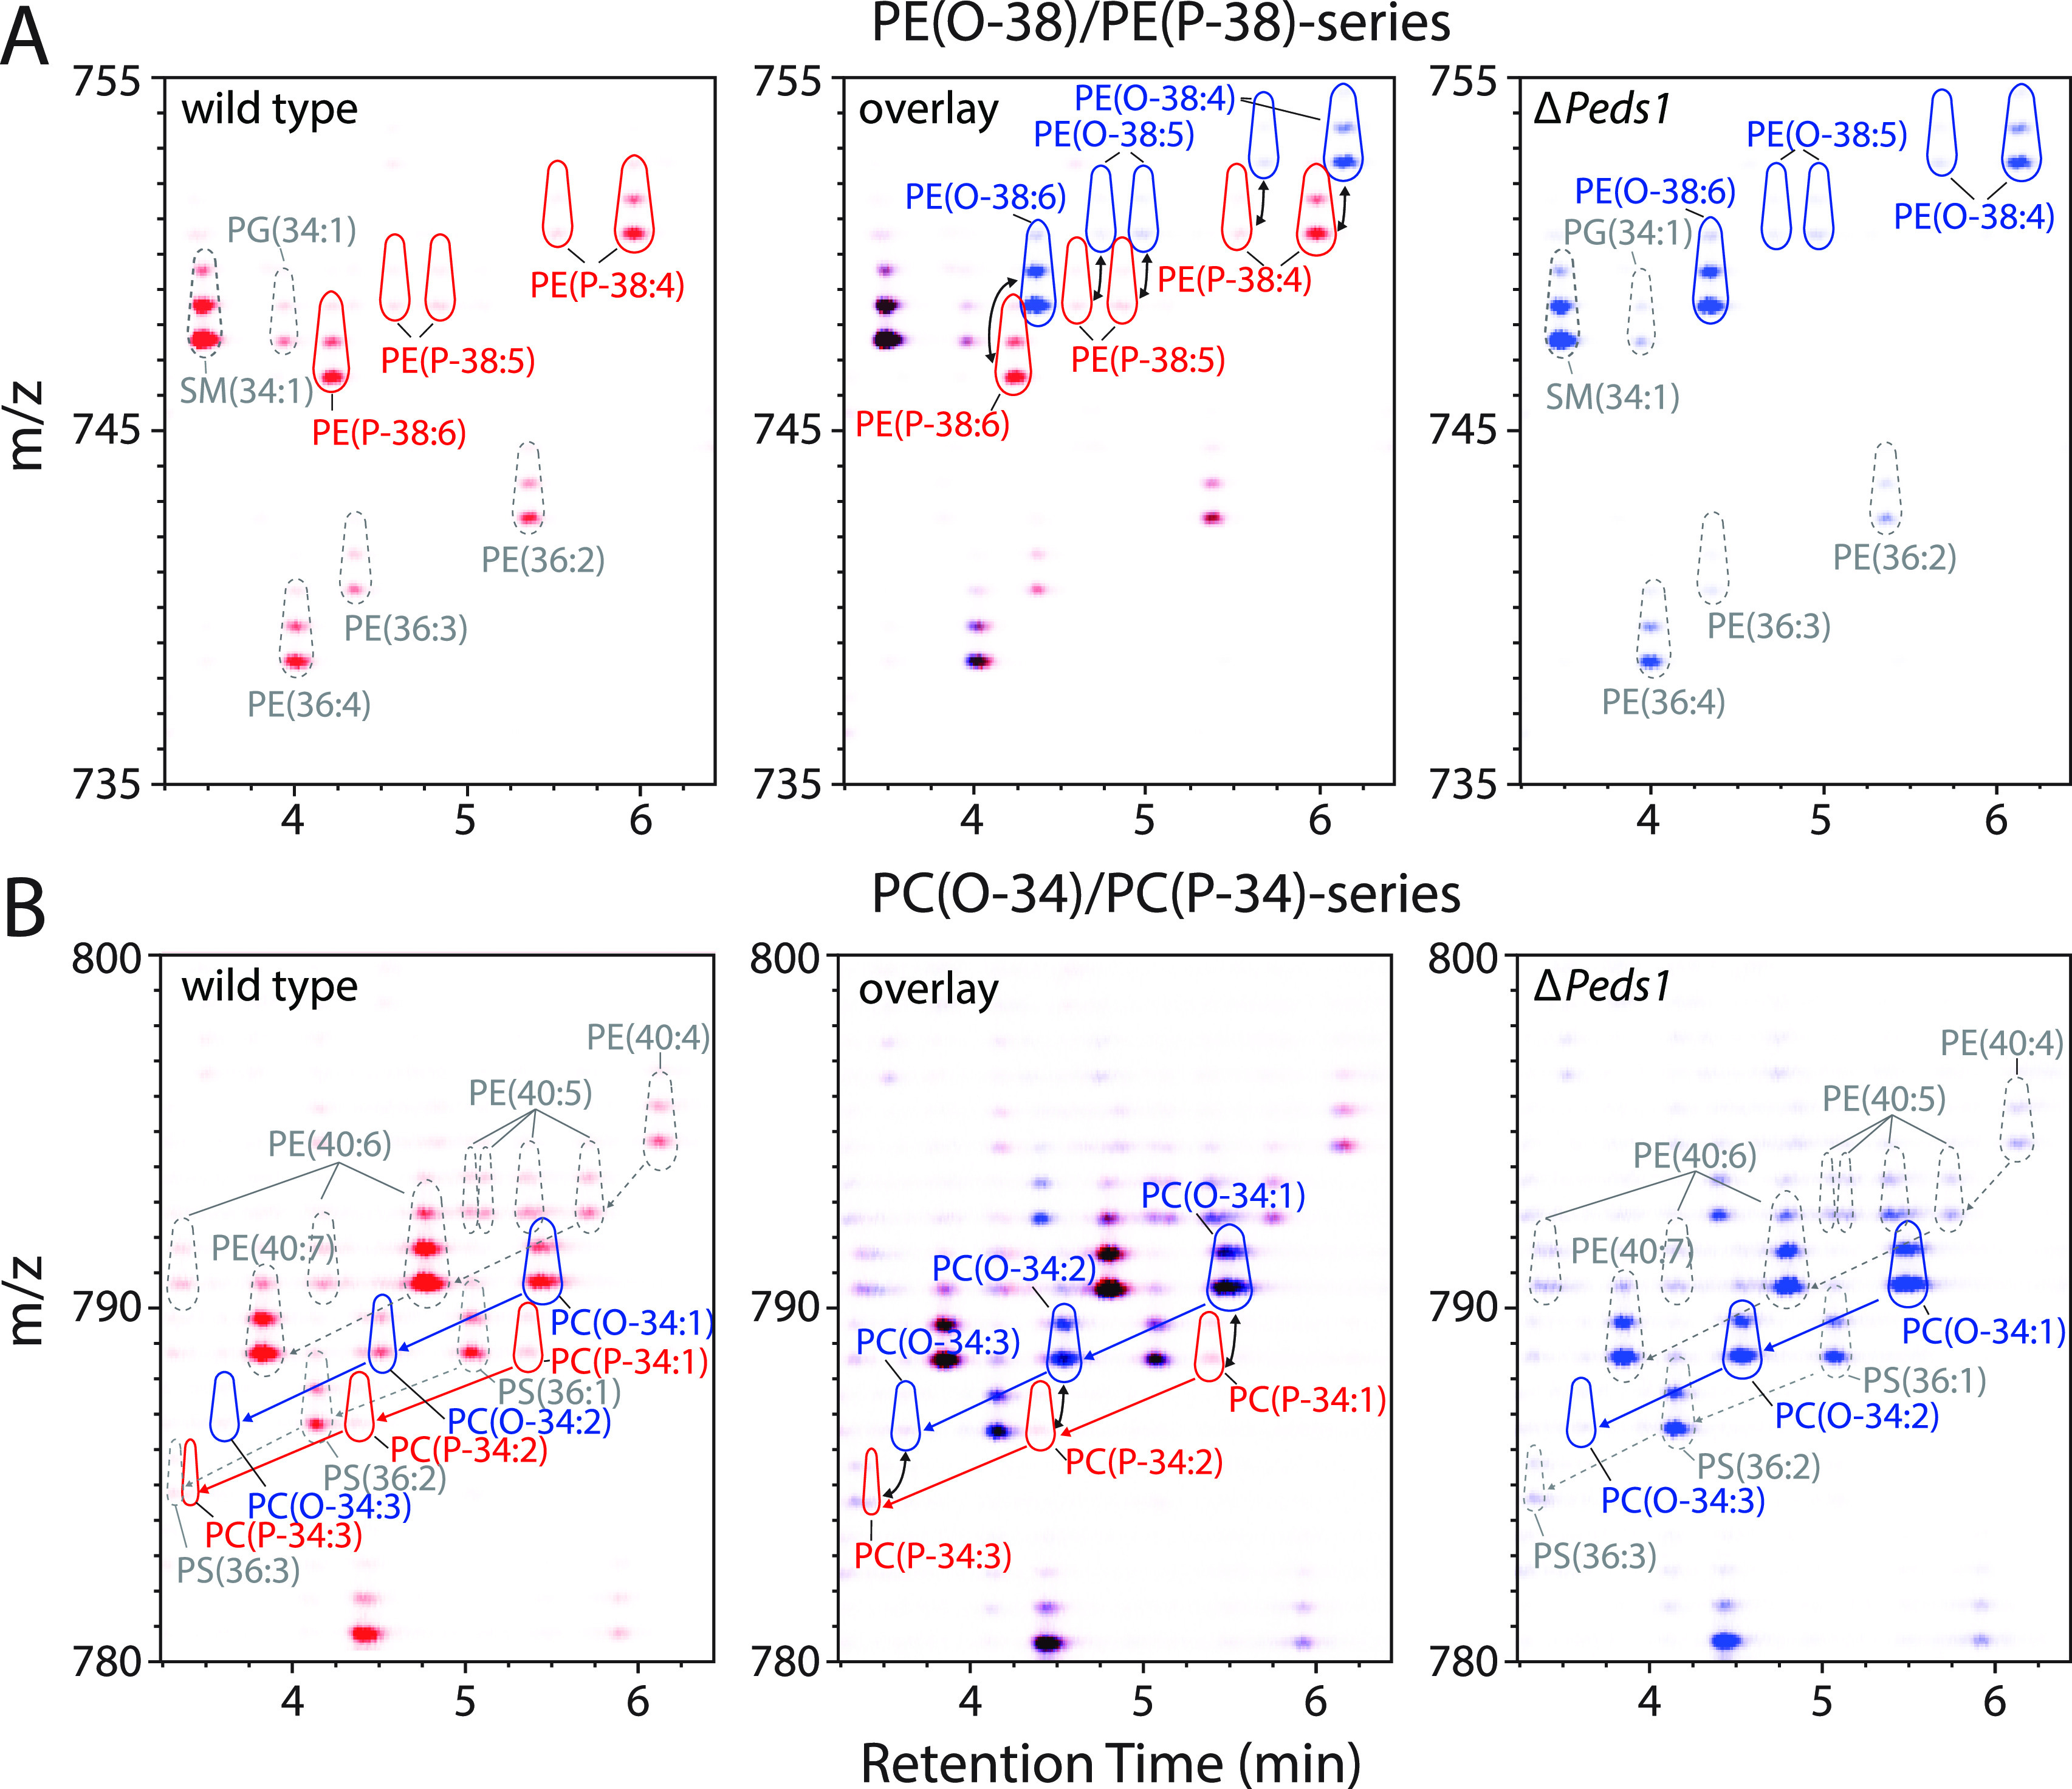
Annotation of plasmanyl and plasmenyl lipids by means of HPLC–MS/MS. (A) 2D illustration of the MS1 data for wild type lipid extracts in the retention time range of 3.25–6.5 min versus the mass window of 735–755 m/z. This section mainly includes PE ether lipids with 38 side chain carbons and diacyl-PEs with 36 side chain carbons. Signals recorded in wild type and Peds1-deficient (ΔPeds1) kidneys are shown in red (left panel) and blue (right panel), respectively. Color intensity corresponds to the respective signal intensities as assigned by MZmine 2. An overlay of wild type and ΔPeds1 is shown in the central panel, with no differences being indicated in black. Black arrows indicate pairs of 1-O-alkyl and 1-O-alk-1′-enyl species that only differ in the vinyl ether double bond. Dashed black lines show retention time differences between selected features. Outline color scheme: red: 1-O-alk-1′-enyl species; blue: 1-O-alkyl species; gray: diacyl species. (B) Same as (A) but for the mass window of 780–800 m/z. This section mainly includes PC ether lipids with 34 side chain carbons and diacyl-PEs with 40 side chain carbons. One representative example of at least three biological replicates is shown for (A) and (B).
Next, we systematically analyzed these analytical properties of alk-1′-enyl versus alkyl lipids. A series of PE and PC plasmanyl and plasmenyl species were identified, while no atypical ethers were observed.21 In wt kidney, mainly 1-O-alk-1′-enyl species were detected (Figure 3A, red trace), while in ΔPeds1 kidney, 1-O-alkyl ether lipids dominated (Figure 3A, blue trace). At 750.6 m/z, four isomeric ether lipid species were identified as [I] PE(O-18:1/20:4), [II] PE(P-18:0/20:4), [III] PE(O-16:0/22:5), and [IV] PE(P-16:0/22:4) (Figure 3A). This demonstrated that the Δ1 double bond in [II] and [IV] leads to a clearly different separation behavior than a double bond further back in the radyl residue at the sn-1 [I] or sn-2 [III] position.
Figure 3.

Discrimination between 1-O-alkyl and 1-O-alk-1′-enyl lipids by LC–MS/MS. (A) The isomeric ether lipids [I] PE(O-18:1/20:4), [II] PE(P-18:0/20:4), [III] PE(O-16:0/22:5), and [IV] PE(P-16:0/22:4) could be separated by reversed-phase chromatography. The vinyl ether caused a characteristic retention time (RT) shift different from other double bonds in radyl residues. Blue trace: ΔPeds1, red trace wild type. (B) Systematic analysis of relative RT differences for acyl chain elongation (+2 CH2), an additional acyl chain double bond (+1 DB (>Δ4)), additional vinyl ether double bonds (+1 DB (Δ1)), and between 1-O-alk-1′-enyl and 1-O-alkyl lipids (1-O-alk-1′-enyl/1-O-alkyl) in 6–10 relevant lipid species each (n = 12) showed the effects of double bonds and chain lengths on elution time. (C) Left panel: Collision-induced dissociation (CID) fragment spectra of [I] (blue) and [III] (red) are indistinguishable. One representative spectrum is shown each. Right panel: Structures of [I] and [III], with the differential double bond highlighted in red. (D) Left panel: CID fragment spectra of [II] (blue) and [IV] (red) are distinguishable. One representative spectrum is shown each. Right panel: Structures of [II] and [IV], with the differential double bond highlighted in red.
By a pairwise comparison of 6–10 matching lipid species (n = 12) we characterized the general separation behavior (Figure 3B and Table S4). The elongation of a lipid side chain by two carbons resulted in a mass shift of +28 and prolonged the retention time by 28.9 ± 2.7% (71.1 ± 7.4 s). One additional double bond in an acyl or alkyl side chain caused a mass shift of −2 and a shortening of the retention time by 23.4 ± 1.8% (56.8 ± 2.8 s). However, an additional vinyl ether double bond only reduced the retention time by 3.3 ± 1.2% (10.2 ± 3.9 s). In line with these observations, alk-1′-enyl lipids elute 17.0 ± 1.1% (49.5 ± 6.7 s) earlier than the corresponding isomeric alkyl species (45 and 57 s in Figure 3A). This effect was observed in PE as well as PC and was thus largely lipid-class-independent.
Furthermore, our analysis revealed that a series of isomeric 1-O-alk-1′-enyl and 1-O-alkyl lipids such as (I) and (II) have identical fragmentation patterns in negative ESI mode (Figure 3C). The almost exclusive fragmentation of the sn-2 position in ether lipids matched previous observations.22 Fragment spectra of PE ether lipids generated m/z signals corresponding either to the neutral loss of the sn-2 acyl chain or the sn-2 residue itself (Figure S2). Common PC ether lipid fragments were headgroup loss (−60 m/z) and low-intensity sn-2 acyl chain signals. It follows that fragment spectra allow double bonds to be assigned to either sn-1 or sn-2 residues (329.2 vs. 331.3 m/z fragments, Figure 3D).
Next, we utilized these characteristics to comprehensively annotate and quantify plasmanyl and plasmenyl lipids in male and female mouse tissues. Diacyl-PEs (Figure 4A, left panel) were largely similar between male and female as well as ΔPeds1 and wt kidneys. While 1-O-alk-1′-enyl-PEs (right panel) were abundant in the wt, they were absent in ΔPeds1 kidneys, where 1-O-alkyl-PE species (center panel) accumulated instead. A broad diversity of different 1-O-alk-1′-enyl-PE species could be identified in wt kidneys but only a few of which made up most of the plasmalogen mass (i.e., PE(P-36:4), PE(P-38:4), PE(P-38:6), PE(P-40:6), and PE(P-40:7)). The same molecular lipid species, only lacking the vinyl ether bond, were accumulated in ΔPeds1 kidneys. This shows a strong direct relationship between the availability of 1-O-alkyl precursors and 1-O-alk-1′-enyl products of the PEDS reaction.
Figure 4.

PE (A) and PC (B) in wild type and Peds1-deficient kidney. Lipid classes are subdivided into diacyl (left panel), 1-O-alkyl (center), and 1-O-alk-1′-enyl (right) species. Relative abundance profiles (in % of total PE or PC) are shown for wild type (wt) and Peds1-deficient (ΔPeds1) kidneys from female (♀) and male (♂) mice. Data is shown as mean ± SD (n = 3). Selected lipid species are labeled: “O-” and “P-” indicating 1-O-alkyl and 1-O-alk-1′-enyl species, respectively. Numbers in parentheses give the total number of side chain carbon atoms (carb), followed by the number of double bonds (DB). Please note the axis break in (A).
Like diacyl-PE, also diacyl-PC profiles were largely unaffected by the knockout of PEDS function (Figure 4B). However, in contrast to PEs, where plasmalogens dominated, we observed 13.5 times higher 1-O-alkyl-PC than 1-O-alk-1′-enyl-PC levels in wt kidneys. This is the quantified confirmation of the low wt levels of PC plasmalogens as depicted in the example of Figure 4B. Additionally, 1-O-alk-1′-enyl-PC levels were further depleted in ΔPeds1 samples.
Besides kidney (KID), also cerebellum (CBL), cerebrum (CER), colon (COL), testes (TES), spleen (SPL), lung (LUN), heart (HRT), ovaries (OVA), skeletal muscle (SKM), and liver (LIV) were analyzed and showed a comparable behavior (Dataset S1). Principal component analysis (PCA) of whole mouse lipid profiles (sequence of all tissue lipid profiles excluding TES and OVA) revealed that wt and ΔPeds1 were separated by component 1 (Dim1) capturing 48.2% of the variance (Figure 5A). Component 2 (Dim2) explained 17.5% of variance and distinguished between female (f) and male (m) mice, indicating that even without reproductive organs, enough gender-specific differences remain. A further PCA was conducted between the lipid profiles of all individual tissues (Figure 5B). The variance in this dataset was not explained by differences between female and male mice (left panel) but was mainly caused by differences in PEDS function (center panel) in combination with the nature of the respective tissue (right panel).
Next, we analyzed the total 1-O-alkyl and 1-O-alk-1′-enyl content in tissues. In wt mice, the cerebrum and cerebellum had the highest total ether lipid content (22.1 and 19.9% of total PC and PE, respectively), which to a large extent consisted of 1-O-alk-1′-enyl-PEs (Figure 5C, red bars). In contrast, the liver was almost depleted of ether lipids (0.7% of total PC and PE). PE ether lipids were notably more abundant than PC ether lipids across all tissues. Typically, only low levels of 1-O-alkyl-PE species were found, with the exception of the testes and ovaries. Increased levels of PC ether lipids were present as 1-O-alkyl species in kidney, spleen, and colon (Figure 5C, blue bars). Upon Peds1-deficiency, we observed a quantitative depletion of 1-O-alk-1′-enyl species (Figure 5C, gray bars). Instead, 1-O-alkyl-PEs accumulated in ΔPeds1 tissues (Figure 5C, light blue bars), partially to even higher levels than their 1-O-alk-1′-enyl counterparts in wt (e.g., spleen: 2-fold; testes: 2.9-fold; ovaries: 2.3-fold). A comparable effect, only at a significantly lower basic level, could also be measured with PCs. A consistent correlation between wt 1-O-alk-1′-enyl-PE and ΔPeds1 1-O-alkyl-PE species was found across tissues (Figure 5D). This showed that the profile similarity observed in kidney (Figure 4) follows a general, tissue-independent behavior.
The fragmentation behavior of PE lipids and a high MS/MS coverage allowed carrying out a radyl-chain-specific analysis in this lipid class. Side chain information for PEs was automatically extracted from 25 923 relevant fragment spectra and used to determine the overall acyl composition in diacyl-PEs and the sn-1/sn-2-specific substitution patterns in ether lipids. The sn-1 position of ether lipids was substituted mainly by 16:0, 18:0, and 18:1 fatty alcohols (Dataset S1). In contrast, the major sn-2 residues in plasmanyl- and plasmenyl-PEs were fatty acyls (FA) FA 20:4 and FA 22:6, which was in line with their described preference for arachidonic and docosahexaenoic acid (Dataset S1). Their distribution was, however, not homogeneous across tissues. While the cerebrum, cerebellum, and heart had high FA 22:6 and low FA 20:4 levels, we observed the opposite in the colon and spleen (Figure 5E). Furthermore, the content of FA 22:6 was considerably higher in male than in female kidneys, whereas FA 20:4 was more common in female kidneys (Figure 5E). This is in line with the differences we observed for PE(O-38:4), PE(O-38:6), PE(P-38:4), and PE(P-38:6) in the lipid composition of male and female kidneys (Figure 4).
Discussion
We report a reliable strategy for discriminating between plasmanyl and plasmenyl ether lipids in LC–MS/MS workflows, by exploiting their predictable chromatographic properties. Importantly, no specialized mass spectrometric infrastructure is required, and this strategy is compatible also with low-resolution instruments without fragmentation capacity. The consistent implementation of these principles can contribute strongly toward advancing with the core goals of comprehensive lipidomics, which are to achieve the highest possible coverage in terms of identification and quantification coupled with complete structural elucidation.
An exact assignment of ether lipid species is important, as they make up a considerable portion of the phospholipid mass in mammals as shown here (Figure 5B) and by others.2,1 Ether lipid deficiency is thought to be the main cause of the phenotypes of rhizomelic chondrodysplasia punctata and of Zellweger spectrum disorders.23,3 Still, the functional role of the vinyl ether double bond remains elusive.24 Also, it has not been studied in detail whether plasmalogen depletion—reported in some neurodegenerative diseases6—is accompanied by changes in 1-O-alkyl lipids in a parallel or opposing manner.24 The comprehensive analytical solution for studying ether lipids will enable a detailed exploration of the physiological functions of this lipid class.
A major bottleneck is the small number of commercially available ether lipid standards. Mild acid hydrolysis and chemical derivatization strategies can help with the assignment of 1-O-alkyl and 1-O-alk-1′-enyl lipids but do not provide any information about the behavior of the respective other bond type.25,26 Due to the recent identification of the Peds1 gene,4,5 plasmalogen-free and 1-O-alkyl ether lipid enriched sample material is now available. This made the here shown extensive validation of ether lipid annotation in LC–MS/MS experiments possible.
As demonstrated in Figures 2 and 3, 1-O-alkyl and 1-O-alk-1′-enyl lipids cannot be readily discriminated purely on the basis of exact mass and MS/MS fragment spectra. While positive ESI mode only provides limited side chain information,27 the here used negative mode gives specific details about the sn-1 and sn-2 residues by exploiting that 1-O-alkyls and 1-O-alk-1′-enyls are exceptionally resistant against fragmentation.22 In some cases, if the sn-1 residue does not contain a double bond, this lipid can be directly identified as an ether lipid. However, in general, further information is required to differentiate between a vinyl ether and a double bond further within the fatty acyl chain. We here demonstrated that a vinyl-ether-specific retention time offset can be utilized for this discrimination (Figure 3). Vinyl ether containing lipids can be readily separated for other isomers by approximately 50 s, even in short reversed-phase gradients. This behavior is predictable and was consistent for different molecular lipid species and lipid classes. This makes it immediately relevant for automated analyses of LC–MS/MS datasets and can be synergistically used in combination with further techniques, such as MS3 (or MS4) experiments.22 The benefits of this principle are demonstrated by its successful application in the lipidomics analysis of various mouse tissues (Figure 5).
The same physiological properties that functionally differentiate plasmalogens from other ether lipids—e.g. with regard to their impact on membrane fluidity28 —are potentially responsible for the different chromatographic behavior of these lipids. This was already exploited in 2D thin layer chromatography experiments29 but did not allow separation of 1-O-alkyl from diacyl lipids without additional chemical degradation procedures. Similarly, high-resolution 31P nuclear magnetic resonance cannot differentiate between 1-O-alkyl from diacyl lipids, although it recognizes plasmalogens as a separate feature.30
The annotation of ether lipids is often based on assumptions. This is not an isolated problem but also extends, for example, to the exact assignment of the sn-1 and sn-2 side chains or double bond positions.31 Although desirable, it is rare that such ambiguities are communicated precisely or are considered in data analysis.10 As a consequence, even in otherwise well-performed lipidomic studies, the abundant ether lipids are not mentioned.32 Even in the absence of supporting structural data, the identification as a plasmalogen is typically given priority over other ether lipids. Fortunately, this default preference is in agreement with the strong overrepresentation of 1-O-alk-1′-enyl-PE species as demonstrated by us (Figure 5) and elsewhere.33 In contrast, 1-O-alkyl species are more frequent for PC lipids (Figure 5). Special caution is also required when studying conditions that cause a disturbed plasmanyl and plasmenyl metabolism, such as oxidative stress, for which plasmalogens are especially susceptible,34,35 or the here presented extreme case of Peds1-deficiency.
PE and PC ether lipids have long been of scientific interest and were studied with special focus on 1-O-alk-1′-enyl species in various organisms and tissues.2,36 Several of these studies report conflicting results. For example, some studies report PE plasmalogens range from 12 to 48% of all phospholipids in mammalian heart tissue,36 while others claimed particularly high PC plasmalogen levels.23,37 This led to the conclusion that 1-O-alk-1′-enyl PEs are typically about one order of magnitude more abundant than 1-O-alk-1′-enyl PCs, with the exception of muscle and heart.38 In contrast, we observed a PE to PC plasmalogen ratio of 11.5 in murine heart. Many early studies relied on ether lipid quantification methods such as thin layer chromatography or selective plasmalogen cleavage and derivatization,39 which can easily be distorted by free fatty aldehydes.13 Indeed, in a more recent LC–MS/MS based study, a PE to PC plasmalogen ratio of about 20 was recorded in hearts from 8 month old rats.33 However, not all differences can and should be attributed to technical inaccuracies. It has been shown that tissue ether lipid levels—including heart—were highly responsive to dietary alkyl-glycerols.40 Thus, a strong nutritional component exists in addition to the species- and tissue-dependent differences. Furthermore, we find sex differences in several tissues of the mouse (Figure 5A/B). It is well-documented that lipid metabolism differs widely between the sexes.41 For ether lipid metabolism, a 3.6-fold difference in alkylglycerol monooxygenase in the livers of male versus female rats has been found.42 Much of this is still unexplored and requires precise, robust, and reliable analytical strategies for future functional studies.
While the total amount of plasmalogens can be readily measured by cleavage of the vinyl ether bond in hydrochloric acid and derivatization of the resulting aldehyde to a dimethyl acetal and MS detection40 or derivatization of a fluorescent hydrazone and fluorescence detection,13 1-O-alkyl lipid concentrations are monitored less frequently, although they may be equally important. As demonstrated in Figure 5C, PE ether lipids occur mostly as plasmalogens except for testes, where we find equal amounts of 1-O-alkyl and 1-O-alk-1′-enyl PE species. In testes, seminolipid is formed, which is a complex ether lipid without a vinyl ether bond and is required for male fertility and sperm maturation.43 Remarkably, male ΔPeds1 knockout mice are fertile,44,5 indicating that no vinyl ether bond is required for this function. In Peds1-deficient tissues such as spleen, testes, and ovaries 1-O-alkyl lipids accumulate to even higher levels than the total ether lipid content in the wild type (Figure 5B). This has to be accounted for when interpreting respective phenotypes. Since many 1-O-alkyl species only accumulate under specific conditions, it is particularly important that the analytical behavior shown here (Figure 3) can be utilized to discover and identify them.
Our work adds a promising and easy-to-implement strategy to map all types of ether lipids and understand their role in physiology and pathophysiology in the future, by allowing a more comprehensive characterization of their relative and absolute quantities and studying their regulation in healthy and diseased states.
Acknowledgments
The authors thank Petra Loitzl, Nina Madl, Nico Schöpf, and Nadine Heinrich for expert technical help. This work was supported by a Medical University of Innsbruck, Austria Start grant to M.A.K. as well as the Austrian Science Fund (FWF) projects P29551 to E.R.W, P30800 to K.W., and P33333 to M.A.K. We thank the Wellcome Trust Sanger Institute Mouse Genetics Project (Sanger MPG) and its funders for providing the mutant mouse line Tmem189tm1a(KOMP)Wtsi and INFRAFRONTIER/EMMA (https://www.infrafrontier.eu/). Funding information may be found at https://www.sanger.ac.uk/science/collaboration/mouse-resource-portal and associated primary phenotypic information at https://www.mousephenotype.org/.
Supporting Information Available
The Supporting Information is available free of charge at https://pubs.acs.org/doi/10.1021/acs.analchem.0c01933.
Supporting Methods: Mouse breeding, sampling, preparation, LC–MS/MS method; Supporting Dataset: S1 Data repository; Supporting Tables: S1 HPLC method details, S2 MS/MS method details, S3 PC/PE peak list, S4 Relative retention time differences; Supporting Figures: S1 Plasmalogen content, S2 Ether lipid fragment spectrum (PDF)
Author Contributions
J.K., E.R.W., J.Z., K.W., and M.A.K. designed the study; J.K., S.S., and K.L. performed experimental work; J.K. and M.A.K. analyzed data; M.A.K., E.R.W., J.K., K.W., and Y.W. wrote the paper with input from all authors.
The authors declare no competing financial interest.
Supplementary Material
References
- Nagan N.; Zoeller R. A. Prog. Lipid Res. 2001, 40, 199. 10.1016/S0163-7827(01)00003-0. [DOI] [PubMed] [Google Scholar]
- Braverman N. E.; Moser A. B. Biochim. Biophys. Acta, Mol. Basis Dis. 2012, 1822, 1442. 10.1016/j.bbadis.2012.05.008. [DOI] [PubMed] [Google Scholar]
- Waterham H. R.; Ferdinandusse S.; Wanders R. J. A. Biochim. Biophys. Acta, Mol. Cell Res. 2016, 1863, 922. 10.1016/j.bbamcr.2015.11.015. [DOI] [PubMed] [Google Scholar]
- Gallego-García A.; Monera-Girona A. J.; Pajares-Martínez E.; Bastida-Martínez E.; Pérez-Castaño R.; Iniesta A. A.; Fontes M.; Padmanabhan S.; Elías-Arnanz M. Science (Washington, DC, U. S.) 2019, 366, 128. 10.1126/science.aay1436. [DOI] [PubMed] [Google Scholar]
- Werner E. R.; Keller M. A.; Sailer S.; Lackner K.; Koch J.; Hermann M.; Coassin S.; Golderer G.; Werner-Felmayer G.; Zoeller R. A.; Hulo N.; Berger J.; Watschinger K. Proc. Natl. Acad. Sci. U. S. A. 2020, 117, 7792. 10.1073/pnas.1917461117. [DOI] [PMC free article] [PubMed] [Google Scholar]
- Han X.; Holtzman D. M.; McKeel D. W. J. Neurochem. 2001, 77, 1168. 10.1046/j.1471-4159.2001.00332.x. [DOI] [PubMed] [Google Scholar]
- Keller M. A.; Zander U.; Fuchs J. E.; Kreutz C.; Watschinger K.; Mueller T.; Golderer G.; Liedl K. R.; Ralser M.; Kräutler B.; Werner E. R.; Marquez J. A. Nat. Commun. 2014, 10.1038/ncomms5439. [DOI] [PMC free article] [PubMed] [Google Scholar]
- Watschinger K.; Keller M. A.; Golderer G.; Hermann M.; Maglione M.; Sarg B.; Lindner H. H.; Hermetter A.; Werner-Felmayer G.; Konrat R.; Hulo N.; Werner E. R. Proc. Natl. Acad. Sci. U. S. A. 2010, 107, 13672. 10.1073/pnas.1002404107. [DOI] [PMC free article] [PubMed] [Google Scholar]
- Wu L.-C.; Pfeiffer D. R.; Calhoon E. A.; Madiai F.; Marcucci G.; Liu S.; Jurkowitz M. S. J. Biol. Chem. 2011, 286, 24916. 10.1074/jbc.M111.247163. [DOI] [PMC free article] [PubMed] [Google Scholar]
- Holčapek M.; Liebisch G.; Ekroos K. Anal. Chem. 2018, 90, 4249. 10.1021/acs.analchem.7b05395. [DOI] [PubMed] [Google Scholar]
- Liebisch G.; Ekroos K.; Hermansson M.; Ejsing C. S. Biochim. Biophys. Acta, Mol. Cell Biol. Lipids 2017, 1862, 747. 10.1016/j.bbalip.2017.02.013. [DOI] [PubMed] [Google Scholar]
- Owens K. Biochemical journal 1966, 100, 354. 10.1042/bj1000354. [DOI] [PMC free article] [PubMed] [Google Scholar]
- White J. K.; Gerdin A.-K.; Karp N. A.; Ryder E.; Buljan M.; Bussell J. N.; Salisbury J.; Clare S.; Ingham N. J.; Podrini C.; et al. Sanger Institute Mouse Genetics Project , Genome-wide generation and systematic phenotyping of knockout mice reveals new roles for many genes. Cell 2013, 154, 452–464. 10.1016/j.cell.2013.06.022. [DOI] [PMC free article] [PubMed] [Google Scholar]
- Werner E. R.; Keller M. A.; Sailer S.; Seppi D.; Golderer G.; Werner-Felmayer G.; Zoeller R. A.; Watschinger K. J. Lipid Res. 2018, 59, 901. 10.1194/jlr.D080283. [DOI] [PMC free article] [PubMed] [Google Scholar]
- Oemer G.; Lackner K.; Muigg K.; Krumschnabel G.; Watschinger K.; Sailer S.; Lindner H.; Gnaiger E.; Wortmann S. B.; Werner E. R.; Zschocke J.; Keller M. A. Proc. Natl. Acad. Sci. U. S. A. 2018, 115, 4158. 10.1073/pnas.1719407115. [DOI] [PMC free article] [PubMed] [Google Scholar]
- Oemer G.; Koch J.; Wohlfarter Y.; Alam M. T.; Lackner K.; Sailer S.; Neumann L.; Lindner H. H.; Watschinger K.; Haltmeier M.; Werner E. R.; Zschocke J.; Keller M. A. Cell Rep. 2020, 30, 4281. 10.1016/j.celrep.2020.02.115. [DOI] [PubMed] [Google Scholar]
- Pluskal T.; Castillo S.; Villar-Briones A.; Oresic M. BMC Bioinf. 2010, 10.1186/1471-2105-11-395. [DOI] [PMC free article] [PubMed] [Google Scholar]
- Fischer B.mzR; Bioconductor, 2017.
- R Core Team . R: A language and environment for statistical computing; R Foundation for Statistical Computing: Vienna, Austria, 2020.
- Wickham H.; Averick M.; Bryan J.; Chang W.; McGowan L.; François R.; Grolemund G.; Hayes A.; Henry L.; Hester J.; Kuhn M.; Pedersen T.; Miller E.; Bache S.; Müller K.; Ooms J.; Robinson D.; Seidel D.; Spinu V.; Takahashi K.; Vaughan D.; Wilke C.; Woo K.; Yutani H. JOSS 2019, 4, 1686. 10.21105/joss.01686. [DOI] [Google Scholar]
- Mass resolving power in mass spectrometry. In IUPAC Compendium of Chemical Terminology; Nič M., Jirát J., Košata B., Jenkins A., McNaught A., Eds.; IUPAC: Research Triagle Park, NC, 2009. [Google Scholar]
- Ivanova P. T.; Milne S. B.; Brown H. A. J. Lipid Res. 2010, 51, 1581. 10.1194/jlr.D003715. [DOI] [PMC free article] [PubMed] [Google Scholar]
- Hsu F.-F.; Turk J. J. Am. Soc. Mass Spectrom. 2007, 18, 2065. 10.1016/j.jasms.2007.08.019. [DOI] [PMC free article] [PubMed] [Google Scholar]
- Heymans H. S.; Schutgens R. B.; Tan R.; van den Bosch H.; Borst P. Nature 1983, 306, 69. 10.1038/306069a0. [DOI] [PubMed] [Google Scholar]
- Dorninger F.; Forss-Petter S.; Berger J. FEBS Lett. 2017, 591, 2761. 10.1002/1873-3468.12788. [DOI] [PMC free article] [PubMed] [Google Scholar]
- Fhaner C. J.; Liu S.; Ji H.; Simpson R. J.; Reid G. E. Anal. Chem. 2012, 84, 8917. 10.1021/ac302154g. [DOI] [PMC free article] [PubMed] [Google Scholar]
- Ryan E.; Reid G. E. Acc. Chem. Res. 2016, 49, 1596. 10.1021/acs.accounts.6b00030. [DOI] [PubMed] [Google Scholar]
- Han X.Lipidomics: Comprehensive Mass Spectrometry of Lipids; John Wiley & Sons Inc: Hoboken, NJ, 2016. [Google Scholar]
- Koivuniemi A. FEBS Lett. 2017, 591, 2700. 10.1002/1873-3468.12754. [DOI] [PubMed] [Google Scholar]
- Zoeller R. A.; Grazia T. J.; LaCamera P.; Park J.; Gaposchkin D. P.; Farber H. W. American journal of physiology-Heart and circulatory physiology 2002, 283, H671. 10.1152/ajpheart.00524.2001. [DOI] [PubMed] [Google Scholar]
- Kimura T.; Kimura A. K.; Ren M.; Berno B.; Xu Y.; Schlame M.; Epand R. M. Biochemistry 2018, 57, 2162. 10.1021/acs.biochem.8b00042. [DOI] [PMC free article] [PubMed] [Google Scholar]
- Rustam Y. H.; Reid G. E. Anal. Chem. 2018, 90, 374. 10.1021/acs.analchem.7b04836. [DOI] [PubMed] [Google Scholar]
- Jain M.; Ngoy S.; Sheth S. A.; Swanson R. A.; Rhee E. P.; Liao R.; Clish C. B.; Mootha V. K.; Nilsson R. American journal of physiology-Endocrinology and metabolism 2014, 306, E854. 10.1152/ajpendo.00371.2013. [DOI] [PMC free article] [PubMed] [Google Scholar]
- Pradas I.; Huynh K.; Cabré R.; Ayala V.; Meikle P. J.; Jové M.; Pamplona R. Front. Physiol. 2018, 10.3389/fphys.2018.01165. [DOI] [PMC free article] [PubMed] [Google Scholar]
- Jansen G. A.; Wanders R. J. J. Inherited Metab. Dis. 1997, 20, 85. 10.1023/A:1005321910248. [DOI] [PubMed] [Google Scholar]
- Lessig J.; Fuchs B. Curr. Med. Chem. 2009, 16, 2021. 10.2174/092986709788682164. [DOI] [PubMed] [Google Scholar]
- Snyder F., Ed. Ether lipids: chemistry and biology; Academic Press: New York, 1972. [Google Scholar]
- Panganamala R. V.; Horrocks L. A.; Geer J. C.; Cornwell D. G. Chem. Phys. Lipids 1971, 6, 97. 10.1016/0009-3084(71)90031-4. [DOI] [PubMed] [Google Scholar]
- Farooqui A. A.; Horrocks L. A. Neuroscientist 2001, 7, 232. 10.1177/107385840100700308. [DOI] [PubMed] [Google Scholar]
- Gottfried E. L.; Rapport M. M. J. Biol. Chem. 1962, 237 (2), 329–333. [PubMed] [Google Scholar]
- Brites P.; Ferreira A. S.; Ferreira da Silva T.; Sousa V. F.; Malheiro A. R.; Duran M.; Waterham H. R.; Baes M.; Wanders R. J. A. PLoS One 2011, 6, e28539. 10.1371/journal.pone.0028539. [DOI] [PMC free article] [PubMed] [Google Scholar]
- Ethun K. Sex and Gender Differences in Body Composition, Lipid Metabolism, and Glucose Regulation. Sex Differences in Physiology 2016, 145. 10.1016/B978-0-12-802388-4.00009-4. [DOI] [Google Scholar]
- Werner E. R.; Hermetter A.; Prast H.; Golderer G.; Werner-Felmayer G. J. Lipid Res. 2007, 48, 1422. 10.1194/jlr.D600042-JLR200. [DOI] [PMC free article] [PubMed] [Google Scholar]
- Tanphaichitr N.; Kongmanas K.; Faull K. F.; Whitelegge J.; Compostella F.; Goto-Inoue N.; Linton J.-J.; Doyle B.; Oko R.; Xu H.; Panza L.; Saewu A. Prog. Lipid Res. 2018, 72, 18. 10.1016/j.plipres.2018.08.002. [DOI] [PMC free article] [PubMed] [Google Scholar]
- Ingham N. J.; Pearson S. A.; Vancollie V. E.; Rook V.; Lewis M. A.; Chen J.; Buniello A.; Martelletti E.; Preite L.; Lam C. C.; Weiss F. D.; Powis Z.; Suwannarat P.; Lelliott C. J.; Dawson S. J.; White J. K.; Steel K. P. PLoS Biol. 2019, 17, e3000194. 10.1371/journal.pbio.3000194. [DOI] [PMC free article] [PubMed] [Google Scholar]
Associated Data
This section collects any data citations, data availability statements, or supplementary materials included in this article.
Supplementary Materials
Data Availability Statement
Datasets have been deposited (see Dataset S1).