Abstract
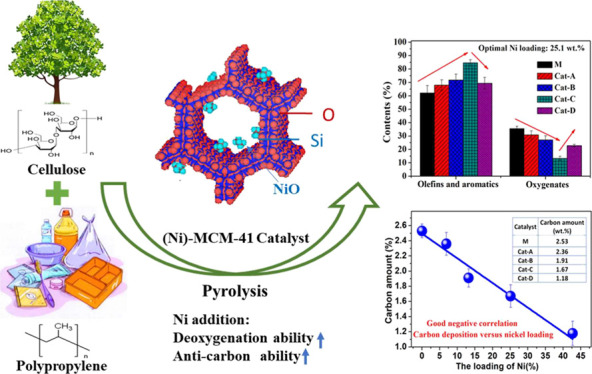
Catalytic fast co-pyrolysis of biomass and plastic is an effective method to achieve high-quality bio-oil production. In this work, (Ni)-MCM-41 catalysts with different Ni loadings were prepared and characterized in detail by using a variety of advanced analytical techniques, and the effects on the catalytic performance were analyzed by micropyrolysis with gas chromatography mass spectrometry (Py-GC/MS) and thermogravimetry-Fourier transform infrared spectroscopy (TG-FTIR) methods. The results showed that an appropriate amount of Ni addition can effectively modulate the physicochemical properties of MCM-41. For a Ni loading of 25.1 wt % (Cat-C), the catalyst showed an optimal catalytic performance, a decrease in the proportion of oxygenated compounds in the product from 35.6 (MCM-41) to 13.4%, and an increase in the relative total amount of olefins plus aromatics from 62.2 (MCM-41) to 84.6%. The excellent catalytic performance of Cat-C can be ascribed to a balancing of its proper physical structural properties, appropriate acidity, strong metal–carrier interaction, high metal dispersion, and excellent compatibility balance between active and acidic sites.
1. Introduction
As an important part of renewable energy, biomass can help humans to alleviate their reliance on fossil energy resources and mitigate environmental problems brought about by the use of fossil energy.1−4 Pyrolysis is an efficient and economical thermal treatment technology to convert biomass into usable liquid bio-oil and valuable chemicals. Chen et al.5 proposed the concept of the effective hydrogen-to-carbon ratio (eq 1) to represent the relative hydrogen content of different raw materials.
| 1 |
According to a previous report, when the H/Ceff ratio of the feedstocks < 1.0, it cannot be economically converted into liquid hydrocarbon products. The H/Ceff ratio of biomass is only between 0 and 0.3,6 indicating that it is hydrogen-deficient. Due to the hydrogen deficiency characteristics of biomass feedstocks, bio-oil shows high oxygen content, high acidity, a low-heating value, thermal instability, and high corrosiveness and viscosity, which greatly limits its application as a fuel.7−9 Co-pyrolysis of biomass and hydrogen-rich materials, such as waste plastics, with the addition of a zeolite catalyst, is an important solution for solving the above problems of bio-oil.10 Biomass and waste plastics are the chief constituents of municipal solid waste and agricultural waste; the cellulose polymer is the most abundant component in biomass, and polypropylene (PP) accounts for a large proportion of waste plastics.11−14 Therefore, it is of great significance to study the synergism mechanisms for co-pyrolysis of cellulose and PP. Previous studies have shown that cellulose and PP have no significant synergism effect in simple mixing and that the addition of MCM-41 can reduce the decomposition temperature of PP, increasing the overlap range for cellulose and PP pyrolysis temperature intervals.15,16 This can significantly increase the intermolecular synergistic reaction with the help of catalysts. For the microporous materials, HZSM-5 has been shown to be effective for aromatic production in the pyrolysis process. However, a very small pore size (0.54–0.56 nm) of HZSM-5 allows only small molecules to pass through, blocks large molecules, increases mass transfer resistance, and impedes further reactions of macromolecules.17 The abundant acidity and micropore structure increased the yields to noncondensable gas, water, and coke while reducing the liquid yields.18 Besides, for the micropore structure of HZSM-5, the bigger plastic molecules cannot access the inner active sites, and the catalytic activity of HZSM-5 is limited. In contrast, MCM-41 has a mesoporous structure with large pore size, with pore diameters ranging from approximately 2 to 10 nm, and a high specific surface area of more than 1000 m2·g–1.19,20 These characteristics are beneficial for the interaction between the reactants and the active sites and help to facilitate the reaction of macromolecules, provide sufficient surface sites, reduce the adsorption, separation, and diffusion resistance of molecules in the pores, and enhance the internal mass transfer.15,21 Therefore, the MCM-41 zeolite has been identified as an excellent potential catalyst for the co-pyrolysis of biomass and waste plastics.
However, MCM-41 is an all-silica zeolite, the Si–OH groups on its surface can only provide a small amount of weak acid sites, and its deoxidation and cracking ability is limited in the pyrolysis process.22 Therefore, many studies have been conducted by adopting a metal modification method, which can not only modulate the structure and acidity of a zeolite catalyst but also improve the catalytic performance and stability of the catalyst. In addition, this method becomes an emerging upgrade method for bio-oil in the field of biomass thermochemical treatment.23 Karnjanakom et al.19 reported Cu-modified catalysts, i.e., Cu/MCM-41 and Cu/KIT-6, which were used in the upgrading of bio-oil, and found that the addition of Cu can effectively modulate the acidity and textural properties of the zeolite and improve the deoxygenation capacity. Metal-modified zeolite catalysts can be used not only for upgrading bio-oil but also for the co-pyrolysis of biomass and plastics. Li et al.24 have demonstrated that Ga-containing zeolites can increase the yield of high-value petrochemicals in the co-pyrolysis of biomass and LDPE and reduce the yield of low-value alkanes and harmful polyaromatic hydrocarbons. Chi et al.15 have reported that the Al-containing MCM-41 zeolite can increase the yield of olefins and aromatics during the co-pyrolysis of cellulose and polypropylene due to the abundant acid centers in Al-MCM-41, where the hydrocarbon yield reaches 78.2%. Therefore, the metal modification method can be selected in the co-pyrolysis process of cellulose and polypropylene to further boost the catalytic performance of the MCM-41 catalyst to improve the deoxygenation and anti-carbon ability for producing more olefins and aromatics.
Nickel is an attractive transition metal because it is comparatively inexpensive and readily available. Nickel can also help to modulate the physicochemical properties of zeolites. Furthermore, a Ni-modified catalyst can promote oligomerization and dehydration reactions and increase the hydrodeoxygenation capacity.8,25 Ni-based catalysts are also effective for the cracking processes of O–H, C–H, and C–C.21,26 Zhao and Lercher8 have demonstrated that Ni-ZSM-5 is an efficient catalyst for the hydrodeoxygenation (HDO) process of raw pyrolysis oils. Liu et al.25 also reported a Ni/Hβ catalyst for an HDO process to produce high-density poly-cycloalkanes over a dual-bed catalyst system. These researchers also reported the effects of different preparation conditions on the performance of the catalyst. Yung et al.23 studied the impact of pretreatment and Ni loading of the Ni/ZSM-5 catalyst on the upgrading performance of pine pyrolysis vapors using a molecular beam mass spectrometer and suggested that the addition of Ni can modulate the performance of the zeolite catalyst, improve the total yield of aromatics, and reduce the coke deposit, enhancing the stability of the catalyst. The effect of the Ni-loading amount and location (inside or outside the channels) in Ni/MCM-41 catalysts on the hydrogen production performance in biomass gasification has also been studied.27,28 Additionally, the improvements in the catalytic performance in terms of tar reforming, biomass gasification, and pyrolysis oil upgrading of the zeolite catalyst due to metal nickel modification have also been reported elsewhere.21,29−33 However, the effect of Ni addition on the catalytic performance of co-pyrolysis of cellulose and PP catalyzed by MCM-41 has not yet been reported. Therefore, the purpose of this study was to explore the effect of Ni modification on the catalytic performance of co-pyrolysis of cellulose and PP catalyzed by the MCM-41 catalyst and to provide certain results for research into the upgrading of pyrolysis oil.
In this work, the influence of different amounts of Ni addition on the physicochemical properties of (Ni)-MCM-41 was characterized. The effect of the addition of metallic nickel on the selective product distribution and anti-carbon ability of different catalysts was analyzed, and the optimal Ni loading of the catalyst was selected. Finally, based on the distribution of the products for different samples combined with the physicochemical properties of the (Ni)-MCM-41 catalyst, the most likely reaction pathways were proposed.
2. Results and Discussion
2.1. Physical and Chemical Properties of (Ni)-MCM-41 Catalysts
The XRD results can be distinguished into two patterns, i.e., small-angle and wide-angle X-ray powder diffraction, with different ranges of 2θ. For the small-angle X-ray powder diffraction (SAXRD) of the MCM-41 zeolite, the 2θ range around 2.3° can be ascribed to the (1 0 0) reflections of the MCM-41 zeolite; the 2θ range centered at ∼4.4 and ∼5.2° is ascribed to the low intensity peaks for the (1 1 0) and (2 0 0) of the MCM-41 zeolite, respectively. These are features of a highly ordered mesoporous zeolite structure with a hexagonal array of pores.20,34−36Figure 1a shows the small-angle X-ray powder diffraction data for the five catalysts. It can be seen that no shifts in the SAXRD peaks were observed, but with the introduction of Ni, the intensity decreased slightly, indicating that the addition of Ni did not affect the ordered structure of the MCM-41 support; however, the crystallinity of MCM-41 was slightly reduced.
Figure 1.
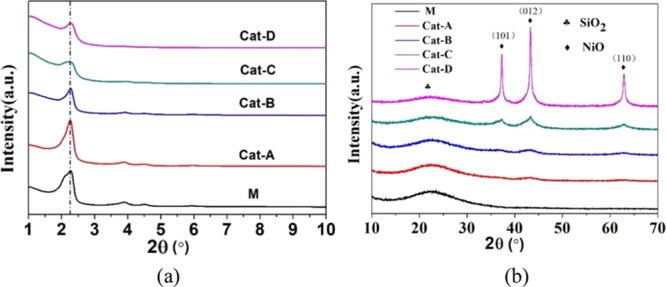
XRD patterns of Ni loaded catalysts: (a) small angle and (b) wide angle.
For the wide-angle X-ray powder diffraction (WAXRD) of the (Ni)-MCM-41 catalyst, the diffraction peaks at approximately 23° can be assigned to amorphous silica peaks, and the diffraction peaks centered around 37.5, 43.4, and 63.0° were attributed to the NiO (1 0 1), NiO (0 1 2), and NiO (1 1 0) crystalline phases.22,37,38Figure 1b shows the wide-angle X-ray powder diffraction data for the five catalysts. With increasing nickel loading from 6.9 to 25.1 wt %, the intensity of the characteristic diffraction peaks corresponding to crystalline NiO gradually increased. However, due to the low nickel loading, the characteristic diffraction peaks are weak and cannot be accurately determined by XRD. When the Ni loading was increased to 42.7 wt % (Cat-D), three signal peaks centered on 37.5, 43.4, and 63.0° showed a significant increase, indicating that the size and number of nickel oxide particles became bigger with the increase in Ni loading. Higher Ni loading led to the formation of bigger NiO particles on the support, as also found by Carraro et al.20
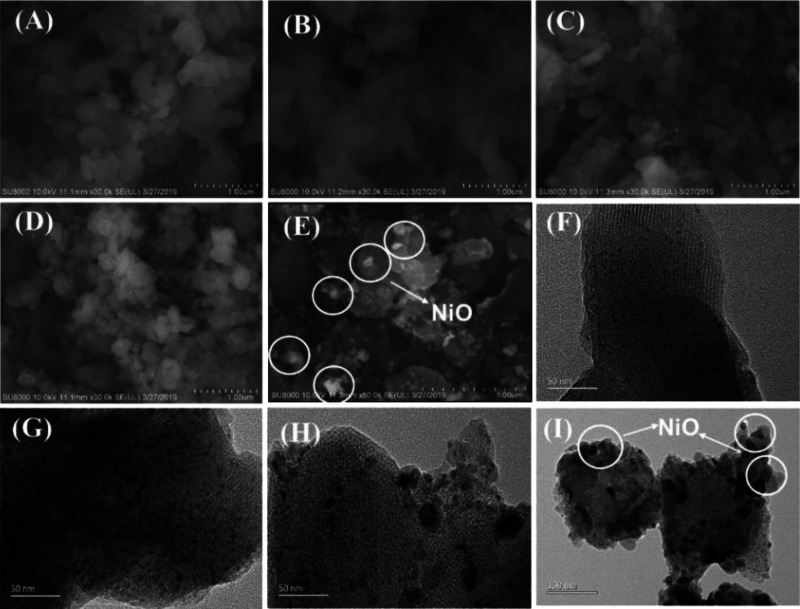
SEM and TEM images of the five catalysts were used to characterize the morphologies of the catalysts (Figure 2). For Cat-A, B, and C, most of the loaded NiO was well distributed on the surface of the MCM-41 with sizes of less than 20 nm. With increased Ni loading, the number of nano-NiO particles increased. However, a few bulk nickel oxides could be observed on the surface of MCM-41. When the loading amount of Ni was increased to 42.7 wt % (Cat-D), a large quantity of bulk NiO particles was found to be distributed on the exterior of the MCM-41 support. The increasing number of NiO crystals enhanced the signal intensity of the WAXRD of NiO shown in Figure 1b. The results show that excess loading not only increases the number of NiO crystal particles but also leads to aggregation and sintering of NiO particles on the MCM-41 support, resulting in the formation of more bulk NiO particles.
Figure 2.
SEM and TEM images of different catalysts. Panels (A–E) are SEM images for M, Cat-A, Cat-B, Cat-C, and Cat-D. Panels (F–I) are TEM images for Cat-A, Cat-B, Cat-C, and Cat-D.
Figure 3 shows the N2 adsorption–desorption isotherms and pore size distribution for the (Ni)-MCM-41 catalysts. With increasing relative pressure (P/P0), N2 adsorption continually increases (Figure 3a). When P/P0 reaches 0.3–0.4, N2 adsorption shapes show an obvious jump. After that, the increasing behavior changes subtly. All these samples exhibited IUPAC type-IV adsorption isotherms, which can be attributed to a typical mesoporous structure.34,39 All five catalysts have a narrow pore size distribution with an average pore size of approximately 3 nm (Figure 3b). The textural properties of the five catalysts are summarized in Table 1. Ni addition can adversely affect the physical structure of the catalyst, resulting in a decrease in the specific surface area and pore volume of the catalyst. With increased Ni loading, the pore volume, pore diameter, and specific surface area of the catalyst decreased successively. For Cat-A, B, and C, the specific surface area decreased gradually from 100 (M) to 85, 77, and 71%, and the pore volume decreased from 100 (M) to 84, 75, and 67%, respectively. Especially, when the loading of Ni was increased to 42.7 wt % (Cat-D), the pore volume, pore diameter, and specific surface area of the catalyst decreased sharply: the specific surface area decreased from 100 (M) to 48%, and the pore volume decreased from 100 (M) to 31%.
Figure 3.
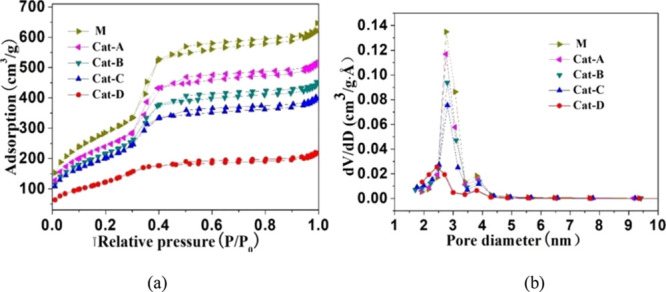
(a) N2 adsorption–desorption isotherms and (b) pore size distribution of (Ni)-MCM-41 catalysts.
Table 1. Textural Properties of the Five Catalysts.
| catalyst | Ni amount (wt %) | SBET(N2) (m2·g–1) | dporea (nm) | Vtotalb (cm3·g–1) |
|---|---|---|---|---|
| M | 0.0 | 1043.4 | 3.09 | 1.01 |
| Cat-A | 6.9 | 887.1 | 3.11 | 0.85 |
| Cat-B | 13.2 | 802.3 | 3.08 | 0.76 |
| Cat-C | 25.1 | 744.7 | 3.05 | 0.68 |
| Cat-D | 42.7 | 500.6 | 2.95 | 0.31 |
Average pore diameter.
Total pore volume.
Based on the present SEM/TEM and BET observations and previous studies in the literature,21,38,40−42 it is possible to propose the structural evolution model that describes the distribution of NiO particles in the MCM-41 channel as the Ni loading increases. This schematic diagram is illustrated in Figure 4. During the wet-impregnation process, Ni2+ could bond to the silanol groups on the wall of MCM-41. After calcination, NiO particles were formed and dispersed in the porous skeleton of MCM-41. An appropriate amount of Ni loading shows high dispersity and small nanoparticles, which will not significantly damage the physical structure of the MCM-41 support, such as Cat-A, B, and C. However, there is a turning point in the effect of the loading of metallic nickel on the structure properties of the catalyst (Cat-D): overloading of Ni on MCM-41 results in severe sintering of NiO particles, as shown in Figure 2E,I.
Figure 4.
Schematic illustration of the distribution of NiO particles in MCM-41 channels.
For MCM-41 hexagonal cylindrical holes (Figure 4), there is a linear relationship between the logarithmic pore volume and the logarithmic pore diameter. For Cat-A, B, and C, a good linear correlation of ln(dpore) vs ln(Vtotal) is shown (Figure 5). Meanwhile, for Cat-D, the relationship of the ln(dpore) vs ln(Vtotal) deviates from the theoretical value, and its pore volume is greatly reduced (Figure 5). This is due to the block of the aperture of the catalyst by the sintered large NiO particles. Excessive nickel loading will significantly destruct the physical structure of the catalyst, reduce the specific surface area and pore volume significantly, and increase the mass transfer resistance during the reaction. On the other hand, many sintered large bulk NiO particles appeared, which will lead the reduction of available acid and active metal sites, reducing the catalytic performance of the catalyst.
Figure 5.
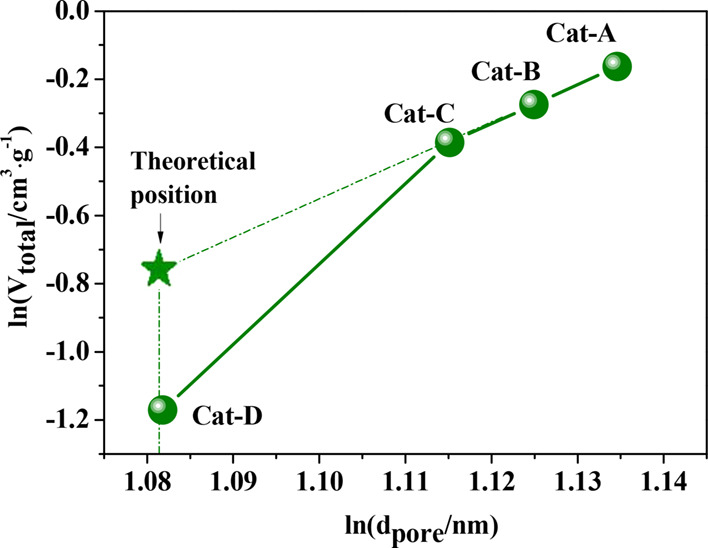
Logarithmic plot of the pore sizes and pore volumes for (Ni)-MCM-41 catalysts.
The acidity of a catalyst has an important influence on the deoxidation performance during pyrolysis. NH3-TPD is a commonly used method to measure the acidity of a catalyst, which provides information on the acid distribution (desorption curve peak temperature) and total acid content (peak area of the desorption curve) of the catalyst.23,43,44 The NH3-TPD profiles for the five catalysts are displayed in Figure 6. A semiquantitative analysis of the NH3-desorption peaks was performed by a Gaussian deconvolution method, and the results are summarized in Table 2. For NH3-TPD characterization, the desorption peaks centered around 150–250, 250–350, and 350–450 °C should be ascribed to weak, medium, and strong acid sites, respectively.45
Figure 6.
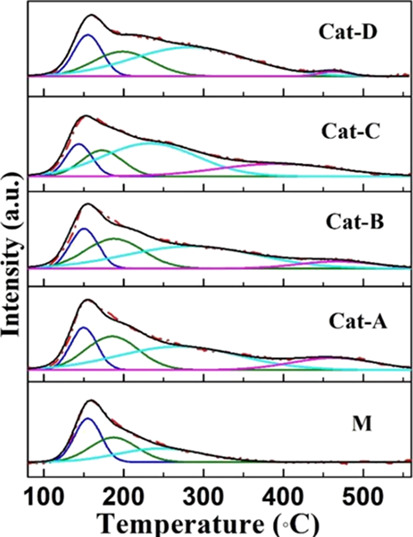
NH3-TPD profiles of five catalysts.
Table 2. Semiquantitative Analysis Data of NH3-TPD Profiles.
| TM (°C) |
peak
fraction (%) |
|||||||||
|---|---|---|---|---|---|---|---|---|---|---|
| catalyst | I | II | III | IV | total acidity (a.u.) | I | II | III | IV | fitted parameter (R2) |
| M | 156.2 | 188.3 | 247.5 | 1.00 | 33.2 | 33.2 | 33.6 | 0.9963 | ||
| Cat-A | 152.2 | 187.4 | 270.6 | 464.1 | 1.93 | 16.6 | 26.3 | 42.0 | 15.1 | 0.9957 |
| Cat-B | 153.6 | 190.9 | 287.0 | 469.8 | 2.55 | 17.6 | 27.4 | 46.3 | 8.8 | 0.9966 |
| Cat-C | 146.9 | 175.8 | 235.6 | 395.0 | 3.19 | 12.9 | 16.5 | 47.6 | 23.0 | 0.9982 |
| Cat-D | 155.2 | 198.6 | 282.5 | 463.6 | 1.25 | 19.0 | 23.8 | 54.9 | 2.3 | 0.9961 |
According to the NH3-TPD results, the addition of metallic Ni can increase the acid content of the catalyst, and the total acid contents of different Ni-loaded catalysts are all stronger than that of the MCM-41 zeolite because the proton sites on the support structure can be replaced with Ni atoms and new proton sites are created due to their interaction. Compared with M, the specific surface areas and pore volumes of Cat-A, B, and C decreased by no more than 33% (Table 1), but the acidity of the catalyst gradually increased from 100 (M) to 193, 255, and 319%, respectively. However, for Cat-D (42.7 wt %Ni), the specific surface area and pore volume were sharply reduced by 52 and 69% (Table 1), respectively. A significant reduction in specific surface area and pore volume results in sintering of the NiO particles, which will lead to a reduction in available acid and active metal sites. Compared with Cat-C, the acidity decreased from 319 (Cat-C) to 125%. The acid distribution of the (Ni)-MCM-41 catalyst also changed significantly. Medium and strong acid sites appeared on the (Ni)-MCM-41. The distribution of different acid sites on the catalyst reflects the interaction between the doped Ni species and the Si–OH groups distributed at different positions of the support. New acid sites are generated with the introduction of Ni. Moreover, the presence of Ni sites can also serve as Lewis acid sites.46
A H2-TPR experiment was utilized to investigate the reducibility of the NiO species and the metal–support interactions. Figure 7 depicts the H2-TPR profiles obtained for the five catalysts. Two reduction peaks centered at approximately 350 and 550–750 °C can be easily distinguished and correspond to two different types of NiO species. The first reduction peak can be ascribed to the reduction of the free NiO, the superficial NiO, and the bulk NiO particles, which have little or no interaction with the MCM-41 support. The second peak above 500 °C is attributed to the reduction of highly dispersed NiO small particles, which have strong interactions with the MCM-41 support.37,47 With Ni loading from Cat-A to Cat-D, the intensity and covered area of the second peak increase. The increasing highly dispersed nickel oxide particles are beneficial for providing more metal active sites, which also leads to an increase in overall acidity of the catalysts (Table 2). Accordingly, these highly dispersed NiO particles will play an important role in deoxygenation and anti-carbon ability and the selective production of olefins and aromatics during co-pyrolysis of cellulose and PP. However, for Cat-D, a broad signal below 500 °C appears, which corresponds to the first reduction type of NiO species. This fact gives further evidence of the sintering process of metal oxide particles with overloading of Ni, as shown in the BET results. In the H2-TPR analysis, the reduction reaction is controlled by mass diffusion.37,48,49 With the increase of the Ni loading, the particles of NiO gradually grow up, just as shown in Figures 2 and 4, partly dispersed in the pores of the MCM-41 carrier, increasing the mass and heat transfer resistance. Therefore, the temperatures of the second reduction peak continually increase with increased Ni loading as shown in Figure 7.
Figure 7.
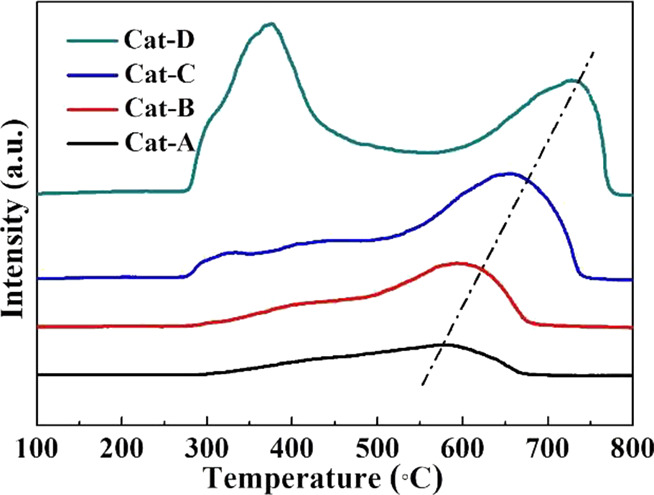
H2-TPR profiles of different catalysts.
2.2. Catalytic Co-Pyrolysis Performances of (Ni)-MCM-41 Catalysts
2.2.1. Product Analysis by Py-GC/MS
Fast pyrolysis experiments were conducted by pyrolysis-gas chromatography/mass spectrometry (Py-GC/MS) to obtain the selective product distribution for different catalysts, and the optimal catalyst was preferred. In this study, the relative amounts of different components in the pyrolysis products were determined from the percentage of the peak area in the spectrum detected by GC/MS. The deoxidation capacity of the catalyst and the relative total amount of olefins plus aromatics in the product were selected as the main indexes for identifying the performance of a catalyst.
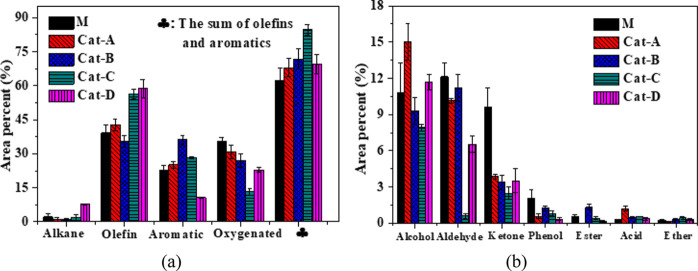
The distribution of four main components for the pyrolysis products (alkane, alkene, aromatics, oxygenated chemicals) are shown in Figure 8a. When 6.9 wt % Ni (Cat-A) was loaded onto MCM-41, the proportion of oxygenates in the product decreased from 35.6 (For M) to 30.9%, and the yield of olefins plus aromatics increased from 62.2 to 68.0%. When the Ni-loading amount increased to 25.1 wt % (Cat-C), the proportion of oxygenates in the product decreased to 13.4%, and the relative total olefins plus aromatics increased to 84.6%. However, when the loading of Ni further increased to 42.7 wt % (Cat-D), the yield of oxygenates increased again to 22.9%, and the olefins and aromatics were reduced to 69.4%. The results showed that Cat-C (25.1 wt % Ni) is available for the highest catalytic performance, which has the best deoxidation capacity and the highest yield of olefins plus aromatics. Figure 8b shows the components of oxygenates in the pyrolysis product. The oxygenated compounds mainly included alcohols, aldehydes, ketones, and phenol, which occupied more than 90% of the oxygenated product. The free radical reaction by the hydroxyl radical was derived from cellulose, and the alkyl radical was derived from PP, which leads to a large proportion of alcohol compounds.50,51
Figure 8.
Component distribution of co-pyrolysis products of the five catalysts: (a) major constituents in the co-pyrolysis products and (b) the chemical constituents of oxygenate.
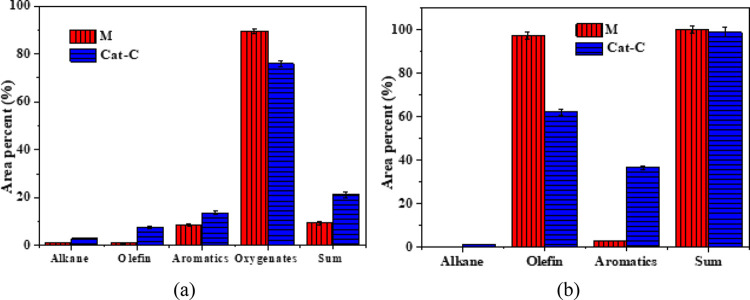
To further evaluate the synergistic interaction between cellulose and PP co-pyrolysis, a detailed contrastive analysis for the difference in the calculated and experiment results is presented in Table 3. The calculated value is defined as 50% × cellulose value + 50% × PP value. The catalytic pyrolysis products of cellulose or PP are shown in Figure 9. For the cellulose, Ni addition can reduce the yield of oxygenates from 89.6 to 75.9%, while the yields for olefins plus aromatics increase from 9.3 to 21.2% (Figure 9a). For the PP, the total yield of olefins and aromatics remains almost unchanged, but more olefins are transformed to aromatics. When loading Ni to MCM-41 (Cat-C), the yield of olefins is decreased from 97.3 to 61.2%, and aromatics are increased from 2.7 to 36.6% (Figure 9b). Previous studies have proven that the catalytic pyrolysis of PP is mainly through the β-scission mechanism (path 1) transformed to olefins, and then a portion of the produced olefins converted to aromatics through cyclization and oligomerization reactions (path 2).15,16 Compared with M, Cat-C (with Ni addition), while ensuring the ability to break the chain of PP through path 1 to produce olefins, can strengthen path 2 so that more olefins are converted into aromatic hydrocarbons.
Table 3. Comparison of Calculated and Experimental Values of Pyrolysis Product Distribution.
| M |
Cat-C |
|||
|---|---|---|---|---|
| main products (%) | calculated valuea | experimental value | calculated valuea | experimental value |
| olefins plus aromatics | 54.7 | 62.2 | 59.1 | 84.6 |
| oxygenates | 44.8 | 35.6 | 37.6 | 13.4 |
The calculated value is defined as 50% × cellulose value + 50% × PP value.
Figure 9.
Main components of catalytic pyrolysis products from single feedstock: (a) cellulose and (b) PP.
Interestingly, when cellulose and PP co-pyrolysis is catalyzed by the (Ni)-MCM-41 catalyst, the yield of olefins and aromatics is significantly increased. After adding Ni into MCM-41, one finds a better yield of olefins and aromatics. Over Cat-C, the calculated yield of olefins and aromatics is only 59.1%, while the experimental hydrocarbon yield reaches 84.6%, which is 36% higher than that of MCM-41 (62.2%). At the same time, the deoxygenation ability is also enhanced with Ni loading. With Cat-C, the experimental oxygenate yield is reduced to 13.4%, which is 62.4% less than that of MCM-41 (35.6%). Especially, aldehyde and ketone decreased significantly from 21.7 to 10.0% (Figure 8b). The results proved that aromatization is also an important route over (Ni)-MCM-41 to convert oxygenates and olefins into aromatics for strong synergy between co-pyrolysis of cellulose and PP.9,10
The relationship between the structural properties of the catalyst and the distribution of catalytic pyrolysis products was analyzed, and it was found that the acidity density (the acidity per specific surface area of the catalyst, acidity/SBET) has a strong effect on the distribution of pyrolysis products, as shown in Figure 10. When the Ni loading increased to 13.2 wt % (Cat-B), the relative value of the acidity density increased by 232%, the relative yields of oxygenates reduced to 76.2%, and the olefins and aromatics increased by 15.4% from M. When the Ni loading increased to 25.1 wt % (Cat-C), the relative value of the acidity density increased only by 115% from Cat-B. However, the relative yields of oxygenates decreased by 38.7%, and the yields of olefins and aromatics quickly increased to 136.1%, indicating that when the acidity density of the catalyst accumulated to a certain level, it plays a significant role in promoting the deoxygenation reaction in the hydrocarbon pool, especially the decarboxylation, decarbonylation, and the Diels–Alder reactions. When the Ni loading increased to 42.7 wt % (Cat-D), the acidity, specific surface area, and pore volume all decreased sharply, deteriorating the performance of the catalyst. Significant reduction in specific surface area and pore volume leads to an increase in the resistance of mass transfer. On the other hand, many sintered large bulk NiO particles appeared, which will lead to the reduction of available acid and active metal sites. Compared with Cat-C, the relative of acidity density decreased from 447 (Cat-C) to 261%, the yield of oxygenates increased from 37.5 (Cat-C) to 64.2%, and the olefins plus aromatics dereased gradually from 136.1 (Cat-C) to 111.7%. Therefore, the density of acidity would reveal the synergistic results of the physical and chemical properties of the Ni-modified MCM-41 catalyst and characterize the catalytic co-pyrolysis performance of the (Ni)-MCM-41 catalyst for cellulose and PP.
Figure 10.
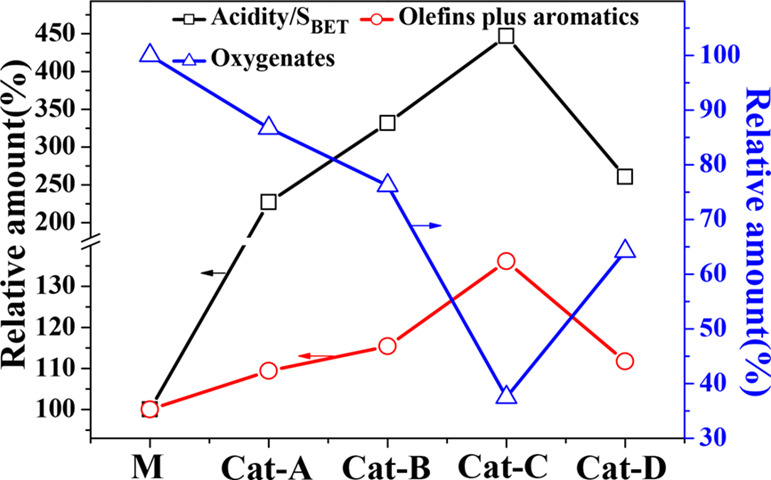
Relationship between the acidity density and the catalytic performance of the (Ni)-MCM-41 relative to M. The data in the figure is the percentage values of the (Ni)-MCM-41 catalyst data relative to the data of M.
2.2.2. Coke Analysis
The TGA method was used to analyze the (Ni)-MCM-41 catalyst after the co-pyrolysis reaction of cellulose and PP, and the coke deposition information was obtained. The results obtained from TGA are shown in Figure 11a. It is obvious that all TGA curves exhibit two regions: one region for oxidizing of the Ni particles at approximately 500 °C and another region that is ascribed to the oxidation of the deposited carbon. For each catalyst, the observed slight increase in mass at approximately 500 °C was attributed to the oxidation of Ni particles, which was produced by the in situ reduction of H2 and CO during pyrolysis. The weight loss at high temperature is due to the removal of deposited carbon from the catalyst.
Figure 11.
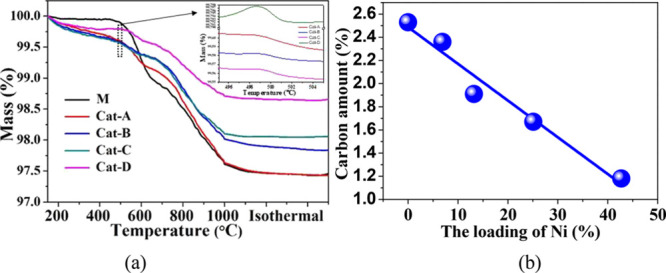
(a) TGA curves for the reacted catalysts. (b) Diagram of the relationship between the Ni loading amount and the amount of deposited carbon of the five catalysts.
In the catalytic co-pyrolysis process of cellulose and PP, coke is generated by a complex combination of reactions, such as light alkane cracking, olefin oligomerization, and aromatic polycondensation, which are mainly catalyzed by Brønsted acid sites.7,52 The relationship between carbon deposition and nickel loading is shown in Figure 11b, and there is a good negative correlation between the amount of carbon deposited on the catalyst and the amount of Ni. The highest coke deposition (2.53 wt %) was found on M, and the amount of carbon deposited by the catalyst decreased with increasing nickel loading. For Cat-D, the carbon deposition decreased to 1.18 wt %, which is 53.4% lower than that for M (2.53 wt %). The acidity of the catalyst plays an essential role in coking: Lewis acid sites are responsible for binding the species to the catalyst surface, and Brønsted sites donate protons to the deposited species to form carbonaceous materials.53,54 The coke deposited on the catalyst will block the pore structure of the support, reduce the specific surface area of the catalyst, and poison the active sites, resulting in catalyst deactivation.55,56 The addition of nickel to the MCM-41 catalyst can effectively adjust the acid distribution of (Ni)-MCM-41 (Figure 6), reduce the weak B acidic sites (Si–OH), serve as Lewis acid sites, and provide new metal oxide active sites.46 This is a positive result as Ni addition to MCM-41 can reduce deactivation and enhance the stability of the catalyst.
2.2.3. Product Analysis by Online TG-FTIR Analysis
2.2.3.1. TG-DTG Curves Analysis
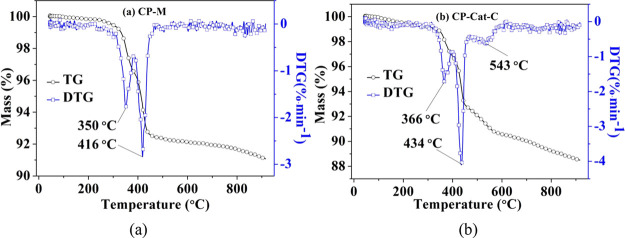
The TG and DTG curves for the catalytic co-pyrolysis of cellulose and PP with catalyst M and Cat-C at a heating rate of 20 °C·min–1 are shown in Figure 12. For the catalytic co-pyrolysis of cellulose and PP with catalyst M, mass loss occurred between 290–380 and 380–470 °C, with two major weight-loss stages appearing, centered at temperatures of 350 and 416 °C, respectively. For the catalytic co-pyrolysis of cellulose and PP with Cat-C, the mass-loss temperature range moved to a higher temperature, and three major weight-loss stages were found to occur at 310–400, 400–470, and above 470 °C, centered at temperatures of 366 and at 434 °C, with the third temperature peak showing a wide temperature range centered at 543 °C, respectively. The first peak is probably mainly due to the catalytic pyrolysis of cellulose; the second peak is mainly due to the catalytic pyrolysis of PP.16 The overlap temperature region of these two peaks on the DTG curve is the synergistic effect resulting from the addition of the catalyst. The third mass loss for the catalytic co-pyrolysis of cellulose and PP with Cat-C can be ascribed to two parts: the reduction of NiO species by H2 and CO produced from the pyrolysis process and the further reactions of char and coke at high temperature, including cracking or gasification.57−59
Figure 12.
TG and DTG curves of the catalytic co-pyrolysis of cellulose and PP with (a) catalyst M and (b) Cat-C.
2.2.3.2. Volatile Evolution during Catalytic Co-Pyrolysis of Cellulose and PP
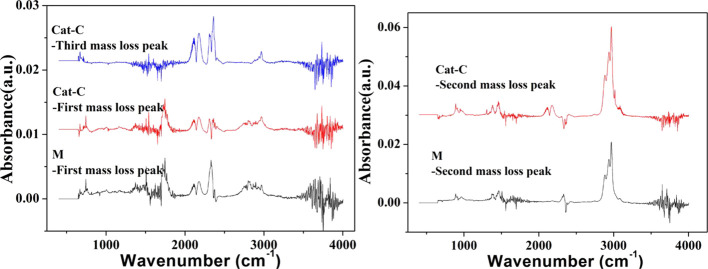
The catalytic co-pyrolysis of cellulose and PP produced a large amount of volatiles, which were mainly composed of noncondensable gases (CO, CO2, H2, CH4, etc.) and organic vapors (furans, carboxyls, carbonyls, etc.). Real-time comparison analysis of pyrolytic volatiles for Cat-C and M was conducted using an FTIR spectrometer connected to the TGA apparatus, which can help to research the release characteristics of typical functional groups and elucidate the function of Ni addition. FTIR spectra at different mass-loss peaks during the catalytic co-pyrolysis of cellulose and PP with catalyst M and Cat-C are shown in Figure 13. The infrared positions and assignments, shown in Table 4, were identified by the FTIR absorption bands of typical functional groups, as reported in other studies.16,57,58,60,61At the first mass-loss peak, there are several obvious peaks in the infrared spectra, including CO, CO2 and other oxygenated compounds. However, the peaks in the FTIR spectra for the second mass-loss peak mainly contain CxHy (x = 1, 2, and 3), which represents light hydrocarbon gases (mainly CH4) in the wavenumber range of 3178–2636 cm–1. The appearance of a small amount of CO/CO2 is a synergistic effect for the catalytic co-pyrolysis of cellulose and PP. At the second mass-loss stage, Cat-C produced a higher IR intensity than M addition, which can be attributed to the enhanced synergism in the co-pyrolysis of cellulose and PP for deoxygenation and enhancement of the yield of hydrocarbons by Ni addition. The FTIR spectrum at the third mass-loss peak for Cat-C does not contain CxHy but mainly contains CO and CO2, produced by the reaction of the coke and char,57−59 with some CO2 generated through the reduction of NiO by CO.
Figure 13.
FTIR spectra at different mass-loss peaks of the catalytic co-pyrolysis of cellulose and PP with catalyst M and Cat-C.
Table 4. Infrared Positions and Assignments of the Main Volatile Products for the Catalytic Co-Pyrolysis of Cellulose and PP with Catalyst M and Cat-C.
| wavenumber (cm–1) | compounds | assignment | relative ratioa |
|---|---|---|---|
| 750–745 | furans | furan ring stretching | 0.72 |
| 1149–1066 | alcohols | C–O stretching | 0.05 |
| 1200–1150 | carboxyls | –COOH stretching | 0.54 |
| 1858–1625 | carbonyls | C=O stretching | 0.48 |
| 2230–2021 | CO | C–O stretching | 3.40 |
| 2401–2231 | CO2 | C=O stretching | 2.07 |
| 3178–2636 | CxHy | C–H stretching | 1.10 |
The value is defined as the ratio of the total absorbance peak area of the components between Cat-C and catalyst M.
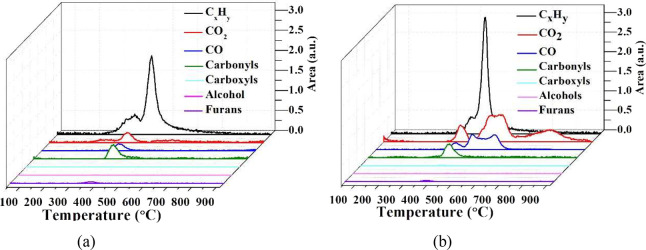
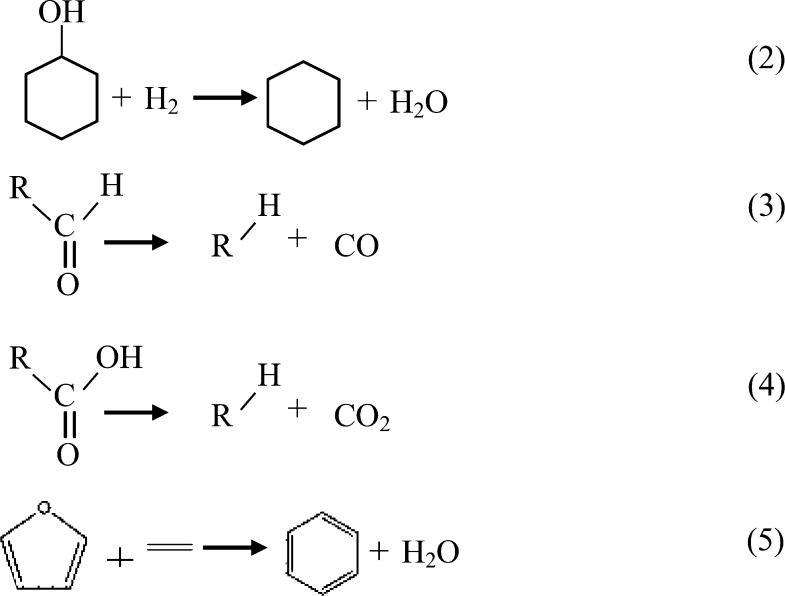
Figure 14 shows the variation in the IR absorption peak area via temperature profiles of different components during the catalytic co-pyrolysis of cellulose and PP with catalyst M and Cat-C. According to the Beer–Lambert law, the absorption spectrum at a specific wavenumber is linear and depends on the concentration of volatiles, so the absorbance peak area variation within a specific absorption wavenumber range can be used to reflect the evolution of the amount of gaseous products, i.e., furans (750–745 cm–1), alcohols (1149–1066 cm–1), carbonyls (1858–1625 cm–1), etc. As shown in Figure 14a, the evolution curve for CxHy appears to show two peaks, which mainly occur in the temperature range of 220–660 °C; the two peaks are centered at 360 and 429 °C. The evolution curves for the other components only show one peak, in the temperature range of 220–410 °C, which is centered at approximately 360 °C. From Figure 14b, the evolution curve for CxHy also appears to show two peaks in the temperature range of 300–700 °C, which are centered at 372 and 436 °C. The evolution curves for furans, alcohols, carboxyls, and carbonyls all show one peak in the temperature range of 300–460 °C, which is centered at approximately 380 °C. However, unlike M, Cat-C with Ni addition can promote the deoxygenation reaction, through the dehydration, decarbonylation, and decarboxylation process, as shown in reactions 2–4, decrease the fraction of furans, carbonyls, and carboxyls, and increase the fraction of CO, CO2, CxHy, etc. As shown in Table 4, the relative ratio values of furans, alcohols, carbonyls, and carboxyls are all less than 1. The relative ratio of CxHy is around 1.10, and the relative ratio values of CO and CO2 are 3.40 and 2.07, respectively. The reduction of furans can be ascribed to the reaction with linear olefins derived from PP by the Diels–Alder reaction to form aromatics, as shown in reaction 5.
Figure 14.
Absorbance peak area variation of different components versus temperature during the catalytic co-pyrolysis of cellulose and PP with (a) catalyst M and (b) Cat-C.
 |
2 |
For Cat-C, the amount of CO and CO2 increased significantly, the temperature distribution range widened, and a large amount of CO and CO2 gas was detected in the high-temperature section. This indicates that there should be other sources for the formation of CO and CO2 at higher temperatures in the presence of NiO. The formation of CO above 500 °C occurred as a result of the reaction of CO2 released at high temperature with the carbon in the coke,58,60 and the CO generated by this way can react with NiO to produce CO2 again, building a coke consumption cycle, which can effectively reduce the amount of deposited coke, as shown in reactions 6 and 7. Ni addition promotes the coke consumption cycle, reduces the amount of the coke, and improves the stability of the catalyst.
| 6 |
| 7 |
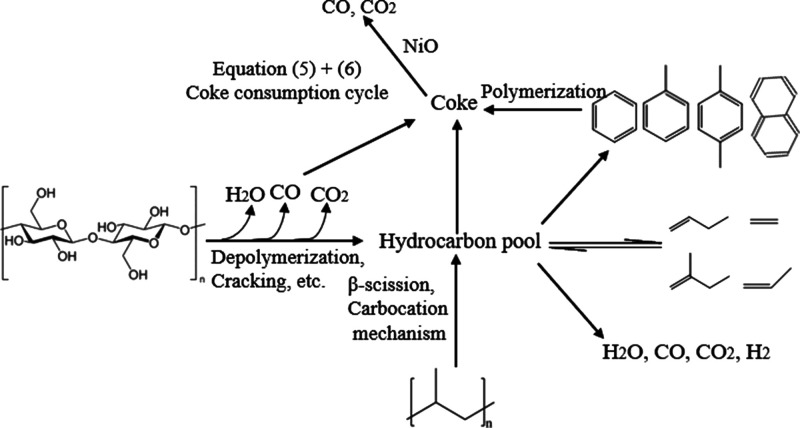
According to the results of Py-GC/MS and TG-FTIR experiment and our previous studies,15,16 the reaction mechanism of cellulose and PP catalytic co-pyrolysis with the (Ni)-MCM-41 catalyst was elucidated, as shown in Figure 15. Compared with the MCM-41 catalyst, the addition of Ni will promote the initial cracking and deoxygenation reactions of cellulose, allowing fewer oxygen species to enter the ″hydrocarbon pool″. The addition of Ni can also provide more acidic sites and active metal sites, increasing the synergistic reaction of intermediates, enhance the dehydration, decarboxylation, decarbonylation, and aromatization processes and removal of oxygen in the form of H2O, CO, and CO2, and promote the formation of olefins and aromatics. Ni addition can also promote the coke consumption cycle, reduce the amount of the coke, and improve the stability of the catalyst.
Figure 15.
Possible reaction paths of cellulose and PP catalytic co-pyrolysis with the (Ni)-MCM-41 catalyst.
3. Conclusions
The addition of an appropriate amount of nickel metal can effectively modulate the physicochemical properties of MCM-41 and promote a synergistic effect between cellulose and PP in the catalytic co-pyrolysis process. The addition of Ni can increase the acidity of the catalyst and provide active metal sites, which can improve the bond breaking ability and deoxidation performance of catalysts. Ni addition is conducive to promoting some specific reaction pathways, including dehydration, decarboxylation, decarbonylation, aromatization, and Diels–Alder reactions, and promoting the formation of olefins and aromatics. Ni addition can also promote the coke consumption cycle, improve the anti-carbon deposition ability, and enhance the stability of the catalyst. In this work, the catalyst showed the best catalytic performance for a Ni loading of 25.1 wt % (Cat-C): the proportion of oxygenated compounds in the product decreased from 35.6 (M) to 13.4%, and the relative total amount of olefins plus aromatics increased from 62.2 (M) to 84.6%. The excellent catalytic performance of Cat-C can be attributed to a balancing of its physical and chemical properties, among which the acidity per specific surface area of the catalyst has a critical influence.
4. Materials and Methods
4.1. Materials
Microcrystalline cellulose powder ([C6H10O5]n, AR) was procured from Aladdin, and polypropylene (PP, AR) was purchased from Shanghai Yang Li Mechanical and Electrical Technology Company. The proximate and ultimate analysis results for cellulose and PP are given in Table 5. MCM-41 was purchased from the Nankai Catalyst Factory, and its textural properties are shown in Table 1. All the samples and catalysts had the form of a fine powder when used. The particle size was approximately 200 mesh. Cellulose and PP were mixed thoroughly at a 1:1 ratio. Cellulose, PP, and their mixtures were mixed with the catalyst samples at a ratio of 1:10 to ensure that all pyrolysis samples contained excess catalysts.
Table 5. Proximate and Ultimate Analysis of Cellulose and PP.
| proximate |
ultimate |
||||||||
|---|---|---|---|---|---|---|---|---|---|
| M | V | A | FC | C | H | Oa | N | S | |
| cellulose | 3.43 | 84.08 | 0.03 | 12.46 | 43.43 | 6.40 | 50.06 | 0.07 | 0.04 |
| PP | 100.00 | 85.43 | 14.15 | 0.25 | 0.20 | 0.07 | |||
Calculated by difference.
4.2. Catalyst Preparation
The (Ni)-MCM-41 catalyst was prepared by the previously reported ethylene glycol (EG)-assisted wet-impregnation method.21 EG molecules are first combined and dispersed in the porous structure of MCM-41, and then form a complex with the nickel precursor, so that Ni2+ ions can be better dispersed into the porous structure of MCM-41, and then reduce the sintering of NiO during heating.21 A predetermined amount of Ni(NO3)2·6H2O (Aladdin, AR) was dissolved in ethanol (Greagent, ≥99.7%), and then glycol (Greagent, AR) was added to the liquid, where the molar ratio between nickel and glycol was kept at 1:1. The above solution was added into a rotary evaporation flask, mixed with MCM-41 powder, and impregnated for 2 h at 40 °C; at the same time, a stirrer was operated at a speed of 200 rpm by a rotary evaporator. Thereafter, the solution was dried at 70 °C for 30 min in a vacuum. Then, the sample was dried at 120 °C for 8 h in an oven. Finally, it was calcined at 550 °C for 6 h in an air atmosphere.
Using nickel nitrate solutions with different concentration multiples, four samples with different nickel loadings were prepared. The effects of different nickel loadings on the structure and chemical properties of the catalyst, as well as the distribution of the co-pyrolysis products of cellulose and polypropylene, were studied. The actual Ni loading was measured by X-ray fluorescence (XRF) after calcination. In this paper, MCM-41 is denoted as M, and the catalysts with different Ni loadings are denoted as Cat-A (6.9 wt % Ni), Cat-B (13.2 wt % Ni), Cat-C (25.1 wt % Ni), and Cat-D (42.7 wt % Ni).
4.3. Catalyst Characterization
Small- and wide-angle powder X-ray diffraction (XRD) was carried out using a D8/Advance powder X-ray diffractometer (Bruker) with Cu Kα radiation in the 2θ ranges of 1–10 and 10–70°, respectively.
SEM images were acquired using a scanning electron microscope SU-8010, operating at 30 kV to study the surface morphology of different catalysts. TEM images were obtained by high-resolution transmission electron microscopy (JEM).
The pore structure parameters and specific surface areas of the five catalysts were calculated from N2 adsorption–desorption isotherms collected at −198.5 °C using a Micromeritics ASAP 2460 analyzer. All catalysts were previously degassed at 300 °C for 5 h. The Brunauer–Emmett–Teller (BET) method was adopted to calculate the specific surface area, and a Barrett–Joyner–Halenda (BJH) model was used to calculate the pore structure parameters; the desorption branch of the isotherms was selected.
An ammonia temperature-programmed desorption (NH3-TPD) test was carried out using a Chembet PULSAR TPR/T chemical analyzer equipped with a TCD detector. Samples (0.20 g) were pretreated at 600 °C in a helium atmosphere (30 mL·min–1) for 1 h, and then, NH3 was saturated at 50 °C. Thereafter, the temperature was increased to 600 °C at a rate of 10 °C·min–1 to carry out desorption of ammonia.
The hydrogen temperature-programmed reduction (H2-TPR) measurement was implemented using a Chembet PULSAR TPR/T chemical analyzer equipped with a TCD detector. Samples (0.10 g) were pretreated at 300 °C for 2 h under an Ar atmosphere (30 mL·min–1) and then cooled to 50 °C. Thereafter, 10% H2 in Ar was switched on, and the temperature was raised to 600 °C at a temperature ramp rate of 10 °C·min–1 to carry out the reduction of H2.
The coke content of the reacted catalysts was measured by a thermogravimetric analysis (TGA) apparatus (STA-209F3, Netzsch). All fresh catalysts were used to pyrolyze cellulose and PP at 650 °C for 5 min in a N2 atmosphere with a reactant-to-catalyst mass ratio of 1 to 10; the TGA curves are all shown in Figure S1. Then, the setup was switched to an air atmosphere, with a flow rate of 100 mL·min–1; the temperature was increased from room temperature to 950 °C at a ramp rate of 10 °C·min–1 and then maintained for 50 min to calculate the carbon amount.
The actual loading of nickel in the catalyst was determined by X-ray fluorescence spectroscopy (XRF) using an XRF-1800 (Shimadzu) analyzer.
4.4. Py-GC/MS Experiment
In this study, fast catalytic co-pyrolysis of cellulose and PP was performed using a micropyrolyzer (5000 HP, CDS, USA), and the operating conditions of the pyrolysis process were selected based on our previous research.15,16 Approximately 1 mg of a mixture of the sample and corresponding (Ni)-MCM-41 catalyst (sample/catalyst = 1:10) was pyrolyzed at 650 °C for 20 s. All pyrolysis products were purged through a transfer line to a later coupled GC/MS (Thermo Scientific, Trace DSQII) for online analysis; the temperature of all connected components and the transfer line in the system was increased and kept at 280 °C. A DB-5MS capillary column (parameter: 30 m × 0.25 mm × 0.25 μm) was selected for gas chromatograph analysis. Helium (purity: 99.999%) was selected as the carrier gas at a flow rate of 1 mL·min–1. The split ratio was set to 1:10. The temperature rise procedure for the GC oven was as follows: hold at 50 °C for 4 min, then heat to 280 °C at a rate of 3 °C·min–1, and finally maintain at 280 °C for 12 min. The MS instrument was operated in EI mode, and the ion-source electron energy was 70 eV. The obtained mass spectrum was compared with the NIST database to identify the pyrolysis products. The relative area percentage of the product peaks in the chromatogram was used to perform a semiquantitative analysis of the pyrolysis products. Each experiment was repeated three times and averaged.
4.5. TG-FTIR Experiment
A Netzsch STA 409PC thermogravimetric analyzer and the Bruker VERTEX70V Fourier transform spectrometer were integrated to carry out TG-FTIR analysis. The composition of the pyrolysis gas products was accurately analyzed in real time. In the TGA experiment, the mass of the loaded sample was approximately 11 mg, and the sample was heated from 40 to 950 °C at a temperature ramp rate of 20 °C·min–1 under a N2 atmosphere; the gas flow rate was 100 mL·min–1. An FTIR device equipped with a high-sensitivity MCT detector was connected to the TGA apparatus through a transfer line. The transfer line was preheated to 150 °C to prevent condensation of gas products. The FTIR spectrometer had a scanning range of 400–4000 cm–1 with a resolution of 4 cm–1, and each scan was repeated 16 times.
Acknowledgments
The authors gratefully acknowledge funding support from the National Natural Science Foundation of China (No. 51576111).
Supporting Information Available
The Supporting Information is available free of charge at https://pubs.acs.org/doi/10.1021/acsomega.0c02205.
TGA profiles for five catalysts. Detailed list of main compounds detected during the Py-GC/MS experiment. The retention time and relative peak area information of all chromatographic peaks (PDF)
This research did not receive any specific grant from funding agencies in the public, commercial, or not-for-profit sectors. We clarify that all images in this paper are free domain.
The authors declare no competing financial interest.
Supplementary Material
References
- Lan X.; Hensen E. J. M.; Weber T. Hydrodeoxygenation of guaiacol over Ni2P/SiO2-reaction mechanism and catalyst deactivation. Appl. Catal., A 2018, 550, 57–66. 10.1016/j.apcata.2017.10.018. [DOI] [Google Scholar]
- Kalogiannis K. G.; Stefanidis S. D.; Lappas A. A. Catalyst deactivation, ash accumulation and bio-oil deoxygenation during ex situ catalytic fast pyrolysis of biomass in a cascade thermal-catalytic reactor system. Fuel Process. Technol. 2019, 186, 99–109. 10.1016/j.fuproc.2018.12.008. [DOI] [Google Scholar]
- Hervy M.; Weiss-Hortala E.; Minh D. P.; Dib H.; Villot A.; Gérente C.; Berhanu S.; Chesnaud A.; Thorel A.; Le Coq L.; Nzihou A. Reactivity and deactivation mechanisms of pyrolysis chars from bio-waste during catalytic cracking of tar. Appl. Energy 2019, 237, 487–499. 10.1016/j.apenergy.2019.01.021. [DOI] [Google Scholar]
- Ryu H. W.; Lee H. W.; Jae J.; Park Y.-K. Catalytic pyrolysis of lignin for the production of aromatic hydrocarbons: Effect of magnesium oxide catalyst. Energy 2019, 179, 669–675. 10.1016/j.energy.2019.05.015. [DOI] [Google Scholar]
- Chen N. Y.; Degnan T. F.; Koenig L. R. Liquid fuel from carbohydrates. Chemtech 1986, 16, 506–511. [Google Scholar]
- Zhang H.; Cheng Y.-T.; Vispute T. P.; Xiao R.; Huber G. W. Catalytic conversion of biomass-derived feedstocks into olefins and aromatics with ZSM-5: the hydrogen to carbon effective ratio. Energy Environ. Sci. 2011, 4, 2297–2307. 10.1039/c1ee01230d. [DOI] [Google Scholar]
- Hernando H.; Moreno I.; Fermoso J.; Ochoa-Hernández C.; Pizarro P.; Coronado J. M.; Čejka J.; Serrano D. P. Biomass catalytic fast pyrolysis over hierarchical ZSM-5 and Beta zeolites modified with Mg and Zn oxides. Biomass Convers. Biorefin. 2017, 7, 289–304. 10.1007/s13399-017-0266-6. [DOI] [Google Scholar]
- Zhao C.; Lercher J. A. Upgrading Pyrolysis Oil over Ni/HZSM-5 by Cascade Reactions. Angew. Chem., Int. Ed. 2012, 51, 5935–5940. 10.1002/anie.201108306. [DOI] [PubMed] [Google Scholar]
- Rezaei P. S.; Shafaghat H.; Daud W. M. A. W. Aromatic hydrocarbon production by catalytic pyrolysis of palm kernel shell waste using a bifunctional Fe/HBeta catalyst: effect of lignin-derived phenolics on zeolite deactivation. Green Chem. 2016, 18, 1684–1693. 10.1039/C5GC01935D. [DOI] [Google Scholar]
- Chattopadhyay J.; Pathak T. S.; Srivastava R.; Singh A. C. Catalytic co-pyrolysis of paper biomass and plastic mixtures (HDPE (high density polyethylene), PP (polypropylene) and PET (polyethylene terephthalate)) and product analysis. Energy 2016, 103, 513–521. 10.1016/j.energy.2016.03.015. [DOI] [Google Scholar]
- Budsaereechai S.; Hunt A. J.; Ngernyen Y. Catalytic pyrolysis of plastic waste for the production of liquid fuels for engines. RSC Adv. 2019, 9, 5844–5857. 10.1039/C8RA10058F. [DOI] [PMC free article] [PubMed] [Google Scholar]
- Hong Y.; Lee Y.; Rezaei P. S.; Kim B. S.; Jeon J.-K.; Jae J.; Jung S.-C.; Kim S. C.; Park Y.-K. In-situ catalytic copyrolysis of cellulose and polypropylene over desilicated ZSM-5. Catal. Today 2017, 293-294, 151–158. 10.1016/j.cattod.2016.11.045. [DOI] [Google Scholar]
- Mullen C. A.; Dorado C.; Boateng A. A. Catalytic co-pyrolysis of switchgrass and polyethylene over HZSM-5: Catalyst deactivation and coke formation. J. Anal. Appl. Pyrolysis 2018, 129, 195–203. 10.1016/j.jaap.2017.11.012. [DOI] [Google Scholar]
- Liu C.; Wang H.; Karim A. M.; Sun J.; Wang Y. Catalytic fast pyrolysis of lignocellulosic biomass. Chem. Soc. Rev. 2014, 43, 7594–7623. 10.1039/C3CS60414D. [DOI] [PubMed] [Google Scholar]
- Chi Y.; Xue J.; Zhuo J.; Zhang D.; Liu M.; Yao Q. Catalytic co-pyrolysis of cellulose and polypropylene over all-silica mesoporous catalyst MCM-41 and Al-MCM-41. Sci. Total Environ. 2018, 633, 1105–1113. 10.1016/j.scitotenv.2018.03.239. [DOI] [PubMed] [Google Scholar]
- Xue J.; Zhuo J.; Liu M.; Chi Y.; Zhang D.; Yao Q. Synergetic Effect of Co-pyrolysis of Cellulose and Polypropylene over an All-Silica Mesoporous Catalyst MCM-41 Using Thermogravimetry-Fourier Transform Infrared Spectroscopy and Pyrolysis Gas Chromatography-Mass Spectrometry. Energy Fuels 2017, 31, 9576–9584. 10.1021/acs.energyfuels.7b01651. [DOI] [Google Scholar]
- Degnan T. F.; Chitnis G. K.; Schipper P. H. History of ZSM-5 fluid catalytic cracking additive development at Mobil. Microporous Mesoporous Mater. 2000, 35-36, 245–252. 10.1016/S1387-1811(99)00225-5. [DOI] [Google Scholar]
- Zhang H.; Xiao R.; Huang H.; Xiao G. Comparison of non-catalytic and catalytic fast pyrolysis of corncob in a fluidized bed reactor. Bioresour. Technol. 2009, 100, 1428–1434. 10.1016/j.biortech.2008.08.031. [DOI] [PubMed] [Google Scholar]
- Karnjanakom S.; Guan G.; Asep B.; Hao X.; Kongparakul S.; Samart C.; Abudula A. Catalytic Upgrading of Bio-Oil over Cu/MCM-41 and Cu/KIT-6 Prepared by β-Cyclodextrin-Assisted Coimpregnation Method. J. Phys. Chem. C 2016, 120, 3396–3407. 10.1021/acs.jpcc.5b11840. [DOI] [Google Scholar]
- Carraro P.; Elías V.; García Blanco A.; Sapag K.; Moreno S.; Oliva M.; Eimer G. Synthesis and multi-technique characterization of nickel loaded MCM-41 as potential hydrogen-storage materials. Microporous Mesoporous Mater. 2014, 191, 103–111. 10.1016/j.micromeso.2014.03.005. [DOI] [Google Scholar]
- Karnjanakom S.; Guan G.; Asep B.; Du X.; Hao X.; Samart C.; Abudula A. Catalytic steam reforming of tar derived from steam gasification of sunflower stalk over ethylene glycol assisting prepared Ni/MCM-41. Energy Convers. Manage. 2015, 98, 359–368. 10.1016/j.enconman.2015.04.007. [DOI] [Google Scholar]
- Ye M.; Tao Y.; Jin F.; Ling H.; Wu C.; Williams P. T.; Huang J. Enhancing hydrogen production from the pyrolysis-gasification of biomass by size-confined Ni catalysts on acidic MCM-41 supports. Catal. Today 2018, 307, 154–161. 10.1016/j.cattod.2017.05.077. [DOI] [Google Scholar]
- Yung M. M.; Starace A. K.; Mukarakate C.; Crow A. M.; Leshnov M. A.; Magrini K. A. Biomass Catalytic Pyrolysis on Ni/ZSM-5: Effects of Nickel Pretreatment and Loading. Energy Fuels 2016, 30, 5259–5268. 10.1021/acs.energyfuels.6b00239. [DOI] [Google Scholar]
- Li J.; Yu Y.; Li X.; Wang W.; Yu G.; Deng S.; Huang J.; Wang B.; Wang Y. Maximizing carbon efficiency of petrochemical production from catalytic co-pyrolysis of biomass and plastics using gallium-containing MFI zeolites. Appl. Catal., B 2015, 172-173, 154–164. 10.1016/j.apcatb.2015.02.015. [DOI] [Google Scholar]
- Liu Y.; Li G.; Hu Y.; Wang A.; Lu F.; Zou J.-J.; Cong Y.; Li N.; Zhang T. Integrated Conversion of Cellulose to High-Density Aviation Fuel. Joule 2019, 1028–1036. 10.1016/j.joule.2019.02.005. [DOI] [Google Scholar]
- Gamliel D. P.; Bollas G. M.; Valla J. A. Bifunctional Ni-ZSM-5 Catalysts for the Pyrolysis and Hydropyrolysis of Biomass. Energy Technol. 2017, 5, 172–182. 10.1002/ente.201600136. [DOI] [Google Scholar]
- Wu C.; Wang L.; Williams P. T.; Shi J.; Huang J. Hydrogen production from biomass gasification with Ni/MCM-41 catalysts: Influence of Ni content. Appl. Catal., B 2011, 108-109, 6–13. 10.1016/j.apcatb.2011.07.023. [DOI] [Google Scholar]
- Wu C.; Dong L.; Onwudili J.; Williams P. T.; Huang J. Effect of Ni Particle Location within the Mesoporous MCM-41 Support for Hydrogen Production from the Catalytic Gasification of Biomass. ACS Sustainable Chem. Eng. 2013, 1, 1083–1091. 10.1021/sc300133c. [DOI] [Google Scholar]
- Peng B.; Yao Y.; Zhao C.; Lercher J. A. Towards Quantitative Conversion of Microalgae Oil to Diesel-Range Alkanes with Bifunctional Catalysts. Angew. Chem., Int. Ed 2012, 51, 2072–2075. 10.1002/anie.201106243. [DOI] [PubMed] [Google Scholar]
- Schultz E. L.; Mullen C. A.; Boateng A. A. Aromatic Hydrocarbon Production from Eucalyptus urophylla Pyrolysis over Several Metal-Modified ZSM-5 Catalysts. Energy Technol. 2017, 5, 196–204. 10.1002/ente.201600206. [DOI] [Google Scholar]
- Sunarno; Herman S.; Rochmadi; Mulyono P.; Budiman A. Aip: Effect of Support on Catalytic Cracking of Bio-Oil over Ni/Silica-Alumina. AIP Conf. Proc. 2017, 1823, 020089 10.1063/1.4978162. [DOI] [Google Scholar]
- Szegedi Á.; Popova M. Toluene hydrogenation over nickel-containing MCM-41 and Ti-MCM-41 materials. J. Porous Mater. 2010, 17, 663–668. 10.1007/s10934-009-9336-x. [DOI] [Google Scholar]
- Xu Q.; Zhang Z.; Yan Y. Effect of a Ni-Based Catalyst on Bio-Oil Upgrading under CO Atmosphere. Chem. Eng. Technol. 2013, 36, 2163–2168. 10.1002/ceat.201300170. [DOI] [Google Scholar]
- Abrokwah R. Y.; Deshmane V. G.; Kuila D. Comparative performance of M-MCM-41 (M: Cu, Co, Ni, Pd, Zn and Sn) catalysts for steam reforming of methanol. J. Mol. Catal. A: Chem. 2016, 425, 10–20. 10.1016/j.molcata.2016.09.019. [DOI] [Google Scholar]
- Liu H.; Li Y.; Wu H.; Yang W.; He D. Promoting effect of glucose and β-cyclodextrin on Ni dispersion of Ni/MCM-41 catalysts for carbon dioxide reforming of methane to syngas. Fuel 2014, 136, 19–24. 10.1016/j.fuel.2014.07.022. [DOI] [Google Scholar]
- Noori N.; Nikoorazm M.; Ghorbani-Choghamarani A. Synthesis and characterization of Ni and Zn Schiff base complexes supported on modified MCM-41 as reusable catalysts for various oxidation reactions. J. Porous Mater. 2015, 22, 1607–1615. 10.1007/s10934-015-0044-4. [DOI] [Google Scholar]
- Ibrahim A. A.; Al-Fatesh A. A.; Atia H.; Fakeeha A. H.; Kasim S. O.; Abasaeed A. E. Influence of promoted 5%Ni/MCM-41 catalysts on hydrogen yield in CO2 reforming of CH4. Int. J. Energy Res. 2018, 42, 4120–4130. 10.1002/er.4156. [DOI] [Google Scholar]
- Qiu S.-b.; Weng Y.-j.; Li Y.-p.; Ma L.-l.; Zhang Q.; Wang T.-j. Promotion of Ni/MCM-41 Catalyst for Hydrogenation of Naphthalene by co-Impregnation with Polyols. Chin. J. Chem. Phys. 2014, 27, 433–438. 10.1063/1674-0068/27/04/433-438. [DOI] [Google Scholar]
- Yasyerli S.; Filizgok S.; Arbag H.; Yasyerli N.; Dogu G. Ru incorporated Ni-MCM-41 mesoporous catalysts for dry reforming of methane: Effects of Mg addition, feed composition and temperature. Int. J. Hydrogen Energy 2011, 36, 4863–4874. 10.1016/j.ijhydene.2011.01.120. [DOI] [Google Scholar]
- Chen J.; Li Q.; Ding H.; Pang W.; Xu R. Infrared study on the dehydroxylation of C60-loaded MCM-41. Langmuir 1997, 13, 2050–2054. 10.1021/la960502j. [DOI] [Google Scholar]
- Aronson B. J.; Blanford C. F.; Stein A. Solution-phase grafting of titanium dioxide onto the pore surface of mesoporous silicates: Synthesis and structural characterization. Chem. Mater. 1997, 9, 2842–2851. 10.1021/cm970180k. [DOI] [Google Scholar]
- Leon R.; Margolese D.; Stucky G.; Petroff P. M. Nanocrystalline Ge filaments in the pores of a mesosilicate. Phys. Rev. B 1995, 52, R2285–R2288. 10.1103/PhysRevB.52.R2285. [DOI] [PubMed] [Google Scholar]
- dos Santos M. B.; Andrade H. M. C.; Mascarenhas A. J. S. Oxidative dehydration of glycerol over alternative H,Fe-MCM-22 catalysts: Sustainable production of acrylic acid. Microporous Mesoporous Mater. 2019, 278, 366–377. 10.1016/j.micromeso.2019.01.016. [DOI] [Google Scholar]
- Wang Y.; Yokoi T.; Namba S.; Kondo J. N.; Tatsumi T. Improvement of catalytic performance of MCM-22 in the cracking of n-hexane by controlling the acidic property. J. Catal. 2016, 333, 17–28. 10.1016/j.jcat.2015.10.011. [DOI] [Google Scholar]
- Qiu S.; Xu Y.; Weng Y.; Ma L.; Wang T. Efficient Hydrogenolysis of Guaiacol over Highly Dispersed Ni/MCM-41 Catalyst Combined with HZSM-5. Catalysts 2016, 6, 134. 10.3390/catal6090134. [DOI] [Google Scholar]
- Lu Q.; Guo H.-q.; Zhou M.-x.; Zhang Z.-x.; Cui M.-s.; Zhang Y.-y.; Yang Y.-p.; Zhang L.-b. Monocyclic aromatic hydrocarbons production from catalytic cracking of pine wood-derived pyrolytic vapors over Ce-Mo2N/HZSM-5 catalyst. Sci. Total Environ. 2018, 634, 141–149. 10.1016/j.scitotenv.2018.03.351. [DOI] [PubMed] [Google Scholar]
- Liu D.; Lau R.; Borgna A.; Yang Y. Carbon dioxide reforming of methane to synthesis gas over Ni-MCM-41 catalysts. Appl. Catal., A 2009, 358, 110–118. 10.1016/j.apcata.2008.12.044. [DOI] [Google Scholar]
- Hoffer B. W.; van Langeveld A. D.; Janssens J.-P.; Bonné R. L. C.; Lok C. M.; Moulijn J. A. Stability of highly dispersed Ni/Al2O3 catalysts: Effects of pretreatment. J. Catal. 2000, 192, 432–440. 10.1006/jcat.2000.2867. [DOI] [Google Scholar]
- Pawelec B.; Daza L.; Fierro J. L. G.; Anderson J. A. Regeneration of Ni-USY catalysts used in benzene hydrogenation. Appl. Catal., A 1996, 145, 307–322. 10.1016/0926-860X(96)00134-2. [DOI] [Google Scholar]
- Ojha D. K.; Vinu R. Fast co-pyrolysis of cellulose and polypropylene using Py-GC/MS and Py-FT-IR. RSC Adv. 2015, 5, 66861–66870. 10.1039/C5RA10820A. [DOI] [Google Scholar]
- Zhang X.; Lei H.; Chen S.; Wu J. Catalytic co-pyrolysis of lignocellulosic biomass with polymers: a critical review. Green Chem. 2016, 18, 4145–4169. 10.1039/C6GC00911E. [DOI] [Google Scholar]
- Escola J. M.; Aguado J.; Serrano D. P.; Briones L.; Díaz de Tuesta J. L.; Calvo R.; Fernandez E. Conversion of Polyethylene into Transportation Fuels by the Combination of Thermal Cracking and Catalytic Hydroreforming over Ni-Supported Hierarchical Beta Zeolite. Energy Fuels 2012, 26, 3187–3195. 10.1021/ef300938r. [DOI] [Google Scholar]
- Centeno A.; Laurent E.; Delmon B. Influence of the support of como sulfide catalysts and of the addition of potassium and platinum on the catalytic performances for the hydrodeoxygenation of carbonyl, carboxyl, and guaiacol-type molecules. J. Catal. 1995, 154, 288–298. 10.1006/jcat.1995.1170. [DOI] [Google Scholar]
- Patel M.; Kumar A. Production of renewable diesel through the hydroprocessing of lignocellulosic biomass-derived bio-oil: A review. Renewable Sustainable Energy Rev. 2016, 58, 1293–1307. 10.1016/j.rser.2015.12.146. [DOI] [Google Scholar]
- Echeandia S.; Arias P. L.; Barrio V. L.; Pawelec B.; Fierro J. L. G. Synergy effect in the HDO of phenol over Ni-W catalysts supported on active carbon: Effect of tungsten precursors. Appl. Catal., B 2010, 101, 1–12. 10.1016/j.apcatb.2010.08.018. [DOI] [Google Scholar]
- Zhang H.; Shao S.; Xiao R.; Shen D.; Zeng J. Characterization of Coke Deposition in the Catalytic Fast Pyrolysis of Biomass Derivates. Energy Fuels 2014, 28, 52–57. 10.1021/ef401458y. [DOI] [Google Scholar]
- Kan T.; Strezov V.; Evans T. Catalytic Pyrolysis of Coffee Grounds Using NiCu-Impregnated Catalysts. Energy Fuels 2013, 28, 228–235. 10.1021/ef401511u. [DOI] [Google Scholar]
- Chen L.; Yu Z.; Liang J.; Liao Y.; Ma X. Co-pyrolysis of chlorella vulgaris and kitchen waste with different additives using TG-FTIR and Py-GC/MS. Energy Convers. Manage. 2018, 177, 582–591. 10.1016/j.enconman.2018.10.010. [DOI] [Google Scholar]
- Gómez-Siurana A.; Marcilla A.; Beltrán M.; Berenguer D.; Martínez-Castellanos I.; Catalá L.; Menargues S. TGA/FTIR study of the MCM-41-catalytic pyrolysis of tobacco and tobacco-glycerol mixtures. Thermochim. Acta 2014, 587, 24–32. 10.1016/j.tca.2014.04.017. [DOI] [Google Scholar]
- Wang D.; Xiao R.; Zhang H.; He G. Comparison of catalytic pyrolysis of biomass with MCM-41 and CaO catalysts by using TGA-FTIR analysis. J. Anal. Appl. Pyrolysis 2010, 89, 171–177. 10.1016/j.jaap.2010.07.008. [DOI] [Google Scholar]
- Qiao Y.; Xu F.; Xu S.; Yang D.; Wang B.; Ming X.; Hao J.; Tian Y. Pyrolysis Characteristics and Kinetics of Typical Municipal Solid Waste Components and Their Mixture: Analytical TG-FTIR Study. Energy Fuels 2018, 32, 10801–10812. 10.1021/acs.energyfuels.8b02571. [DOI] [Google Scholar]
Associated Data
This section collects any data citations, data availability statements, or supplementary materials included in this article.


