

In vivo, real-time image-guided CED of a PET-imageable HDAC inhibitor is needed to improve survival in murine models of DIPG.
Abstract
Efforts at altering the dismal prognosis of pediatric midline gliomas focus on direct delivery strategies like convection-enhanced delivery (CED), where a cannula is implanted into tumor. Successful CED treatments require confirmation of tumor coverage, dosimetry, and longitudinal in vivo pharmacokinetic monitoring. These properties would be best determined clinically with image-guided dosimetry using theranostic agents. In this study, we combine CED with novel, molecular-grade positron emission tomography (PET) imaging and show how PETobinostat, a novel PET-imageable HDAC inhibitor, is effective against DIPG models. PET data reveal that CED has significant mouse-to-mouse variability; imaging is used to modulate CED infusions to maximize tumor saturation. The use of PET-guided CED results in survival prolongation in mouse models; imaging shows the need of CED to achieve high brain concentrations. This work demonstrates how personalized image-guided drug delivery may be useful in potentiating CED-based treatment algorithms and supports a foundation for clinical translation of PETobinostat.
INTRODUCTION
Children with diffuse midline glioma (DMG) have a universally poor prognosis. As an example, diffuse intrinsic pontine glioma (DIPG), a subcategory of DMGs, has a median survival of less than 1 year. Radiation therapy does lengthen survival and provide symptomatic benefit, but tumor recurrence is rapid and unremitting, usually measured in weeks. Integrating systemic chemotherapy into treatment approaches has consistently failed to demonstrate clinical benefit (1–4). Therefore, despite continuous efforts, DIPG’s prognosis has been unchanged for decades (2). Because central nervous system (CNS) penetrance of systemically administered chemotherapy is known to be inefficient, direct drug delivery strategies are being explored in early-phase clinical trials (3).
Clinical trials that have used convection-enhanced delivery (CED) for primary malignant glioma and DIPG have demonstrated the safety of this technique (2, 5–11). In one trial using a radiolabeled monoclonal antibody (omburtamab), pharmacokinetic (PK) data using positron emission tomography (PET) has validated the conceptual backbone that local delivery results in high drug concentration in the intended target tissue with negligible systemic exposure (12). Tumor response and clinical benefit have been observed in these trials using CED, but a reproducible survival benefit is yet to be seen (13, 14).
Insufficient tumor coverage and a lack of PK monitoring during CED-based strategies is a leading purported obstacle in achieving a survival benefit (10, 11, 15, 16). As a result, recent emphasis has been placed on intraprocedural and postprocedural distribution monitoring. Surrogate tracers such as magnetic resonance (MR) contrast agents have been used and provide meaningful and rapid assessments of infusate distribution. There remains speculation relating to differential behavior of contrast agents and bioactive therapeutic substrates, and the rapid clearance of surrogate tracers does not allow longitudinal PK monitoring (16–20). Direct drug labeling, i.e., the creation of compounds having both imaging and therapeutic features (theranostics), is a logical method for monitoring drug behavior with direct delivery strategies. This practical application, however, is hindered by the absence of readily available imageable therapeutics.
Inhibiting histone deacetylase (HDAC) activity is one of the most promising therapeutic avenues for treating pediatric DMGs, given these tumors’ overall aberrant epigenetic and chromatin profiles (21). The HDAC inhibitor panobinostat is now in early-phase clinical trials against DIPG (e.g., NCT02717455 and NCT03566199). Achieving high regional concentrations of therapeutic while minimizing total body exposure to a highly toxic drug like panobinostat remains, however, problematic. This problem is compounded by panobinostat’s known poor blood-brain barrier (BBB) penetration (22, 23). Overall, these characteristics make this drug a logical substrate for CED.
To overcome the issues associated with non–image-guided CED and to take advantage of the superior therapeutic profile of locally delivered HDAC inhibitors and other small-molecule therapeutics, we have synthesized PET-visible analogs to the HDAC inhibitor panobinostat. By using innovative radiolabeling chemistry, we achieve single-step radiolabeling of a trifluoroborate trap (24–26).
In this study, we combine these two novel technologies, i.e., (i) safe, direct intracranial delivery (CED) and (ii) image-guided and PET modulation of drug delivery of a PET-visible HDAC inhibitor, PETobinostat, to determine its potential in a theranostic strategy DIPG in vivo. We demonstrate an advantage of combining CED and image-guided dosimetry in achieving therapeutic benefits. This combination allows the in vivo real-time monitoring of CED drug delivery and clearance, thus providing a potential means for modulating delivery in cases of tumor under dosing or unexpectedly rapid clearance following CED (11).This compound, with optimal toxicity against DIPG, can be safely administered via PET-guided CED and monitored in vivo thereafter, paving the way for further clinical translation.
RESULTS
PETobinostat is a potent HDAC inhibitor against multiple DIPG lines in vitro
PETobinostat was synthesized as reported (24). PETobinostat is efficacious, with nanomolar IC50 (50% inhibitory concentration) in multiple histone H3–mutated midline glioma cell lines (SF8628, DIPG XVII, and DIPG XXV), H3–wild-type midline gliomas (SF9427), adult glioblastoma multiforme (GBM) cell lines (U251), patient-derived GBM stem cells [GSC#4701 (27)], and murine brainstem gliomas (mBSGs) that we have generated by extracting syngeneic tumors from affected mice (mBSG) (Fig. 1A; IC50s summarized in table S1). PETobinostat is at least 10-fold more potent toward these cancer cell lines than against replicating brainstem astrocytes used as nontumor controls. Western blot analyses of DIPG IV and DIPG XVII cells treated with increasing doses of PETobinostat show an increase in histone 3 acetylation (H3Ac) with dose escalation (Fig. 1B).
Fig. 1. PETobinostat is bioactive against DIPG in vitro.

(A) Cell survival studies where PETobinostat was incubated with cells for either 2, 3, or 4 days reveal how PETobinostat has high cytotoxicity against an array of DIPG (DIPG XVII, DIPG XXV, SF8628, SF9427, and mBSG) and adult glioma (U251 and 4701) cells lines; reactivity against brainstem astrocytes (control) is diminished. (B) Western blotting demonstrating dose-dependent recovery of H3Ac following PETobinostat treatment in DIPG IV and DIPG XVII. (C) Dynamic studies in DIPG IV and SF8628 demonstrate how a minimum of 6-hour exposure to PETobinostat is needed to affect cytotoxicity. Cytotoxicity increases as exposure to the drug increases. (D) Western blotting illustrates how a minimum of 6-hour exposure is necessary to reestablish H3Ac in DIPG IV and DIPG XVII cell lines.
We determined the minimum amount of time necessary to observe cell death following PETobinostat treatment by removing the drug-containing medium at fixed time points and replacing it with fresh medium during a 72-hour experiment in DIPG IV and SF8628 cells. We observed significant toxicities when drug concentrations are maintained for at least 6 hours, with greater response when exposure is prolonged (Fig. 1C). We confirmed this using Western blotting with DIPG IV and DIPG XVII protein cell lysates, whereby H3Ac is restored after a 6-hour-long treatment, but not after 2 hours (Fig. 1D). As exposure to PETobinostat increased, so did H3Ac levels. Similar results were observed using the non-PET visible HDAC inhibitor panobinostat, which showed a similar pattern of increased cell toxicity and H3Ac with increased dose or exposure time (fig. S1, A to C).
Intraperitoneally delivered PETobinostat is effective against a flank DIPG model in vivo
To determine PETobinostat’s activity in vivo, a mouse model of DIPG was generated by implanting luciferase-tagged SF8628 cells into the flank of athymic-nude mice. Noticeably, such a nonorthotopic model does not consider issues of BBB permeability. Tumor presence was confirmed with luciferase imaging (Fig. 2A). When tumors reached, on average, 140 ± 4.2 mm3 (SEM), daily treatment with panobinostat (10 mg/kg, n = 8—used as control), PETobinostat (12 mg/kg to account for the higher molecular weight, n = 8), or vehicle [the solution in which each drug was dissolved, i.e., 10% dimethyl sulfoxide (DMSO), 36% polyethylene glycol (PEG), 54% phosphate-buffered saline (PBS), n = 7] was given intraperitoneally for 2 weeks (arrows in Fig. 2B). Tumor size was measured at least twice per week. Tumors were left growing until they reached 1500 mm3 or the animal reached euthanasia end points, whichever occurred first. We observed that cohorts of vehicle-treated tumors grew more rapidly than cohorts treated with either panobinostat or PETobinostat: Vehicle-treated tumor volumes were significantly bigger than either group starting at 17 days from treatment initiation [P < 0.05, two-way analysis of variance (ANOVA) with Tukey’s multiple comparisons] and remained bigger thereafter (P < 0.0001). No difference was seen between the two drug groups. Similarly, tumor growth was faster in the vehicle group than in either drug group (fig. S2A). Doubling time, determined by fitting the data to an exponential equation, was higher for the drug groups than for vehicle, but not different across the two drug groups (8.3, 7.4, and 5.1 days for panobinostat, PETobinostat, and vehicle, respectively; fig. S2B). All vehicle-treated animals reached experimental end points within 24 days from treatment initiation; the PETobinostat and panobinostat groups both reached end points by 39 days (Fig. 2B).
Fig. 2. PETobinostat is effective against DIPG in vivo.
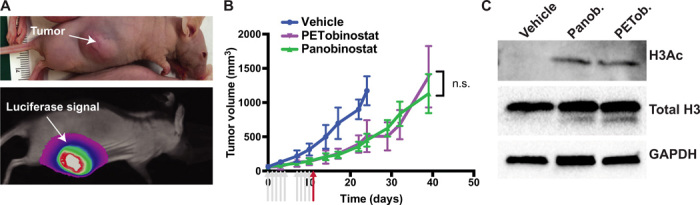
(A) Flank model of DIPG was generated by implanting luciferase-tagged SF8628 cells; luciferin signal was used to confirm tumor presence. (B) Caliper-tumor volume was monitored during and after treatment; panobinostat (blue) and PETobinostat (red) slowed down tumor growth when compared to vehicle (green). n.s., not significant. (C) Western blotting performed on the last day of treatment (red arrow) revealed recovery of H3Ac in panobinostat- or PETobinostat-treated animals, but not in vehicle-treated ones. Photo credit: Umberto Tosi, Weill Cornell Medicine.
In animals sacrificed on the last day of treatment (red arrow), Western blotting was performed, showing a recovery of H3Ac in the panobinostat and PETobinostat groups, but not in vehicle-treated animals (Fig. 2C). Such a recovery of H3Ac was lost by the time the animals reached experimental end points (fig. S2C), overall suggesting the efficacy of our drug in the flank xenograft model.
18F-labeled PETobinostat was also injected intraperitoneally and imaged by PET/CT (computed tomography) for 2 hours thereafter to understand PETobinostat’s in vivo kinetic profile (fig. S2D). During the entirety of the scan, only ~2% of the total injected PETobinostat was found in the tumor (fig. S2E).
PK determination of PETobinostat CED and systemic delivery in naïve animals
To determine the ideal route of administration and dosage regimen for PETobinostat and to gain PK information that would guide scheduling, radiolabeled PETobinostat was administered to different cohorts of mice. PET scans were performed for up to 6 hours following delivery. PET was used to gauge whether PETobinostat could accumulate into the brain at high concentrations via systemic administration. When PETobinostat (200 μl, 100 μM, 500 μCi) was administered either intraperitoneally (n = 4: Fig. 3A and movie S1) or intravenously (n = 5; Fig. 3B and movie S2), we did not observe significant brain penetration when PET signal was measured in the cranium up to 6 hours after injection. In an additional cohort (n = 5), mannitol (25% in PBS) was administered before intravenous delivery of PETobinostat, with the hypothesis that mannitol may increase BBB permeability (11); nonetheless, no significant increase in brain signal was observed (Fig. 3C and movie S3).
Fig. 3. PETobinostat delivery route comparison.
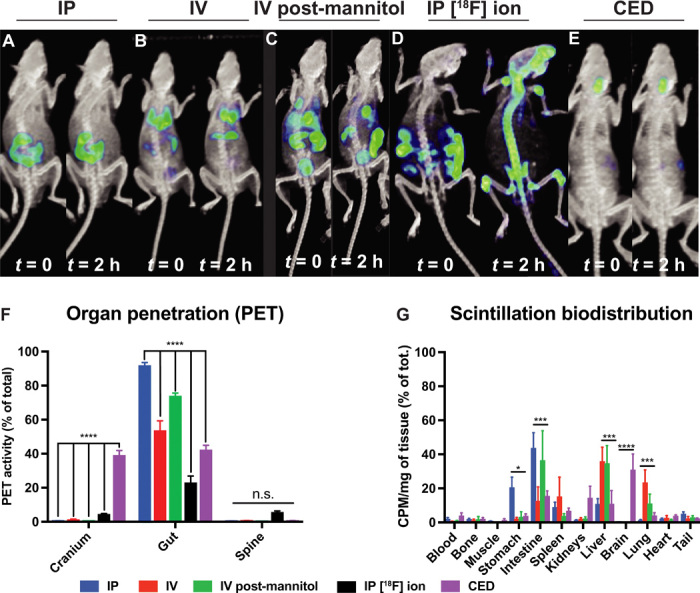
(A to E) PET images taken either at the beginning of the scan (t = 0) or 2 hours thereafter of mice injected with PETobinostat either via intraperitoneally (IP) (A), intravenously (IV) (B), intravenously following mannitol administration (C), or [18F]fluoride ion given intraperitoneally (D), or CED of PETobinostat (E). Only CED shows significant PETobinostat cranial accumulation. (F) Quantification of the PET signal showing significant PETobinostat cranium accumulation following CED but not for other methods of administration. Less PETobinostat was observed in the gut. No difference was seen in the spine. (G) Postmortem scintillation biodistribution showing PETobinostat accumulation only in the brain with CED delivery. PETobinostat accumulation in other organs (stomach, intestine, spleen, and lung) varies with route of administration as expected. CPM, counts per minute.
To confirm PETobinostat’s stability in vivo, [18F]fluoride ion was administered intraperitoneally. Bone uptake was observed in [18F]fluoride ion scans but not when PETobinostat was given, confirming PETobinostat stability (i.e., no defluorination occurred) in vivo (Fig. 3D and movie S4).
To achieve higher brain concentration of PETobinostat, CED was used. PETobinostat (100 μM, 100 μCi, 10 μl) was administered to the pons of naïve mice via a stereotactic apparatus. Two rates of infusions were used; either 0.167 μl/min (injection over 60 min, n = 4; Fig. 3E) or 1.67 μl /min (injection over 6 min, n = 5). In both cases, significant brain signal was observed up to 6 hours after injection (Fig. 3E). By comparison, no more than 1% of the total injected dose of PETobinostat was ever observed in the cranium following systemic administration (two-way ANOVA with Tukey’s multiple comparisons test, P < 0.0001; Fig. 3F). However, if PETobinostat was given via CED, approximately 40% was found in the brain, as measured throughout the post-CED PET scan. Route of delivery affected the amount of PETobinostat found in the gut, with CED having the least amount of gut accumulation. These PET data were confirmed by postmortem γ-scintillated biodistribution, where each organ was harvested and its radioactivity was measured individually (Fig. 3G). In this case, differences were observed across numerous organs (most noticeably, intestine, liver, and lungs), with CED delivery leading to the highest dose of PETobinostat in the brain (two-way ANOVA with Tukey’s multiple comparisons test, P < 0.0001; Fig. 3G). Overall, these results indicate the need for a local delivery approach such as CED.
To better characterize the behavior of PETobinostat following CED, mice were injected with PETobinostat in the pons at different rates of infusion and were scanned for up to 12 hours after CED. Ten microliters of 100 μM, 100 μCi PETobinostat was injected either over 60-min (rate of 0.167 μl/min, n = 4; Fig. 4A and movie S5) or 6-min period (rate of 1.67 μl/min, n = 4; Fig. 4C and movie S6). Dynamic PET scanning started immediately following CED delivery (1 hour or 6 min, respectively) and revealed a significant mouse-to-mouse variability in PETobinostat’s post-delivery kinetics within each cohort (Fig. 4, B and D, respectively), despite virtually identical experimental conditions (injection site, catheter, rate of infusion, operator, and radiolabeled PETobinostat batch). When post-CED clearance data were fit to first-order decay equations (least-squares regression analysis), we observed that the behavior of PETobinostat fell in two statistically different curves, depending on the rate of infusion (P < 0.0001). We determined the post-CED half-life (t1/2) to be 74.6 min [95% confidence interval (CI), 71.39 to 77.82 min; R2 = 0.86] when PETobinostat was injected over 6 min, and 128.1 min (95% CI, 115.1 to 143.4 min; R2 = 0.86) when the same amount was injected over 1 hour (Fig. 4E), thus showing variability across cohorts. To confirm the integrity of PETobinostat, and assess whether defluorination had occurred during the scan, we compared PETobinostat with CED of [18F]fluoride ion, to simulate defluoridation, and found PET tracer diffusion from the delivery site to be different (15). Further, postmortem liquid chromatography–mass spectrometry (LC-MS) was performed, where tissue was harvested immediately after CED of PETobinostat (injected at a rate of 0.167 μl/min) and 4 hours following CED. At the 4-hour mark, on average, 23% of the injected PETobinostat was still present (intact) in tissue, consistent with the PET-determined half-life of 128 min (Fig. 4F). This finding supports the use of PET imaging as an accurate in vivo monitoring tool to determine PETobinostat concentration in the brain.
Fig. 4. PETobinostat post-CED ehavior.

(A to D) PETobinostat was administered via CED to naïve mice at a rate of 0.167 μl/min (1 hour) (A and B) or 1.67 μl/min (6 min) (C and D); mice were then monitored via PET for up to 6 hours (images obtained at each hour-mark for the first 3 hours are shown). The CED site is shown by the white arrow (A and C). Relative PETobinostat concentration as it clears from the cranium following CED are shown (B and D); each line represents each mouse in the cohort. (E) PET-extrapolated data (points) were fit to a single exponential decay equation for each delivery rate (P < 0.0001). (F) After CED, tissue was harvested and processed by LC-MS (black). Data show compound integrity and PETobinostat clearance consistent with PET data (red). (G) Dynamic PET scanning showing the clearance of PETobinostat from the skull following co-infusion with Gd-DTPA. (H) Repeated MRI showing Gd-DTPA clearance from the injection site. (I) Data were fit to a linear equation, which show significantly more rapid clearance of PETobinostat (P < 0.0001).
PETobinostat co-infusion with the MRI contrast agent Gd-DTPA
To assess whether Gd-DTPA (gadalonium–diethylenetriamine pentaacetic acid) MR contrast imaging could serve as a proxy to universally predict post-CED behavior of drugs like PETobinostat, a cohort of mice (n = 7) was injected via CED with a 10-μl solution containing PETobinostat (50 μM, 50 μCi) premixed with Gd-DTPA (1 mM). These mice received a preinjection MR imaging (MRI), followed by CED, and then were monitored by dynamic PET (Fig. 4G) and post-injection MRIs (Fig. 4H). In a set of mice, PET was performed before MRI; in another, the order of imaging was reversed (fig. S3A schematizes our experimental approach). Data obtained (PET clearance and T1 MR data) were normalized to the highest value for each mouse and fit to a linear equation to best approximate each compound’s behavior. Two statistically different (P < 0.0001) lines suggest a 2.4-fold more rapid clearance of PETobinostat than Gd-DTPA (Fig. 4I), highlighting the need for direct drug imaging.
Two mice were injected with PETobinostat over 1 hour, and immediately following injection, brain tissue was harvested and processed for autoradiography, suggesting that this technique could be used as an ex vivo HDAC monitoring tool (fig. S3B).
PETobinostat effects in tumor-bearing animals
Our results indicate that CED is needed to achieve adequate PETobinostat brain penetration in naïve animals. We test this hypothesis on orthotopic tumor-bearing animals. We used an Replication-Competent ASLV long terminal repeat (LTR) with a Splice acceptor (RCAS)–based mouse model of DIPG by injecting 3- to 5-day-old p53-deficient Nestin-tva mice (ntva/p53fl/fl mice) in the pons with immortalized chicken fibroblast DF1 cells, which were transfected with RCAS vectors expressing the following proteins: PDGFB, H3K27M-GFP, CRE, and Luciferase (28). We then assessed whether using CED was necessary in tumor-bearing animals. Mice were monitored for the development of tumor-related symptoms such as food avoidance, ataxia, head tilt, and weight loss. Approximately 1 month following tumor induction, mice were imaged via MRI (T1-weighted sequence), which confirmed tumor presence (Fig. 5A). Mice were then injected with PETobinostat via CED (100 μCi, 10 μl, 100 μM at a rate of 1.67 μl/min) and monitored via PET/CT over time for up to 8 hours following CED (n = 5; Fig. 5B). As expected, PET clearance data showed significant mouse-to-mouse variability in the rate of PETobinostat clearance (Fig. 5C), emphasizing once again the importance of image-guided CED as an individualized technology. The average half-life for PETobinostat to clear from the CED/tumor site was 70.3 min (95% CI, 68.0 to 72.7 min), similar to the clearance rate determined for naïve animals injected at the same infusion rate (Fig. 5D). The dotted red line in Fig. 5D indicates a 1 μM concentration, a concentration of PETobinostat that we consider to be therapeutic (see Fig. 1). Brain tissue was harvested and processed for histology following CED. Typical DIPG features were confirmed including an infiltrative border in the pons with cerebellar sparing, nuclear atypia with mitotic figures, and scant cytoplasm (fig. S4).
Fig. 5. PETobinostat in tumor in vivo kinetics.
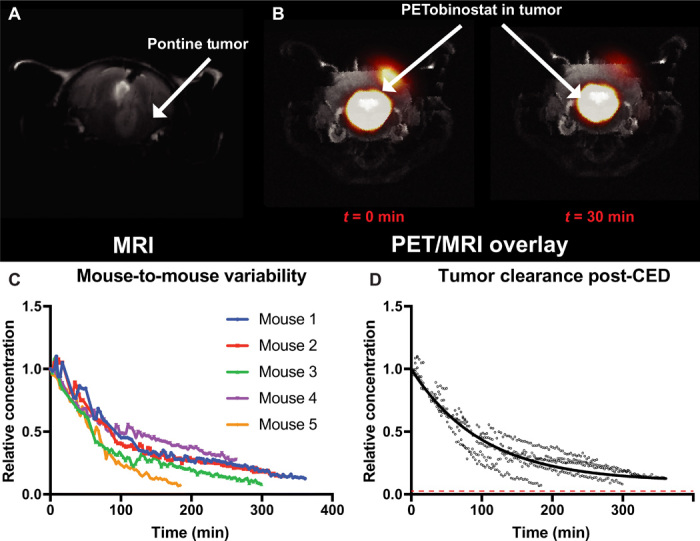
(A) Tumor-bearing mice were scanned with T1-weighted MRI, which confirmed tumor presence (arrow). (B) Following CED of PETobinostat (100 μCi, 10 μl, 100 μM at a rate of 1.67 μl/min), mice were imaged with dynamic PET/CT, later overlaid with MRI, which allowed the determination of PETobinostat concentration at time 0 and thereafter. (C) Significant mouse-to-mouse variability is observed when data points are plotted against time (one color per mouse). (D) PET-extrapolated data were plotted on a one-phase decay equation, which yielded a half-life of 70.3 min. The dotted red line approximates a 1 μM concentration, assumed to be therapeutic.
Given the relatively rapid post-CED clearance rate of PETobinostat measured in tumor-bearing mice as determined via PET (70.3 min), total PETobinostat clearance from the brain would occur in approximately 12 hours (10 half-lives). Xenograft orthotopic mice implanted with SF8628 cells developing DIPG tumors were treated with four repeated CED doses of panobinostat or PETobinostat given at grossly 72-hour intervals, thus allowing the mice sufficient time to recover from each procedure. Infusions were performed over a 6-min period, at a rate of 1.67 μl/min, which mirrors our clinical practice (12). Given the post-CED clearance half-life observed with such a rate, tumor permeation with PETobinostat occurs for at least 12 hours at concentrations above 1 μM (i.e., therapeutic, as per Fig. 1 above). Mice were treated 21 to 24 days after tumor implantation for 2 weeks. Mice were then sacrificed, and their brains were harvested for histological assessment. This mouse model resulted in orthotopic DIPG features (Fig. 6A) including high mitotic activity indicated by Ki67 staining (Fig. 6B). Treatment with either panobinostat or PETobinostat via CED resulted in a decrease in tumor cellularity (P = 0.001, one-way ANOVA; Fig. 6, C and D) and a decrease in overall Ki67+ cycling cells (P = 0.003, one-way ANOVA; Fig. 6, E and F) when compared to vehicle-treated animals, but not in the fraction of replicating cells (fig. S5). CED treatments also resulted in an increase in apoptotic cell death as measured by cleaved caspase-3 (Cc3)–positive cells (P = 0.034, one-way ANOVA; Fig. 6, G and H). Further, either CED treatment, when compared to intraperitoneal administration of vehicle, resulted in an increase in H3Ac in tumor cells (P < 0.0001, one-way ANOVA; Fig. 6, I and J). Systemic treatment with panobinostat failed to achieve any of these results, confirming the need to use CED in treating intracranial DIPGs.
Fig. 6. PETobinostat is efficacious in a DIPG mouse models.

(A and B) Implantation of luciferase-tagged SF8628 cells resulted in the creation of intracranial tumors with pontine features like human DIPG (A) and high mitotic activity (B). (C and D) H&E staining was used to assess tumor cellularity by counting nuclei in high-magnification fields (C); tumors treated via CED had lower cellularity (D). HPF, high-power field. (E and F) Ki67 staining was used to assess tumor mitotic activity (E); tumors treated via CED had fewer dividing cells (F). (G and H) Cc3 staining was used to assess apoptotic cells; black arrows show Cc3+ cells (G); CED-treated tumors had an increase in apoptotic cells, consistently with panobinostat’s and PETobinostat’s mechanism of action (H). (I and J) Staining for H3Ac (I) revealed a recovery of acetylation following treatment (J). (K) Log-rank survival analysis of tumor-bearing RCAS mice. Systemic treatments (either vehicle or panobinostat intraperitoneally), 4× CED of vehicle, or a single CED of panobinostat results in a much shorter survival than 4× CED treatments with either panobinostat or PETobinostat.
To assess survival following CED-based PETobinostat treatment, tumor-bearing RCAS mice were generated by induction in 3- to 5-day-old pups and treated 21 to 24 days following induction for 2 weeks. The CED injection protocol consisted of four separate repeated injections (four doses, 72 hours apart) as determined by our PET data (Fig. 5). Infusions were performed over a 6-min period, at a rate of 1.67 μl/min. CED-treated animals showed a prolonged survival against systemic controls (intraperitoneal vehicle or intraperitoneal panobinostat) or CED of vehicle (median survival of 29, 35, 45, 63, and 67.5 days for vehicle intraperitoneally, panobinostat intraperitoneally, 4× CED vehicle, 4× CED panobinostat, and 4× CED PETobinostat, respectively; P = 0.0001 with log-rank test) (Fig. 6K). Although the 4× CED of PETobinostat group had more long-term survivals than the 4× CED of panobinostat group (as shown by the longer tail in Fig. 6K), the difference between the two groups was not statistically significant with a median survival of 67.5 and 63 days, respectively (P = 0.11 with log-rank test). When we injected mice with panobinostat in a single CED session (an approach that may have been used if PET data were not used to determine PETobinostat rapid clearance), no statistically significant beneficial effect of panobinostat on survival was observed (median survival of 37.5 days, P = 0.74; brown line in Fig. 6K). Brain tissues were harvested and processed for histological analysis at experimental end point. Histopathology analyses revealed features consistent with advanced DIPG, including pontine location and infiltrative border (fig. S6A) and high mitotic activity (fig. S6B). Further, staining for luciferase confirmed successful injection and transfection (fig. S6C). Overall, our PET-guided CED approach resulted in survival prolongation that either systemic or non–PET-guided controls failed to achieve.
PETobinostat safety following CED
A critical step in evaluating CED-based approaches to translate PETobinostat to the clinic is to assess its safety; for this purpose, naïve mice were injected with PETobinostat (10 μl, 100 μM) via CED in the pons (either at a slow rate of 0.167 μl/min or at a fast rate of 1.67 μl/min, to confirm the safety of both approaches). Four CED injections were spaced 72 hours apart to account for the rapid post-CED clearance of PETobinostat from the pons and to maximize meaningful clinical benefit through redosing, as performed with survival studies. Following each CED delivery, mice were monitored daily for signs of neurotoxicity (e.g., head tilt, food or water avoidance, and ataxia) and weighed at least biweekly (fig. S7A). Brain tissues were harvested immediately, at 48 hours, 2 weeks, or 2 months following the fourth CED. Brains were then processed for histopathology and compared to vehicle-injected controls (1% DMSO in PBS) (fig. S7, B and C, respectively). Staining with hematoxylin and eosin (H&E), NeuN, glial fibrillary acidic protein (GFAP), CD3, or Iba1 revealed reactive changes (hemosiderin-laden macrophages, vacuolization, and gliosis) that tended to self-resolve over time, consistently with general CED injection reactive processes. No PETobinostat-specific changes were observed, even when one single CED injection was performed (fig. S8, A and B). Mice tolerated CED well, with no signs of toxicity. On the other hand, mice that received systemic injections of panobinostat demonstrated significant toxicities including weight loss. Histological analyses reveal effacement of the intestinal mucosal membrane, cell sloughing, and cell death (fig. S9).
DISCUSSION
The importance of image guidance in cancer treatment —and CNS malignancies, in particular—is only now being recognized, as poor target penetration or rapid clearance can lead to the development of resistance and recurrence (3). Further, PET-guided delivery can allow an individualized, patient-centered, precision medicine approach to optimize response (29). In this study, we assess the preclinical and translational potential of a novel, PET-imageable HDAC inhibitor, PETobinostat, and provide proofs of concept for its clinical translation. We determine that PETobinostat is effective both in vitro and in vivo against different models of DIPG when administered by PET-guided CED. By monitoring PETobinostat intravenous and intraperitoneal behavior in vivo with PET, we determine PETobinostat’s poor brain-targeting properties and inability to breach the BBB at significant concentrations. Overall, these findings led to the use of local delivery strategies (CED) to achieve significant drug accumulation in the brain. PET imaging of PETobinostat allowed us to determine post-CED brain retention and to optimize dosing schedules and strategies for CED-drug delivery. PET further showed significant variability in post-CED clearance within and across injection cohorts, reiterating the need for PET monitoring of CED. We hypothesize that the intermouse variability stems from the heterogeneity of DIPG tumors and from inherent technical variance (e.g., catheter positioning, efflux, and infusion rates). For instance, proximity to a low-pressure system (e.g., a draining vein, not easily visualized with preoperative imaging even in human patients) could lead to more rapid clearance in both tumor-bearing and naïve mice (12). These factors are not fully predicted preoperatively, emphasizing the need for intra- and postoperative PET imaging. A 4 × 72-hour schedule resulted in a significant survival benefit in orthotopic tumor-bearing mice. Last, we demonstrated how CED of PETobinostat is safe and does not induce neurotoxicities or systemic toxicities, unlike systemic administration of panobinostat.
The use of HDAC inhibitors has been one of the most promising therapeutic avenues in the treatment of DIPG, with now ongoing clinical trials (e.g., NCT02717455 and NCT03566199) using panobinostat (1). The reasons behind current HDAC inhibition success are numerous. First, most of pediatric midline infiltrating gliomas are believed to have an erratic epigenetic profile that favors response to HDAC inhibitors. For instance, a majority of DIPGs harbor a mutation in histones 3.3 (H3.3K27M) and 3.1. In particular, the H3.3K27M mutation results in an impairment in polycomb repressive complex 2 (PRC2) methyltransferase, leading to a global hypomethylation of H3K27 (4). Both H3.3 mutated and wild-type DIPGs have a significant response to HDAC inhibition in preclinical models (28). Molecular subgrouping of pediatric tumors with glioblastoma histology has yielded two major entities involving H3F3A (and more rarely HIST1H3B/C). In particular, the G34R/V and K27M variants appear to represent different clinicopathological and biological subgroups. The 2016 World Health Organization (WHO) classification of CNS tumors explicitly recognizes the K27M mutation as a feature sufficient for classifying midline infiltrating gliomas as WHO grade IV and also discusses the fact that G34 alterations are enriched in pediatric high-grade gliomas involving the cerebral hemispheres (30–33). Second, an extensive molecular meta-analysis has found how H3.3 status yields differences in anatomical location, age at diagnosis, and overall survival (21). In particular, H3.3K27M account for 63% DIPG and conferred a significantly shorter time to death from disease. H3.1/3.2K27M were highly specific to the pons where they had a significantly longer overall survival than H3.3K27M but shorter overall survival than wild type.
The inability of most HDAC inhibitors to bypass the BBB at significant concentrations, however, may hinder ongoing trials that rely on systemic routes of administration, especially given the high toxicity profile and small therapeutic window of most agents (23). For instance, primate studies failed at detecting significant amounts of panobinostat in the cerebrospinal fluid (CSF) following oral delivery of the drug (34). In a small case series, panobinostat was not detected in the CSF of 11 patients treated with the oral formulation of the drug (35). Such poor BBB penetration can explain the failure of preclinical panobinostat studies at showing a survival benefit in DIPG mice (28). Given these data, new trials against DIPG are now relying on local delivery strategies to achieve high regional panobinostat concentrations while limiting systemic toxicities (e.g., NCT03566199).
CED is such a local delivery approach. CED, which relies on direct cannula implantation into tumor tissue, was recently proven safe in a phase 1 clinical trial in children with DIPG (12). In this study, a radiolabeled monoclonal antibody (124I-8H9) was used. Such an approach, where the injectate could be imaged directly, demonstrated significant patient-to-patient variability, consistently with DIPG’s heterogeneity and variable postradiation presentation, and highlighted the need to directly image the infusate. Currently, most CED studies rely on co-injection of an MRI contrast agent like Gd-DTPA to infer behavior of the infused therapeutic. It is unclear, however, whether co-infused proxy agents could provide accurate PK information on the infused therapeutic longitudinally (16). Inaccurate definition of the PK and dosimetry of infused agents is theorized as a leading obstacle to achieving a reproducible survival advantage (10). For these reasons, in this study we have used a novel, PET-imageable HDAC inhibitor, PETobinostat. PETobinostat is a small molecule that is labeled via aqueous isotopic exchange radiochemistry, thus being readily translatable to the clinic.
By using PET to monitor PETobinostat’s behavior in vivo, we observed that systemic delivery limited drug accumulation in normal brain or in DIPG tissue. High brain and tumor concentrations of PETobinostat are achieved via CED. PET imaging shows significant mouse-to-mouse variability within cohorts, highlighting a need for personalized image-guided drug delivery. By using PET to identify the post-CED clearance of PETobinostat (a half-life clearance of approximately 70 min), we are able to optimize a dosing schedule, where mice are allowed enough time to recover following CED, while a pontine lesion is exposed to a therapeutic concentration of PETobinostat for a maximum effective time. This “intelligent” dosing schedule results in a significant survival benefit for DIPG-bearing mice over cohorts treated via systemic delivery. The reported PETobinostat CED schedule is safe and does not result in significant neurotoxicity, unlike high-dose systemic administration of panobinostat, which is known to have numerous side effects in both humans and preclinical models (1, 28).
PET-determined quantitative drug clearance information might logically improve an optimal drug delivery schedule, as previous trials reliant on CED have demonstrated. Without image-guided delivery, many variables make it difficult to accurately predict the fate of an infusate following CED in patients (6–10, 17–20). Variability in CED is further compounded by the high degree of variability between patients (e.g., tumor burden, target volume, and anatomical growth pattern). To monitor drug distribution in CED, surrogate tracers have been successfully used and offer real-time feedback for potentially adjusting infusion parameters (36). Drug co-injection with surrogate agents like Gd-DTPA can approximate the initial post-CED distribution of a therapeutic drug, as both agents are under the same convective force. It remains unclear, however, whether surrogate agents like Gd-DTPA can accurately represent the behavior of a co-injected, bioactive therapeutic over time (37–41). In this study, we have shown that Gd-DTPA cannot accurately reflect the post-CED behavior of PETobinostat; new imaging modalities are now being developed in trying to resolve this issue (42).
The use of direct drug imaging in CED allows us to monitor drug delivery directly on a patient-to-patient basis and further allows us to bypass the need for complex mathematical modeling of drug behavior following CED. Image-guided CED solves numerous problems associated with predicting drug kinetic behavior in vivo. In this study, PETobinostat behavior was accurately modeled to a one-phase decay equation to approximate clearance from the CED site. Whether such an equation could apply to other infusates with longer post-CED half-lives remains unclear (5). The use of 18F, whose decay half-life is 108 min, could be problematic for compositions that are retained at the CED site for longer times that go beyond the imageability of the isotope (15). However, other longer-lived isotopes (124I or 89Zr) could be used instead (12). PET-guided CED provides a significant, personalized advancement over current mathematical modeling of drug delivery (38). The PET and CED technologies presented should be applied to other promising therapeutics for image-guided CED.
MATERIALS AND METHODS
Chemical synthesis and stability determination
The synthesis and radiolabeling of PETobinostat was carried out as previously described (24). PETobinostat has a chemical stability in fetal bovine serum (FBS) and PBS (pH 7.5) solution for at least a week as demonstrated by repeated 1H nuclear magnetic resonance (NMR). PETobinostat is greater than >99% stable in room temperature solution at the 7-day time point.
Cell survival
Proliferation assays were performed to evaluate glioma and DIPG cell sensitivity to PETobinostat (DIPG XVII, DIPG XXV, SF8628, SF9427, U251, 4701, and mBSG cells) and in normal brainstem astrocytes (1, 27, 43). mBSG cells were generated as previously reported (28). Cells were seeded at a density of 5000 cells per well in 96-well plates and treated with increasing concentrations of drug or vehicle for 48, 72, or 96 hours. Cell viability was assessed through quantification of adenosine triphosphate (ATP) (CellTiter-Glo Luminescent Reagent, Promega) according to the manufacturer’s protocol and measured with a PerkinElmer Wallac 1420 Victor 3 luminescence plate reader. The IC50s were calculated using GraphPad Prism software version 7.0 or later fitting a four-parameter nonlinear regression [log (concentration) versus response] to the data.
Dynamic cell survival studies were carried out in DIPG IV or SF8628 cells. Cells were seeded at a density of 5000 cells per well in 96-well plates and treated with increasing concentrations of drug. Drug-containing medium was replaced at 2, 6, 12, 24, or 48 hours after dosing. Cell viability was assessed 72 hours following initial plating.
Western blotting
For Western blotting, cells were plated at a density of 500,000 cells/ml in 3 ml of medium in six-well plates and dosed a day later with increasing doses of PETobinostat for 24 hours (as shown, 0.25, 0.50, 1.0, and 2.0 μM). Lysates were then obtained. Alternatively, lysates were obtained either 2, 6, 12, 24, or 48 hours following dosing at 1 μM PETobinostat.
Cells were lysed in lysis buffer containing 50 mM tris-HCl (pH 8), 150 mM NaCl, 1% NP-40, 0.5% sodium deoxycholate, 0.1% SDS, protease inhibitor cocktail (Cell Signaling Technology, #5871), and phosphatase inhibitor cocktail (Calbiochem Phosphatase Inhibitor Cocktail V, catalog #524629). Protein concentrations of total cell lysates were determined using Eppendorf BioPhotometer D30. Lysates were resolved by SDS–polyacrylamide gel electrophoresis (PAGE) and transferred to polyvinylidene difluoride (PVDF) membranes (Life Technologies). After blocking in 5% milk blocking buffer (Bio-Rad), membranes were incubated with antibodies against acetylated histone H3 (1:1000; Cell Signaling Technology, #47915) and glyceraldehyde-3-phosphate dehydrogenase (GAPDH) (1:1000; Cell Signaling Technology, #5174). Membranes were incubated with the appropriate labeled secondary antibodies (Abcam), and protein was visualized using a ChemiDoc Imaging system.
Flank model of DIPG
A flank model of DIPG was established in athymic-nude mice by implanting subcutaneously in their right flank 40-mm3 chunks from luciferase-tagged SF8628 cell tumors that developed in other athymic-nude mice. One week after implantation, tumor presence was confirmed via luciferase scanning. Treatment with panobinostat (10 mg/kg), PETobinostat (12 mg/kg to account for the higher molecular weight), or vehicle (the solution in which each drug was dissolved, i.e., 10% DMSO, 36% PEG, and 54% PBS) was started when tumors reached, on average, 140 mm3 as measured with a caliper, and was terminated when they reached 1500 mm3 or when mice reached euthanasia end points, whichever occurred sooner. Dosing followed literature examples (1, 28). Samples were harvested for immunoblotting either on the last day of treatment or when they reached euthanasia end points. Animals were sacrificed before harvesting.
CED in the pons
All procedures conducted in mice are approved by the Weill Cornell Medical Center Institutional Animal Care and Use Committee (#2014-0030) and are consistent with the recommendations of the American Veterinary Medical Association and the National Institutes of Health Guide for the Care and Use of Laboratory Animals. Animals were anesthetized with 2% isoflurane and placed on a Kopf 900 model stereotactic frame (David Kopf Instruments, Tujunga, CA). The head was shaved, and area was prepped with povidone iodine and ethanol. A midline incision (5 mm) was made to expose coronal and sagittal sutures. The animal’s head was leveled within the stereotactic frame using bregma and lambda as reference points. Using a dental drill, a 0.2-mm burr hole was made through the skull at 0.5 mm posterior and 1.0 mm lateral to lambda. A 33-gauge needle connected to a 10-μl NanoFil syringe (World Precision Instruments Inc., Sarasota, FL) was then lowered in the pons at a depth of 5 mm. Ten microliters of 100 μM PETobinostat was then administered over a span of either 1 hour (rate of 0.167 μl/min) or 6 min (1.67 μl/min). The needle was retracted 4 min after delivery was finished, wound cleaned, and sutured close. For survival studies, four CEDs were performed, usually on the first and fourth days of two consecutive weeks, trying to keep CED injections evenly spaced. The same burr hole was used for repeated injections. The mice tolerated this injection regimen well.
PET imaging
Following CED of 10 μl, 100 μM, 100 μCi PETobinostat or intraperitoneal or intravenous injection of 200 μl, 100 μM, 500 μCi PETobinostat, animals were kept anesthetized and placed in a Bunker PET/CT scanner at the Citigroup Biomedical Imaging Center (CBIC) of Weill Cornell Medicine. Some animals received an intravenous injection of 25% mannitol in water (100 μl) immediately before intravenous delivery of PETobinostat. PET followed drug delivery and, depending on the experimental design, ranged in length from 15 min to 8 hours. Following imaging, scans were histogrammed and reconstructed using Siemens Inveon Acquisition Workplace and analyzed in DICOM format using AMIDE v1.0.4. Standard unit volumes (1-ml-diameter spheres) placed relevant organs in DICOM data. Decay-corrected region of interest (ROI) data were obtained and plotted versus time, and data were analyzed in GraphPad Prism 7.0 or later version, with fitting of a three-parameter one-phase decay formula to the data. Alternatively, ROI static data that represented PET signal over the entirety of the scan were histogrammed and compared with one-way ANOVA with Tukey’s multiple comparisons.
MR imaging
Tumor-bearing mice were imaged with a 7 Tesla Bunker MRI machine at the CBIC of Weill Cornell Medicine. A T1-weighted sequence with 0.5-mm-thick slices and 100-μm in-plane spatial resolution was mostly used. Mice were anesthetized with 2% isoflurane in oxygen for scanning. They recovered without problems following anesthesia.
Gd-DTPA co-infusion
Before CED, cohorts of animals were imaged with T1-weighted MRI to get a baseline scan. Then, they were injected with a 10-μl solution of PETobinostat (50 μM, 50 μCi) and Gd-DTPA (1 mM). Half of the cohort was followed with dynamic PET for 30 min followed by three MRI scans, each 18 min in length. The other half of the cohort was imaged with three MRI scans first, followed by a 30-min dynamic PET scan. ROIs were drawn over the cranium in both the PET and MRI scan data, and the decrease in signal over time (normalized against tissue control in the case of MRI) was fitted to a linear curve. In this case, given the short length of our measurement, a linear curve appropriately approximates an exponential decay curve. Data were then analyzed in GraphPad Prism 7.0 or later version.
Ex vivo scintillation biodistribution
Mice were anesthetized with 2% isoflurane in oxygen (1 liter/min), their heart was punctured with a 33-gauge needle, and blood was collected while under anesthesia. Thereafter, spinal dislocation was performed, and organs (blood, bone, muscle, stomach, intestine, spleen, both kidneys, liver, brain, lung, heart, and tail) were harvested. Each organ was weighted, and activity was measured with the Wallac Wizard 3″ 1480 Automatic Gamma Counter (18F protocol). Data were then analyzed with GraphPad Prism 7.0, two-way ANOVA with Tukey’s multiple comparisons, as percentage of total injected dose per gram of tissue per mouse.
Detection of PETobinostat by LC-MS
Mouse brain tissues were homogenized, and PETobinostat was extracted using 80% methanol. Targeted LC-MS detection was performed on a Q Exactive Orbitrap mass spectrometer (Thermo Fisher Scientific) coupled to a Vanquish UPLC system (Thermo Fisher Scientific). Q Exactive was operated in negative mode. A Sequant ZIC-HILIC column (2.1 mm inside diameter × 150 mm, Merck) was used for separation. Flow rate was set at 150 μl/min. Buffers consisted of 100% acetonitrile for mobile A, and 0.1% NH4OH/20 mM CH3COONH4 in water for mobile B. Gradient ran from 85 to 30% A in 20 min, followed by a wash with 30% A and re-equilibration at 85% A. PETobinostat was identified on the basis of exact mass within 5 parts per million (ppm) and standard compound retention time. Relative quantitation was performed on the basis of peak area.
Tumor-bearing mice
A genetically engineered mouse model based on p53-deficient Nestin-tva mice (Ntva/p53fl/fl mice) was generated by intracranial injection in the pons of 3- to 5-day-old pups of immortalized chicken fibroblast DF1 cells transfected with RCAS vectors expressing PDGFB, H3K27M-GFP, CRE, and Luciferase (28). Mice were weighted and assessed weekly to monitor symptom development (ataxia, head tilt, food avoidance, etc.).
A xenograft model of DIPG was generated by injecting nonobese diabetic (NOD)/severe combined immunodeficient (SCID) mice (“SCID mice”) into the pons at stereotactic coordinates (1.0 mm to the right, 0.5 mm posterior, and 5.0 mm deep from lambda) with 1 million luciferase-transduced SF8628 cells. In this case, a 29-gauge beveled needle connected to a 10-μl NanoFil syringe (World Precision Instruments Inc.) was used. A 10-μl solution of cells in medium was injected over 4 min, with a 2-min pause halfway through injection. The skull was then closed with dental cement, the incision was sutured, and the animal was allowed to recover. One week following implantation, luciferin scanning confirmed tumor presence. If no signal was present, the animal was sacrificed and excluded from further analysis.
Tissue histology and image analysis
Brains and other organs were harvested and fixed in 4% paraformaldehyde in PBS overnight and then transferred to PBS. Before processing, tissues were kept in 70% ethanol for at least 48 hours. They were fixed in paraffin, sectioned in 5-μm-thick slices, and stained by the Laboratory of Comparative Pathology at Weill Cornell Medicine. These included H&E and the following immunostainings against Ki67 (D3B5) (Cell Signaling Technology, #12202), Cc3 (Asp175, Cc3) (Cell Signaling Technology, #9661), histone 3 acetylation (H3Ac) (Cell Signaling Technology, #47915), firefly luciferase (Abcam, #ab185924), GFAP (Agilent, #Z033429-2), CD3 (Abcam, # ab16669), Iba1 (Abcam, #ab5076), and NeuN (Millipore, #MAB377). Appropriate secondary antibodies were used. H&E, Ki67, GFAP, CD3, and Iba1 were qualitatively reviewed with the help of D. Pisapia, chief of Neuro-Pathology at Weill Cornell Medicine.
Tumor cellularity was determined by counting nuclei on at least five high-power (40×) fields on H&E staining. Ki67 staining was quantified as the number of positive nuclei on at least five high-power (40×) fields. Cc3 staining was quantified as the number of Cc3+ cells in the entirety of the tumor divided by the product of tumor area as determined by Ki67 staining and tumor cellularity, as previously determined, thus giving an apoptosis index. H3Ac was quantified as the number of H3Ac+ nuclei per single 10× field taken in tumor tissue after the image was color-deconvoluted and blurred (Gaussian = 2), and ROIs were set per each nucleus above threshold of staining intensity on Fiji imaging software (fiji.sc). The values thus obtained were then normalized by tumor cellularity, giving an H3 acetylation index. Statistically, the groups were then compared with one-way ANOVA with post hoc multiple comparisons (Tukey’s) test.
Grossly, inflammation and toxicity of our treatment approaches were assessed by a board-certified neuropathologist (D.J.P.), who reviewed different histopathological stainings (as shown in fig. S8) from a wide number of animals.
Survival studies
Tumor-bearing RCAS mice were generated as described above. Treatment was started on the 21st to 24th day after induction. Treatment with either panobinostat given intraperitoneally (10 mg/kg dissolved in 10% DMSO, 36% PEG, and 54% PBS), vehicle given intraperitoneally (10% DMSO, 36% PEG, and 54% PBS), one or four CEDs of panobinostat (10 μl, 100 μM in 1% DMSO in PBS per CED), four CEDs of PETobinostat (10 μl, 100 μM in 1% DMSO in PBS per CED), or four CEDs of vehicle (1% DMSO in PBS) was conducted over 2 weeks. Mice tolerated all treatments better than intraperitoneal administration of panobinostat, known to have high toxicity (1, 23, 28). Animals were sacrificed as described above when their body weight dropped by at least 10% in two consecutive measurements or within a week or when they reached other euthanasia end points, in accordance with Weill Cornell Medical Center Institutional Animal Care and Use Committee protocols.
Statistical analysis
Statistical analysis was carried out using GraphPad Prism software version 7.0 or later. To compare more than two groups, a one-way ANOVA with post hoc multiple comparisons was used. To compare more than two groups across more than one variable, a two-way ANOVA with post hoc multiple comparisons was used. Appropriate post hoc tests are described in their relevant section. Curve fitting was carried out using GraphPad Prism software version 7.0 or later, as described. The built-in curve comparison tool was used to assess whether two curves were significantly different from one another. Statistical significance is assumed for a P value of <0.05, unless otherwise stated.
Supplementary Material
Acknowledgments
We are grateful for the help of S. Mukherjee in quantifying levels of acetylated histone 3. We are also grateful to M. Monje (Stanford University, CA) and N. Gupta (University of California, San Francisco, CA) for the sharing of their cell lines. Funding: This work was supported, in part, by the Cristian Rivera Foundation, the Olivia Boccuzzi Foundation, the Fly a Kite Foundation, the McKenna Claire Foundation, The Lyonhearted Foundation, the Christian Koehler Foundation, the Brooke Healey Foundation, the Isabella Rose Romano Foundation, the Joshua’s Wish, the Lily LaRue Foundation, the Samuel Jeffers Childhood Cancer Foundation, the Ty Louis Campbell Foundation, and the Children’s Brain Tumor Family Foundation and by grants from the Alex Lemonade Stand Foundation (Innovation Grant) and the Department of Defense (CA160373). Author contributions: Experimental design: U.T., H.K., U.B.M., G.Z., N.D., D.J.P., R.T., and M.M.S.; experimental implementation: U.T., H.K., O.A., H.G., N.C., T.S., and R.T.; data analysis: U.T., H.K., N.D., D.J.P., R.T., and M.M.S.; manuscript writing and editing: U.T., H.K., N.D., D.J.P., R.T., and M.M.S.; manuscript approval: all authors. Competing interests: The authors declare that they have no competing interests. Data and materials availability: All data needed to evaluate the conclusions in the paper are present in the paper and/or the Supplementary Materials. Additional data related to this paper may be requested from the authors. The authors are grateful to M. Monje (Stanford University) for providing the DIPG XVII and DIPG XXV following MTA, to N. Gupta (University of California, San Francisco) for providing the SF8628 cell line following MTA, and to O. Becher (Northwestern University) for providing the RCAS plasmids following MTA. Requests for these materials should be submitted to their respective institutions.
SUPPLEMENTARY MATERIALS
Supplementary material for this article is available at http://advances.sciencemag.org/cgi/content/full/6/30/eabb4105/DC1
REFERENCES AND NOTES
- 1.Grasso C. S., Tang Y., Truffaux N., Berlow N. E., Liu L., Debily M.-A., Quist M. J., Davis L. E., Huang E. C., Woo P. J., Ponnuswami A., Chen S., Johung T. B., Sun W., Kogiso M., Du Y., Qi L., Huang Y., Hütt-Cabezas M., Warren K. E., Le Dret L., Meltzer P. S., Mao H., Quezado M., van Vuurden D. G., Abraham J., Fouladi M., Svalina M. N., Wang N., Hawkins C., Nazarian J., Alonso M. M., Raabe E. H., Hulleman E., Spellman P. T., Li X.-N., Keller C., Pal R., Grill J., Monje M., Functionally defined therapeutic targets in diffuse intrinsic pontine glioma. Nat. Med. 21, 555–559 (2015). [DOI] [PMC free article] [PubMed] [Google Scholar]
- 2.Gwak H.-S., Park H. J., Developing chemotherapy for diffuse pontine intrinsic gliomas (DIPG). Crit. Rev. Oncol. Hematol. 120, 111–119 (2017). [DOI] [PubMed] [Google Scholar]
- 3.Warren K. E., Beyond the Blood:Brain barrier: The importance of central nervous system (CNS) pharmacokinetics for the treatment of cns tumors, including diffuse intrinsic pontine glioma. Front. Oncol. 8, 239 (2018). [DOI] [PMC free article] [PubMed] [Google Scholar]
- 4.Wu G., Broniscer A., McEachron T., Lu C., Paugh B. S., Becksfort J., Qu C., Ding L., Huether R., Parker M., Zhang J., Gajjar A., Dyer M. A., Mullighan C. G., Gilbertson R. J., Mardis E. R., Wilson R. K., Downing J. R., Ellison D. W., Zhang J., Baker S. J.; St. Jude Children’s Research Hospital–Washington University Pediatric Cancer Genome Project , Somatic histone H3 alterations in pediatric diffuse intrinsic pontine gliomas and non-brainstem glioblastomas. Nat. Genet. 44, 251–253 (2012). [DOI] [PMC free article] [PubMed] [Google Scholar]
- 5.Chittiboina P., Heiss J. D., Warren K. E., Lonser R. R., Magnetic resonance imaging properties of convective delivery in diffuse intrinsic pontine gliomas. J. Neurosurg. Pediatr. 13, 276–282 (2014). [DOI] [PMC free article] [PubMed] [Google Scholar]
- 6.Heiss J. D., Jamshidi A., Shah S., Martin S., Wolters P. L., Argersinger D. P., Warren K. E., Lonser R. R., Phase I trial of convection-enhanced delivery of IL13-Pseudomonas toxin in children with diffuse intrinsic pontine glioma. J. Neurosurg. Pediatr. 23, 333–342 (2018). [DOI] [PMC free article] [PubMed] [Google Scholar]
- 7.Himes B. T., Zhang L., Daniels D. J., Treatment strategies in diffuse midline gliomas with the H3K27M mutation: The role of convection-enhanced delivery in overcoming anatomic challenges. Front. Oncol. 9, 31 (2019). [DOI] [PMC free article] [PubMed] [Google Scholar]
- 8.Kunwar S., Chang S., Westphal M., Vogelbaum M., Sampson J., Barnett G., Shaffrey M., Ram Z., Piepmeier J., Prados M., Croteau D., Pedain C., Leland P., Husain S. R., Joshi B. H., Puri R. K.; PRECISE Study Group , Phase III randomized trial of CED of IL13-PE38QQR vs Gliadel wafers for recurrent glioblastoma. Neuro Oncol. 12, 871–881 (2010). [DOI] [PMC free article] [PubMed] [Google Scholar]
- 9.Sampson J. H., Akabani G., Archer G. E., Berger M. S., Coleman R. E., Friedman A. H., Friedman H. S., Greer K., Herndon J. E. II, Kunwar S., McLendon R. E., Paolino A., Petry N. A., Provenzale J. M., Reardon D. A., Wong T. Z., Zalutsky M. R., Pastan I., Bigner D. D., Intracerebral infusion of an EGFR-targeted toxin in recurrent malignant brain tumors. Neuro Oncol. 10, 320–329 (2008). [DOI] [PMC free article] [PubMed] [Google Scholar]
- 10.Sampson J. H., Archer G., Pedain C., Wembacher-Schröder E., Westphal M., Kunwar S., Vogelbaum M. A., Coan A., Herndon J. E., Raghavan R., Brady M. L., Reardon D. A., Friedman A. H., Friedman H. S., Rodríguez-Ponce M. I., Chang S. M., Mittermeyer S., Croteau D., Puri R. K.; PRECISE Trial Investigators , Poor drug distribution as a possible explanation for the results of the PRECISE trial. J. Neurosurg. 113, 301–309 (2010). [DOI] [PubMed] [Google Scholar]
- 11.Tosi U., Marnell C. S., Chang R., Cho W. C., Ting R., Maachani U. B., Souweidane M. M., Advances in molecular imaging of locally delivered targeted therapeutics for central nervous system tumors. Int. J. Mol. Sci. 18, 351 (2017). [DOI] [PMC free article] [PubMed] [Google Scholar]
- 12.Souweidane M. M., Kramer K., Pandit-Taskar N., Zhou Z., Haque S., Zanzonico P., Carrasquillo J. A., Lyashchenko S. K., Thakur S. B., Donzelli M., Turner R. S., Lewis J. S., Cheung N.-K. V., Larson S. M., Dunkel I. J., Convection-enhanced delivery for diffuse intrinsic pontine glioma: A single-centre, dose-escalation, phase 1 trial. Lancet Oncol. 19, 1040–1050 (2018). [DOI] [PMC free article] [PubMed] [Google Scholar]
- 13.Uckun F. M., Qazi S., Hwang L., Trieu V. N., Recurrent or refractory high-grade gliomas treated by convection-enhanced delivery of a TGFβ2-targeting RNA therapeutic: A post-hoc analysis with long-term follow-up. Cancers 11, 1892 (2019). [DOI] [PMC free article] [PubMed] [Google Scholar]
- 14.Kuzan-Fischer C. M., Souweidane M. M., The intersect of neurosurgery with diffuse intrinsic pontine glioma. J. Neurosurg. Pediatr. 24, 611–621 (2019). [DOI] [PubMed] [Google Scholar]
- 15.Tosi U., Kommidi H., Bellat V., Marnell C. S., Guo H., Adeuyan O., Schweitzer M. E., Chen N., Su T., Zhang G., Maachani U. B., Pisapia D. J., Law B., Souweidane M. M., Ting R., Real-time, in vivo correlation of molecular structure with drug distribution in the brain striatum following convection enhanced delivery. ACS Chem. Neurosci. 10, 2287–2298 (2019). [DOI] [PubMed] [Google Scholar]
- 16.Tosi U., Souweidane M. M., Longitudinal monitoring of Gd-DTPA following convection enhanced delivery in the brainstem. World Neurosurg. 137, 38–42 (2020). [DOI] [PubMed] [Google Scholar]
- 17.Mehta A. I., Choi B. D., Raghavan R., Brady M., Friedman A. H., Bigner D. D., Pastan I., Sampson J. H., Imaging of convection enhanced delivery of toxins in humans. Toxins 3, 201–206 (2011). [DOI] [PMC free article] [PubMed] [Google Scholar]
- 18.Mueller S., Polley M.-Y., Lee B., Kunwar S., Pedain C., Wembacher-Schröder E., Mittermeyer S., Westphal M., Sampson J. H., Vogelbaum M. A., Croteau D., Chang S. M., Effect of imaging and catheter characteristics on clinical outcome for patients in the PRECISE study. J. Neurooncol 101, 267–277 (2011). [DOI] [PMC free article] [PubMed] [Google Scholar]
- 19.Sampson J. H., Brady M. L., Petry N. A., Croteau D., Friedman A. H., Friedman H. S., Wong T., Bigner D. D., Pastan I., Puri R. K., Pedain C., Intracerebral infusate distribution by convection-enhanced delivery in humans with malignant gliomas: Descriptive effects of target anatomy and catheter positioning. Neurosurgery 60, ONS89–ONS98 (2007). [DOI] [PubMed] [Google Scholar]
- 20.Sampson J. H., Raghavan R., Brady M. L., Provenzale J. M., Herndon J. E. II, Croteau D., Friedman A. H., Reardon D. A., Coleman R. E., Wong T., Bigner D. D., Pastan I., Rodríguez-Ponce M. I., Tanner P., Puri R., Pedain C., Clinical utility of a patient-specific algorithm for simulating intracerebral drug infusions. Neuro Oncol. 9, 343–353 (2007). [DOI] [PMC free article] [PubMed] [Google Scholar]
- 21.Mackay A., Burford A., Carvalho D., Izquierdo E., Fazal-Salom J., Taylor K. R., Bjerke L., Clarke M., Vinci M., Nandhabalan M., Temelso S., Popov S., Molinari V., Raman P., Waanders A. J., Han H. J., Gupta S., Marshall L., Zacharoulis S., Vaidya S., Mandeville H. C., Bridges L. R., Martin A. J., Al-Sarraj S., Chandler C., Ng H.-K., Li X., Mu K., Trabelsi S., H’mida-Ben Brahim D., Kisljakov A. N., Konovalov D. M., Moore A. S., Carcaboso A. M., Sunol M., de Torres C., Cruz O., Mora J., Shats L. I., Stavale J. N., Bidinotto L. T., Reis R. M., Entz-Werle N., Farrell M., Cryan J., Crimmins D., Caird J., Pears J., Monje M., Debily M.-A., Castel D., Grill J., Hawkins C., Nikbakht H., Jabado N., Baker S. J., Pfister S. M., Jones D. T. W., Fouladi M., von Bueren A. O., Baudis M., Resnick A., Jones C., Integrated molecular meta-analysis of 1,000 pediatric high-grade and diffuse intrinsic pontine glioma. Cancer Cell 32, 520–537.e5 (2017). [DOI] [PMC free article] [PubMed] [Google Scholar]
- 22.Singleton W. G. B., Bienemann A. S., Woolley M., Johnson D., Lewis O., Wyatt M. J., Damment S. J. P., Boulter L. J., Killick-Cole C. L., Asby D. J., Gill S. S., The distribution, clearance, and brainstem toxicity of panobinostat administered by convection-enhanced delivery. J. Neurosurg. Pediatr. 22, 288–296 (2018). [DOI] [PubMed] [Google Scholar]
- 23.Bringhen S., De Wit E., Dimopoulos M.-A., New agents in multiple myeloma: An examination of safety profiles. Clin. Lymphoma Myeloma Leukemia 17, 391–407.e5 (2017). [DOI] [PubMed] [Google Scholar]
- 24.Kommidi H., Tosi U., Maachani U. B., Guo H., Marnell C. S., Law B., Souweidane M. M., Ting R., 18F-radiolabeled panobinostat allows for positron emission tomography guided delivery of a histone deacetylase inhibitor. ACS Med. Chem. Lett. 9, 114–119 (2018). [DOI] [PMC free article] [PubMed] [Google Scholar]
- 25.Wang M., Kommidi H., Tosi U., Guo H., Zhou Z., Schweitzer M. E., Wu L. Y., Singh R., Hou S., Law B., Ting R., Souweidane M. M., A murine model for quantitative, real-time evaluation of convection-enhanced delivery (RT-CED) using an 18[F]-positron emitting, fluorescent derivative of dasatinib. Mol. Cancer Ther. 16, 2902–2912 (2017). [DOI] [PMC free article] [PubMed] [Google Scholar]
- 26.An F.-F., Chan M., Kommidi H., Ting R., Dual PET and near-infrared fluorescence imaging probes as tools for imaging in oncology. AJR Am. J. Roentgenol. 207, 266–273 (2016). [DOI] [PMC free article] [PubMed] [Google Scholar]
- 27.Roccograndi L., Binder Z. A., Zhang L., Aceto N., Zhang Z., Bentires-Alj M., Nakano I., Dahmane N., O’Rourke D. M., SHP2 regulates proliferation and tumorigenicity of glioma stem cells. J. Neurooncol 135, 487–496 (2017). [DOI] [PubMed] [Google Scholar]
- 28.Hennika T., Hu G., Olaciregui N. G., Barton K. L., Ehteda A., Chitranjan A., Chang C., Gifford A. J., Tsoli M., Ziegler D. S., Carcaboso A. M., Becher O. J., Pre-clinical study of panobinostat in xenograft and genetically engineered murine diffuse intrinsic pontine glioma models. PLOS ONE 12, e0169485 (2017). [DOI] [PMC free article] [PubMed] [Google Scholar]
- 29.Blau R., Krivitsky A., Epshtein Y., Satchi-Fainaro R., Are nanotheranostics and nanodiagnostics-guided drug delivery stepping stones towards precision medicine? Drug Resist. Updat. 27, 39–58 (2016). [DOI] [PubMed] [Google Scholar]
- 30.Bender S., Tang Y., Lindroth A. M., Hovestadt V., Jones D. T. W., Kool M., Zapatka M., Northcott P. A., Sturm D., Wang W., Radlwimmer B., Højfeldt J. W., Truffaux N., Castel D., Schubert S., Ryzhova M., Seker-Cin H., Gronych J., Johann P. D., Stark S., Meyer J., Milde T., Schuhmann M., Ebinger M., Monoranu C.-M., Ponnuswami A., Chen S., Jones C., Witt O., Collins V. P., von Deimling A., Jabado N., Puget S., Grill J., Helin K., Korshunov A., Lichter P., Monje M., Plass C., Cho Y.-J., Pfister S. M., Reduced H3K27me3 and DNA hypomethylation are major drivers of gene expression in K27M mutant pediatric high-grade gliomas. Cancer Cell 24, 660–672 (2013). [DOI] [PubMed] [Google Scholar]
- 31.Schwartzentruber J., Korshunov A., Liu X.-Y., Jones D. T. W., Pfaff E., Jacob K., Sturm D., Fontebasso A. M., Quang D.-A. K., Tönjes M., Hovestadt V., Albrecht S., Kool M., Nantel A., Konermann C., Lindroth A., Jäger N., Rausch T., Ryzhova M., Korbel J. O., Hielscher T., Hauser P., Garami M., Klekner A., Bognar L., Ebinger M., Schuhmann M. U., Scheurlen W., Pekrun A., Frühwald M. C., Roggendorf W., Kramm C., Dürken M., Atkinson J., Lepage P., Montpetit A., Zakrzewska M., Zakrzewski K., Liberski P. P., Dong Z., Siegel P., Kulozik A. E., Zapatka M., Guha A., Malkin D., Felsberg J., Reifenberger G., von Deimling A., Ichimura K., Collins V. P., Witt H., Milde T., Witt O., Zhang C., Castelo-Branco P., Lichter P., Faury D., Tabori U., Plass C., Majewski J., Pfister S. M., Jabado N., Driver mutations in histone H3.3 and chromatin remodelling genes in paediatric glioblastoma. Nature 482, 226–231 (2012). [DOI] [PubMed] [Google Scholar]
- 32.Louis D. N., Giannini C., Capper D., Paulus W., Figarella-Branger D., Lopes M. B., Batchelor T. T., Cairncross J. G., van den Bent M., Wick W., Wesseling P., cIMPACT-NOW update 2: Diagnostic clarifications for diffuse midline glioma, H3 K27M-mutant and diffuse astrocytoma/anaplastic astrocytoma, IDH-mutant. Acta Neuropathol. 135, 639–642 (2018). [DOI] [PubMed] [Google Scholar]
- 33.Louis D. N., Perry A., Reifenberger G., von Deimling A., Figarella-Branger D., Cavenee W. K., Ohgaki H., Wiestler O. D., Kleihues P., Ellison D. W., The 2016 World Health Organization classification of tumors of the central nervous system: A summary. Acta Neuropathol. 131, 803–820 (2016). [DOI] [PubMed] [Google Scholar]
- 34.Rodgers L., McCully C. L., Peer C., Cruz R., Figg W., HG-36: Plasma and cerebrospinal fluid (CSF) pharmacokinetics of panobinostat following oral administration to nonhuman primates. Neuro Oncol. 18, iii55 (2016). [Google Scholar]
- 35.Rasmussen T. A., Tolstrup M., Møller H. J., Brinkmann C. R., Olesen R., Erikstrup C., Laursen A. L., Østergaard L., Søgaard O. S., Activation of latent human immunodeficiency virus by the histone deacetylase inhibitor panobinostat: A pilot study to assess effects on the central nervous system. Open Forum Infect. Dis. 2, ofv037 (2015). [DOI] [PMC free article] [PubMed] [Google Scholar]
- 36.Sudhakar V., Naidoo J., Samaranch L., Bringas J. R., Lonser R. R., Fiandaca M. S., Bankiewicz K. S., Infuse-as-you-go convective delivery to enhance coverage of elongated brain targets: Technical note. J. Neurosurg. 2019, 1–8 (2019). [DOI] [PubMed] [Google Scholar]
- 37.Barua N. U., Bienemann A. S., Woolley M., Wyatt M. J., Johnson D., Lewis O., Irving C., Pritchard G., Gill S., Convection-enhanced delivery of MANF—Volume of distribution analysis in porcine putamen and substantia nigra. J. Neurol. Sci. 357, 264–269 (2015). [DOI] [PubMed] [Google Scholar]
- 38.Belova E., Shaffer C. L., Trapa P. E., Insights from mathematical modeling for convection-enhanced intraputamenal delivery of GDNF. Med. Biol. Eng. Comput. 55, 2069–2077 (2017). [DOI] [PMC free article] [PubMed] [Google Scholar]
- 39.Hardy P. A., Keeley D., Schorn G., Forman E., Ai Y., Venugopalan R., Zhang Z., Bradley L. H., Convection enhanced delivery of different molecular weight tracers of gadolinium-tagged polylysine. J. Neurosci. Methods 219, 169–175 (2013). [DOI] [PubMed] [Google Scholar]
- 40.Sonabend A. M., Stuart R. M., Yun J., Yanagihara T., Mohajed H., Dashnaw S., Bruce S. S., Brown T., Romanov A., Sebastian M., Arias-Mendoza F., Bagiella E., Canoll P., Bruce J. N., Prolonged intracerebral convection-enhanced delivery of topotecan with a subcutaneously implantable infusion pump. Neuro Oncol. 13, 886–893 (2011). [DOI] [PMC free article] [PubMed] [Google Scholar]
- 41.Sugiyama S.-i., Saito R., Nakamura T., Yamashita Y., Yokosawa M., Sonoda Y., Kumabe T., Watanabe M., Tominaga T., Safety and feasibility of convection-enhanced delivery of nimustine hydrochloride coinfused with free gadolinium for real-time monitoring in the primate brain. Neurol. Res. 34, 581–587 (2012). [DOI] [PubMed] [Google Scholar]
- 42.Stephen Z. R., Chiarelli P. A., Revia R. A., Wang K., Kievit F., Dayringer C., Jeon M., Ellenbogen R., Zhang M., Time-resolved MRI assessment of convection-enhanced delivery by targeted and nontargeted nanoparticles in a human glioblastoma mouse model. Cancer Res. 79, 4776–4786 (2019). [DOI] [PMC free article] [PubMed] [Google Scholar]
- 43.Olow A., Mueller S., Yang X., Hashizume R., Meyerowitz J., Weiss W., Resnick A. C., Waanders A. J., Stalpers L. J. A., Berger M. S., Gupta N., James C. D., Petritsch C. K., Haas-Kogan D. A., BRAF status in personalizing treatment approaches for pediatric gliomas. Clin. Cancer Res. 22, 5312–5321 (2016). [DOI] [PMC free article] [PubMed] [Google Scholar]
Associated Data
This section collects any data citations, data availability statements, or supplementary materials included in this article.
Supplementary Materials
Supplementary material for this article is available at http://advances.sciencemag.org/cgi/content/full/6/30/eabb4105/DC1