

Single-cell RNA sequencing provides new insights into pathologic epithelial and mesenchymal remodeling in the human lung.
Abstract
Pulmonary fibrosis (PF) is a form of chronic lung disease characterized by pathologic epithelial remodeling and accumulation of extracellular matrix (ECM). To comprehensively define the cell types, mechanisms, and mediators driving fibrotic remodeling in lungs with PF, we performed single-cell RNA sequencing of single-cell suspensions from 10 nonfibrotic control and 20 PF lungs. Analysis of 114,396 cells identified 31 distinct cell subsets/states. We report that a remarkable shift in epithelial cell phenotypes occurs in the peripheral lung in PF and identify several previously unrecognized epithelial cell phenotypes, including a KRT5−/KRT17+ pathologic, ECM-producing epithelial cell population that was highly enriched in PF lungs. Multiple fibroblast subtypes were observed to contribute to ECM expansion in a spatially discrete manner. Together, these data provide high-resolution insights into the complexity and plasticity of the distal lung epithelium in human disease and indicate a diversity of epithelial and mesenchymal cells contribute to pathologic lung fibrosis.
INTRODUCTION
Pulmonary fibrosis (PF) is a form of chronic lung disease characterized by progressive accumulation of extracellular matrix (ECM) in the peripheral lung, accompanied by destruction of functional alveolar gas exchange units (1). PF is a clinical phenotype that reflects the end stage of chronic interstitial lung diseases (ILDs) of both known and unknown causes. The most severe form of PF, idiopathic PF (IPF), is a relentlessly progressive disorder of unknown cause that leads to respiratory failure and death or lung transplantation within 3 to 5 years of diagnosis (2). Spatially heterogeneous expansion of interstitial collagen and ECM (i.e., “temporal heterogeneity”) is a defining feature of the histopathology of IPF (3). Genetic evidence suggests that the lung epithelium plays a central role in disease susceptibility and initiation (4–6), while epithelial-mesenchymal interactions have been proposed to play a central role in driving pathologic epithelial remodeling and ECM expansion in PF (7). While there have been advances in identifying factors that regulate fibrosis in experimental models (8), to date, there has been limited progress toward developing an integrated understanding of the central mechanisms driving pathologic epithelial remodeling and ECM expansion in the human lung. Bulk tissue–based genomic studies have provided insights into the molecular programs that characterize PF lungs (9–13), but the inherent spatial heterogeneity of disease pathology and large-scale changes in cell types present in diseased tissue have limited the ability of these studies to identify key mechanistic mediators. Single-cell biology approaches including single-cell RNA sequencing (scRNA-seq) offer the potential to overcome these limitations inherent to bulk tissue–based analyses (14, 15), and throughout the past decade, advances in microfluidic technologies now enable simultaneously transcriptomic profiling of thousands of individual cells (16–18). Initial proof-of-concept studies have demonstrated feasibility of these approaches in the airway epithelium (19, 20) and peripheral lung in PF (21–24), with a focus on macrophages phenotypes (21, 24) and type II alveolar epithelial cells (22, 23) in a small number of samples.
To develop a more comprehensive understanding of the diversity of cell types, states, and molecular programs in PF lungs, we performed scRNA-seq of single-cell suspensions generated from 20 PF and 10 nonfibrotic control lungs. Unbiased analyses revealed a spectrum of pathologic epithelial cell states and programs that are found in the fibrotic distal lung. We identified multiple distinct epithelial and mesenchymal lineages contributing to ECM expansion in PF lungs. In addition to myofibroblasts, we identified a unique HAS1hi ECM-producing population, which is markedly enriched in lungs from patients with IPF and localizes to peripheral and subpleural regions. We also found a previously undescribed KRT5−/KRT17+ epithelial cell population expressing collagen and other ECM components that is conserved across a subset of histopathologic patterns of PF. Together, these high-resolution transcriptomic data and the identification of multiple previously undescribed pathologic cell types provide remarkable insights into the cellular architecture of the human lung and the fundamental mechanisms driving disease pathology in PF.
RESULTS
To determine the cellular populations and mediators shared across different forms of PF, we generated single-cell suspensions from peripheral lung tissue of explanted lungs from patients with IPF (n = 12), chronic hypersensitivity pneumonitis (n = 3), nonspecific interstitial pneumonia (NSIP; n = 2), sarcoidosis (n = 2), unclassifiable ILD (n = 1), and nonfibrotic controls (declined donors; n = 10; tobacco users, 8 of 10) (table S1) and performed scRNA-seq using the 10x Genomics Chromium platform (see Materials and Methods and Fig. 1A). The samples were collected and processed at two different sites (table S2, detailed metadata from each sample); however, both sites collected cases and controls. In an effort to maximize our ability to identify rare cell populations, we jointly analyzed data from all samples. We defined inclusion criteria for cells based on observations from the entire dataset, removed low-quality cells accordingly, then performed dimensionality reduction, and unsupervised clustering of the 114,396 recovered cells using the Seurat (25, 26) package in R (see Materials and Methods and fig. S1). Notably, we did not observe over batch effects driven by processing site or sequencing batch in our dimensionality reduction and visualization (fig. S2). This may be due in part to the normalization and variance stabilization approach used in Seurat V3 (26). Using canonical lineage-defining markers to annotate clusters, we defined 31 cell types/states in the lung (see Materials and Methods, Fig. 1B, table S3, and figs. S2 and S3). Most of cell types were identified both in diseased (PF) and control lungs as well as across diagnoses (Fig. 1C and table S4). Comparing cells originating from PF lungs to controls, we identified hundreds of differentially expressed genes in each cell type (see Materials and Methods, Fig. 1D, and tables S5 and S6). As expected, this analysis identified a number of previously undescribed expression changes associated with PF, and because of the analysis being performed at a cell type resolution, we cataloged patterns of shared and cell type–specific differentially expressed genes (fig. S4). We also used the heterogeneity in diagnoses to identify gene expression changes between patients diagnosed with IPF and those with a non-IPF diagnosis (table S5). We next examined a small number of known biomarkers for PF (27, 28) and genes linked to PF disease mechanisms (Fig. 1E) (6, 29, 30). All of these genes except for SMAD3 were significantly differentially expressed in at least one cell type (table S5). There was considerable heterogeneity among the cell type–specific expression patterns of these genes. For example, MMP7, one of the most highly validated biomarkers for IPF, has expression changes across many cell types, whereas CDKN2A is more restricted. Together, these data suggest that multiple distinct epithelial and mesenchymal cell types are involved in pathologic tissue remodeling in PF. Turning our analysis to genes encoding for ECM components, we identified multiple cell types expressing such genes that have previously been reported to be increased in IPF lungs (31). All but five of these genes were differentially expressed in at least one cell type, and as expected, these ECM genes were largely expressed in fibroblast subpopulations. Further, while subsets of these genes (basement membrane components from Fig. 1F and fig. S5) were expressed in smooth muscle cells, endothelial cells, and type 1 alveolar epithelial (AT1) cells and AT2 cells (Fig. 1F and fig. S5), this analysis also identified a previously undescribed population of KRT5−/KRT17+ epithelial cells that expressed COL1A1, FN1, and other pathologic ECM components (Fig. 1F).
Fig. 1. Single-cell landscape of PF and control lungs.

(A) Schematic of workflow for scRNA-seq using the 10x Chromium platform. Uniform Manifold Approximation and Projection (UMAP) embedding of jointly analyzed single-cell transcriptomes from 114,396 cells from 20 PF and 10 control lungs annotated by (B) cell type and (C) disease status. (D) Number of differentially expressed (DE) genes in each cell type with >50 cells available in PF and control lungs [negative binomial test, log fold change (FC) cutoff of 0.25 and adjusted P value of <0.01). (E) Cell type of origin and disease state informed expression of selected biomarkers and putative mediators of PF. (F) Heatmap depicting relative expression (normalized and scaled z-scored) of known ECM components previously shown to be increased in PF lungs, each cluster is downsampled to 100 cells for visualization. All of the genes except COL6A1, COL6A2, LAMA3, LAMA5, and LAMB2 were differentially expressed in at least one cell type. NK cells, natural killer cells; pDCs, plasmacytoid dendritic cells; cDCs, classical dendritic cells; cHP, chronic hypersensitivity pneumonitis.
Genetic studies have suggested a central role of epithelial cells in mediating IPF risk (4, 6, 32, 33); thus, we next performed more focused analyses of epithelial cells. Overlaying canonical lineage markers onto unbiased clustering of 37,325 EPCAM+ cells, we identified 12 distinct cell types/states (Fig. 2, A and B, and fig. S6). These included transcriptional programs consistent with classifically defined lung epithelial cells (basal cells, ciliated cells, and AT1 and AT2 cells) and also demonstrated four secretory cell subtypes, putative transitional states between secretory/ciliated and AT2/AT1 cells, a previously undescribed KRT5−/KRT17+ population, and a cluster of proliferating cells. Among these four secretory cell types, two expressed classical secretory lineage marker SCGB1A1 and airways mucins (MUC5AC and/or MUC5B), while the other two were defined by the expression of SCGB1A1 and SCGB3A2 or SCGB3A2 only (Fig. 2A and fig. S7). Quantification of cell types from transcriptomic data demonstrated significantly increased proportions of basal cells, SCGB3A2+ secretory cells, and KRT5−/KRT17+ cells and significantly decreased proportions of AT1 cells and transitional AT2 cells (Fig. 2C, fig. S6, and table S4).
Fig. 2. Epithelial cell identification and characterization in PF lungs.

(A) Normalized expression levels of canonical lineage markers in lung epithelial cells. (B) UMAP embedding of 37,325 epithelial cells annotated by cell type/state from jointly analyzed PF and control lungs. (C) Quantification of cell types as a percent of all epithelial cells in PF versus control lungs. Boxes, interquartile range and range. *P < 0.05 by Mann-Whitney U. (D) RNA in situ hybridization (ISH) of IPF lung labeling secretory lineages using multiplexed RNA-ISH. Original image composed of stitched 40× images. (E) Higher magnification (×200) of box from (D). (F) RNA-ISH demonstrating secretory lineages in control lung. Original magnification, ×400. (G to K) Quantification of (G) SCGB1A1+, (H) MUC5B+, (I) SCGB3A2+, (J) SFTPC+, and (K) AGER+ cells from a total of 100 20× fields per lung from each of four control and five PF lungs, reported as positive cells per square millimeter. Between-group comparisons were performed by Mann-Whitney U. Coexpression profiles of (L) all secretory cells and (M) SCGB3A2+ cells, compared by two-way analysis of variance (ANOVA). Data are presented as means ± 95% confidence interval (CI).
To understand the spatial distribution of these secretory lineages within PF and control lungs, we performed RNA in situ hybridization (ISH). In areas of cystic and fibrotic remodeling in PF lungs, we observed a notable pattern characterized by discrete regions of remodeled epithelium with a near-exclusive population by a single secretory phenotype (Fig. 2, D and E). In control lungs, low-level MUC5B expression was observed in SCGB1A1+ cells in large airways; a subset of SCGB1A1+ cells coexpressed SCGB3A2. SCGB3A2+ cells lacking SCGB1A1 or MUC5B expression were found in a subset of airways in control lungs (Fig. 2F). Quantification of secretory cell subsets in matched formalin-fixed, paraffin-embedded tissue by RNA-ISH and automated image analysis revealed a significant increase in MUC5B+ cells (Fig. 2H); SCGB1A1+ and SCGB3A2+ cells were observed in a patchy distribution and were found in highly variable density across different analyzed regions. In contrast, AT2 cells (quantified by SFTPC expression) (Fig. 2J) and AT1 cells (quantified by AGER expression) (Fig. 2K) were significantly less frequently found in PF lungs. These patterns are consistent with the epithelial proportions quantified using the scRNA-seq data (Fig. 2C) The proportions of secretory cell subtypes differed significantly between PF and control lungs, with a relative increase in MUC5B+ cells and a decrease in SCGB1A1+/SCGB3A2+ secretory cells (Fig. 2L). A smaller proportion of all Secretoglobin Family 3A Member 2 (SCGB3A2) cells coexpressed SCGB1A1 or MUC5B in PF lungs (Fig. 2M). Analysis of gene expression programs discriminating between the SCGB3A2+/SCGB1A1+ and SCGB3A2+ populations demonstrated that the SCGB3A2+ cells expressed a subset of alveolar programs including NKX2-1, HOPX, CAV1, surfactant genes, and major histocompatibility complex–II (fig. S7).
The role of AT2 cells as a progenitor population for AT1 cells during lung injury and repair has been well established (34, 35). In both control and PF lungs, we identified a population of cells that express some features of both AT2 and AT1 cells (Fig. 2, A and B), resembling an indeterminate population reported in previous work (22). A pseudo-time analysis—used to identify trajectories between cell types/states—performed using the Slingshot (36, 37) package in R suggested that this transitional AT2 cell population represents a state during the differentiation trajectory from AT2 to AT1 with increasing AT1 markers along the trajectory (see Materials and Methods and Fig. 3, A and B). Unexpectedly, among both control and PF lungs, a proportion of transitional AT2 cells express SCGB3A2 (Fig. 2A and fig. S8), and trajectory analyses demonstrated SCGB3A2+ cells up-regulating AT1 and AT2 programs (Fig. 3, A and B), leading us to hypothesize that SCGB3A2+ cells are capable of generating AT1 cells by differentiating to transitional AT2 cells. These results are consistent with a recent report suggesting that both club cells and AT2 cells may generate AT1 cells via a common progenitor state in mice following experimental lung injury (38). To test the robustness of these trajectories and account for the fact that trajectory analyses are sensitive to choices made during dimensionality reduction, we analyzed the concordance of three different approaches [Slingshot based on Uniform Manifold Approximation and Projection (UMAP), Slingshot based on principal components analysis (PCA), and linear ordering based on PCA; fig. S9]. We found the ordering of cells between methods to be highly concordant (fig. S9). Last, to confirm these states exist in vivo, we performed RNA-ISH using tissue sections from sequenced lungs to localize SCGB3A2, SFTPC (AT2 marker), and AGER (AT1 marker) and identified a putatively transitional state coexpressing SFTPC and AGER in both control (Fig. 3C) and fibrotic lungs (Fig. 3D). Consistent with transcriptomic data, a subset of these SFTPC+/AGER+ dual-positive cells expressed low levels of SCGB3A2 in PF samples and were rarely observed in control lungs (Fig. 3, C to F). Quantification of colocalization of SCGB3A2, SFTPC, and AGER demonstrated a larger proportion of SFTPC+ cells as a proportion of all SCGB3A2+ cells and increased SCGB3A2+ cells as a proportion of SFTPC+ cells (Fig. 3, E and F). Together, these data demonstrate that there is a spectrum of distal lung epithelial cells expressing a continuum of secretory, AT2, and AT1 programs and raises the possibility that multiple distal lineages may converge upon a common transitional phenotype that can give rise to AT1 cells during injury repair.
Fig. 3. Trajectory analysis of transitional AT2 cells.

(A) Slingshot-based pseudo-time trajectories calculated from UMAP embedding of 14,462 AT2, SCGB3A2+, transitional AT2, and AT1 cells from PF and control lungs starting from either AT2 (orange) or SCGB3A2+ (purple). The trajectories are calculated independently for each lineage, and the robustness of these lineages is demonstrated in fig. S9. (B) Smoothed expression of lineage markers along pseudo-time trajectories from SCGB3A2+ or AT2. The gray shading indicates 99% CI. (C) RNA-ISH demonstrating AGER+/SFTPC+ cells in control lungs (D) and AGER+/SFTPC+/SCGB3A2+ in PF lungs. Green arrowheads denote colocalized signals. (E and F) Quantification of RNA-ISH from control (n = 4) and PF (n = 5) reporting (E) coexpression of SCGB1A1 and AGER as a proportion of all SFTPC+ cells and (F) coexpression of SFTPC and AGER as a proportion of all SCGB3A2+ cells. Data are presented as means ± 95% CI and distributions compared by two-way ANOVA.
We also identified a previously undescribed epithelial cell population that expressed COL1A1 and other pathologic ECM components and was found nearly exclusively in PF lungs (Fig. 2C and fig. S6). Furthermore, these cells were identified across all histopathologic patterns of PF, although they were infrequently recovered from lungs with NSIP pathology (fig. S10 and table S2). Using RNA-ISH, we found that KRT5−/KRT17+ cells intimately overlay foci of high collagen expression in the distal PF lung and coexpressed COL1A1 (Fig. 4, B to F); KRT17+ basal cells were observed in airways of control lungs but lacked coexpression of COL1A1 (Fig. 4G). Notably, KRT17+/COL1A1+ cells could be identified in a lung biopsy specimen from an asymptomatic individual with a family history of IPF (Fig. 4F) who had only very mild reticular changes on chest computerized tomogram (CT) [fig. S11 and see also in (39)], suggesting that this unique cell type is present during early disease pathogenesis. These KRT5−/KRT17+ cells expressed multiple collagens, other ECM components, and CDH2 (encoding for N-cadherin) (Figs. 1, E and F, and 4, A and H) but lacked ACTA2, PDGFRA, S100A4, or other canonical fibroblast markers. Unexpectedly, these cells expressed genes typical of a distal epithelial program including SOX9, NAPSA, and ITGB6 (Fig. 4H and table S7). This KRT5−/KRT17+ population highly expressed MMP7 (Figs. 1E and 4H), the most well-validated IPF biomarker in peripheral blood (27), was the predominant cell type–expressing integrin αVβ6 (Fig. 4H), previously implicated in transforming growth factor β activation (40), and highly expressed CDKN2A (encoding for p16), suggesting cell cycle arrest and/or a senescent phenotype. KRT5−/KRT17+ cells expressed canonical basal cell transcription factor TP63, but these cells lacked expression of the basal cell marker KRT5 (Fig. 4, I and J). Enrichment analyses of genes up-regulated in KRT5−/KRT17+ compared to basal cells indicated increased expression of cell adhesion and motility programs, increased p53 and integrin signaling pathways, and increased expression of signaling targets downstream of the mitogen-activated protein kinase, glycogen synthase kinase 3β, and protein kinase C-α pathways (Fig. 4K).
Fig. 4. KRT5−/KRT17+ epithelial cells emerge in PF lungs.
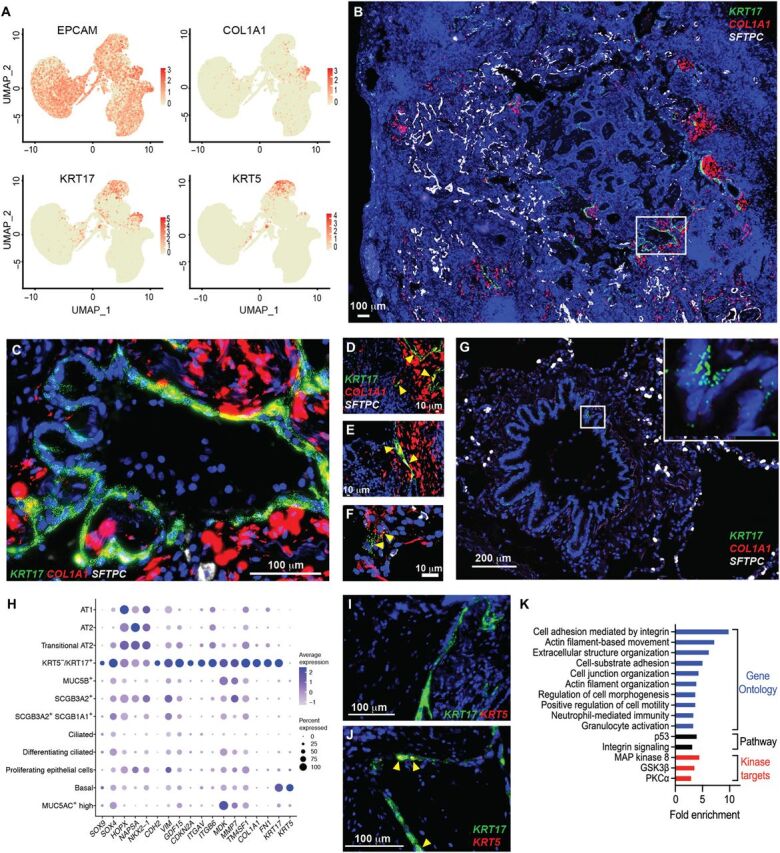
(A) Expression of EPCAM, COL1A1, KRT17, and KRT5 in 37,325 epithelial cells from PF and control lungs. (B) Multiplexed RNA-ISH probing for KRT17, COL1A1, and SFTPC in IPF lung. Original magnification, ×40. (C) Magnification box (×400) from (B). (D to F) Coexpression of COL1A1 and KRT17 in (D and E) two independent IPF lung explants and in (F) a transbronchial biopsy section from an asymptomatic subject with a family history of PF. High-resolution computed tomography corresponding to (F) is shown in fig. S11. (G) Expression of KRT17 in a nonfibrotic control lung. Original magnification, ×400. (H) Selected top genes discriminating KRT5−/KRT17+ cells from other lung epithelial cells. Genes were selected from 240 genes up-regulated [logFC, >0.5; false discovery rate (FDR), <0.1] compared to other epithelial cells. (I and J) Multiplexed RNA-ISH probing for KRT5 and KRT17 in (I) a peripheral fibrotic region versus (J) a large airway. (K) Enrichment analysis for Gene Ontology biological processes, pathways, and kinase targets among group enrichment analysis of 227 genes significantly increased in KRT5−/KRT17+ cells compared to basal cells (logFC, >0.5; FDR, <0.1). MAP kinase 8, mitogen-activated protein kinase 8.
Given that these cells shared characteristics with airway basal cells and the distal/alveolar epithelium, the origin of these cells was unclear. To this end, we again performed Slingshot (see Materials and Methods) using only cells from PF lungs. The pseudo-time analysis suggested that the KRT5−/KRT17+ cells may be derived from transitional AT2 cells, which themselves can arise from either AT2 or SCGB3A2+ cells (Fig. 5, A and B). Note that these methods do not have sufficient resolution to assign individual cells to a specific trajectory but rather depict global patterns of changing gene expression that occur along an inferred differentiation path. Similar to our previous analysis, we tested the robustness of this trajectory by comparing three different approaches. Again, we found our cell order to be largely consistent between trajectory analysis techniques (fig. S12), and the trajectory was recapitulated when using only cells from one processing site or a single individual (fig. S13). We also compared the results to an alternative, recently developed method, TooManyCells, that is intentionally designed to be orthogonal to traditional pseudo-time analyses and does not rely on dimensionality reduction; this method also recapitulated our results (fig. S13) (41). Last, we see key marker gene expression changes as expected along the trajectories (fig. S14). Consistent with this hypothesis, RNA-ISH demonstrated KRT17+ cells localizing near SCGB3A2+ and SFTPC+ cells in PF lungs (Fig. 5C) but not controls (fig. S15). To better understand the transcriptional program driving KRT5−/KRT17+ cells, we identified genes significantly associated with our Slingshot-based trajectory, starting from both AT2 and SCGB3A2+ cells (see Materials and Methods, Fig. 5, D to F, and table S8). To further characterize the regulatory program along this KRT5−/KRT17+ trajectory, we analyzed the promoters of genes associated with the trajectory for the enrichment of transcription factor binding sites (TFBSs). We found that promoters of genes associated with the shift from transitional AT2 to KRT5−/KRT17+ and stable KRT5−/KRT17+ were enriched for TFBS for the SRY-related HMG-box gene (SOX) family and a transcriptional repressor Nuclear Receptor Subfamily 1 Group D Member 1 (NR1D1) (table S9). Both SOX4 and SOX9 are also associated with the trajectory (Fig. 5F) and are known to be key regulators of epithelial cells in the lung (42–44). Furthermore, we observed an increase in SOX4 expression in transitional AT2 cells, high expression of SOX4 in SCGB3A2+ cells, and high expression of SOX9 in KRT5−/KRT17+ cells (Fig. 5F). We also observed a significant up-regulation of NR1D1 in AT2 and transitional AT2 cells from control lungs, while it was near undetectable in PF samples (Fig. 5F and table S5). We next wanted to compare how these key transcription factors and some of the target genes differed along the KRT5−/KRT17+ trajectory in PF samples compared to the AT1 trajectory in controls. To this end, we calculated a pseudo-time trajectory from AT2 cells to AT1 cells using only cells from control lungs (Fig. 5F and fig. S16). The observed expression differences suggest that up-regulation of SOX4 and SOX9 combined with down-regulation of NR1D1 in AT2, SCGB3A2+, and transitional AT2 cells may drive aberrant transcriptional programming, leading to the generation of ECM-producing KRT5−/KRT17+ cells instead of the AT1 cells seen in a homeostatic lung. We also directly examined the relationship between expression of SOX4 and SOX9 and putative target genes in cells, where both genes were expressed in AT2, transitional AT2, or KRT5−/KRT17+ cells (see Materials and Methods, Fig. 5G, and fig. S17). We identified significant associations between SOX4 and SOX9 and a number of genes with known function in PF, including the known senescence marker Cyclin Dependent Kinase Inhibitor 1A (CDKN1A) (Fig. 5G and fig. S17) (45). Last, we used RNA-ISH to demonstrate colocalization of KRT17 and SOX9 in the tissue from patients with PF (Fig. 5H). Together, these data provide direct evidence of an epithelial role in collagen/ECM production in PF lungs. This stands in contrast to genetic lineage-tracing studies performed in mouse models of PF (34, 35). Furthermore, the cytokeratin profile of this KRT5−/KRT17+ niche appears distinct from that characterizing “lineage-negative epithelial progenitor” cells previously described in mouse models (46, 47). These discordant findings may reflect both biological differences in the distal lung epithelium between humans and mice and mechanistic differences between human PF and the bleomycin mouse model, as well as the inherent limitations of lineage-tracing studies using genetic Cre-lox systems and single marker–based approaches to mesenchymal cell annotation, which may differ between mice and human lungs (48).
Fig. 5. Trajectory analysis of KRT5−/KRT17+ cells.
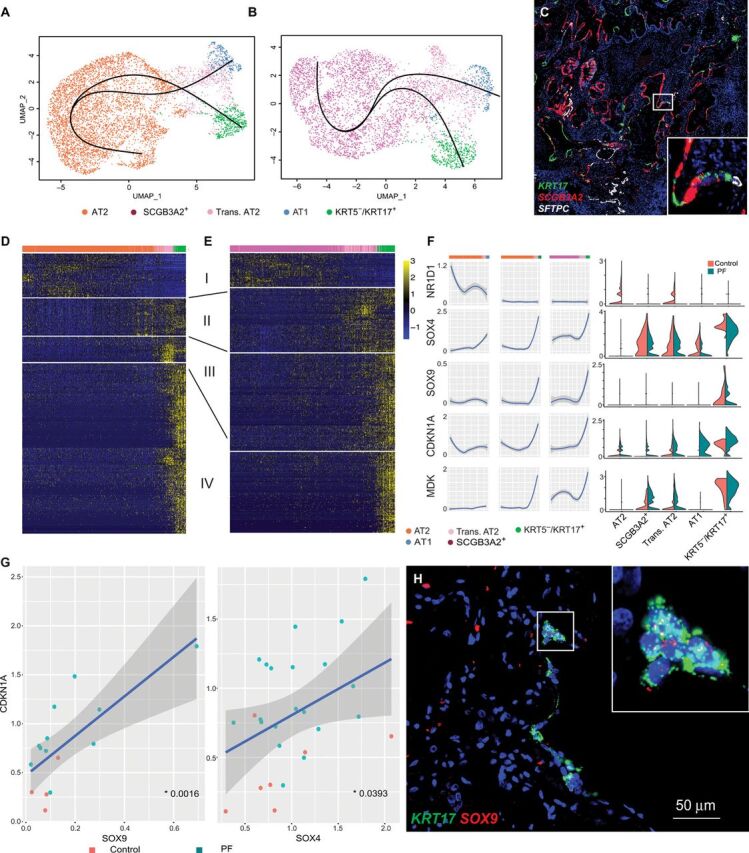
(A and B) Slingshot-based pseudo-time trajectories calculated from UMAP embedding of (A) 6406 AT2, transitional AT2, AT1, and KRT5−/KRT17+ cells and (B) 4611 SCGB3A2+, transitional AT2, AT1, and KRT5−/KRT17+ cells. Both (A) and (B) are composed entirely of cells from PF samples. Each slingshot trajectory has a single start and a single end point, either AT1 or KRT5−/KRT17+. The trajectories were then plotted together, leading to not only the appearance of a branching trajectory but also results in a crossing of trajectories. (C) RNA-ISH demonstrating KRT17+ cells adjacent to SFTPC+ and SCGB3A2+ cells with low-level coexpression of multiple lineage markers in fibrotic regions of PF lung. (D and E) Heatmap depicting relative expression (normalized and scaled z-scored) of the top 400 genes with significant variation across pseudo-time trajectories (generalized additive model; FDR, <0.01) from (D) AT2 or (E) SCGB3A2+ to KRT5−/KRT17+ cells. Modules of expression were manually annotated to show stable expression (I), progression toward transitional AT2 (II), progression toward KRT5−/KRT17+ (III), and stable KRT5−/KRT17+ (IV). (F) Normalized expression levels of transcription factors with binding sites enriched for pseudo-time–associated genes and two representative target genes in each cell type split by control and PF and smoothed across the pseudo-time trajectories. Cells from control samples representing the AT2 to AT1 trajectory are shown (fig. S16) as a comparison. The gray shading represents the 99% CI. (G) A correlation of SOX9 and SOX4 with a putative target gene and known PF biomarker CDKN1A. Each dot represents the average expression of the two genes within an individual. Only individuals with detectable expression of both genes were included. The P values were calculated using a linear regression. (H) RNA-ISH demonstrating colocalization of SOX9 and KRT17 in a PF lung.
Focusing next on mesenchymal and other stromal cells (see Materials and Methods), we identified four discrete populations of fibroblasts in addition to smooth muscle cells and mesothelial cells (Fig. 6A). While the overall proportion of fibroblasts was higher in PF lungs compared to controls as anticipated (table S4), there was also a specific enrichment in fibrotic lungs of ACTA2+ myofibroblasts, a PLIN2+ lipofibroblast-like group, and a previously undescribed HAS1hi fibroblast population (fig. S18 and table S4). Each fibroblast subtype had a unique gene expression signature (Fig. 6, B and C), but there was also a collection of dysregulated genes shared across the fibroblast subpopulations (Fig. 1F). Further investigation revealed that the HAS1hi population was composed entirely of cells from IPF lungs. Analysis of genes that were up-regulated in HAS1hi cells indicated enrichment for pathways associated with cellular stress, interleukin-4 (IL4)/IL13 signaling (fig. S19), and programs previously implicated in epithelial-mesenchymal transition in other systems (TWIST and SNAI1) (Fig. 6C and table S5). To determine the localization of these different fibroblast populations, we performed multiplexed immunofluorescence/ISH using specific markers enriched in each fibroblast population (Fig. 6, D to H). As anticipated, there was notable expansion of LUM+ cells (a pan-fibroblast marker) in PF lungs compared to control (Fig. 6, D to F). α–Smooth muscle actin (αSMA)+/LUM+ myofibroblasts were found coexpressing COL1A1 in subepithelial regions around large airways (Fig. 6, D and E) in PF and rarely around airways in control lungs (Fig. 6F). HAS1+ cells were found near exclusively in subpleural regions, where they colocalized with COL1A1 in IPF lungs (Fig. 6, G and H). In PF lungs, HAS1+ cells were found at increased depth from the pleural surface compared to control lungs, suggesting a possible invasive phenotype (Fig. 6I). PLIN2+ fibroblasts were found diffusely within interstitial regions and around alveoli (Fig. 6, J and K). Together, these data suggest that a global dysregulation of fibroblasts occurs in PF along with the expansion of specific pathogenic subtypes in spatially distinct niches driving pathologic ECM deposition and expansion (Fig. 6L).
Fig. 6. Characterization of mesenchymal/stromal cell types in PF lung.
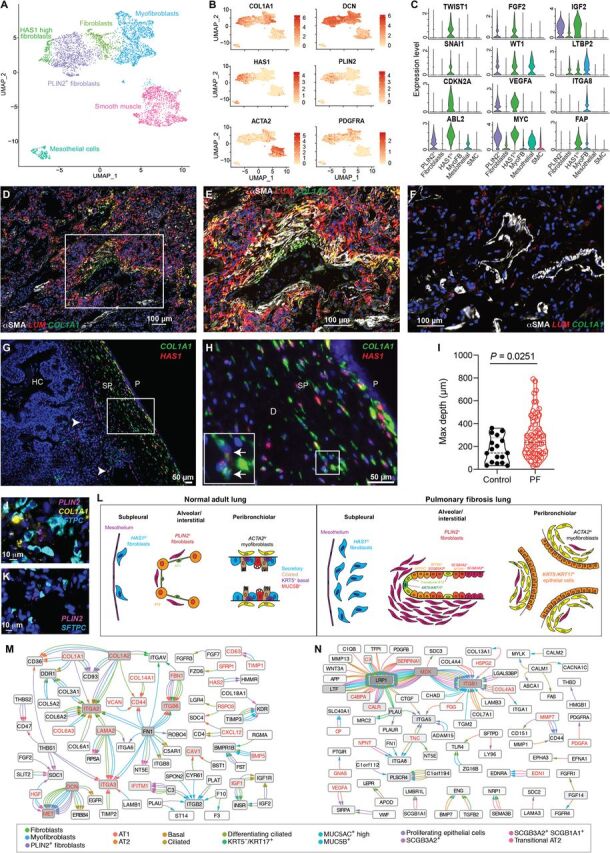
(A) UMAP depicting 5232 mesenchymal cells from jointly analyzed PF and control lungs. (B) Distribution of canonical and novel fibroblast subpopulation markers. (C) Expression of selected top discriminating genes among fibroblast subtypes. y axis indicates normalized expression. (D to F) Multiplexed immunofluorescence staining for αSMA (the protein product of ACTA2) and RNA-ISH for LUM (a pan-fibroblast marker) and COL1A1 in (D) PF lung and (F) control lung. (E) ×400 magnification of box from (D). (G and H) Colocalization of RNA-ISH for HAS1 and COL1A1 in IPF lung tissue. (G) ×100 image of subpleural stroma. Rare HAS1+ cells deep to the subpleural region are denoted with white arrows. (H) ×400 magnification of box from (G). Inset with arrows demonstrate COL1A1+ HAS1+ cells. HC, honeycomb cyst; P, pleural; SP, subpleural. (I) Quantification of maximal depth of invasion from the pleural surface of HAS1+ cells in control (n = 2) and PF lungs (n = 6). All HAS1+ cells in at least one ×100 field were counted and depth from the pleural surface measured. (J and K) Multiplexed RNA-ISH probing for fibroblast marker PLIN2, SFTPC (AT2 cells), and COL1A1 from (J) PF and (K) control lung. (L) Schematic summarizing the spatial organization of fibroblast populations identified in PF lungs. (M and N) Cytoscape interactome of the top five most highly coexpressed ligand-receptor (LR) pairs (ranked by the product of mean ligand expression and mean receptor expression for each cell type interaction) for (M) fibroblast ligands and epithelial receptors and (N) epithelial ligands and fibroblast receptors. Edges are colored by the ligand-expressing cell type; arrowheads are colored by the receptor-expressing cell type; red lettering indicates differential expression between PF and control lungs (P < 0.01).
To determine potential mediators of pathologic mesenchymal-epithelial communication, we performed an interactome-based analysis identifying putative ligand-receptor (LR) binding pairs in epithelial and mesenchymal cells (see Materials and Methods) and constructed interaction networks for mesenchymal-driven (Fig. 6L) and epithelial-driven (Fig. 6M) signaling (fig. S20 and table S10). Both networks were significantly enriched for genes differentially expressed between PF and control lungs (see Materials and Methods). This analysis implicated matrix-driven signaling through integrin receptors as the central mechanisms through which fibroblast lineages interact with epithelial cells in PF lungs. In contrast, a more complex network involving multiple growth factors, cytokines, and chemokines signaling through integrins, Wingless (Wnt) co-receptors, and other pathways was observed for epithelial-driven signaling.
In addition, to assess the robustness of the previously unreported cell types identified in this study, we compared our results with two previously published studies that performed scRNA-seq on patients with IPF (21, 24). We recapitulated the cell types identified by these two studies (table S11) and were able to recover the same cell types identified in this study in the data from the other groups (figs. S21 and S22). Last, the major findings of this study are consistent with those reported in a companion study from an independent group (49) using an entirely separate dataset and processing pipeline.
DISCUSSION
Although previous studies in experimental models have identified a number of pathways and mediators of lung fibrosis, the central mechanisms underlying pathologic epithelial remodeling and ECM expansion in the human lung have remained poorly understood. In this study, we provide a single-cell landscape of the PF lung, with a focus on epithelial and fibroblast cell populations, and identify several previously unrecognized cell types/states.
These granular data reveal a greater degree of transcriptomic heterogeneity within the lung epithelium than that recognized in the classical model of the lung epithelium, with considerable implications for understanding of lung disease mechanisms. First, these data reveal that the expression of the airway mucin MUC5B is not restricted to a SPDEFhi, “Goblet”-like cell (MUC5AC+ cells), but rather is predominantly expressed in a distinct SCGB1A1+ secretory population, consistent with observations in an independent recent report focusing on the normal human lung (48). Further, we identify distinct genomic programs in SCGB1A1+/SCGB3A2+ versus SCGB3A2+ secretory cells, the latter of which is characterized by relative up-regulation of alveolar programs. Histologic quantification identified that a proportion of SCGB3A2+ secretory cells coexpressed SFTPC (5.4% on control versus 13.7% in PF lungs). The convergence of alveolar and secretory programs is reminiscent of “bronchiolo-alveolar stem cells”, which have been described in the murine lung (50–53), but whose existence in the human lung has been uncertain. Rare identification of SCGB3A2+/SFTPC+/AGER+ cells raises the possibility that an analogous multipotent progenitor exists in the human lung; experimental validation of this hypothesis will be required.
In both control and PF lungs, we identified a transitional AT2 cell state characterized by simultaneous expression of lower levels of canonical AT2 programs compared to AT2 cells in addition to a subset of AT1 markers, including CAV1 and AGER. SFTPC+/AGER+ cells were detected in both control and PF lungs by RNA-ISH, indicating that this state exists in vivo. This appears to share some degree of homology to transitional states recently described in the mouse lung (38, 54). Further studies will be required to determine whether this reflects an intermediate state along the AT2 → AT1 differentiation axis, a stable and discrete epithelial niche, or a facultative state adopted by any AT2 cell in the proper context.
A putative role of lung epithelial cells producing pathologic ECM has been controversial, with ex vivo experiments, immunohistochemical studies, and some lineage-tracing studies in various experimental models supporting this hypothesis (55–60), while other well-designed and detailed studies have not found evidence of epithelial-derived fibroblasts/myofibroblasts (34). The data we present provide some harmonization of prior seemingly discordant findings. Specifically, KRT5−/KRT17+ cells retain canonical epithelial lineage-defining genes (EPCAM, NKX2-1, and cytokeratins) while coexpressing a small subset of “typical” mesenchymal genes, including COL1A1, FN1, and CDH2 (N-cadherin), while lacking generally recognized stromal surface markers and transcription factors. Notably, these data demonstrate that certain markers that have been used as lineage-defining in prior studies (HOPX for AT1 cells, VIM for mesenchymal cells, and S100A4 for mesenchymal/immune cells) lack a high degree of cell type specificity in the diseased human lung, potentially confounding interpretation of histology-based colocalization studies. Further studies will be required to determine the origin and function of KRT5−/KRT17+ cells. Our computational trajectory analyses lead us to speculate that this phenotype may reflect aberrant differentiation of a transitional state on the AT1 differentiation axis, a hypothesis supported by recent lineage-tracing studies in mice (54); however, further studies are required to provide more direct evidence of this using human cells. Our trajectory analyses suggest SOX4 as a regulator of this trajectory. SOX4 has also been implicated in adoption of mesenchymal phenotypes in the context of lung cancer (61–63), raising the possibility that this cell state may also play a role in other lung diseases.
These data also provide new insights into the role of distinct fibroblast cell types/states in PF pathogenesis. Specifically, we identify multiple fibroblast phenotypes expressing pathologic ECM. These data suggest that while activated myofibroblasts produce high levels of collagen and other ECM components, other transcriptionally distinct fibroblast groups may also play a significant role. These distinct fibroblast subtypes localize to distinct regions of the lung; myofibroblasts in subepithelial regions around airways and areas of cystic remodeling, while HAS1hi fibroblasts appear restricted to the immediate subpleural region; PLIN2+ and other LUM+ fibroblasts are found diffusely in parenchymal regions. The stability of these distinct phenotypes over time in vivo cannot be assessed by this study; however, these data underscore the concept that a diversity of fibroblast phenotypes is found in PF lungs. Understanding the functional roles of these heterogenous populations may yield novel therapeutic targets for PF.
In addition to these notable findings, there are several limitations that warrant discussion. First, most control lungs (8 of 10) were current or former smokers and had undergone some period of mechanical ventilation. While this may be a particularly relevant control group given that tobacco use was similarly common among PF lung, it should be recognized that nonfibrotic control lungs declined for organ donation are unlikely to be “healthy” and changes in cell type–specific gene expression with regard to inflammatory pathways, for example, should be interpreted with caution. Second, PF samples were collected from lungs at the time of organ transplantation, reflecting advanced disease; whether similar changes in cell types present and gene expression programs would be found at early disease stages is not known. Third, these samples were collected exclusively from peripheral regions of the lung and cannot address a potential role of the more proximal airway epithelium, inflammatory cells, and resident stromal populations.
Together, our results provide substantial insight into the complexity, heterogeneity, and plasticity of the peripheral lung in human disease, building upon molecular atlasing efforts in the diseased (21, 23, 24) and healthy lung (48). This high-resolution overview identifies the genes, pathways, and programs that characterize pathologic lung remodeling in PF. Future studies investigating the origin, behavior, and function of these cell types, subtypes, states, and pathologic gene expression programs should provide additional insights into the foundational mechanisms regulating homeostasis and disease in the human lung.
MATERIALS AND METHODS
The code for genomic analyses in this paper is available at https://github.com/tgen/banovichlab/.
Subjects and samples
PF tissue samples were obtained from lungs removed at the time of lung transplantation at two lung transplant centers [Vanderbilt University Medical Center (VUMC) and the National Thoracic Institute (NTI)]. Nonfibrotic control tissue samples were obtained from lungs declined for organ donation. For both PF and control lungs, tissue sections were taken from multiple peripheral (within ~2 cm of the pleural surface) regions in a given lung. For PF lungs, representatively diseased areas were selected on the basis of preoperative chest CT, while for control lungs, the most normal-appearing region was identified by gross inspection and selected for biopsy. For PF lungs, diagnoses were determined according to American Thoracic Society/European Respiratory Society consensus criteria (3). All studies were approved by the local Institutional Review Boards (Vanderbilt IRB nos. 060165 and 171657 and Western IRB no. 20181836). Surgical lung tissue sections were obtained from the ILD registry/repository at VUMC from patients with IPF who had undergone surgical lung biopsy for diagnosis of their disease (n = 3). Transbronchial lung biopsy specimens were obtained from siblings or children of patients with familial IPF with no known personal history of lung disease (n = 3). Details of this cohort have previously been reported (2). The selected slides were from individuals with mild interstitial lung abnormalities noted on chest CT (fig. S11).
Tissue processing
Biopsies of multiple regions from each lung sample were digested in an enzymatic cocktail [collagenase I/dispase II (1 μg/ml) tissue or Miltenyi Multi-Tissue Dissociation Kit] using a gentleMACS Octo Dissociator (Miltenyi Inc.). Adjacent tissue was fixed in 10% formalin for 24 to 72 hours and used for tissue localization studies. Tissue lysates were serially filtered through sterile gauze, 100- and 40-μm sterile filters (Fischer). Single-cell suspensions then underwent cell sorting using serial columns (Miltenyi Microbeads, CD235a and CD45) at VUMC or fluorescence-activated cell sorting at the Translational Genomics Research Institute (TGen). CD45− and C45+ populations were mixed 2:1 in samples processed at VUMC and were used as input for generation of scRNA-seq libraries. At TGen, calcein acetoxymethyl was used to stain live cells, and 10,000 to 15,000 total live cells were sorted directly into the 10x reaction buffer and transferred immediately to the 10x 5′ chip A (10x Genomics).
scRNA-seq library preparation and next-generation sequencing
scRNA-seq libraries were generated using the 10x Chromium platform 3′ v2 or 5′ library preparation kits (10x Genomics) following the manufacturer’s recommendations and targeting 5000 to 10,000 cells per sample. From 12 of the samples, multiple 10x Genomics libraries were generated from distinct biopsies to account for regional heterogeneity (table S2). Next-generation sequencing was performed on an Illumina NovaSeq 6000 or HiSeq 4000. Reads with read quality less than 30 were filtered out, and CellRanger Count v3.0.2 (10x Genomics) was used to align reads onto GRCh38 reference genome. We have included QC (quality control) metrics from sequencing and demographic information of each library in table S2.
ISH and microscopy
RNAscope and immunofluorescence staining were performed according to the manufacturer’s instructions using the following probes and reagents: surfactant protein C (SFTPC)–C1 (catalog no. 452561), collagen type I alpha 1 chain (COL1A1)–C2 (catalog no. 401891-C2), Keratin 17 (KRT17)–C3 (catalog no. 463661-C3), KRT5-C2 (catalog no. 310241-C2), hyaluronan synthase 1 (HAS1)–C1 (catalog no. 483251), myosin light-chain kinase (MYLK)–C3 (catalog no. 533471-C3), Platelet-derived growth factor receptor alpha (PDGFRA)–C4 (catalog no. 604481-C4), Hs-SCGB3A2-C1 (catalog no. 549951), LUM-C1 (catalog no. 494761), αSMA (catalog no. ab7817), rabbit anti-mouse immunoglobulin G (IgG) H&L Alexa Fluor 488 (catalog no. ab150125), Multiplex v2 kit (catalog no. 323100). Briefly, tissue was fixed in 10% neutral-buffered formalin at 4°C for 72 hours and then embedded and sectioned. Slides were deparaffinized and allowed to completely dry. Endogenous peroxidase activity was quenched with hydrogen peroxide for 10 min at room temperature (RT). Target retrieval was performed in ACDbio RNAscope 1X Target Retrieval Reagent at 99° to 102°C for 15 min. A hydrophobic barrier was drawn around the tissue with ImmEdge PAP Pen (Vector Labs, catalog no. H-4000) and allowed to dry overnight. We applied RNAscope Protease Plus for 15 min at RT and then proceeded to run the RNAscope assay. We hybridized the probes, applied RNAscope signal amplifiers and labeled probes accordingly. When combining immunofluorescence with RNAscope, we blocked the tissue in 1× tris-buffered saline and 1% bovine serum albumin with 10% normal rabbit serum for 30 min at RT, incubated αSMA antibody at 1:200 overnight at 4°C, and incubated with rabbit anti-mouse IgG H&L Alexa Fluor 488 at 1:200 for 1 hour at RT. Tissue was exposed to 4′,6-diamidino-2-phenylindole for 30 s, then mounted in ProLong Gold, and allowed to dry overnight at RT. Immunofluorescence images were acquired using a Keyence BZ-X710 with BZ-X Viewer software and/or an automated TiE inverted fluorescence microscope platform, equipped with an encoded motorized stage and Plan Apo 60× 1.40 numerical aperture objective (Nikon Instruments Inc.), and additionally outfitted with a Yokogawa X1 spinning disk head and Andor DU-897 electron multiplying charge-coupled device. Lasers used for excitation included 405-, 488-, 561-, and 647-nm lines. Image stitching was performed using the BZ-X Analyzer package. Emission filters were 455/50, 525/36, 641/75, and 700/74 (peak/bandwidth), respectively. NIS-Elements software (Nikon Instruments Inc.) was used for acquisition.
Image analysis and quantification
For cell quantification in tissue, RNA-ISH slides from control (n = 4) and IPF (n = 5) lungs were split into quadrants, and one image including an airway was taken in each quadrant. Images were captured at ×20 magnification using the Keyence BZ-X710 all-in-one fluorescence microscope and BZ-X Viewer software. Each quadrant image was composed of 5 × 5 overlapping images, which were stitched using Keyence BZ-X Analyzer software and then merged using HALO image analysis software v3.0.311.293 (Indica Labs), resulting in an area of at least 20 mm2 analyzed for each slide. Cell number and target expression were automatically quantified using HALO v3.0.311.293 software (Indica Labs) and their FISH-IF v1.2.2 algorithm. Areas of high background were manually annotated and subsequently excluded by analysis algorithm. Data are presented as total cells per area analyzed or percentage of total cells.
Quantification of maximum subpleural depth of HAS1Hi cells
Randomly selected tissue sections of diseased (n = 6) and control (n = 2) lungs underwent RNA-ISH for hyaluronan synthase 1 (HAS1) and COL1A1 as described above. The section was manually scanned at ×10 magnification for the expression of HAS1, and regions where there was HAS1 expression were imaged ×100 and ×400 magnification, with 400× images focused on capturing cells that were furthest from the pleura. All 100× images were then analyzed in ImageJ by cross-referencing to 400× images to identify the HAS1+ cells maximally distant from the pleura. The shortest straight-line distance to the pleura was then measured and recorded. This was repeated on each 10× image to obtain an average maximum depth from the pleura.
Dimensionality reduction, clustering, and visualization
Seurat v3 was used to perform dimensionality reduction, clustering, and visualization for the scRNA-seq data (3, 4). Individual sample output files from CellRanger Count were read into Seurat v3 to generate a unique molecular identifier count matrix that was used to create a Seurat object containing a count matrix and analysis. All Seurat objects were combined into a merged dataset, and a percentage of mitochondrial genes were calculated for each sample in the merged object. Cells containing less than 1000 identified genes or more than 25% of reads arising from mitochondrial genes were removed (fig. S1). SCTransform with default parameters was used to normalize and scale the data, and dimensionality reduction was performed using PCA on the top 3000 most variable genes. We also performed SCTransform with the batch_vars parameters to correct for batch effects between different processing sites (TGen versus Vanderbilt) and different sequencing batches. However, applying batch correction did not change our clusters markedly (fig. S2). To determine the optimal number of principal components (PCs) for UMAP visualizations and to avoid overfitting, we attempted to identify an optimal number of PCs that kept the relative distance between points on UMAP-1 and UMAP-2 stable, i.e., the UMAP plot remained stable between across a range of PCs used to generate the UMAP plot. To this end, we used Mantel randtest to calculate correlation between relative location of points on the UMAP plot between two adjacent numbers of included PCs for both UMAP-1 and UMAP-2. Correlation coefficient values were plotted, and we manually selected PC ranges where both UMAP-1 and UMAP-2 plateaued. The smallest PC number within the plateau was chosen for input into the final UMAP (figs. S1 and S3).
Cell type annotation and doublet removal
Markers specific for major cell types
PTPRC+ (immune cells), EPCAM+ (epithelial cells), PECAM1+/PTPRC− (endothelial cells), and PTPRC−/EPCAM−/PECAM1− (mesenchymal cells) were used to split Seurat clusters into four subgroups (fig. S3). Each subgroup object underwent the same dimensionality reduction, clustering, and visualization approach as described above. Each subgroup object was then further split into clusters and manually annotated with known cell type markers (table S3). Doublet cells were identified manually as expressing markers for different cell types, and the final object was created by merging all four annotated, doublet-removed subgroups.
Differential expression analysis
To identify differentially expressed genes between cell types, we used a negative binomial model as implemented in the Seurat FindMarkers function, comparing each individual cell type to all other cells within the major cell type cluster (immune, epithelial, endothelial, and mesenchymal). Genes were considered differentially expressed if the adjusted P value was lower than 0.01 (table S5). To identify genes that were differentially expressed between PF and control lungs, we took each cell type independently, for all cell types with a minimum of 50 cells in both PF and control lungs, and used the negative binomial model to test for differences in expression with a log fold change (FC) cutoff of 0.25. Genes were considered differentially expressed if the adjusted P value was less than 0.01 (Fig. 1D and table S5). To test for robustness of the differentially expressed analysis and assess for batch effects, we applied latent.vars function embedded in Seurat FindMarkers to assign processing site, flow cell, or processing site and flow cell as latent variables. However, we did not find significant differences between the different processing sites or flow cells being used as latent variables, compared to the original analysis where no latent variables were specified (table S6).
Cell trajectory analysis
The R package Slingshot (37) was used to perform a pseudo-time–based cell trajectory analysis. The slingshot wrapper function was performed with the UMAP dimensionality reduction and cluster labels as in Seurat objects to identify the trajectory. The slingshot trajectories are calculated such that each trajectory has a single start and end point. For clarity and brevity, multiple trajectories were plotted on the same graph (Figs. 3A and 5, A and B). Robustness of the trajectories was assessed by comparing the UMAP-derived pseudo-time to a Slingshot pseudo-time calculated on the first two PCs and linear ordering of cells based on the first or second PC only (figs. S9 and S12).
Identifying genes associated with trajectory analysis
To identify genes along the course of the trajectory, a general additive model (GAM) was used to regress each gene on the pseudo-time variable. The top 400 significant genes, after correcting for multiple testing [false discovery rate (FDR), <0.01], were chosen for heatmap based on loess GAM P values, and heatmap was plotted using the function plotHeatmap in the R package clusterExperiment (64). Loess plot for individual genes of interest was generated using ggplot2 geom_smooth function (smoothing method: “loess”) on the trajectory variable timeline resulted from the slingshot wrapper function above.
TFBS analysis
For motif analysis, findMotifs.pl (package HOMER v4.10) (65) was used on promoter sequences [700–base pair (bp) upstream and 100-bp downstream of transcription start-site (TSS)] of genes in the trajectory heatmap (Fig. 5, D and E, and table S9) using HOMER pre_built human promoter database and default parameters. To identify SOX and NR1D1 motif location, HOMER annotatePeaks.pl was performed on promoter regions of the targeted genes using the motif files generated from findMotifs.pl function.
Correlation between SOX genes and putative targets
We assessed the correlation of putative targets with SOX4 and SOX9 in transitional AT2 and KRT5−/KRT17+ cells. Within each individual, the mean of each gene (after removing zeros) was calculated in each cell type. The strength of the correlation was assessed across all individuals with detectable expression of both genes using a linear regression, and those with a nominal P value of less than 0.05 were plotted color-coded by PF and control (Fig. 5G and fig. S17).
Pathway enrichment analysis
Pathway enrichment was performed using PANTHER Pathways through the WebGestalt 2019 (66). Differentially expressed genes (FDR, <0.05) with an absolute increase in proportion of cells expressing a given gene of >0.1 and a logFC of >0.4 (HAS1hi versus other mesenchymal cells) were selected as input for enrichment analysis. For analysis of KRT5−/KRT17+ cells versus basal cells, all genes up-regulated in KRT5−/KRT17+ cells (logFC, >0.5; FDR, <0.1; n = 227 genes) were selected as input for enrichment analysis. Gene Ontology biological process enrichment, PANTHER Pathways, and Kinase target enrichment analyses were performed using WebGestalt 2019.
Interactome analysis
The scaled gene expression matrix for diseased cells from a Seurat subgroup object containing epithelial cells and mesenchymal cells (excluding HAS1hi cells, which localized to subpleural regions and were not in spatial proximity with nonmesothelial epithelial populations) was filtered to contain the top 20% highly expressed genes for each cell type using the iTALK function rawParse (67). These top genes were used as input for the iTALK FindLR function to find LR pairs between all cell types. Hundreds of LR pairs were found between epithelial cells and mesenchymal cells (table S10). Next, we tested whether highly coexpressed LR pairs (top 20%) were enriched for differentially expressed genes between PF and control samples. First, we generated an empirical null distribution for each cell type interaction [excluding Perilipin 2 (PLIN2+) fibroblasts and KRT5−/KRT17+ epithelial cells, which did not contain sufficient numbers of control cells for differential expression testing] by randomly sampling a matched number (table S10) of LR pairs from all LR pairs identified for that interaction from the iTALK database 1000 times and identifying the number of significantly differentially expressed genes within each iteration. P values were calculated as the proportion of permutations that exceeded the number of differentially expressed genes within the top 20% most highly coexpressed pairs. For highly coexpressed ligands from mesenchymal cells and corresponding receptors in epithelial cells, significant enrichment (P < 0.05) was found for LR pairs between fibroblasts and each epithelial cell type, as well as between myofibroblasts and each epithelial cell type, excluding ciliated cells (P = 0.083). For highly coexpressed ligands from epithelial cells and corresponding receptors in mesenchymal cells, significant enrichment was found for LR pairs between fibroblasts and each epithelial cell type excluding ciliated (P = 0.071), differentiating ciliated (P = 0.53), and proliferating epithelial (P = 0.168) cells, as well as between myofibroblasts and each epithelial cell type, excluding ciliated (P = 0.068) and differentiating ciliated (P = 0.179) cells. For Fig. 6 (M and N), the top five most highly coexpressed pairs (ranked by the product of mean ligand expression and mean receptor expression) for each epithelial cell–mesenchymal cell interaction were visualized using Cytoscape (68). Differentially expressed genes within the visualized LR pairs are denoted by red text.
Data comparison with current publications
To assess the robustness of the novel cell types identified in this study, we obtained data from two previously published studies that performed scRNA-seq on patients with IPF. These data were obtained from Gene Expression Omnibus (GEO) accessions GSE122960 (24) and GSE128033 (21). The sample data from each study were then processed in Seurat following the same QC procedure as the data presented in this study. After QC and normalization, individual samples [17 samples for Reyfman et al. (24) and 18 samples for Morse et al. (21)] were combined together into their own respective Seurat objects per study. Seurat’s Transfer Anchors function was then independently applied to each combined unlabeled Seurat object using the dataset from this manuscript as a reference for cell type prediction and annotation. Cell type proportion (table S11) was calculated per cell type per study, excluding HAS1 high cell type since TransferAnchor was unable to detect this cell type in Morse et al. (21) and Reyfman et al. (24) dataset. For the novel cell types KRT5−/KRT17+, SCG3A2+, transitional AT2, and PLIN2+, we generated heatmaps of the 20 most discriminating markers (from the differential expression analysis described above), along with key marker genes, across the cells in our study and the transfer anchors annotated cells from Reyfman et al. (24) and Morse et al. (21). These results show the high degree of similarity between the cells across studies (figs. S21 and S22).
Data and code accessibility
Raw and processed 10x Genomics data can be found on GEO using accession number GSE135893. The code used to analyze the data can be found at https://github.com/tgen/banovichlab/.
Supplementary Material
Acknowledgments
We would like to thank 10x Genomics, particularly J. Herschleb, for help and support of early protocol optimizations. We also thank the Chan Zuckerberg Initiative, who supported early efforts in the laboratory to optimize scRNA-seq on the lung. Last, we thank Tennessee Donor Services and the Donor Network of Arizona and the patients and families who donated tissue samples to make these studies possible. Funding: This work was supported by NIH/NHLBI R01HL145372 (to J.A.K. and N.E.B.), K08HL130595 (to J.A.K.), P01HL92870 (to T.S.B.), the Doris Duke Charitable Foundation (to J.A.K.), R01HL126176 (to L.B.W.), K08HL136888 (to C.M.S.), K08HL143051 (to J.M.S.S.), P30AI110527(to S.B.M.), T32HL094296 (to N.I.W.), Department of Veterans Affairs (to B.W.R.), and Boehringer Ingelheim Pharmaceuticals Inc. (BIPI). BIPI had no role in the design, analysis, or interpretation of the results in this study; BIPI was given the opportunity to review the manuscript for medical and scientific accuracy as it relates to BIPI substances, as well as intellectual property considerations. Vanderbilt Cell Imaging Shared Resource is supported by NIH grants CA68485, DK20593, DK58404, DK59637, and EY08126. Author contributions: N.E.B. and J.A.K. conceived and designed the study. A.C.H., N.I.W., C.L.C., C.J.T., L.P., and M.-I.C. processed biospecimens and prepared single-cell suspensions. L.P., N.E.B., L.R., and J.R. prepared sequencing libraries and performed next-generation sequencing. C.J.T., C.J., N.I.W., J.M.S.S., and J.A.K. performed the ISH and microscopy. J.E.L., M.J.B., L.B.W., C.M.S., R.B., and R.W. procured tissue specimens. L.P., G.D., and L.W. collected and analyzed clinical data. A.C.H., A.J.G., L.T.B., S.L.Y., N.E.B., and J.A.K. performed quality checks, data integration, and computational analyses. A.C.H., A.J.G., L.T.B., N.I.W., B.W.R., A.P.S., W.J.M., S.B.M., T.S.B., N.E.B., and J.A.K. analyzed and interpreted scRNA-seq data. A.C.H., A.J.G., L.T.B., N.E.B., and J.A.K. wrote and revised manuscript. Competing interests: A.C.H., A.J.G., L.T.B., S.L.Y., N.I.W., C.L.C., L.P., M.-I.C., C.J.T., C.J., L.R., J.R., G.D., L.W., J.M.S.S., B.W.R., A.P.S., J.E.L., C.J.T., and N.E.B. report no disclosures. L.B.W. has received advisory board fees from CSL Behring, Quark, Bayer, and Merck and has research contracts with Genentech and CSL Behring. J.A.K. reports advisory board fees from Boehringer Ingelheim, nonfinancial study support from Genentech, and grant funding from Boehringer Ingelheim. T.S.B. reports consulting fees from Orinove, GRI Bio, Morphic, and Novelstar, research grants/contracts from Boehringer Ingelheim and Celgene, and nonfinancial study support from Genentech. W.J.M. reports no conflicts of interest; subsequent to role on this project, W.J.M. was employed by 10x Genomics and is a shareholder and employee of 10x Genomics. R.W. reports consultant fees from Genentech and Boehringer Ingelheim. Data and materials availability: All data needed to evaluate the conclusions in the paper are present in the paper and/or the Supplementary Materials. In addition, raw data and code used in analyzing the dataset are available as described in the Methods section. Additional data related to this paper may be requested from the authors.
SUPPLEMENTARY MATERIALS
Supplementary material for this article is available at http://advances.sciencemag.org/cgi/content/full/6/28/eaba1972/DC1
REFERENCES AND NOTES
- 1.Hewlett J. C., Kropski J. A., Blackwell T. S., Idiopathic pulmonary fibrosis: Epithelial-mesenchymal interactions and emerging therapeutic targets. Matrix Biol. 71–72, 112–127 (2018). [DOI] [PMC free article] [PubMed] [Google Scholar]
- 2.Lederer D. J., Martinez F. J., Idiopathic pulmonary fibrosis. N. Engl. J. Med. 378, 1811–1823 (2018). [DOI] [PubMed] [Google Scholar]
- 3.Travis W. D., Costabel U., Hansell D. M., King Jr. T. E., Lynch D. A., Nicholson A. G., Ryerson C. J., Ryu J. H., Selman M., Wells A. U., Behr J., Bouros D., Brown K. K., Colby T. V., Collard H. R., Cordeiro C. R., Cottin V., Crestani B., Drent M., Dudden R. F., Egan J., Flaherty K., Hogaboam C., Inoue Y., Johkoh T., Kim D. S., Kitaichi M., Loyd J., Martinez F. J., Myers J., Protzko S., Raghu G., Richeldi L., Sverzellati N., Swigris J., Valeyre D.; ATS/ERS Committee on Idiopathic Interstitial Pneumonias , An official American Thoracic Society/European Respiratory Society statement: Update of the international multidisciplinary classification of the idiopathic interstitial pneumonias. Am. J. Respir. Crit. Care Med. 188, 733–748 (2013). [DOI] [PMC free article] [PubMed] [Google Scholar]
- 4.Thomas A. Q., Lane K., Phillips J. III, Prince M., Markin C., Speer M., Schwartz D. A., Gaddipati R., Marney A., Johnson J., Roberts R., Haines J., Stahlman M., Loyd J. E., Heterozygosity for a surfactant protein C gene mutation associated with usual interstitial pneumonitis and cellular nonspecific interstitial pneumonitis in one kindred. Am. J. Respir. Crit. Care Med. 165, 1322–1328 (2002). [DOI] [PubMed] [Google Scholar]
- 5.Wang Y., Kuan P. J., Xing C., Cronkhite J. T., Torres F., Rosenblatt R. L., DiMaio J. M., Kinch L. N., Grishin N. V., Garcia C. K., Genetic defects in surfactant protein A2 are associated with pulmonary fibrosis and lung cancer. Am. J. Hum. Genet. 84, 52–59 (2009). [DOI] [PMC free article] [PubMed] [Google Scholar]
- 6.Seibold M. A., Wise A. L., Speer M. C., Steele M. P., Brown K. K., Loyd J. E., Fingerlin T. E., Zhang W., Gudmundsson G., Groshong S. D., Evans C. M., Garantziotis S., Adler K. B., Dickey B. F., du Bois R. M., Yang I. V., Herron A., Kervitsky D., Talbert J. L., Markin C., Park J., Crews A. L., Slifer S. H., Auerbach S., Roy M. G., Lin J., Hennessy C. E., Schwarz M. I., Schwartz D. A., A common MUC5B promoter polymorphism and pulmonary fibrosis. N. Engl. J. Med. 364, 1503–1512 (2011). [DOI] [PMC free article] [PubMed] [Google Scholar]
- 7.Pardo A., Selman M., Idiopathic pulmonary fibrosis: New insights in its pathogenesis. Int. J. Biochem. Cell Biol. 34, 1534–1538 (2002). [DOI] [PubMed] [Google Scholar]
- 8.Moore B. B., Lawson W. E., Oury T. D., Sisson T. H., Raghavendran K., Hogaboam C. M., Animal models of fibrotic lung disease. Am. J. Respir. Cell Mol. Biol. 49, 167–179 (2013). [DOI] [PMC free article] [PubMed] [Google Scholar]
- 9.Kim S. Y., Diggans J., Pankratz D., Huang J., Pagan M., Sindy N., Tom E., Anderson J., Choi Y., Lynch D. A., Steele M. P., Flaherty K. R., Brown K. K., Farah H., Bukstein M. J., Pardo A., Selman M., Wolters P. J., Nathan S. D., Colby T. V., Myers J. L., Katzenstein A.-L. A., Raghu G., Kennedy G. C., Classification of usual interstitial pneumonia in patients with interstitial lung disease: Assessment of a machine learning approach using high-dimensional transcriptional data. Lancet Respir. Med. 3, 473–482 (2015). [DOI] [PubMed] [Google Scholar]
- 10.Selman M., Pardo A., Barrera L., Estrada A., Watson S. R., Wilson K., Aziz N., Kaminski N., Zlotnik A., Gene expression profiles distinguish idiopathic pulmonary fibrosis from hypersensitivity pneumonitis. Am. J. Respir. Crit. Care Med. 173, 188–198 (2006). [DOI] [PMC free article] [PubMed] [Google Scholar]
- 11.Vukmirovic M., Herazo-Maya J. D., Blackmon J., Skodric-Trifunovic V., Jovanovic D., Pavlovic S., Stojsic J., Zeljkovic V., Yan X., Homer R., Stefanovic B., Kaminski N., Identification and validation of differentially expressed transcripts by RNA-sequencing of formalin-fixed, paraffin-embedded (FFPE) lung tissue from patients with Idiopathic Pulmonary Fibrosis. BMC Pulm. Med. 17, 15 (2017). [DOI] [PMC free article] [PubMed] [Google Scholar]
- 12.Konishi K., Gibson K. F., Lindell K. O., Richards T. J., Zhang Y., Dhir R., Bisceglia M., Gilbert S., Yousem S. A., Song J. W., Kim D. S., Kaminski N., Gene expression profiles of acute exacerbations of idiopathic pulmonary fibrosis. Am. J. Respir. Crit. Care Med. 180, 167–175 (2009). [DOI] [PMC free article] [PubMed] [Google Scholar]
- 13.Yang I. V., Coldren C. D., Leach S. M., Seibold M. A., Murphy E., Lin J., Rosen R., Neidermyer A. J., McKean D. F., Groshong S. D., Cool C., Cosgrove G. P., Lynch D. A., Brown K. K., Schwarz M. I., Fingerlin T. E., Schwartz D. A., Expression of cilium-associated genes defines novel molecular subtypes of idiopathic pulmonary fibrosis. Thorax 68, 1114–1121 (2013). [DOI] [PMC free article] [PubMed] [Google Scholar]
- 14.Marcus J. S., Anderson W. F., Quake S. R., Microfluidic single-cell mRNA isolation and analysis. Anal. Chem. 78, 3084–3089 (2006). [DOI] [PubMed] [Google Scholar]
- 15.Treutlein B., Brownfield D. G., Wu A. R., Neff N. F., Mantalas G. L., Espinoza F. H., Desai T. J., Krasnow M. A., Quake S. R., Reconstructing lineage hierarchies of the distal lung epithelium using single-cell RNA-seq. Nature 509, 371–375 (2014). [DOI] [PMC free article] [PubMed] [Google Scholar]
- 16.Macosko E. Z., Basu A., Satija R., Nemesh J., Shekhar K., Goldman M., Tirosh I., Bialas A. R., Kamitaki N., Martersteck E. M., Trombetta J. J., Weitz D. A., Sanes J. R., Shalek A. K., Regev A., McCarroll S. A., Highly parallel genome-wide expression profiling of individual cells using nanoliter droplets. Cell 161, 1202–1214 (2015). [DOI] [PMC free article] [PubMed] [Google Scholar]
- 17.Klein A. M., Mazutis L., Akartuna I., Tallapragada N., Veres A., Li V., Peshkin L., Weitz D. A., Kirschner M. W., Droplet barcoding for single-cell transcriptomics applied to embryonic stem cells. Cell 161, 1187–1201 (2015). [DOI] [PMC free article] [PubMed] [Google Scholar]
- 18.Zheng G. X. Y., Terry J. M., Belgrader P., Ryvkin P., Bent Z. W., Wilson R., Ziraldo S. B., Wheeler T. D., McDermott G. P., Zhu J., Gregory M. T., Shuga J., Montesclaros L., Underwood J. G., Masquelier D. A., Nishimura S. Y., Schnall-Levin M., Wyatt P. W., Hindson C. M., Bharadwaj R., Wong A., Ness K. D., Beppu L. W., Deeg H. J., McFarland C., Loeb K. R., Valente W. J., Ericson N. G., Stevens E. A., Radich J. P., Mikkelsen T. S., Hindson B. J., Bielas J. H., Massively parallel digital transcriptional profiling of single cells. Nat. Commun. 8, 14049 (2017). [DOI] [PMC free article] [PubMed] [Google Scholar]
- 19.Plasschaert L. W., Žilionis R., Choo-Wing R., Savova V., Knehr J., Roma G., Klein A. M., Jaffe A. B., A single-cell atlas of the airway epithelium reveals the CFTR-rich pulmonary ionocyte. Nature 560, 377–381 (2018). [DOI] [PMC free article] [PubMed] [Google Scholar]
- 20.Braga F. A. V., Kar G., Berg M., Carpaij O. A., Polanski K., Simon L. M., Brouwer S., Gomes T., Hesse L., Jiang J., Fasouli E. S., Efremova M., Vento-Tormo R., Talavera-López C., Jonker M. R., Affleck K., Palit S., Strzelecka P. M., Firth H. V., Mahbubani K. T., Cvejic A., Meyer K. B., Saeb-Parsy K., Luinge M., Brandsma C.-A., Timens W., Angelidis I., Strunz M., Koppelman G. H., van Oosterhout A. J., Schiller H. B., Theis F. J., van den Berge M., Nawijn M. C., Teichmann S. A., A cellular census of human lungs identifies novel cell states in health and in asthma. Nat. Med. 25, 1153–1163 (2019). [DOI] [PubMed] [Google Scholar]
- 21.Morse C., Tabib T., Sembrat J., Buschur K. L., Bittar H. T., Valenzi E., Jiang Y., Kass D. J., Gibson K., Chen W., Mora A., Benos P. V., Rojas M., Lafyatis R., Proliferating SPP1/MERTK-expressing macrophages in idiopathic pulmonary fibrosis. Eur. Respir. J. 54, 1802441 (2019). [DOI] [PMC free article] [PubMed] [Google Scholar]
- 22.Xu Y., Mizuno T., Sridharan A., Du Y., Guo M., Tang J., Wikenheiser-Brokamp K. A., Perl A.-K. T., Funari V. A., Gokey J. J., Stripp B. R., Whitsett J. A., Single-cell RNA sequencing identifies diverse roles of epithelial cells in idiopathic pulmonary fibrosis. JCI Insight. 1, e90558 (2016). [DOI] [PMC free article] [PubMed] [Google Scholar]
- 23.Xi Y., Kim T., Brumwell A. N., Driver I. H., Wei Y., Tan V., Jackson J. R., Xu J., Lee D.-K., Gotts J. E., Matthay M. A., Shannon J. M., Chapman H. A., Vaughan A. E., Local lung hypoxia determines epithelial fate decisions during alveolar regeneration. Nat. Cell Biol. 19, 904–914 (2017). [DOI] [PMC free article] [PubMed] [Google Scholar]
- 24.Reyfman P. A., Walter J. M., Joshi N., Anekalla K. R., McQuattie-Pimentel A. C., Chiu S., Fernandez R., Akbarpour M., Chen C.-I., Ren Z., Verma R., Abdala-Valencia H., Nam K., Chi M., Han S., Gonzalez-Gonzalez F. J., Soberanes S., Watanabe S., Williams K. J. N., Flozak A. S., Nicholson T. T., Morgan V. K., Winter D. R., Hinchcliff M., Hrusch C. L., Guzy R. D., Bonham C. A., Sperling A. I., Bag R., Hamanaka R. B., Mutlu G. M., Yeldandi A. V., Marshall S. A., Shilatifard A., Amaral L. A. N., Perlman H., Sznajder J. I., Argento A. C., Gillespie C. T., Dematte J., Jain M., Singer B. D., Ridge K. M., Lam A. P., Bharat A., Bhorade S. M., Gottardi C. J., Budinger G. R. S., Misharin A. V., Single-cell transcriptomic analysis of human lung provides insights into the pathobiology of pulmonary fibrosis. Am. J. Respir. Crit. Care Med. 199, 1517–1536 (2019). [DOI] [PMC free article] [PubMed] [Google Scholar]
- 25.Stuart T., Butler A., Hoffman P., Hafemeister C., Papalexi E., Mauck W. M. III, Hao Y., Stoeckius M., Smibert P., Satija R., Comprehensive integration of single-cell data. Cell 177, 1888–1902.e21 (2019). [DOI] [PMC free article] [PubMed] [Google Scholar]
- 26.Hafemeister C., Satija R., Normalization and variance stabilization of single-cell RNA-seq data using regularized negative binomial regression. Genome Biol. 20, 296 (2019). [DOI] [PMC free article] [PubMed] [Google Scholar]
- 27.Rosas I. O., Richards T. J., Konishi K., Zhang Y., Gibson K., Lokshin A. E., Lindell K. O., Cisneros J., Macdonald S. D., Pardo A., Sciurba F., Dauber J., Selman M., Gochuico B. R., Kaminski N., MMP1 and MMP7 as potential peripheral blood biomarkers in idiopathic pulmonary fibrosis. PLOS Med. 5, e93 (2008). [DOI] [PMC free article] [PubMed] [Google Scholar]
- 28.Bauer Y., Tedrow J., de Bernard S., Birker-Robaczewska M., Gibson K. F., Guardela B. J., Hess P., Klenk A., Lindell K. O., Poirey S., Renault B., Rey M., Weber E., Nayler O., Kaminski N., A novel genomic signature with translational significance for human idiopathic pulmonary fibrosis. Am. J. Respir. Cell Mol. Biol. 52, 217–231 (2015). [DOI] [PMC free article] [PubMed] [Google Scholar]
- 29.Sheppard D., Epithelial-mesenchymal interactions in fibrosis and repair. Transforming growth factor-β activation by epithelial cells and fibroblasts. Ann. Am. Thorac. Soc. 2015, S21–S23 (2015). [DOI] [PMC free article] [PubMed] [Google Scholar]
- 30.Schafer M. J., White T. A., Iijima K., Haak A. J., Ligresti G., Atkinson E. J., Oberg A. L., Birch J., Salmonowicz H., Zhu Y., Mazula D. L., Brooks R. W., Fuhrmann-Stroissnigg H., Pirtskhalava T., Prakash Y. S., Tchkonia T., Robbins P. D., Aubry M. C., Passos J. F., Kirkland J. L., Tschumperlin D. J., Kita H., LeBrasseur N. K., Cellular senescence mediates fibrotic pulmonary disease. Nat. Commun. 8, 14532 (2017). [DOI] [PMC free article] [PubMed] [Google Scholar]
- 31.Booth A. J., Hadley R., Cornett A. M., Dreffs A. A., Matthes S. A., Tsui J. L., Weiss K., Horowitz J. C., Fiore V. F., Barker T. H., Moore B. B., Martinez F. J., Niklason L. E., White E. S., Acellular normal and fibrotic human lung matrices as a culture system for in vitro investigation. Am. J. Respir. Crit. Care Med. 186, 866–876 (2012). [DOI] [PMC free article] [PubMed] [Google Scholar]
- 32.Fingerlin T. E., Murphy E., Zhang W., Peljto A. L., Brown K. K., Steele M. P., Loyd J. E., Cosgrove G. P., Lynch D., Groshong S., Collard H. R., Wolters P. J., Bradford W. Z., Kossen K., Seiwert S. D., du Bois R. M., Garcia C. K., Devine M. S., Gudmundsson G., Isaksson H. J., Kaminski N., Zhang Y., Gibson K. F., Lancaster L. H., Cogan J. D., Mason W. R., Maher T. M., Molyneaux P. L., Wells A. U., Moffatt M. F., Selman M., Pardo A., Kim D. S., Crapo J. D., Make B. J., Regan E. A., Walek D. S., Daniel J. J., Kamatani Y., Zelenika D., Smith K., McKean D., Pedersen B. S., Talbert J., Kidd R. N., Markin C. R., Beckman K. B., Lathrop M., Schwarz M. I., Schwartz D. A., Genome-wide association study identifies multiple susceptibility loci for pulmonary fibrosis. Nat. Genet. 45, 613–620 (2013). [DOI] [PMC free article] [PubMed] [Google Scholar]
- 33.Kropski J. A., Blackwell T. S., Loyd J. E., The genetic basis of idiopathic pulmonary fibrosis. Eur. Respir. J. 45, 1717–1727 (2015). [DOI] [PMC free article] [PubMed] [Google Scholar]
- 34.Rock J. R., Barkauskas C. E., Cronce M. J., Xue Y., Harris J. R., Liang J., Noble P. W., Hogan B. L. M., Multiple stromal populations contribute to pulmonary fibrosis without evidence for epithelial to mesenchymal transition. Proc. Natl. Acad. Sci. U.S.A. 108, E1475–E1483 (2011). [DOI] [PMC free article] [PubMed] [Google Scholar]
- 35.Barkauskas C. E., Cronce M. J., Rackley C. R., Bowie E. J., Keene D. R., Stripp B. R., Randell S. H., Noble P. W., Hogan B. L. M., Type 2 alveolar cells are stem cells in adult lung. J. Clin. Invest. 123, 3025–3036 (2013). [DOI] [PMC free article] [PubMed] [Google Scholar]
- 36.La Manno G., Soldatov R., Zeisel A., Braun E., Hochgerner H., Petukhov V., Lidschreiber K., Kastriti M. E., Lönnerberg P., Furlan A., Fan J., Borm L. E., Liu Z., van Bruggen D., Guo J., He X., Barker R., Sundström E., Castelo-Branco G., Cramer P., Adameyko I., Linnarsson S., Kharchenko P. V., RNA velocity of single cells. Nature 560, 494–498 (2018). [DOI] [PMC free article] [PubMed] [Google Scholar]
- 37.Street K., Risso D., Fletcher R. B., Das D., Ngai J., Yosef N., Purdom E., Dudoit S., Slingshot: Cell lineage and pseudotime inference for single-cell transcriptomics. BMC Genomics 19, 477 (2018). [DOI] [PMC free article] [PubMed] [Google Scholar]
- 38.M. Strunz, L. M. Simon, M. Ansari, L. F. Mattner, I. Angelidis, C. H. Mayr, J. Kathiriya, M. Yee, P. Ogar, A. Sengupta, I. Kukhtevich, R. Schneider, Z. Zhao, J. H. L. Neumann, J. Behr, C. Voss, T. Stöger, M. Lehmann, M. Königshoff, G. Burgstaller, M. O’Reilly, H. A. Chapman, F. J. Theis, H. B. Schiller, Longitudinal single cell transcriptomics reveals Krt8+ alveolar epithelial progenitors in lung regeneration. bioRxiv 705244 [Preprint]. 17 July 2019.
- 39.Kropski J. A., Pritchett J. M., Zoz D. F., Crossno P. F., Markin C., Garnett E. T., Degryse A. L., Mitchell D. B., Polosukhin V. V., Rickman O. B., Choi L., Cheng D.-S., McConaha M. E., Jones B. R., Gleaves L. A., McMahon F. B., Worrell J. A., Solus J. F., Ware L. B., Lee J. W., Massion P. P., Zaynagetdinov R., White E. S., Kurtis J. D., Johnson J. E., Groshong S. D., Lancaster L. H., Young L. R., Steele M. P., Phillips Iii J. A., Cogan J. D., Loyd J. E., Lawson W. E., Blackwell T. S., Extensive phenotyping of individuals at risk for familial interstitial pneumonia reveals clues to the pathogenesis of interstitial lung disease. Am. J. Respir. Crit. Care Med. 191, 417–426 (2015). [DOI] [PMC free article] [PubMed] [Google Scholar]
- 40.Munger J. S., Huang X., Kawakatsu H., Griffiths M. J., Dalton S. L., Wu J., Pittet J. F., Kaminski N., Garat C., Matthay M. A., Rifkin D. B., Sheppard D., A mechanism for regulating pulmonary inflammation and fibrosis: The integrin αvβ6 binds and activates latent TGF β1. Cell 96, 319–328 (1999). [DOI] [PubMed] [Google Scholar]
- 41.Schwartz G. W., Zhou Y., Petrovic J., Fasolino M., Xu L., Shaffer S. M., Pear W. S., Vahedi G., Faryabi R. B., TooManyCells identifies and visualizes relationships of single-cell clades. Nat. Methods 17, 405–413 (2020). [DOI] [PMC free article] [PubMed] [Google Scholar]
- 42.Pan B., Xue X., Zhang D., Li M., Fu J., SOX4 arrests lung development in rats with hyperoxia-induced bronchopulmonary dysplasia by controlling EZH2 expression. Int. J. Mol. Med. 40, 1691–1698 (2017). [DOI] [PMC free article] [PubMed] [Google Scholar]
- 43.Zhu Y., Li Y., Jun Wei J. W., Liu X., The role of Sox genes in lung morphogenesis and cancer. Int. J. Mol. Sci. 13, 15767–15783 (2012). [DOI] [PMC free article] [PubMed] [Google Scholar]
- 44.Rockich B. E., Hrycaj S. M., Shih H. P., Nagy M. S., Ferguson M. A. H., Kopp J. L., Sander M., Wellik D. M., Spence J. R., Sox9 plays multiple roles in the lung epithelium during branching morphogenesis. Proc. Natl. Acad. Sci. U.S.A. 110, E4456–E4464 (2013). [DOI] [PMC free article] [PubMed] [Google Scholar]
- 45.Muñoz-Espín D., Serrano M., Cellular senescence: From physiology to pathology. Nat. Rev. Mol. Cell Biol. 15, 482–496 (2014). [DOI] [PubMed] [Google Scholar]
- 46.Zuo W., Zhang T., Wu D. Z., Guan S. P., Liew A.-A., Yamamoto Y., Wang X., Lim S. J., Vincent M., Lessard M., Crum C. P., Xian W., McKeon F., p63+Krt5+ distal airway stem cells are essential for lung regeneration. Nature 517, 616–620 (2015). [DOI] [PMC free article] [PubMed] [Google Scholar]
- 47.Vaughan A. E., Brumwell A. N., Xi Y., Gotts J. E., Brownfield D. G., Treutlein B., Tan K., Tan V., Liu F. C., Looney M. R., Matthay M. A., Rock J. R., Chapman H. A., Lineage-negative progenitors mobilize to regenerate lung epithelium after major injury. Nature 517, 621–625 (2015). [DOI] [PMC free article] [PubMed] [Google Scholar]
- 48.K. J. Travaglini, A. N. Nabhan, L. Penland, R. Sinha, A. Gillich, R. V. Sit, S. Chang, S. D. Conley, Y. Mori, J. Seita, G. J. Berry, J. B. Shrager, R. J. Metzger, C. S. Kuo, N. Neff, I. L. Weissman, S. R. Quake, M. A. Krasnow, A molecular cell atlas of the human lung from single cell RNA sequencing. bioRxiv 742320 [Preprint]. 27 August 2019.
- 49.Adams T. S., Schupp J. C., Poli S., Ayaub E. A., Neumark N., Ahangari F., Chu S. G., Raby B. A., DeIuliis G., Januszyk M., Duan Q., Arnett H. A., Siddiqui A., Washko G. R., Homer R., Yan X., Rosas I. O., Kaminski N., Single cell RNA-seq reveals ectopic and aberrant lung-resident cell populations in idiopathic pulmonary fibrosis. Sci. Adv. 6, eaba1983 (2020). [DOI] [PMC free article] [PubMed] [Google Scholar]
- 50.Kim C. F. B., Jackson E. L., Woolfenden A. E., Lawrence S., Babar I., Vogel S., Crowley D., Bronson R. T., Jacks T., Identification of bronchioalveolar stem cells in normal lung and lung cancer. Cell 121, 823–835 (2005). [DOI] [PubMed] [Google Scholar]
- 51.Salwig I., Spitznagel B., Vazquez-Armendariz A. I., Khalooghi K., Guenther S., Herold S., Szibor M., Braun T., Bronchioalveolar stem cells are a main source for regeneration of distal lung epithelia in vivo. EMBO J. 38, e102099 (2019). [DOI] [PMC free article] [PubMed] [Google Scholar]
- 52.Liu Q., Liu K., Cui G., Huang X., Yao S., Guo W., Qin Z., Li Y., Yang R., Pu W., Zhang L., He L., Zhao H., Yu W., Tang M., Tian X., Cai D., Nie Y., Hu S., Ren T., Qiao Z., Huang H., Zeng Y. A., Jing N., Peng G., Ji H., Zhou B., Lung regeneration by multipotent stem cells residing at the bronchioalveolar-duct junction. Nat. Genet. 51, 728–738 (2019). [DOI] [PubMed] [Google Scholar]
- 53.Khatri A., Kraft B. D., Tata P. R., Randell S. H., Piantadosi C. A., Pendergast A. M., ABL kinase inhibition promotes lung regeneration through expansion of an SCGB1A1+ SPC+ cell population following bacterial pneumonia. Proc. Natl. Acad. Sci. U.S.A. 116, 1603–1612 (2019). [DOI] [PMC free article] [PubMed] [Google Scholar]
- 54.Y. Kobayashi, A. Tata, A. Konkimalla, H. Katsura, R. F. Lee, J. Ou, N. E. Banovich, J. A. Kropski, P. R. Tata, Persistence of a novel regeneration-associated transitional cell state in pulmonary fibrosis. bioRxiv 855155 [Preprint]. 25 November 2019. [DOI] [PMC free article] [PubMed]
- 55.Willis B. C., Liebler J. M., Luby-Phelps K., Nicholson A. G., Crandall E. D., du Bois R. M., Borok Z., Induction of epithelial-mesenchymal transition in alveolar epithelial cells by transforming growth factor-β1: Potential role in idiopathic pulmonary fibrosis. Am. J. Pathol. 166, 1321–1332 (2005). [DOI] [PMC free article] [PubMed] [Google Scholar]
- 56.Zhou B., Liu Y., Kahn M., Ann D. K., Han A., Wang H., Nguyen C., Flodby P., Zhong Q., Krishnaveni M. S., Liebler J. M., Minoo P., Crandall E. D., Borok Z., Interactions between β-catenin and transforming growth factor-β signaling pathways mediate epithelial-mesenchymal transition and are dependent on the transcriptional co-activator cAMP-response element-binding protein (CREB)-binding protein (CBP). J. Biol. Chem. 287, 7026–7038 (2012). [DOI] [PMC free article] [PubMed] [Google Scholar]
- 57.Marmai C., Sutherland R. E., Kim K. K., Dolganov G. M., Fang X., Kim S. S., Jiang S., Golden J. A., Hoopes C. W., Matthay M. A., Chapman H. A., Wolters P. J., Alveolar epithelial cells express mesenchymal proteins in patients with idiopathic pulmonary fibrosis. Am. J. Physiol. Lung Cell. Mol. Physiol. 301, L71–L78 (2011). [DOI] [PMC free article] [PubMed] [Google Scholar]
- 58.Kim K. K., Kugler M. C., Wolters P. J., Robillard L., Galvez M. G., Brumwell A. N., Sheppard D., Chapman H. A., Alveolar epithelial cell mesenchymal transition develops in vivo during pulmonary fibrosis and is regulated by the extracellular matrix. Proc. Natl. Acad. Sci. U.S.A. 103, 13180–13185 (2006). [DOI] [PMC free article] [PubMed] [Google Scholar]
- 59.Tanjore H., Xu X. C., Polosukhin V. V., Degryse A. L., Li B., Han W., Sherrill T. P., Plieth D., Neilson E. G., Blackwell T. S., Lawson W. E., Contribution of epithelial-derived fibroblasts to bleomycin-induced lung fibrosis. Am. J. Respir. Crit. Care Med 180, 657–665 (2009). [DOI] [PMC free article] [PubMed] [Google Scholar]
- 60.Tanjore H., Cheng D.-S., Degryse A. L., Zoz D. F., Abdolrasulnia R., Lawson W. E., Blackwell T. S., Alveolar epithelial cells undergo epithelial-to-mesenchymal transition in response to endoplasmic reticulum stress. J. Biol. Chem. 286, 30972–30980 (2011). [DOI] [PMC free article] [PubMed] [Google Scholar]
- 61.Li Y., Chen P., Zu L., Liu B., Wang M., Zhou Q., MicroRNA-338-3p suppresses metastasis of lung cancer cells by targeting the EMT regulator Sox4. Am. J. Cancer Res. 6, 127–140 (2016). [PMC free article] [PubMed] [Google Scholar]
- 62.Li D., He C., Wang J., Wang Y., Bu J., Kong X., Sun D., MicroRNA-138 inhibits cell growth, invasion, and EMT of non-small cell lung cancer via SOX4/p53 feedback loop. Oncol. Res. 26, 385–400 (2018). [DOI] [PMC free article] [PubMed] [Google Scholar]
- 63.Hu W.-B., Wang L., Huang X.-R., Li F., MicroRNA-204 targets SOX4 to inhibit metastasis of lung adenocarcinoma. Eur. Rev. Med. Pharmacol. Sci. 23, 1553–1562 (2019). [DOI] [PubMed] [Google Scholar]
- 64.Risso D., Purvis L., Fletcher R. B., Das D., Ngai J., Dudoit S., Purdom E., clusterExperiment and RSEC: A bioconductor package and framework for clustering of single-cell and other large gene expression datasets. PLOS Comput. Biol. 14, e1006378 (2018). [DOI] [PMC free article] [PubMed] [Google Scholar]
- 65.Heinz S., Benner C., Spann N., Bertolino E., Lin Y. C., Laslo P., Cheng J. X., Murre C., Singh H., Glass C. K., Simple combinations of lineage-determining transcription factors prime cis-regulatory elements required for macrophage and B cell identities. Mol. Cell 38, 576–589 (2010). [DOI] [PMC free article] [PubMed] [Google Scholar]
- 66.Liao Y., Wang J., Jaehnig E. J., Shi Z., Zhang B., WebGestalt 2019: Gene set analysis toolkit with revamped UIs and APIs. Nucleic Acids Res. 47, W199–W205 (2019). [DOI] [PMC free article] [PubMed] [Google Scholar]
- 67.Y. Wang, R. Wang, S. Zhang, S. Song, C. Jiang, G. Han, M. Wang, J. Ajani, A. Futreal, L. Wang, iTALK: An R package to characterize and illustrate intercellular communication. bioRxiv 507871 [Preprint]. 4 January 2019.
- 68.Shannon P., Markiel A., Ozier O., Baliga N. S., Wang J. T., Ramage D., Amin N., Schwikowski B., Ideker T., Cytoscape: A software environment for integrated models of biomolecular interaction networks. Genome Res. 13, 2498–2504 (2003). [DOI] [PMC free article] [PubMed] [Google Scholar]
Associated Data
This section collects any data citations, data availability statements, or supplementary materials included in this article.
Supplementary Materials
Supplementary material for this article is available at http://advances.sciencemag.org/cgi/content/full/6/28/eaba1972/DC1