Abstract
Infective Endocarditis (IE) is associated with high mortality and morbidity. The data on contemporary trends and health care utilization remain scarce for IE. Consequently, we used the National Inpatient Sample database from 2002 to 2016 to study burden of IE. Risk-adjusted rates were calculated using an Analysis of Covariance with the Generalized Linear Model. Trends were assessed with linear regression and Pearson’s Chi-square modeling, where appropriate. Binomial logistic regression was used for computing predictors of in-hospital mortality. We identified 523,432 hospitalizations for native valve IE. Risk-adjusted mortality decreased from 16.7% in 2002 to 9.7% in 2016 (p <0.01). The risk-adjusted length of stay decreased from 17.4 days in 2002 to 13.4 days in 2016 (p <0.01). Mean cost of stay adjusted for risk factors and inflation increased from 112,702$ in 2002 to 164,767$ in 2016 (p <0.01). Valve replacement increased from 10.2% in 2002 in to 13.4% in 2016, (p <0.01). Independent predictors of mortality included age (OR, 1.02 [1.02 to 1.020], p <0.01), female gender (OR, 1.07 [1.05 to 1.09], p <0.01), Blacks (OR, 1.28 [1.24 to 1.31], p <0.01), Hispanics (OR, 1.15 [1.11 to 1.19], p <0.01) and patients with co-morbid conditions like congestive heart failure (OR, 1.78 [1.74 to 1.82], p <0.01), renal failure (OR, [1.69 [1.65 to 1.73], p <0.01) and weight loss (OR, 1.40 [1.36 to 1.43], p <0.01). In summary, in-hospital mortality from native valve IE has been decreasing but total hospitalization and average cost of stay has increased.
Despite advancements in therapies, infective endocarditis (IE) remains associated with substantial morbidity and mortality.1 With increasing age and opioid epidemic, IE is increasing in the United States.2,3 This has put immense pressure on local health systems that are already constrained both by capacity and cost.2,3 Prior epidemiological studies have shown that the native valve IE had remained stable due to reduction in congenital and childhood valvular heart disease. However, there is paucity of contemporary data illustrating national trends of IE.4 We hypothesized that the incidence of native valve IE is increasing due to opioid crisis and co-morbidities burden.1,3 To examine this, we used the National Inpatient Sample (NIS) from 2002 to 2016 to explore the contemporary trends in incidence, mortality, and burden of native valve IE.
Methods
The NIS database is part of Healthcare Cost and Utilization Project databases and is sponsored by the Agency for Healthcare Research and Quality.5 The NIS is the largest publicly available all-payer administrative claims-based database and contains information about patient discharges from 1000 hospitals. Prior to 2012, the NIS was a sample of hospitals and since 2012, it was redesigned to include sample of discharges from all hospitals participating in Healthcare Cost and Utilization Project. The national estimates of the entire US hospitalized population were calculated using the Agency for Healthcare Research and Quality sampling and weighting method.6 Trend weight provided was used for trends before 2012 and discharge weight after 2011. Institutional review board approval and informed consent were not required for this study given the deidentified nature of the NIS database and public availability.
We analyzed 15 years of NIS data from January 2002 to December 2016 using the International Classification of Diseases, 9th and 10th Revision, Clinical Modification (ICD-9 and 10-CM) codes. All adult (≥18 years) patients admitted with acute or subacute endocarditis were identified using ICD-9-CM codes of 421.0, 421.1, 421.9, and ICD-10-CM codes of I33.0 and I33.9. The native IE patients were identified using previously validated algorithm.7 Patients with prior history of prosthetic valve (ICD-9 V433.0 & ICD-10 Z95.2) and intra-cardiac devices (ICD-9 V450.2 & ICD10 Z958.10) were excluded (Figure 1).
Figure 1.
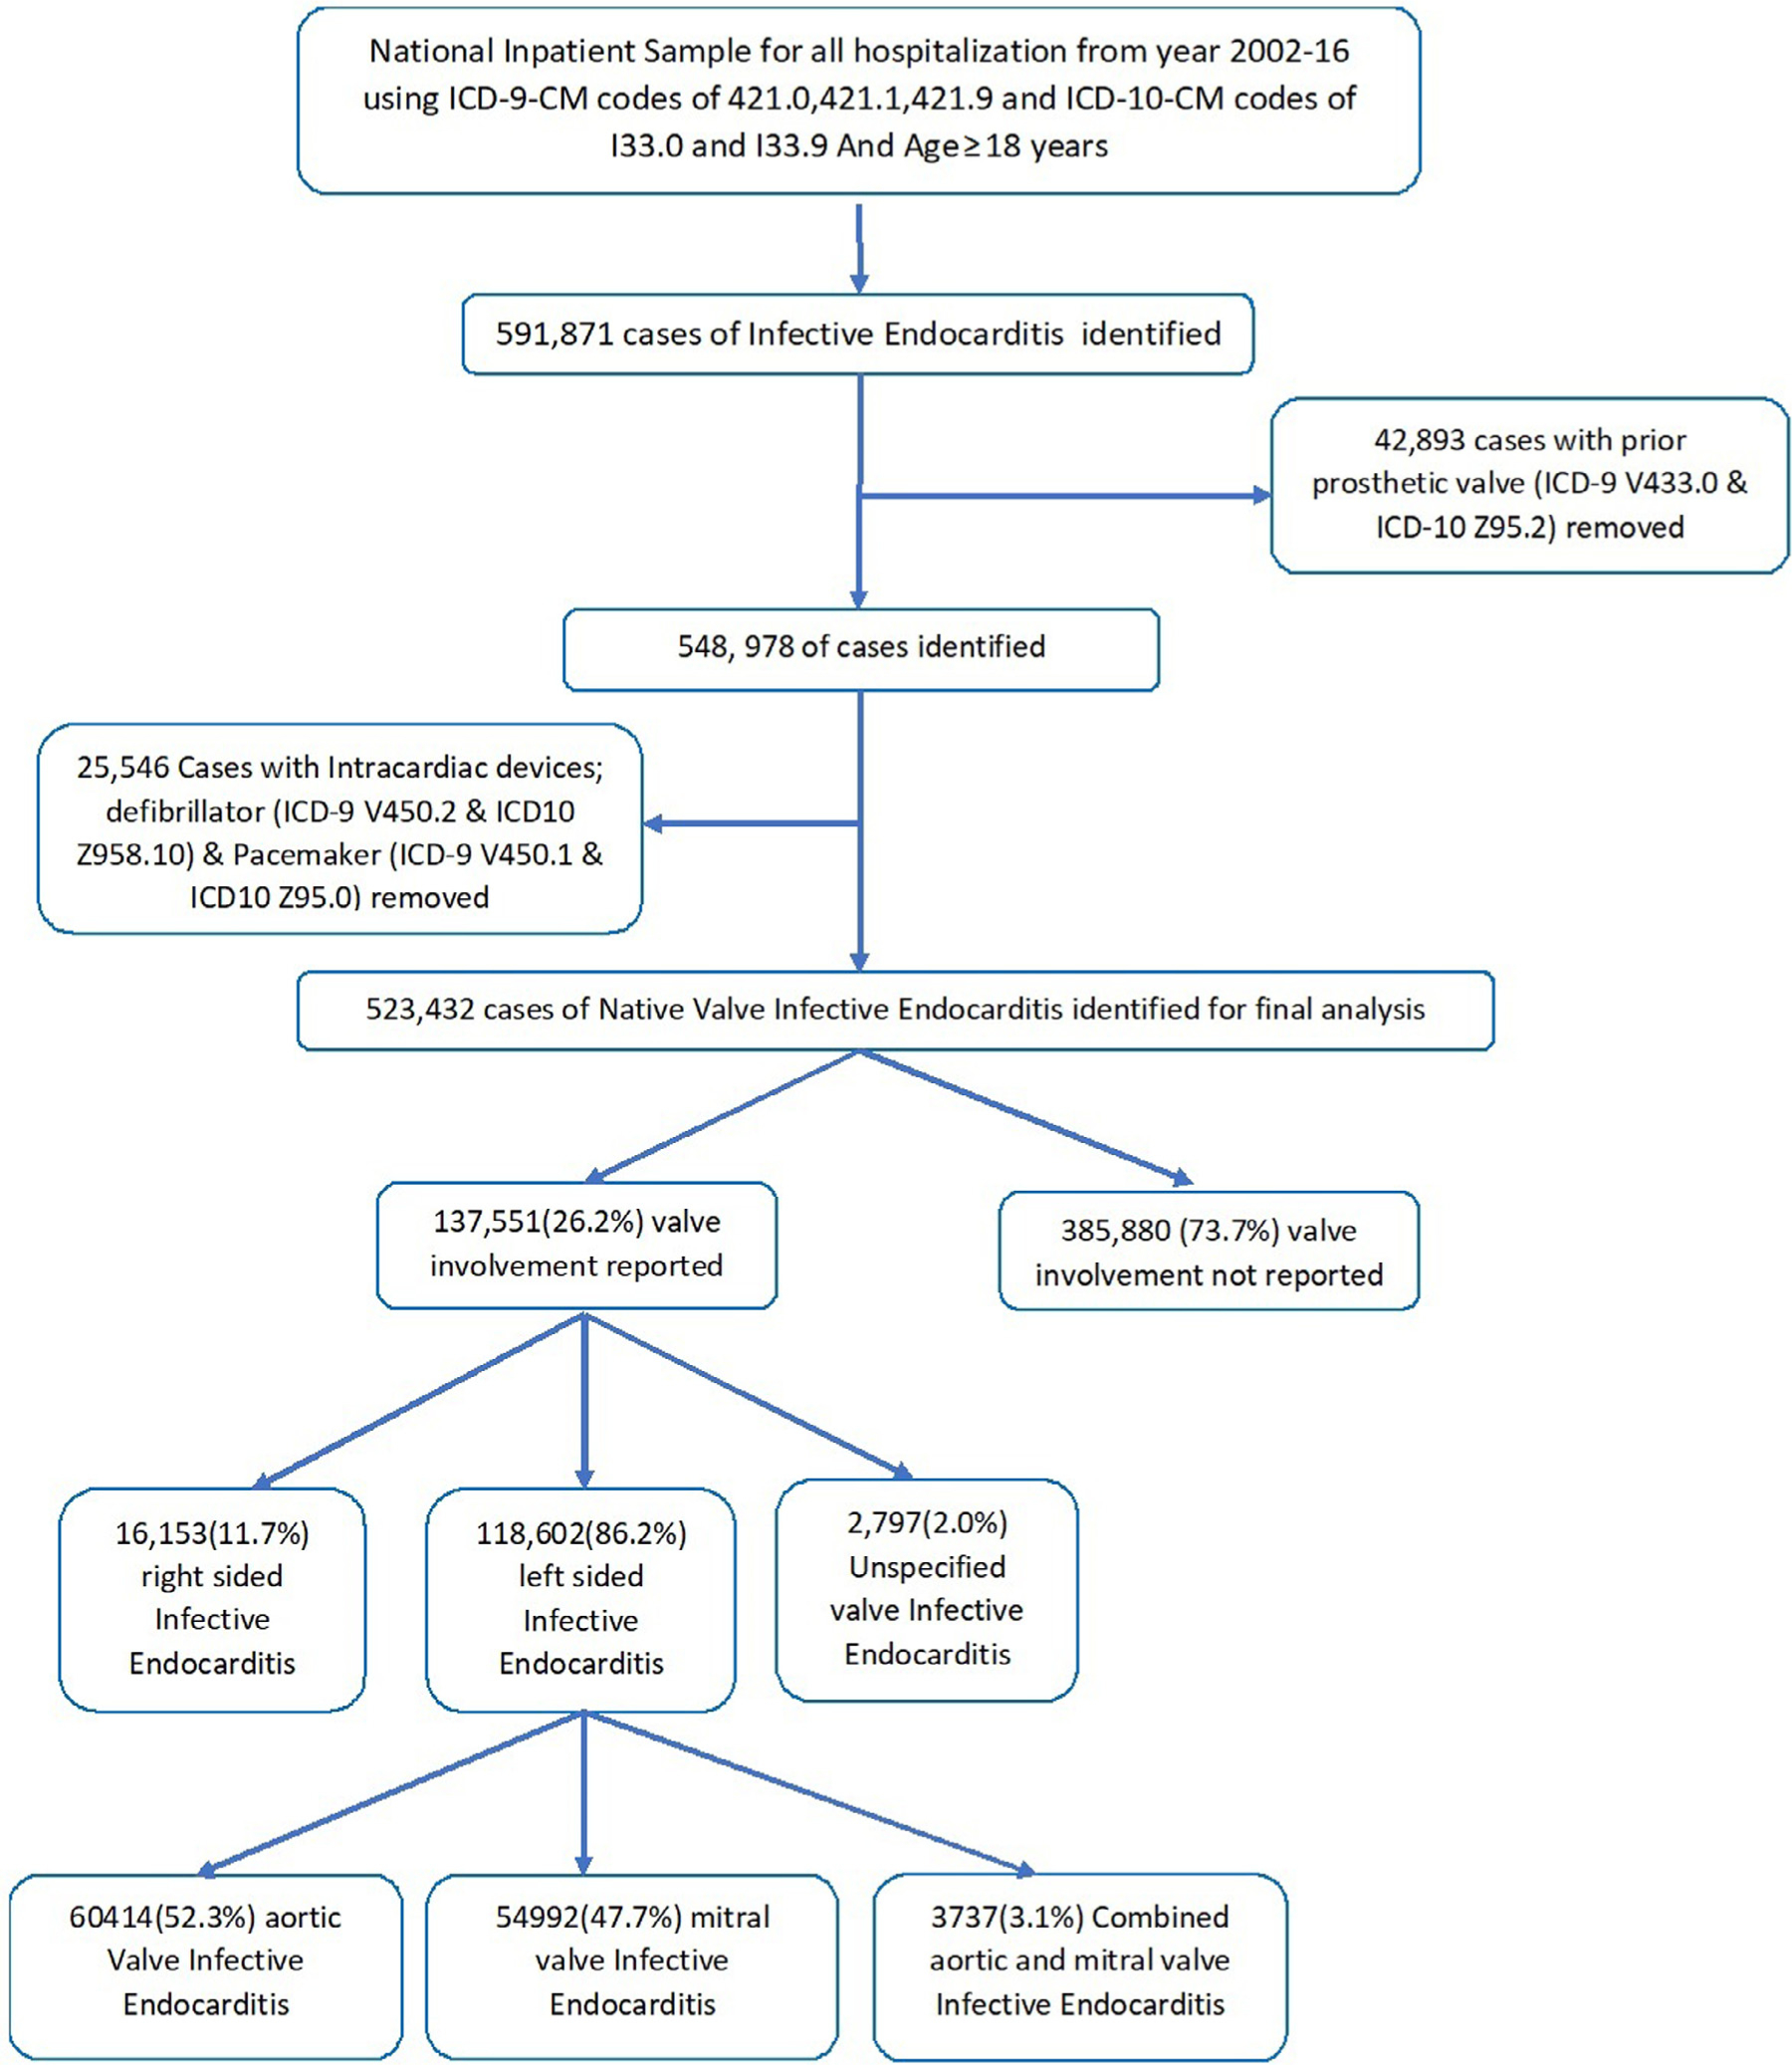
Flow chart of our study.
The primary outcomes of interest were trends in in-hospital mortality, mean length of stay, mean cost of stay, and inpatient procedures. For assessment of trends in demographics and co-morbidities, study population was divided into 3 equal 5 years periods: 2002 to 2006, 2007 to 2011, and 2012 to 2016. Categorical variables were presented as frequencies and percentages and continuous variables were reported as means (standard deviations) or medians (inter-quartile ranges). Categorical and continuous variables were compared using a Pearson Chi-square test and independent samples t test, respectively. A univariate model using the General Linear Model was used for the Analysis of Covariance. Outcomes were adjusted for age, sex, race, median income, payer status, and 29 Elixhauser comorbidities; and inflation for the mean cost of stay (comparison to December 2016). We used linear regression for trends and logistic regression to identify predictors for mortality. Initially, a binomial logistic regression model was used to identify variables from demographic information (Table 1) that were significantly associated with mortality (p value ˂0.10). These variables were then subsequently utilized in a multiple logistic regression model to identify predictors of mortality. A type I error of <0.05 was considered statistically significant. All statistical analyses were performed using statistical package for social science (SPSS) version 26 (IBM Corp) and R, version 3.5.
Table 1.
Baseline characteristics of native valve IE*
| Variable no. (%) | 2002–2006 (n = 155151) | 2007–2011 (n = 172981) | 2012–2016 (n = 195300) | Total (n = 523432) | P Value |
|---|---|---|---|---|---|
| Age (median [SD]) years | 61 (47–75) | 61 (48–74) | 58 (42–71) | 60 (46–73) | <0.01 |
| Female | 66110 (42.6%) | 71766(41.5%) | 79390 (40.7%) | 217266 (41.5%) | <0.01 |
| Race | |||||
| White | 80635 (68.6%) | 100520 (68.7%) | 133080 (71.9%) | 314235 (70.0%) | <0.01 |
| Black | 20824 (17.7%) | 25784 (17.6%) | 27405 (14.8%) | 74013 (16.5%) | <0.01 |
| Hispanics | 10736(9.1%) | 11596 (7.9%) | 14915 (8.1%) | 37247 (8.3%) | <0.01 |
| Asian or Pacific Islander | 2116 (1.8%) | 2988 (2.0%) | 3465 (1.9%) | 8569 (1.9%) | <0.01 |
| Native American | 531 (0.5%) | 1174 (0.8%) | 1430 (0.8%) | 3135 (0.7%) | <0.01 |
| Valve involved reported | 34305 (22.1%) | 45646 (26.4%) | 57600 (29.5%) | 137551 (26.2%) | <0.01 |
| Type of valve involved when reported | |||||
| Left sided IE* | 30153 (87.9%) | 40413 (88.5%) | 48575 (84.3%) | 119141 (86.6%) | <0.01 |
| Right sided IE* | 3784 (11.0%) | 4534 (9.9%) | 7835 (13.6%) | 16153 (11.7%) | |
| Unspecified† IE* | 426(1.2%) | 856(1.9%) | 1515 (2.6%) | 2797 (2.0%) | |
| Left Sided IE | |||||
| Aortic valve IE* | 16243 (55.1%) | 20151 (51.4%) | 24020 (51.4%) | 60414 (52.3%) | <0.01 |
| Mitral Valve IE* | 13213 (44.9%) | 19074 (48.6%) | 22705 (48.6%) | 54992 (47.7%) | |
| Combined aortic and mitral valve IE* | 698 (2.3%) | 1189 (2.9%) | 1850 (3.8%) | 3737 (3.1%) | |
| Drug abuse History | 14883 (9.6%) | 13606 (7.9%) | 32575 (16.7%) | 61064 (11.7%) | <0.01 |
| AHRQ‡ Medical comorbidities | |||||
| Acquired immune deficiency syndrome | 784 (0.5%) | 852 (0.5%) | 620 (0.3%) | 2256 (0.4%) | <0.01 |
| Alcohol abuse | 7361 (4.9%) | 8708 (5.0%) | 11560 (5.9%) | 27630 (5.3%) | <0.01 |
| Anemia§ | 34875 (23.0%) | 59300 (34.3%) | 78730 (40.3%) | 172905 (33.3%) | <0.01 |
| Collagen vascular disease | 4253 (2.8%) | 6166 (3.6%) | 7005 (3.6%) | 17424 (3.4%) | <0.01 |
| Congestive heart failure | 20251 (13.4%) | 29094 (16.8%) | 36630 (18.8%) | 85975 (16.5%) | <0.01 |
| Chronic pulmonary disease | 26511 (17.5%) | 31887 (18.4%) | 38300 (19.6%) | 96698 (18.6%) | <0.01 |
| Coagulopathy | 19622 (12.9%) | 29262 (16.9%) | 45520 (23.3%) | 94403 (18.2%) | <0.01 |
| Depression | 7649 (5.0%) | 14266 (8.2%) | 21965 (11.2%) | 43880 (8.4%) | <0.01 |
| Diabetes (uncomplicated) | 22596 (14.9%) | 33126 (19.2%) | 33450 (17.1%) | 89172 (17.2%) | <0.01 |
| Diabetes (with complications) | 11004 (7.3%) | 15249 (8.8%) | 22290 (11.4%) | 48543 (9.3%) | <0.01 |
| Hypertension | 56516(37.3%) | 87367 (50.5%) | 103250 (52.9%) | 247133 (47.5%) | <0.01 |
| Liver disease | 11180 (7.4%) | 12995 (7.5%) | 20595 (10.5%) | 44770 (8.6%) | <0.01 |
| Neurological disorders | 10559 (7.0%) | 14251 (8.2%) | 18995 (9.7%) | 43805 (8.4%) | <0.01 |
| Obesity¶ | 4724 (3.1%) | 13415 (7.8%) | 24330 (12.5%) | 42469 (8.2%) | <0.01 |
| Peripheral vascular disorders | 7861 (5.2%) | 20777 (12.0%) | 33485 (17.1%) | 62123 (11.9%) | <0.01 |
| Pulmonary circulation disorders | 1868 (1.2%) | 13963 (8.1%) | 25520 (13.1%) | 41351 (8.0%) | <0.01 |
| Renal failure | 35507 (23.4%) | 54127 (31.3%) | 56685 (29.0%) | 146319 (28.1%) | <0.01 |
| Weight loss | 9438 (7.9%) | 25409 (14.7%) | 35885 (18.4%) | 70732 (14.5%) | <0.01 |
| Median household income percentile | |||||
| 0–25 th | 37482 (24.8%) | 49120 (29.3%) | 62170 (32.6%) | 148772 (29.2%) | <0.01 |
| 26–50th | 36042 (23.9%) | 41425 (24.7%) | 48690 (25.6%) | 126157 (24.8%) | <0.01 |
| 51–75th | 36327 (24.1%) | 39818 (23.7%) | 41805 (22.0%) | 117950 (23.2%) | <0.01 |
| 76–100th | 41134 (27.2%) | 37417 (22.3%) | 37765 (19.8%) | 116316 (22.8%) | <0.01 |
| Primary Expected Payer | |||||
| Medicare | 82317 (53.1%) | 92232 (53.5%) | 93730 (48.1%) | 268279 (51.4%) | <0.01 |
| Medicaid | 21408 (13.8%) | 24551 (14.2%) | 41165 (21.1%) | 87124 (16.7%) | <0.01 |
| Private insurance | 36500 (23.6%) | 39005 (22.6%) | 39470 (20.3%) | 114975 (22.0%) | <0.01 |
| Self-pay | 9281 (6.0%) | 10221 (5.9%) | 13690 (7.0%) | 33191 (6.4%) | <0.01 |
| No charge | 1001 (0.6%) | 1293 (0.7%) | 1465 (0.8%) | 3759 (0.7%) | <0.01 |
Infective Endocarditis.
Unspecified valve ICD9 or ICD 10 code (see supplementary).
Agency for healthcare and quality research.
Deficiency anemias (Iron and Vitamin b12).
BMI>30 or any ICD code for Obesity.
Results
A total of 523,432 adult weighted encounters were identified. The number of IE hospitalizations increased from 155151 (2002 to 2006) to 195300 (2012 to 2016; p <0.01; Table 1). The median age was 60 years [interquartile range, 46 to 73]. From 2002–2006 to 2012–2016, following comorbidities significantly increased: alcoholism (4.9% to 5.9%), congestive heart failure (13.4% to 18.8%), depression (5.0% to 11.2%), diabetes mellitus with complications (7.3% to 11.4%), drug abuse (11.9% to 20.8%), hypertension (37.3% to 52.9%), liver disease (7.4% to 10.5%), peripheral vascular disease (5.2% to 17.1%).
Risk-adjusted in-hospital mortality decreased from 16.7% in 2002 to 9.7% in 2016 (p <0.01; Figure 2). The risk-adjusted length of stay decreased from 17.4 days in 2002 to 13.4 days in 2016 (p <0.01; Figure 3). The adjusted mean cost of stay increased from 112,702$ in 2002 to 164,767$ in 2016 (p <0.01; Figure 3). The increase in cost of stay was most likely due to increase in septic shock (5.7% to 17.1%, p <0.01), ventilator use (13.6% to 17.5%, p <0.01), and valve replacement (10.2% to 13.4%, p <0.01; Figure 3). Routine discharges to home decreased from 50.7% in 2002 to 2006 to 45.4% in 2012 to 2016 (p <0.01). Long term care facility discharges increased from 36.0% in 2002 to 2006 to 37.8% in 2012 to 2016 (p <0.01; Table 2).
Figure 2.
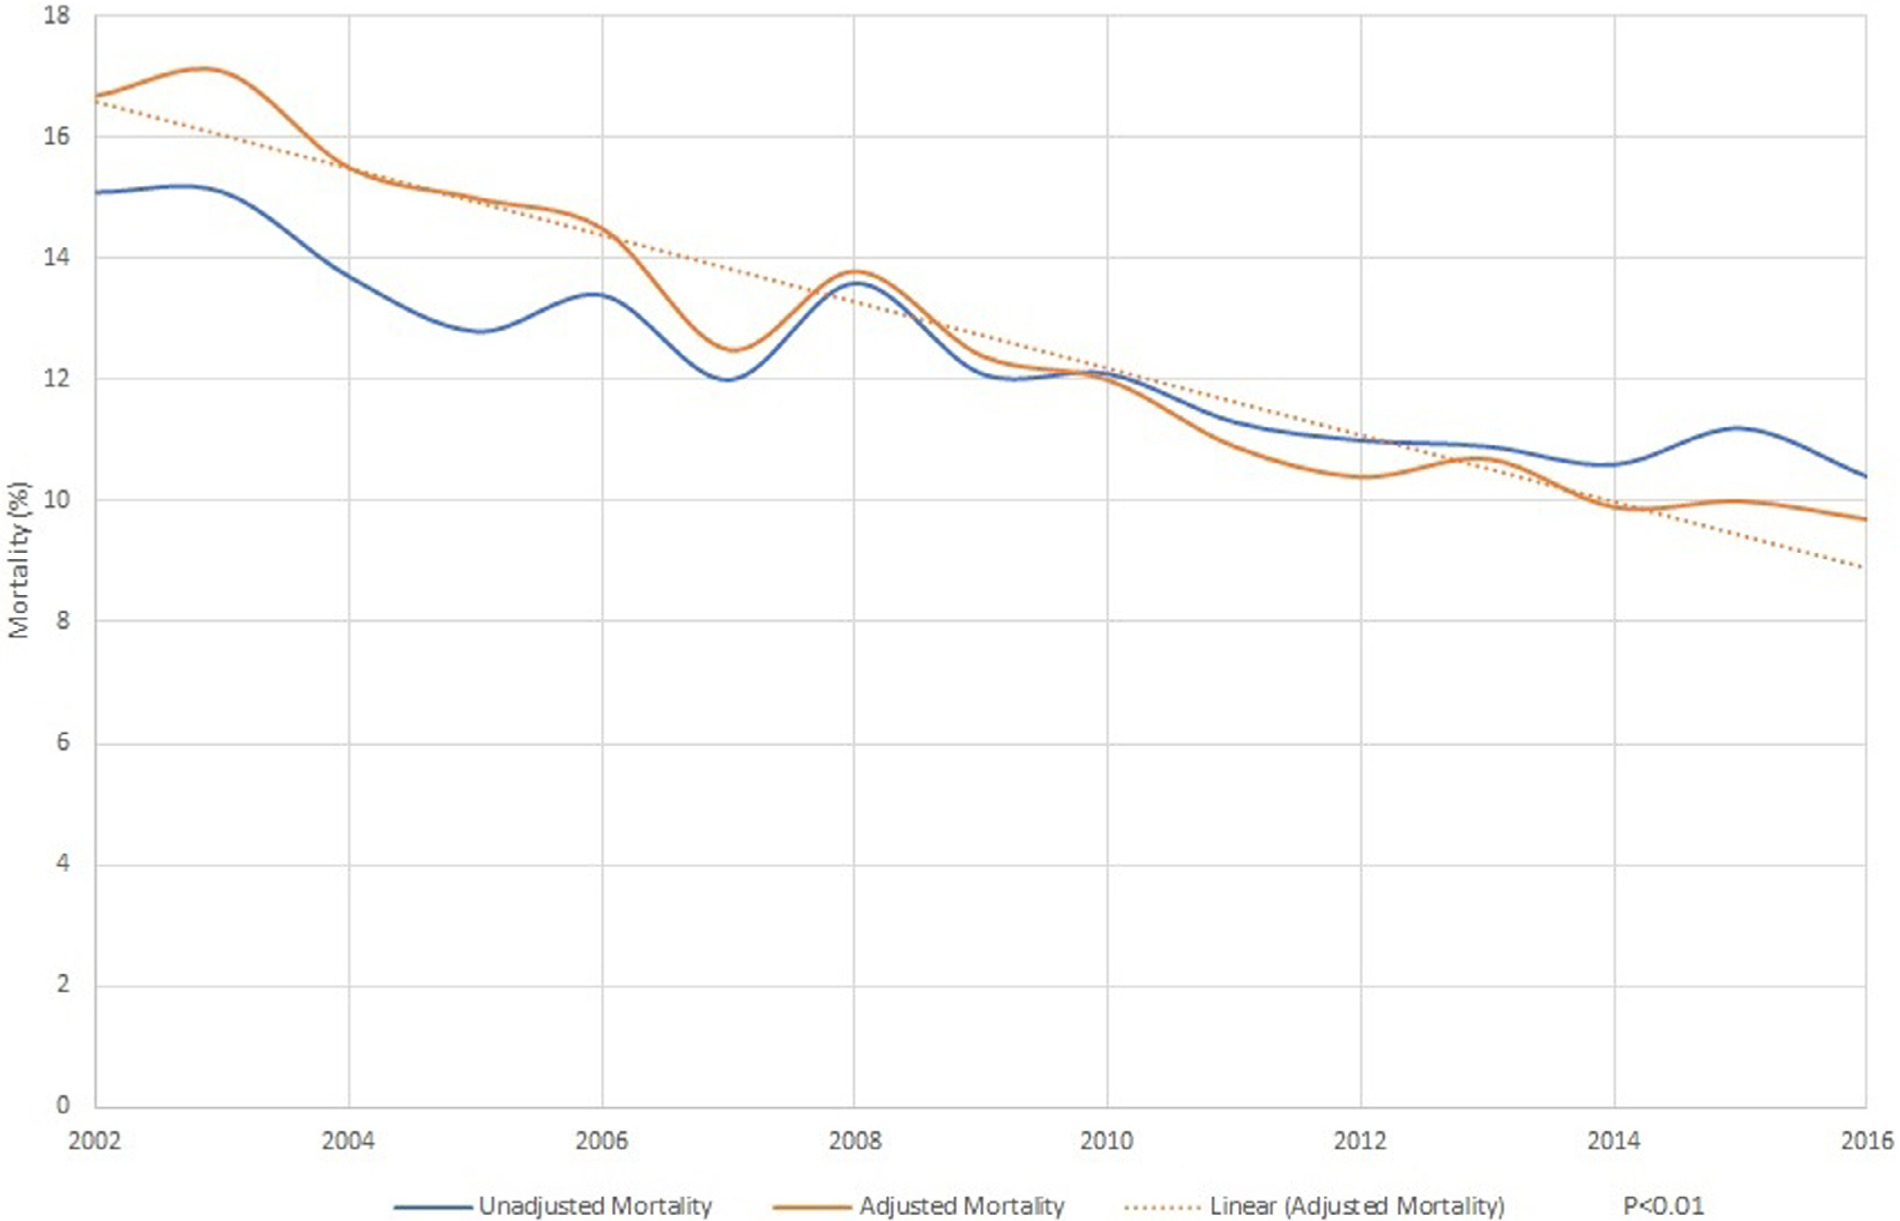
Trends in mortality in native valve infective endocarditis.
Figure 3.
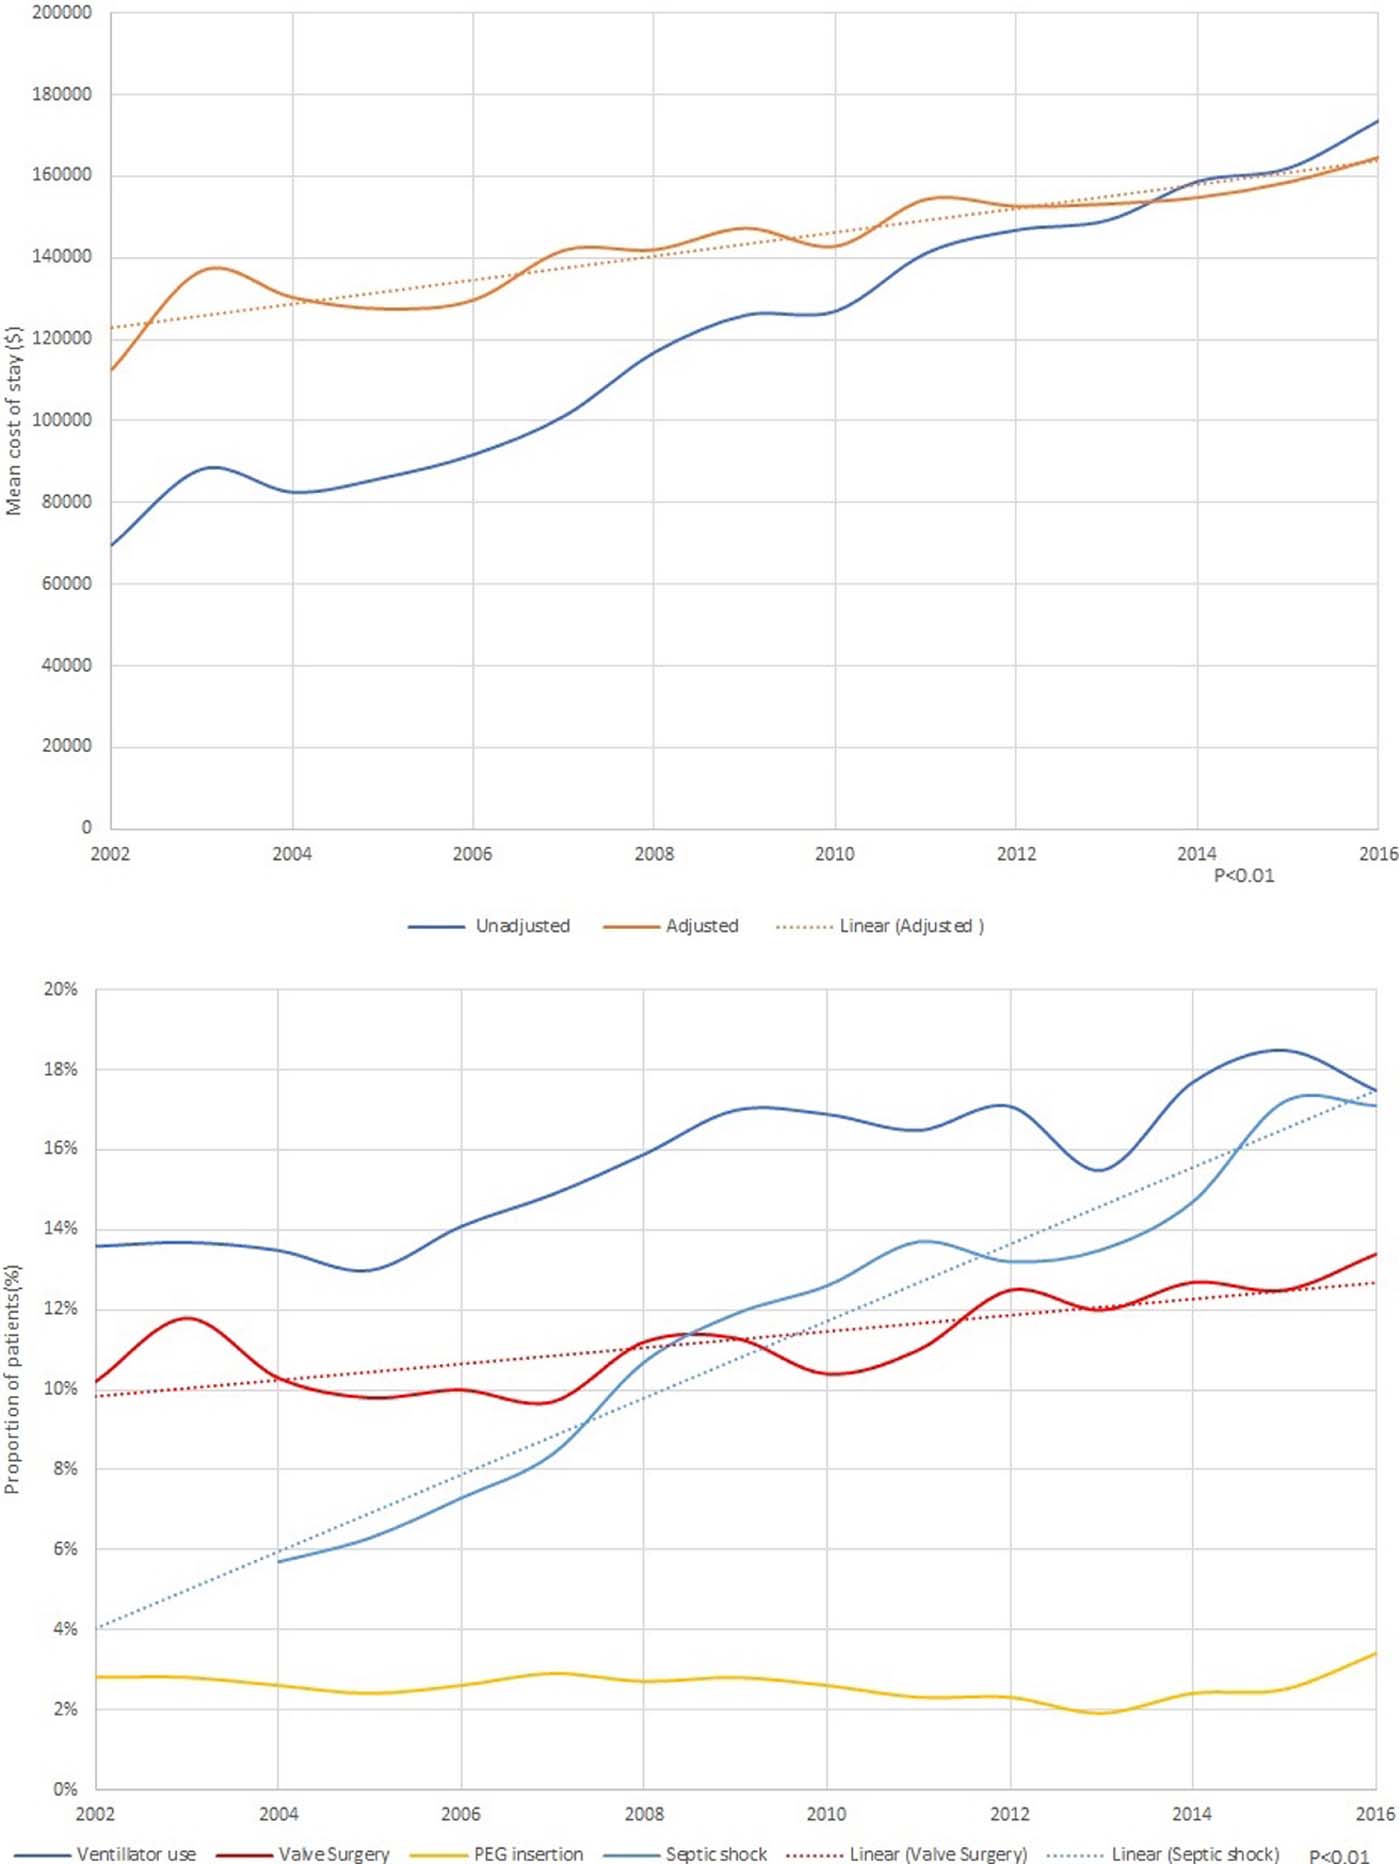
(A) Trends in length of stay in native valve infective endocarditis (B) Trends in cost of stay in native valve infective endocarditis (C) Hospital procedures in native valve infective endocarditis
Table 2.
Outcomes and resource utilization in infective endocarditis
| Variables no. (%) | 2002–2006 (n = 155151) | 2007–2011 (n = 172981) | 2012–2016 (n = 195300) | Total (n = 523432) | p value |
|---|---|---|---|---|---|
| Died at discharge | 21581 (14.0%) | 21093 (12.2%) | 21055 (10.8%) | 63729 (12.2%) | <0.01 |
| Discharge disposition of surviving patients | |||||
| Home or home with home health | 67381 (50.7%) | 72900 (48.2%) | 79195 (45.5%) | 219476 (47.9%) | |
| Short-term hospital | 14471 (10.9%) | 17256 (11.4%) | 21800 (12.5%) | 53527 (11.7%) | |
| Long term care facility | 47892 (36.0%) | 58117 (38.4%) | 65845 (37.8%) | 171854 (37.5%) | |
| Against Medical advice | 3216 (2.4%) | 3117 (2.1%) | 7270 (4.2%) | 13603 (3.0%) | |
| Resource Utilization | |||||
| Length of stay, mean (SD), days (unadjusted) | 15.24 (15.9) | 14.61 (15.7) | 14.39 (15.2) | 14.71 (15.6) | <0.01 |
| Cost of hospitalization-mean (SD), $ | 84,092 (108435) | 123,035 (167084) | 158,678 (219,757) | 124,908 (178066) | <0.01 |
Between 2002 and 2009, subgroup analysis of patients with a history of drug abuse showed a decreasing trend in hospitalization (9.7% in 2002 to 6.4% in 2009), followed by a rapid increase to 23.1% through 2016 (p <0.01; Figure 4). In comparison to nondrug users, the adjusted in-hospital mortality and length of stay significantly decreased (Figure 5), and cost of stay has increased (Figure 5).
Figure 4.
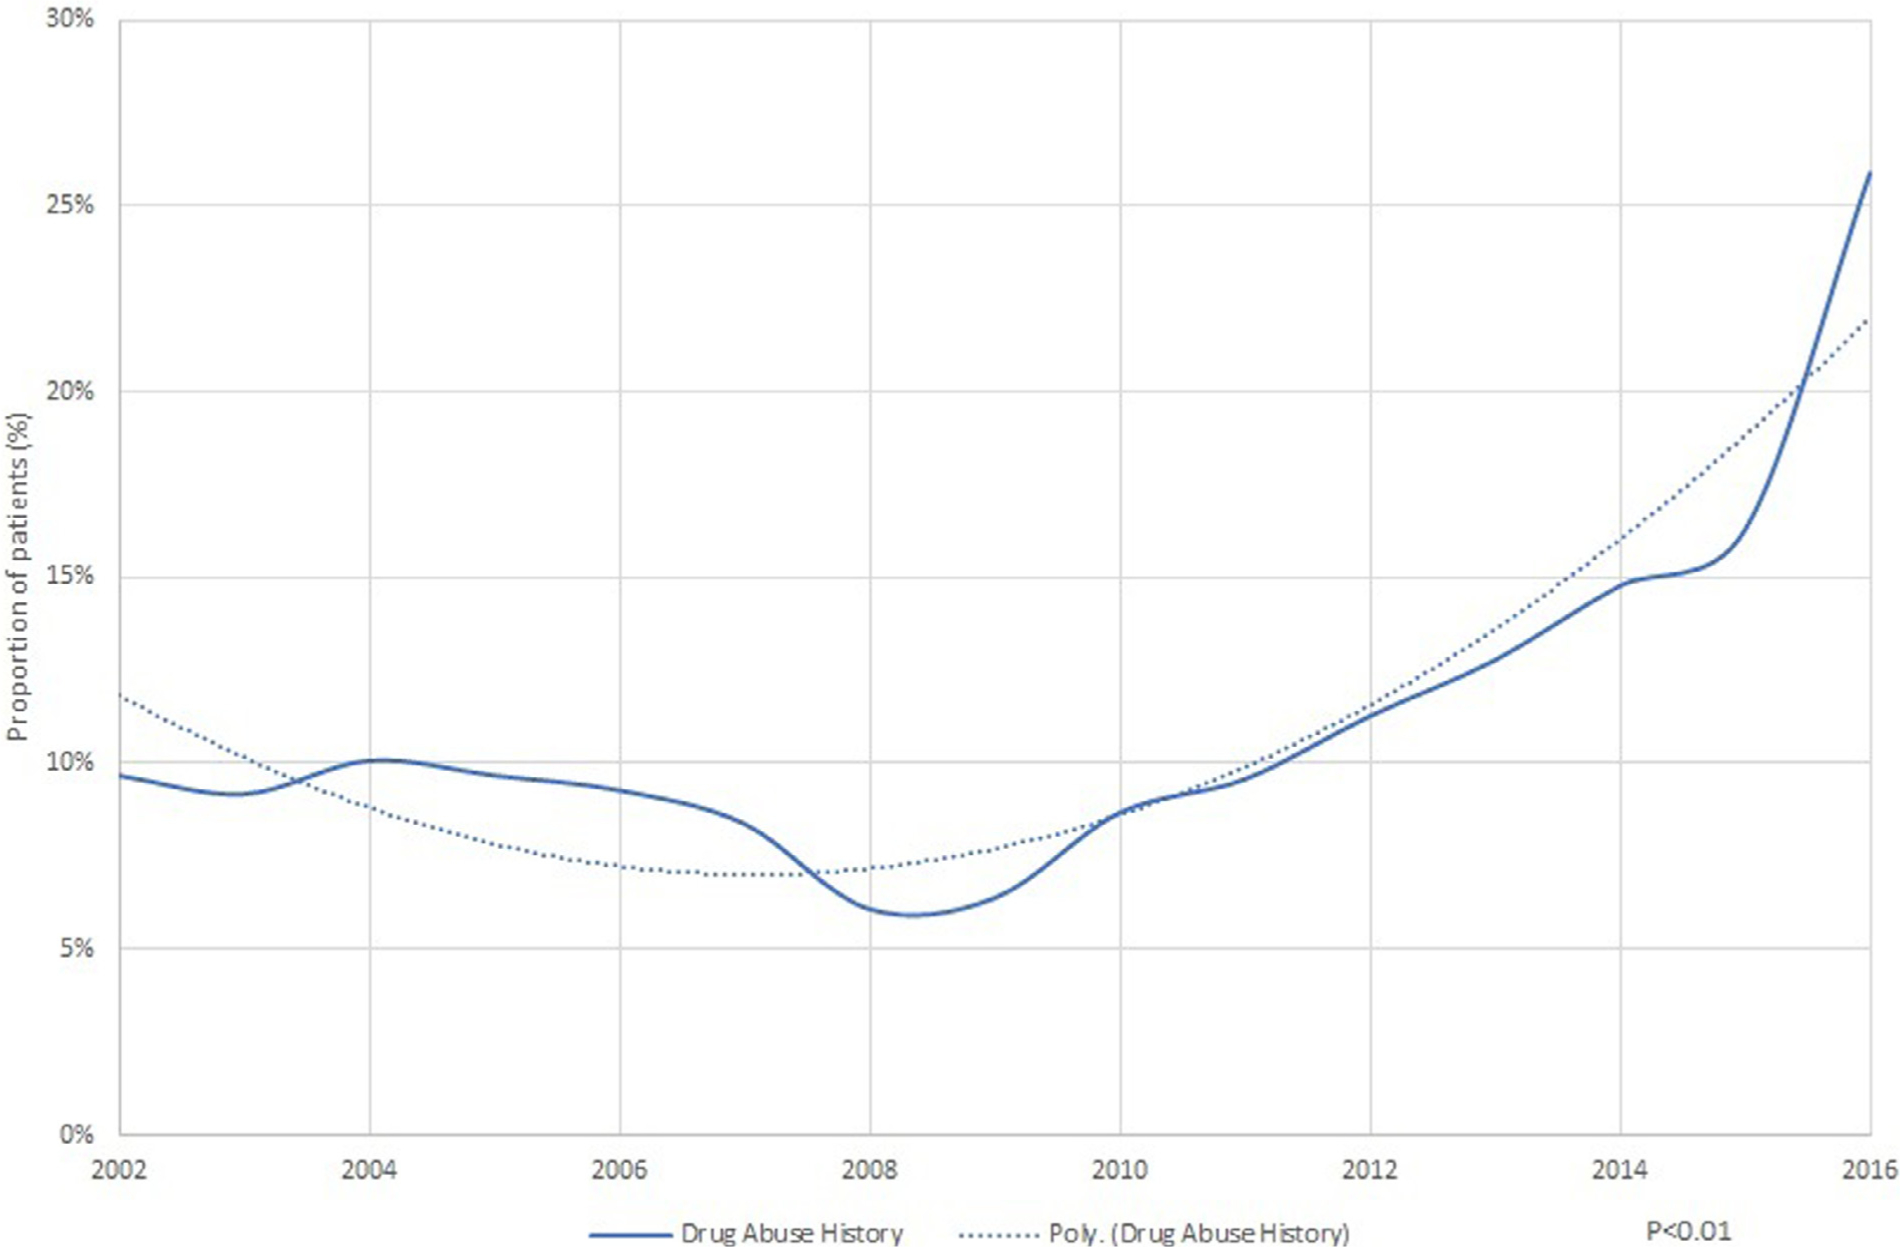
Proportion of native valve infective endocarditis patients with drug abuse.
Figure 5.
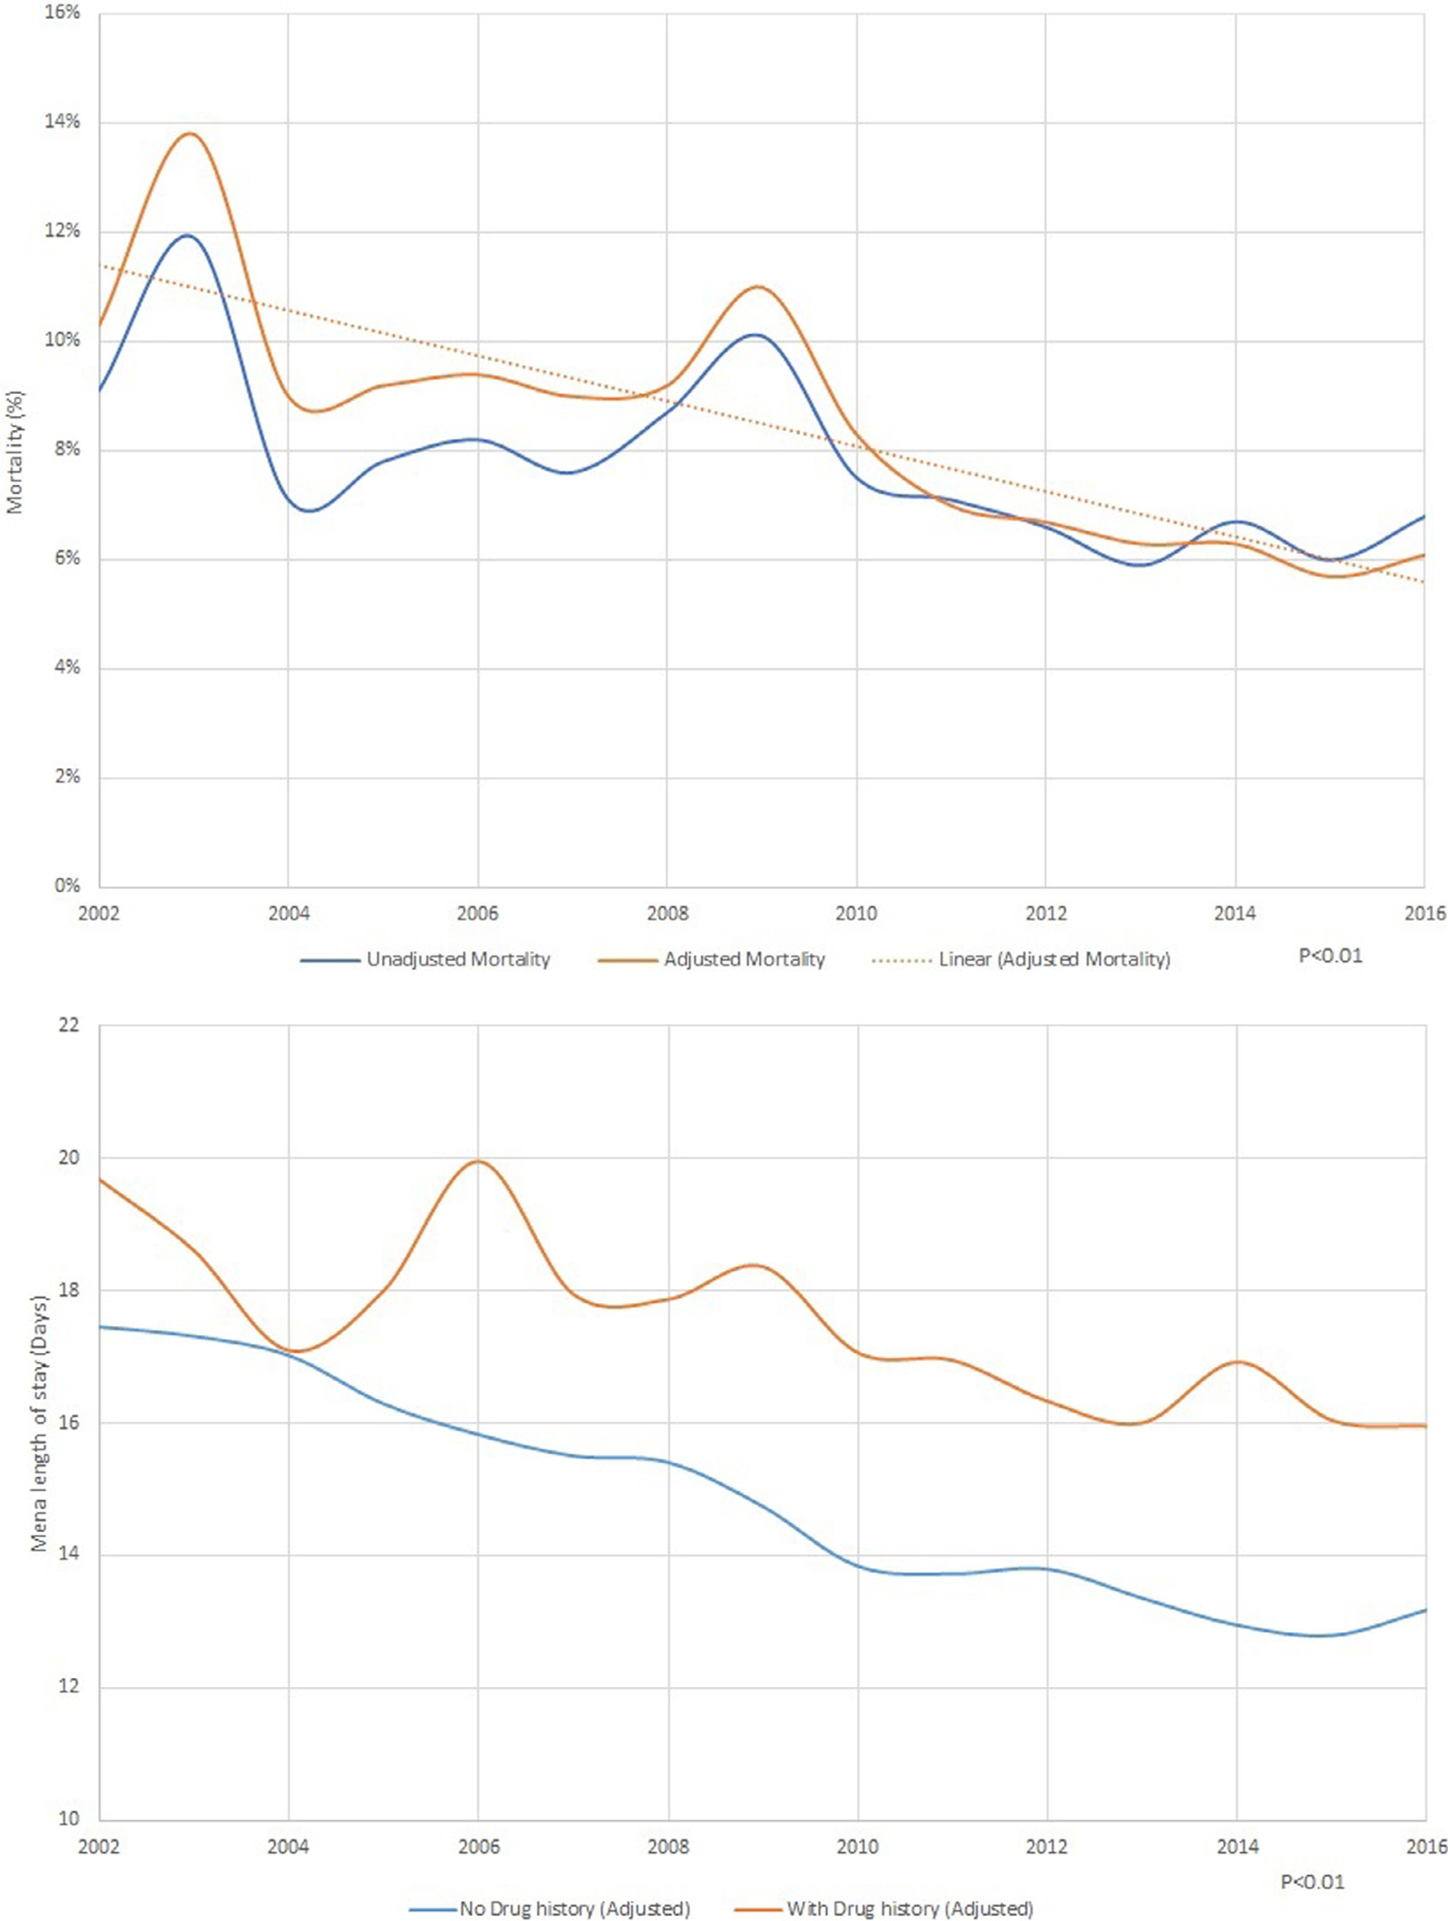
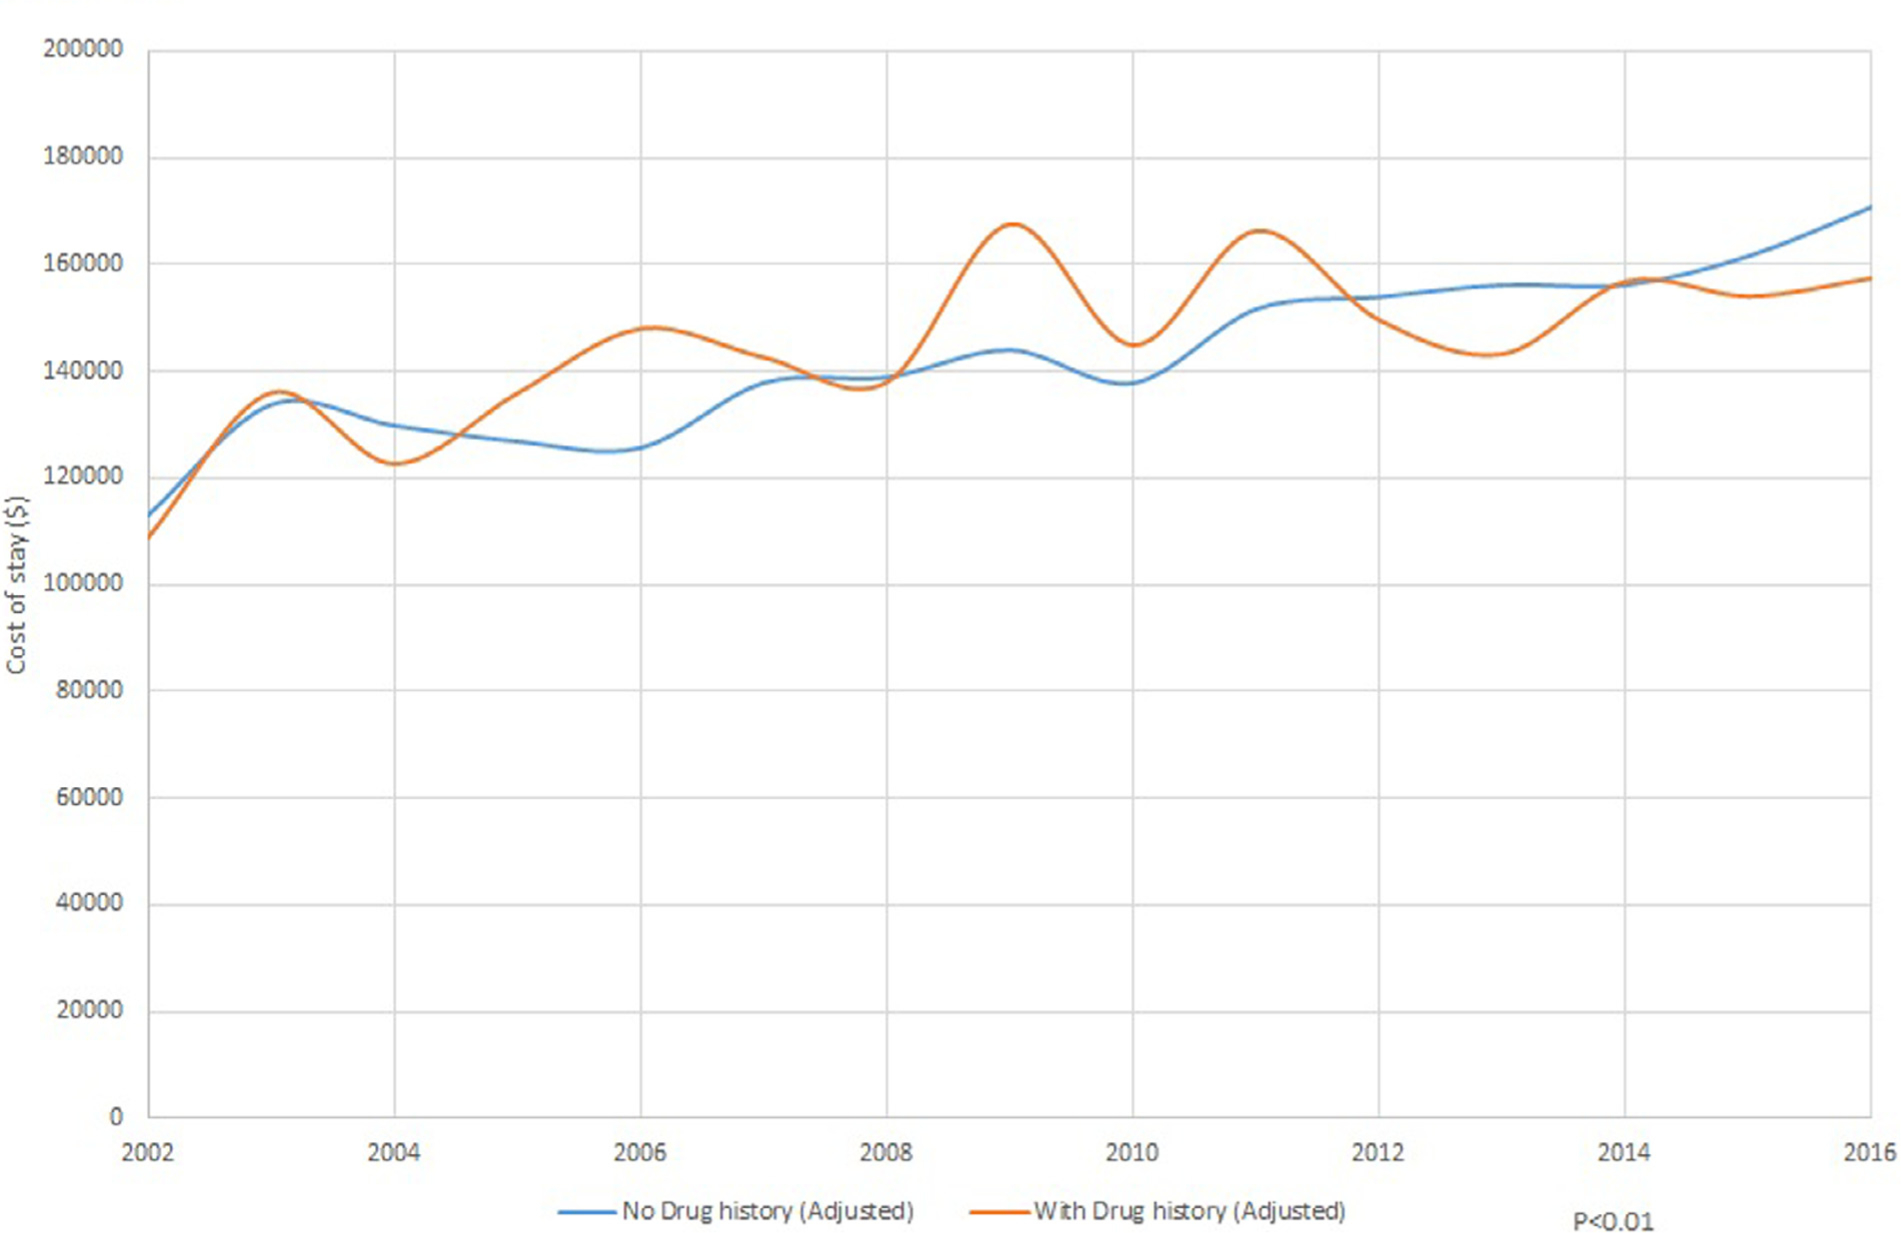
(A) Mortality trends in native valve infective endocarditis with drug abuse. (B) Trends in cost of stay in native valve infective endocarditis with and without drug abuse (C). Trends in length of stay in native valve infective endocarditis with and without drug abuse.
Logistic regression analysis on in-hospital mortality showed association with age (odds ratio [OR], 1.021 [95% confidence interval, 1.020 to 1.22], p <0.01), female gender (OR, 1.07 [1.05 to 1.09], p <0.01), blacks (OR, 1.28 [1.24 to 1.31], p <0.01), Hispanics (OR, 1.15 [1.11 to 1.19], p <0.01) and patients with co-morbid conditions like congestive heart failure (OR, 1.78 [1.74 to 1.82], p <0.01), renal failure (OR, [1.69 [1.65 to 1.73], p <0.01), coagulopathy (OR, 2.70 [2.64 to 2.76], p <0.01), peripheral vascular disease (OR, 1.37 [1.33 to 1.41], p <0.01) and weight loss (OR, 1.40 [1.36 to 1.43], p <0.01; Figure 6).
Figure 6.
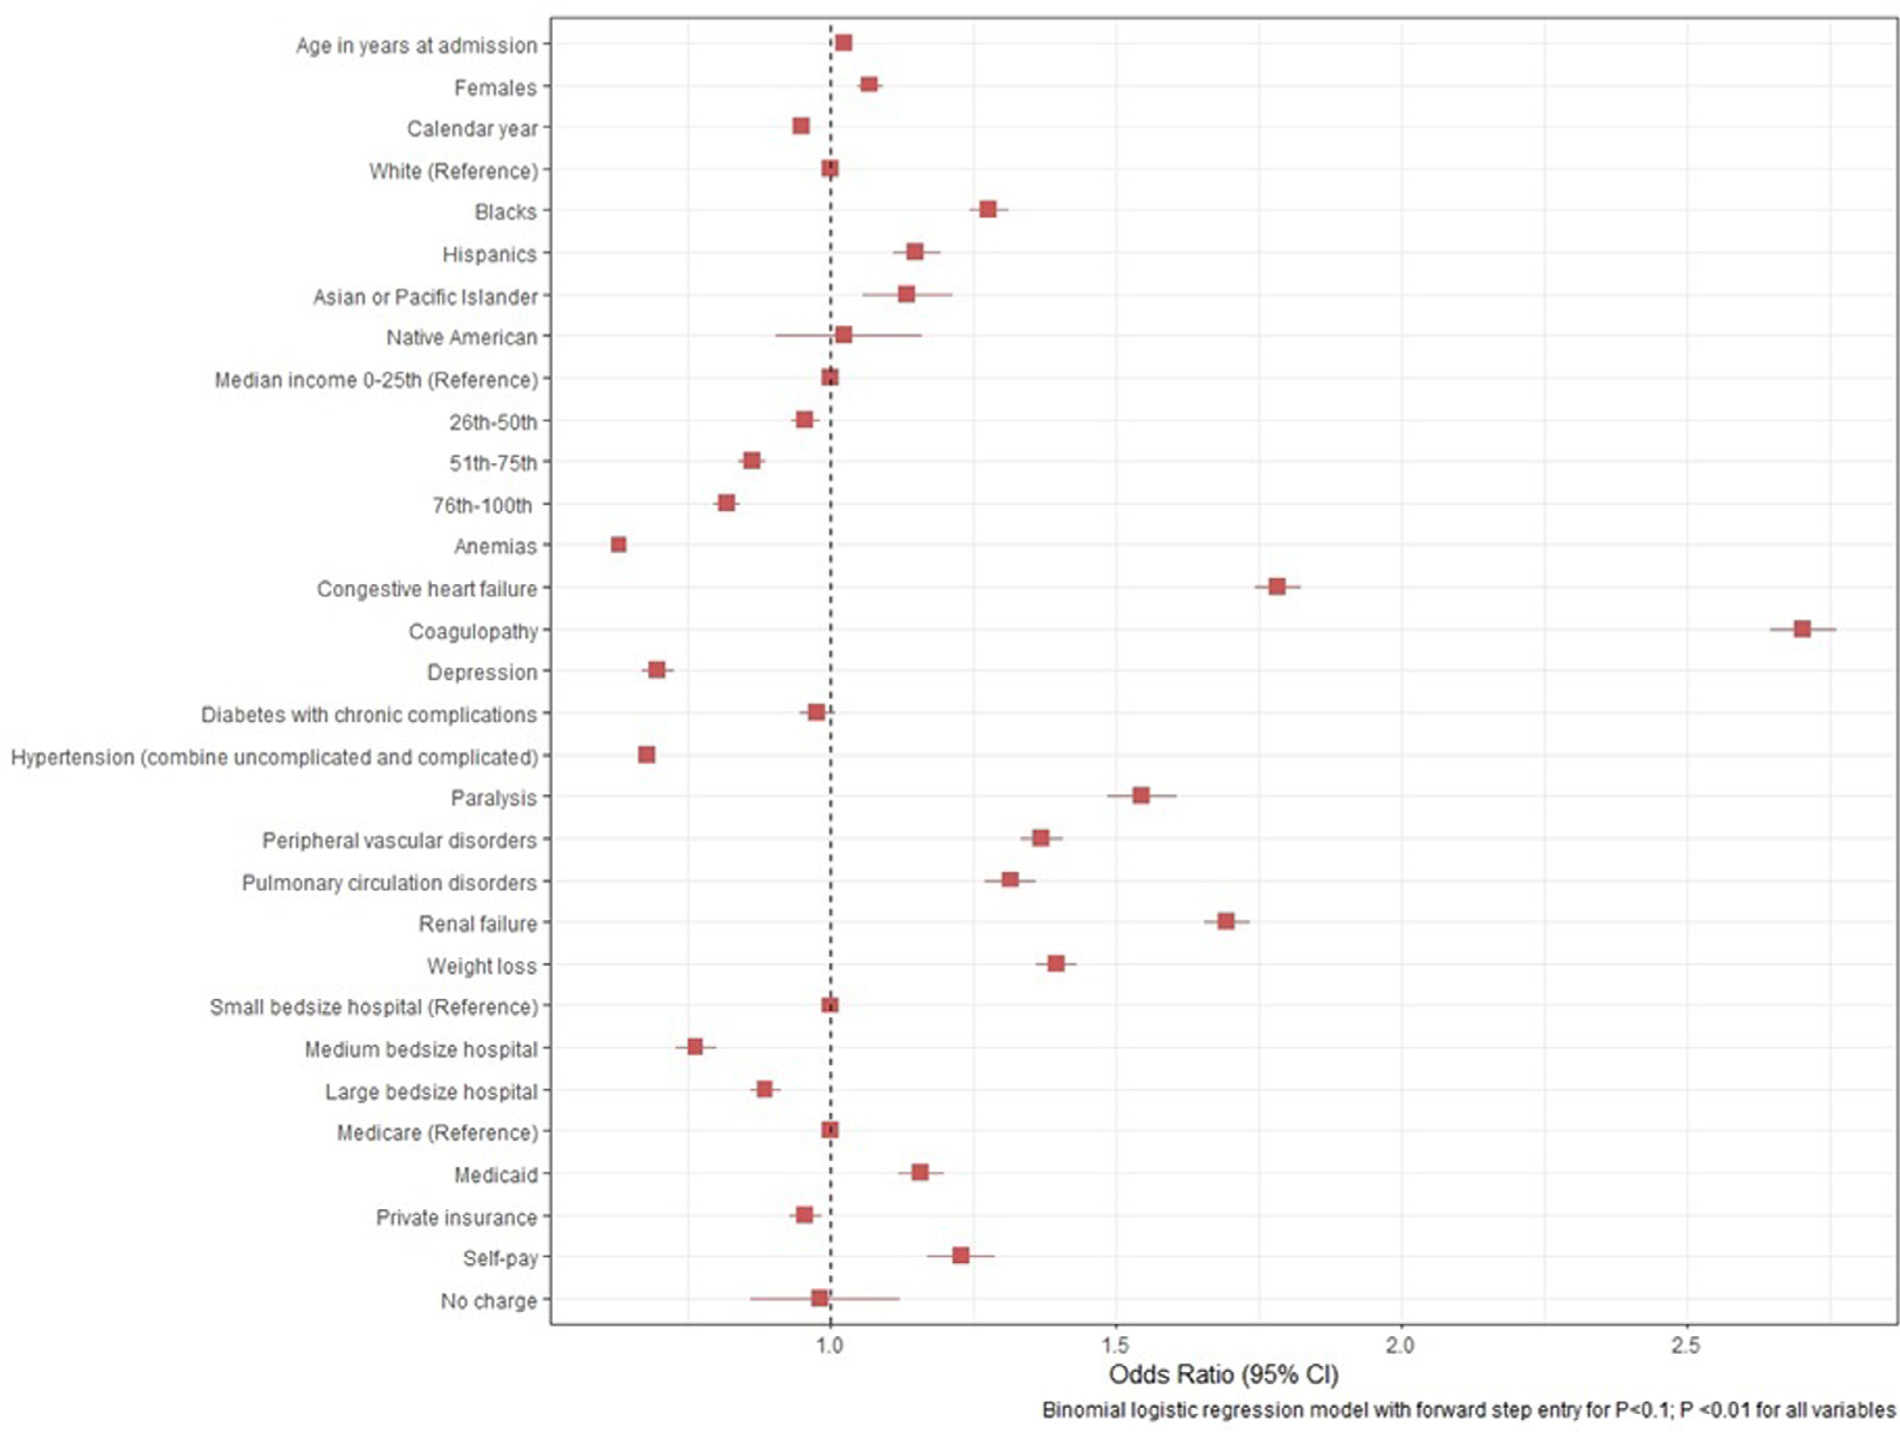
Predictors of mortality in native valve infective endocarditis.
Discussion
Our nation-wide analysis showed that IE still carries high morbidity and mortality although risk adjusted mortality has been on downtrend during our study time (16.7% in 2002 vs 9.7% in 2016, p <0.01). This is in contrast to previous estimates that have shown in-hospital mortality associated with IE between 11% and 26%.8–10 We also noticed an increase in cost of stay despite reduction in length of stay. Additionally, IE associated risk adjusted mortality and length of stay also decreased in patients with history of drug abuse despite increased prevalence of such patients over our study years. We also showed increase in IE associated hospitalizations from 155,151 during 2002 to 2006 to 195,300 in 2012 to 2016.
Our study showed improved inpatient mortality over the years with steep decrease noted after 2009. The decrease in risk-adjusted hospital mortality over the years is encouraging and was also seen in previous studies.11,12 Similarly, our study also showed reduction in length of stay for IE hospitalizations. This reduction in mortality and length of stay is likely reflective of improved health care delivery across our study years. Our study has shown that IE related admissions have increased (Table 1). This trend can be explained by the advanced age, higher co-morbidity burden and a worsening trend of drug abuse,3 especially since 2009 (Table 1 and Figure 4). In a study by Bates et al conducted in southern West Virginia, similar increase in drug-abuse related IE admissions were witnessed.13 Data from the Center for Disease Control shows a similar trend of increase in IE related admissions, which is often referred to as the second waiver opioid crisis.3 Historically, IE related hospital stay has remained expensive and lengthy. This is because IE care involves a multidisciplinary team effort requiring participation of both medical and surgical specialties. IE patients must undergo surgery if medical therapy is not effective and especially if the patient develops heart failure, heart block, persistent bacteremia, or embolic complications.14 In addition, patients are commonly admitted to intensive care unit and high level of care.15,16 We noticed a decrease in length of stay, but higher cost of stay partially owing to increase in complications, critical care, and surgical procedures including valve replacement surgeries. Moreover, the burden of IE is not just limited to the cost of hospitalization but also on ancillary services like post-discharge care including rehabilitation facilities and long-term care facilities. The proportion of IE patients having a history of drug abuse is all-time high and is showing concerning trend and has almost doubled recently. Socioeconomic status has longed been linked with increase incidence of drug abuse history. Most of these patients are poor and belong to a lower socioeconomic class. Almost 70% of our patients had Medicare/Medicaid insurance with the majority belonging to lower social-economic class.17–19
The predictors of inpatient mortality in IE are shown in Figure 6. Not surprisingly, severe comorbidities predicted higher mortality as shown in earlier studies.20 We also noticed better social-economic status predicting improved mortality. Private insurance predicted better outcomes but was probably a surrogate for social-economic status.21 Additionally, patients with private insurance tend to have better continuity of care as compared with patients with Medicare or self-pay. Patients with private insurance are more likely to have physician visits each year when compared with patients without private insurance. They are also more likely to be up-to-date on their routine screening and tend to have better control of chronic diseases like diabetes and hypertension. In addition to that dental coverage is often lacking with people that have Medicare as compared with private insurance.22
NIS is an administrative claim-based database that uses ICD-9-CM and ICD-10 codes, which are subject to error.23 However, we have selected codes that are studied before and are commonly utilized to analyze administrative datasets but there is still a potential for miscoding. Our study is a retrospective analysis and association does not mean casual relation. NIS collects data on in-patient discharges and each admission is registered as an independent event. It is possible that one patient may have more than one admission in the same or subsequent years. NIS censors data at discharge so long-term outcomes could not be ascertained from present dataset.24
In conclusion, although mortality and length of stay has been on the decrease in IE patients, the average cost of hospital stay has increased. This trend was uniform in patients with drug abuse history even though their prevalence is increasing in US.
Supplementary Material
Footnotes
Supplementary materials
Supplementary material associated with this article can be found in the online version at https://doi.org/10.1016/j.amjcard.2020.02.035.
References
- 1.Holland TL, Baddour LM, Bayer AS, Hoen B, Miro JM, Fowler VG. Infective endocarditis. Nat Rev Dis Prim 2016;2:16059. [DOI] [PMC free article] [PubMed] [Google Scholar]
- 2.Fleischauer AT, Ruhl L, Rhea S, Barnes E. Hospitalizations for endocarditis and associated health care costs among persons with diagnosed drug dependence-North Carolina, 2010–2015. Morb Mortal Wkly Rep 2017;66:569–573. [DOI] [PMC free article] [PubMed] [Google Scholar]
- 3.Scholl L, Seth P, Kariisa M, Wilson N, Baldwin G. Drug and opioid-involved overdose deaths — United States, 2013–2017. MMWR Morb Mortal Wkly Rep 2018;67:1419–1427. [DOI] [PMC free article] [PubMed] [Google Scholar]
- 4.Prendergast BD. The changing face of infective endocarditis. Heart 2006;92:879–885. [DOI] [PMC free article] [PubMed] [Google Scholar]
- 5.Nationwide Inpatient Sample (NIS). Healthcare cost and utilization project (HCUP). 2000–2011 Rockville, MD: Agency for Healthcare Research and Quality; 2013. Available at: www.hcup-us.ahrq.gov/nisoverview.jsp. [Google Scholar]
- 6.Healthcare Cost and Utilization Project. National inpatient sample overview. Available at: https://www.hcup-us.ahrq.gov/nisoverview.jsp.
- 7.Toyoda N, Chikwe J, Itagaki S, Gelijns AC, Adams DH, Egorova NN. Trends in infective endocarditis in California and New York state, 1998–2013. JAMA - J Am Med Assoc 2017;317:1652–1660. [DOI] [PMC free article] [PubMed] [Google Scholar]
- 8.Thuny F, Grisoli D, Collart F, Habib G, Raoult D. Management of infective endocarditis: challenges and perspectives. Lancet 2012;379:965–975. [DOI] [PubMed] [Google Scholar]
- 9.Fedeli U, Schievano E, Buonfrate D, Pellizzer G, Spolaore P. Increasing incidence and mortality of infective endocarditis: and population-based study through a record-linkage system. BMC Infect Dis 2011;11:48. [DOI] [PMC free article] [PubMed] [Google Scholar]
- 10.Murdoch DR, Corey RG, Hoen B, Miró M, Fowler VG, Bayer AS, Karchmer AW, Olaison L, Pappas PA, Moreillon P, Chambers ST, Chu VH, Falcó V, Holland DJ, Jones P, Klein JL, Raymond NJ, Read KM, Tripodi MF, Utili R, Wang A, Woods CW, Cabell CH. Clinical presentation, etiology, and outcome of infective endocarditis in the 21st century the international collaboration on Endocarditis-prospective cohort study. Arch Intern Med 2009;169:463–473. [DOI] [PMC free article] [PubMed] [Google Scholar]
- 11.Bikdeli B, Wang Y, Kim N, Desai MM, Quagliarello V, Krumholz HM. Trends in hospitalization rates and outcomes of endocarditis among medicare beneficiaries. J Am Coll Cardiol 2013;62:2217–2226. [DOI] [PMC free article] [PubMed] [Google Scholar]
- 12.Bor DH, Woolhandler S, Nardin R, Brusch J, Himmelstein DU. Infective endocarditis in the U.S., 1998–2009: a nationwide study. PLoS One 2013;8:e60033. [DOI] [PMC free article] [PubMed] [Google Scholar]
- 13.Bates MC, Annie F, Jha A, Kerns F. Increasing incidence of IV-drug use associated endocarditis in southern West Virginia and potential economic impact. Clin Cardiol 2019;42:432–437. [DOI] [PMC free article] [PubMed] [Google Scholar]
- 14.Asgeirsson H, Thalme A, Weiland O. Low mortality but increasing incidence of Staphylococcus aureus endocarditis in people who inject drugs experience from a Swedish referral hospital. Med (United States) 2016;95:e5617. [DOI] [PMC free article] [PubMed] [Google Scholar]
- 15.Pettersson GB, Coselli JS, Pettersson GB, Coselli JS, Hussain ST, Griffin B, Blackstone EH, Gordon SM, LeMaire SA, Woc-Colburn LE. 2016 The American Association for Thoracic Surgery (AATS) consensus guidelines: surgical treatment of infective endocarditis: executive summary. J Thorac Cardiovasc Surg 2017;153:1241–1258. [DOI] [PubMed] [Google Scholar]
- 16.Leroy O, Georges H, Devos P, Bitton S, Sa N De, Dedrie C, Beague S, Ducq P, Boulle-Geronimi C, Thellier D, Saulnier F, Preau S. Infective endocarditis requiring ICU admission: epidemiology and prognosis. Ann Intensive Care 2015;5:1–8. [DOI] [PMC free article] [PubMed] [Google Scholar]
- 17.Koch K, Nørgaard M, Schønheyder HC, Thomsen RW, Søgaard M, CØ Andersen, Arpi M, Gradel K, Jensen US, Knudsen JD, Pinholt M. Effect of socioeconomic status on mortality after bacteremia in working-age patients. A Danish population-based Cohort Study. PLoS One 2013;8:e70082. [DOI] [PMC free article] [PubMed] [Google Scholar]
- 18.Thakarar K, Rokas KE, Lucas FL, Powers S, Andrews E, DeMatteo C, Mooney D, Sorg MH, Valenti A, Cohen M. Mortality, morbidity, and cardiac surgery in Injection Drug Use (IDU)-associated versus non-IDU infective endocarditis: the need to expand substance use disorder treatment and harm reduction services. PLoS One 2019;14 e0225460–e0225460. [DOI] [PMC free article] [PubMed] [Google Scholar]
- 19.Oestergaard LB, Schmiegelow MD, Bruun NE, Skov RL, Petersen A, Andersen PS, Torp-Pedersen C. The associations between socioeconomic status and risk of Staphylococcus aureus bacteremia and subsequent endocarditis - a Danish nationwide cohort study. BMC Infect Dis 2017;17:589. [DOI] [PMC free article] [PubMed] [Google Scholar]
- 20.Hase R, Otsuka Y, Yoshida K, Hosokawa N. Profile of infective endocarditis at a tertiary-care hospital in Japan over a 14-year period: characteristics, outcome and predictors for in-hospital mortality. Int J Infect Dis 2015;33:e62–e66. [DOI] [PubMed] [Google Scholar]
- 21.Singh GK, Lin SC. Marked ethnic, nativity, and socioeconomic disparities in disability and health insurance among US children and adults: the 2008–2010 American Community Survey. Biomed Res Int 2013; 2013:627412. [DOI] [PMC free article] [PubMed] [Google Scholar]
- 22.Kominski GF, Nonzee NJ, Sorensen A. The affordable care act’s impacts on access to insurance and health care for low-income populations. Annu Rev Public Health 2017;38:489–505. [DOI] [PMC free article] [PubMed] [Google Scholar]
- 23.Gologorsky Y, Knightly JJ, Lu Y, Chi JH, Groff MW. Improving discharge data fidelity for use in large administrative databases. Neurosurg Focus 2014;36:E2. [DOI] [PubMed] [Google Scholar]
- 24.Khera R, Angraal S, Couch T, Welsh JW, Nallamothu BK, Girotra S, Chan PS, Krumholz HM. Adherence to methodological standards in research using the National Inpatient Sample. JAMA 2017;318:2011–2018. [DOI] [PMC free article] [PubMed] [Google Scholar]
Associated Data
This section collects any data citations, data availability statements, or supplementary materials included in this article.


