

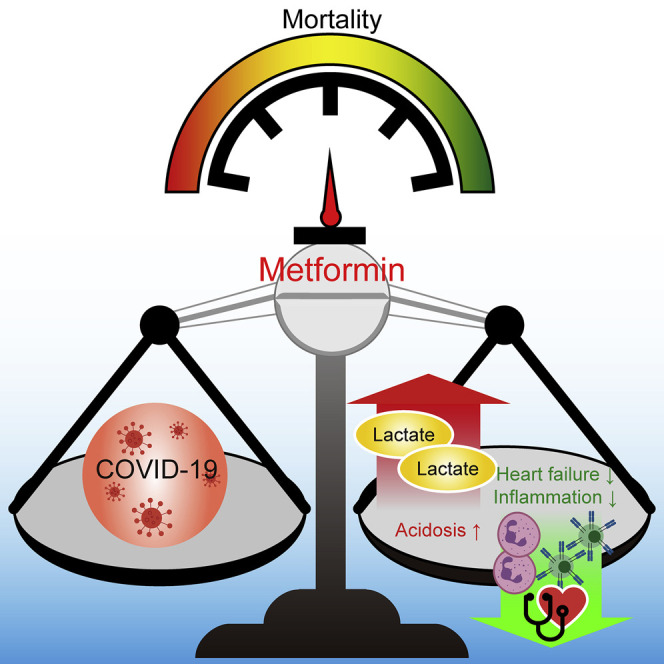
Abstract
The safety and efficacy of anti-diabetic drugs are critical for maximizing the beneficial impacts of well-controlled blood glucose on the prognosis of individuals with COVID-19 and pre-existing type 2 diabetes (T2D). Metformin is the most commonly prescribed first-line medication for T2D, but its impact on the outcomes of individuals with COVID-19 and T2D remains to be clarified. Our current retrospective study in a cohort of 1,213 hospitalized individuals with COVID-19 and pre-existing T2D indicated that metformin use was significantly associated with a higher incidence of acidosis, particularly in cases with severe COVID-19, but not with 28-day COVID-19-related mortality. Furthermore, metformin use was significantly associated with reduced heart failure and inflammation. Our findings provide clinical evidence in support of continuing metformin treatment in individuals with COVID-19 and pre-existing T2D, but acidosis and kidney function should be carefully monitored in individuals with severe COVID-19.
Keywords: coronavirus disease 2019, metformin, acidosis, mortality, inflammation, treatment
Graphical Abstract
Highlights
-
•
A retrospective study of 1,213 patients on metformin with COVID-19 was performed
-
•
Metformin was associated with increased incidence of acidosis in such patients
-
•
Metformin was not associated with increased 28-day all-cause mortality in the patients
-
•
Metformin was significantly associated with reduced heart failure and inflammation
In a cohort of 1,213 hospitalized patients with COVID-19 and pre-existing type 2 diabetes, Cheng et al. show that metformin use is significantly associated with higher incidence of acidosis, particularly in cases with severe COVID-19, but not with 28-day all-cause mortality. They also found that metformin use is significantly associated with reduced heart failure and inflammation.
Introduction
The spread of the severe acute respiratory syndrome coronavirus 2 (SARS-COV-2) infection is unprecedented in its global scale and speed, afflicting more than 20.4 million people with the novel coronavirus disease (COVID-19), resulting in more than 744,000 deaths globally as of August 13, 2020. Accumulating evidence has demonstrated that diabetes mellitus, particularly type 2 diabetes (T2D), is a major comorbidity that significantly increases the risk of death and adverse complications in individuals with COVID-19 (Richardson et al., 2020; Zhu et al., 2020). We recently found, in one of the largest retrospective cohort studies of in-hospital individuals, that well-controlled blood glucose is associated with a remarkable reduction of death and adverse complications in individuals with COVID-19 and pre-existing T2D (Zhu et al., 2020), indicating the importance and likely the necessity of intensive blood glucose management in these individuals.
Metformin is a leading first-line anti-diabetic medication (American Diabetes Association, 2019). It is the most commonly prescribed drug for the treatment of T2D (used by 30%–88% of individuals with T2D), owing to its low cost, good safety profile, and a broad spectrum of clinical benefits (Bailey, 2017; Overbeek et al., 2017; Zhu et al., 2020). For individuals with COVID-19 and pre-existing T2D, the established beneficial effects of metformin on blood glucose management (Foretz et al., 2014), cardiac protection (Foretz et al., 2014), and immune modulation (Ursini et al., 2018) may result in a more beneficial outcome of the viral disease than if metformin use is withheld. However, concerns have been raised regarding the potential side effects of metformin use as it can promote lactic acidosis in individuals with COVID-19 and pre-existing T2D, particularly for individuals with severe symptoms of COVID-19 (Bornstein et al., 2020). In addition, the potential of metformin to enhance the expression of angiotensin-converting enzyme 2 (ACE2) (Zhang et al., 2018a), the viral receptor for SARS-COV-2 (Hoffmann et al., 2020), has also raised the concern that metformin use may promote the progression of COVID-19. Hence, whether metformin use should be recommended or discontinued in individuals with COVID-19 and pre-existing T2D still remains highly controversial. Considering the urgency of the COVID-19 pandemic, and the significant number of individuals with COVID-19 and pre-existing T2D who could be treated by metformin, information on the clinical impact of its usage in the context of COVID-19 would have significant and immediate implications.
In this study, we retrospectively enrolled 15,451 confirmed COVID-19 cases that were admitted among 16 hospitals from Hubei Province, China, among which 2,563 individuals had pre-existing T2D, to investigate the relationship between in-hospital use of metformin and the clinical outcomes in those individuals with COVID-19 and pre-existing T2D. Our findings indicate that metformin use is associated with increased incidence of acidosis, but not 28-day all-cause mortality, in individuals with COVID-19 and pre-existing T2D. Furthermore, metformin use was significantly associated with reduced heart failure as well as an inflammatory response. These findings offer important information to assist clinicians in the decision to use metformin to manage diabetes in individuals with COVID-19.
Results and Discussion
Baseline Clinical Characteristics of Individuals with COVID-19 and Pre-existing T2D in the Metformin and the Non-metformin Groups
A total of 2,563 individuals with confirmed COVID-19 and with T2D from 16 hospitals in Hubei Province, China, were initially included for this study. A total of 184 individuals younger than 18 or older than 80 years, 133 without complete medical records, 16 with pregnancy, 6 death from acute myocardial infarction, 1 death from acute stroke, 4 death from severe acute pancreatitis, and 7 with liver cirrhosis were excluded. The individuals with contraindications for taking metformin, including 106 with an estimated glomerular filtration rate (eGFR) < 30 mL/min/1.73 m2 (i.e., greater than stage 4 renal insufficiency), 4 with prehospital ketoacidosis, and 2 with prehospital hyperosmolar coma, were excluded. We also excluded 550 individuals without any anti-diabetic treatment and 337 individuals using insulin as the only anti-diabetic medication (Figure 1 ).
Figure 1.

The Flowchart of Study Procedure
The final cohort had 1,213 individuals with T2D, including 678 subjects (male, 53.8%) treated with metformin or metformin plus other anti-diabetic drugs (referred to as the metformin group) and 535 individuals (male, 49.9%) treated with anti-diabetic drugs other than metformin (referred to as the non-metformin group). The baseline characteristics on admission for both groups are shown in Table 1 . The median ages were 62 (IQR, 55–68) and 64 (IQR, 58–70) years in the metformin and the non-metformin groups, respectively. The median body mass index (BMI) was 24.3 (IQR, 22.0–25.9) versus 24.5 (IQR, 22.6–26.2) kg/m2 in the metformin versus the non-metformin groups, respectively. While individuals in both groups exhibited similar levels of elevated systolic blood pressure (SBP), the metformin group had lower incidences of pre-existing coronary heart disease (12.4% versus 17.9%) and cerebrovascular disease (2.5% versus 5.2%) than the non-metformin group. The proportion of individuals with increased C-reactive protein (CRP) levels in the metformin group was lower than that in the non-metformin group (46.9% versus 55.7%). The median fasting glucose level was higher in the metformin group (9.0, IQR, 6.7–13.1 mmol/L) compared to that in the non-metformin group (8.3, IQR, 6.4–11.8 mmol/L). Meanwhile, the percentage of HbA1c in the metformin group (8.1, IQR, 7.0%–9.9%) was also higher than that in the non-metformin group (7.6, IQR, 6.7%–8.9%). Chest computed tomography (CT) scan and major lab examinations results were similar or marginally different between the two groups. There were similar numbers of cases with severe COVID-19 in the metformin group versus the non-metformin group (32.60% versus 33.83%, p = 0.695) on admission.
Table 1.
Baseline Characteristics in Individuals of the Metformin and the Non-metformin Groups before PSM
| Parameters | Total (N = 1,213) | Metforminb (n = 678) | Non-metforminc (n = 535) | SDd | p Valuee |
|---|---|---|---|---|---|
| Age, median (IQR), years | 63.0 (56.0–69.0) | 62.0 (55.0–68.0) | 64.0 (58.0–70.0) | −0.278 | <0.001 |
| Male gender, n (%) | 632 (52.1%) | 365 (53.8%) | 267 (49.9%) | 0.079 | 0.193 |
| Heart rate, median (IQR), bpm | 84.0 (78.0–98.0) | 85.0 (77.0–98.0) | 84.0 (78.0–96.0) | 0.050 | 0.591 |
| Respiratory rate, median (IQR), bpm | 20.0 (19.0–21.0) | 20.0 (19.0–21.0) | 20.0 (19.0–21.0) | 0.024 | 0.540 |
| SBP, median (IQR), mmHg | 133.0 (121.0–145.0) | 132.0 (122.0–145.0) | 134.0 (120.0–145.0) | −0.006 | 0.851 |
| DBP, median (IQR), mmHg | 80.0 (73.0–89.0) | 80.0 (73.0–89.0) | 80.0 (72.0–89.0) | 0.049 | 0.734 |
| SpO2, median (IQR) | 97.0 (95.0–98.0) | 97.0 (95.0–98.0) | 97.0 (95.0–98.0) | 0.017 | 0.962 |
| Comorbidities on Admission | |||||
| Chronic obstructive pulmonary disease, n (%) | 9 (0.7%) | 5 (0.7%) | 4 (0.8%) | −0.001 | 1.000 |
| Heart failure, n (%) | 2 (0.2%) | 0 (0.0%) | 2 (0.4%) | −0.087 | 0.194 |
| Coronary heart disease, n (%) | 180 (14.8%) | 84 (12.4%) | 96 (17.9%) | −0.155 | 0.009 |
| Cerebrovascular diseases, n (%) | 45 (3.7%) | 17 (2.5%) | 28 (5.2%) | −0.142 | 0.019 |
| Chronic liver disease, n (%) | 23 (1.9%) | 13 (1.9%) | 10 (1.9%) | 0.004 | 1.000 |
| Chronic renal diseases, n (%) | 30 (2.5%) | 16 (2.4%) | 14 (2.6%) | −0.016 | 0.920 |
| Chest CT on Admission | |||||
| Unilateral lesion, n/N (%) | 62/1,142 (5.4%) | 35/627 (5.6%) | 27/515 (5.2%) | 0.015 | 0.904 |
| Bilateral lesion, n/N (%) | 1,041/1,142 (91.2%) | 580/627 (92.5%) | 461/515 (89.5%) | 0.105 | 0.096 |
| Laboratory Examination on Admission | |||||
| Leukocyte count > 9.5, 10ˆ9, n/N (%) | 110/1,171 (9.4%) | 58/655 (8.9%) | 52/516 (10.1%) | −0.042 | 0.541 |
| Neutrophil count > 6.3, 10ˆ9/L, n/N (%) | 177/1,171 (15.1%) | 99/655 (15.1%) | 78/516 (15.1%) | −0.000 | 1.000 |
| Lymphocyte count < 1.1, 10ˆ9/L, n/N (%) | 477/1,171 (40.7%) | 256/655 (39.1%) | 221/516 (42.8%) | −0.076 | 0.217 |
| RBC: male, <4.5, 10ˆ12/L; female, <4.0, 10ˆ12/L, n/N (%) | 520/1,171 (44.4%) | 286/655 (43.7%) | 234/516 (45.4%) | −0.034 | 0.605 |
| C-reactive protein > ULNa, n/N (%) | 325/637 (51.0%) | 158/337 (46.9%) | 167/300 (55.7%) | −0.176 | 0.033 |
| Procalcitonin level > ULNa, n/N (%) | 433/981 (44.1%) | 247/564 (43.8%) | 186/417 (44.6%) | −0.016 | 0.851 |
| ALT > 40 U/L, n/N (%) | 249/1,165 (21.4%) | 141/651 (21.7%) | 108/514 (21.0%) | 0.016 | 0.845 |
| eGFR, median (IQR), mL/min | 101.9 (85.9–120.1) | 103.4 (87.6–120.9) | 100.4 (83.1–118.1) | 0.108 | 0.048 |
| D-dimer > ULNa, n/N (%) | 565/1,074 (52.6%) | 309/595 (51.9%) | 256/479 (53.4%) | −0.030 | 0.666 |
| LDL-c > 3 mmol/L, n/N (%) | 157/925 (17.0%) | 93/518 (18.0%) | 64/407 (15.7%) | 0.060 | 0.419 |
| Blood glucose, median (IQR), mmol/L | 8.6 (6.5–12.5) | 9.0 (6.7–13.1) | 8.3 (6.4–11.8) | 0.197 | <0.001 |
SBP, systolic blood pressure; DBP, diastolic blood pressure; SpO2, oxygen saturation; CT, computed tomography; RBC, red blood cell; ALT, alanine aminotransferase; eGFR, estimated glomerular filtration rate; LDL-c, low-density lipoprotein cholesterol; IQR, interquartile range; SD, standardized difference.
Upper limit of normal (ULN) was defined according to criteria in each hospital.
Individuals with T2D taking metformin during hospitalization were assigned to the metformin cohort. Individuals who discontinued treatment of diabetes due to inability to take medications for diabetes were not excluded from the cohort.
Individuals with T2D who never took metformin during hospitalization were assigned to the non-metformin cohort.
Standardized differences were used to compare the means of baseline covariates between the metformin and the non-metformin groups.
p values were calculated by Mann-Whitney U test for non-normally distributed continuous variables and Fisher’s exact test or χ2 test for categorical variables.
Metformin Use Is Associated with Lactic Acidosis and Acidosis in Individuals with COVID-19 and T2D
Metformin lowers glucose levels mainly by reducing hepatic glucose production through inhibiting the mitochondrial respiratory chain, preventing intestinal glucose absorption, and enhancing glucose uptake and utilization by peripheral tissues (Foretz et al., 2014). The blockage of oxidative phosphorylation also promotes anaerobic metabolism, which increases the risk of accumulation of the by-product lactate (Rena et al., 2017). Metformin-induced lactic acidosis was first reported when 66 individuals treated with metformin developed lactic acidosis within 1 year after metformin was introduced in the United States (Misbin et al., 1998). The actual incidence of lactic acidosis is approximately 1 in 23,000 to 30,000 persons per year among metformin users (Bodmer et al., 2008; Inzucchi et al., 2014). However, in the setting of infection and sepsis, hyperlactatemia can be dramatically induced mainly due to inadequate oxygen delivery, leading to tissue hypoxia and enhanced anaerobic glycolysis (Suetrong and Walley, 2016). Elevated serum lactate is associated with increased mortality, independent of organ failure and shock (Bakker et al., 1991; Mikkelsen et al., 2009).
In this study, we first investigated the well-known lactic acidosis-promoting effect of metformin. In the metformin group, 20 individuals (2.95%) developed acidosis and 12 individuals (1.77%) developed lactic acidosis, percentages that are higher compared to those of the non-metformin group (1.5% acidosis and 0.75% lactic acidosis, respectively). As metformin use could be dynamically determined by the medication status during hospitalization, the Cox regression model with time-varying exposure was applied to the entire cohort to analyze the association between metformin use and the incidence of acidosis, in which daily use of metformin was considered a covariable. Here, the adjusted variables for comparison between the metformin and the non-metformin groups included age, gender, comorbidities (cerebrovascular disease and coronary heart disease), blood glucose, CRP elevation, eGFR, alanine aminotransferase (ALT) elevation, and creatinine elevation. In this model, the risks for both lactic acidosis (adjusted HR, 4.66; 95% CI, 1.45–14.99; p = 0.010) and acidosis (adjusted HR, 2.45; 95% CI, 1.08–5.54; p = 0.032) were significantly higher in the metformin group than that in the non-metformin group (Table 2 ). To validate the statistical model, Schoenfeld’s global test was performed. The p values in all models were greater than 0.05, which indicated that the time-varying Cox models were consistent and fit for evaluating acidosis and lactic acidosis in this study (Table S1). The E-values for acidosis and lactic acidosis are 4.33 and 8.79, respectively.
Table 2.
Hazard Ratios for Acidosis and Lactic Acidosis between Individuals in the Metformin and the Non-metformin Groups
| Metformin versus Non-metformin | Time-Varying Cox Model Exposure before PSM |
Hazard in All Groups after PSM |
||
|---|---|---|---|---|
| Adjusted HRa (95% CI) | p Valueb | Adjusted HRc (95% CI) | p Valued | |
| Acidosis | 2.45 (1.08,5.54) | 0.032 | 2.73 (1.04,7.13) | 0.040 |
| Lactic acidosis | 4.66 (1.45,14.99) | 0.010 | 4.46 (1.11,18.00) | 0.036 |
HR, hazard ratio; CI, confidence interval.
In the time-varying Cox model, adjusted variables for comparison between the metformin and the non-metformin cohorts included age, gender, comorbidities (cerebrovascular disease and coronary heart disease), blood glucose, C-reactive protein, estimated glomerular filtration rate, alanine aminotransferase, and creatinine.
The p values were calculated based on the time-varying Cox model.
In the mixed-effect Cox proportional hazard model, adjusted variables for comparison between the metformin and the non-metformin cohorts included age, gender, C-reactive protein, aspartate aminotransferase, urea, red blood cell, creatinine, and hospital site as a random effect.
The p values were calculated based on mixed-effect Cox proportional hazard model.
To verify the robustness of the model, two sensitivity analyses were performed. First, we performed identical analysis after the subjects from one of the participating hospitals were randomly removed; the adjusted HR from this new cohort for lactic acidosis was 4.53 (95% CI, 1.41–14.59; p = 0.011) and the adjusted HR for acidosis was 2.59 (95% CI, 1.04–6.47; p = 0.042). In the second sensitivity analysis, we randomly removed the data from another participating hospital before analysis, and the higher risk of lactic acidosis (adjusted HR, 4.71; 95% CI, 1.46–15.17; p = 0.009) and acidosis (adjusted HR, 2.50; 95% CI, 1.10–5.67; p = 0.029) was maintained in the metformin group versus the non-metformin group.
Kernel density measurements across the entire cohort or the sub-groups in each cohort based on the severity of COVID-19 (mild and severe) were performed using Gaussian kernels and showed that there were remarkably more individuals who had a higher level of lactic acid as well as a lower blood pH among the metformin users than that in the non-metformin users, particularly in individuals with severe COVID-19 (Figure S1).
To further evaluate this effect based on a similar baseline status between the two groups at admission, we conducted a propensity score-matching (PSM) analysis. In this model, the imbalanced baseline characters, including age, sex, major comorbidities (hypertension, coronary artery disease, cerebrovascular disease, chronic liver disease, chronic kidney disease, and heart failure on admission), fever and dyspnea, vital signs (heart rate, breath, and blood pressure), oxygen saturation (SpO2) < 95%, CT lesion, increase of neutrophils, blood glucose, increase of CRP, decrease of lymphocytes, kidney function (i.e., eGFR), proportion of insulin usage, indicators of liver injury (i.e., elevation of ALT), and heart injury (i.e., elevation of cardiac troponini [cTNI]), were first balanced by PSM. In the matched cohorts (468 individuals in each group; Table S2), individuals in the metformin group and the non-metformin group received comparable treatments except for the lower incidence of antithrombotic or thrombolysis use in the metformin group (Table S3). Following mixed-effect Cox model analysis, after adjusting for age; gender; increase of CRP, aspartate transaminase (AST), urea, and creatinine; decrease of red blood cells (RBCs); and hospital site (random effect), the results also indicated that the metformin users had a higher risk of developing lactic acidosis (adjusted HR, 4.46; 95% CI, 1.11–18.00; p = 0.036) and acidosis (adjusted HR, 2.73; 95% CI, 1.04–7.13; p = 0.040) (Table 2). Harrell’s concordance indexes (C-indexes) were calculated to evaluate the prediction capability of the mixed-effect Cox model. The results indicated that the mixed-effect Cox model was fit for predicting the association between metformin use and acidosis in this study (Table S4). Taken together, these two models consistently demonstrated that metformin use was significantly associated with increased incidences of developing lactic acidosis and acidosis in individuals with COVID-19 and pre-existing T2D.
Lactic Acidosis and Acidosis in the Metformin Group Were Associated with Higher Doses, Worse Kidney Function, and Severity of COVID-19
We further analyzed the factors associated with the development of lactic acidosis and acidosis in individuals with COVID-19 and pre-existing T2D by using binary logistic regression model analysis (Table 3 ). The candidate factors included age, sex, the dosage of metformin, eGFR, comorbidities on admission, and baseline characteristics. The results indicated that metformin use at 2 ≤ dose < 3 g/day was significantly associated with an increased incidence of developing lactic acidosis (OR, 22.57; 95% CI, 1.99–256.71; p = 0.012) and acidosis (OR, 12.79; 95% CI, 1.24–132.14; p = 0.032), while neither low-dose (<1 g/day) nor moderate-dose (1 ≤ dose < 2 g/day) metformin use was significantly associated with the acidosis and lactic acidosis. Furthermore, insufficient kidney function, particularly eGRF < 60mL/min/1.73 m2, was also associated with a higher risk of developing lactic acidosis (OR, 3.94; 95% CI, 1.05–14.76; p = 0.042) and acidosis (OR, 5.21; 95% CI, 1.83–14.81; p = 0.002). Further subgroup analysis in individuals with an eGFR > 60 mL/min/1.73 m2 indicated that the incidences of acidosis were similar between the metformin and the non-metformin groups (Table S5). These results indicated that metformin use was not associated with acidosis in individuals with better renal function. We also noticed that the percentage of individuals with impaired renal function in the metformin group was significantly lower than that in the non-metformin group (7.82% versus 11.78%, p = 0.026). The indicators for the severity of COVID-19, including SpO2 < 93% (National Health Commission of China 2020; World Health Organization, 2020; Zhang et al., 2020) and neutrophil-to-lymphocyte ratio (NLR) > 3.13 (Liu et al., 2020), were also found to be associated with the onset of lactic acidosis and acidosis in individuals with COVID-19 and pre-existing T2D. Further investigation indicated that no acidosis associated with metformin use was found in individuals with mild COVID-19 (Table S6). Taken together, these findings suggest that using metformin in individuals with severe COVID-19 should be accompanied by carefully monitoring acidosis and kidney function.
Table 3.
Clinical Factors Associated with Acidosis and Lactic Acidosis in Individuals before PSM
| Parameters | Acidosis |
Lactic Acidosis |
||
|---|---|---|---|---|
| OR (95% CI) | p Valuea | OR (95% CI) | p Valuea | |
| Age | 0.97 (0.92,1.01) | 0.156 | 1.00 (0.94,1.06) | 0.957 |
| Male | 1.19 (0.53,2.68) | 0.675 | 1.35 (0.47,3.91) | 0.579 |
| Metformin Dose | ||||
| Dose < 1 g/day | 3.79 (0.91,15.75) | 0.067 | 4.93 (0.84,29.04) | 0.078 |
| 1 ≤ dose < 2 g/day | 1.84 (0.75,4.56) | 0.186 | 2.07 (0.62,6.95) | 0.239 |
| 2 ≤ dose < 3 g/day | 12.79 (1.24,132.14) | 0.032 | 22.57 (1.99,256.71) | 0.012 |
| eGFR at Admission | ||||
| >90 mL/min/1.73 m2 | ||||
| 60 ≤ eGFR < 90 mL/min/1.73 m2 | 0.90 (0.29,2.73) | 0.846 | 1.09 (0.29,4.16) | 0.895 |
| <60 mL/min/1.73 m2 | 5.21 (1.83,14.81) | 0.002 | 3.94 (1.05,14.76) | 0.042 |
| Comorbidities on Admission | ||||
| Chronic obstructive pulmonary disease | 4.87 (0.35,66.94) | 0.237 | – | – |
| Coronary heart disease | 1.11 (0.35,3.55) | 0.861 | 1.53 (0.39,5.98) | 0.537 |
| Cerebrovascular diseases | 1.34 (0.17,10.68) | 0.782 | 2.19 (0.26,18.28) | 0.469 |
| NLR > 3.13 | 5.49 (1.98,15.21) | 0.001 | 4.67 (1.15,18.94) | 0.031 |
| ACEI/ARB | 0.55 (0.16,1.93) | 0.352 | 0.49 (0.10,2.28) | 0.361 |
| SpO2 < 93% | 2.64 (1.04,6.67) | 0.041 | 3.12 (1.01,9.60) | 0.047 |
| AST increase | 0.65 (0.21,2.00) | 0.453 | 0.43 (0.09,2.10) | 0.297 |
| Procalcitonin increase | 0.24 (0.10,0.62) | 0.003 | 0.62 (0.21,1.82) | 0.388 |
OR, odds ratio; CI, confidence interval; eGFR, estimated glomerular filtration rate; NLR, neutrophil-to-lymphocyte ratio; ACEI, angiotensin-converting enzyme inhibitor; ARB, angiotensin II receptor blocker; SpO2, oxygen saturation; AST, aspartate aminotransferase.
The p values were calculated based on logistic model.
The 28-Day All-Cause Mortality Rate Is Similar between the Metformin and the Non-metformin Groups
Next, we investigated whether higher incidences of developing lactic acidosis and acidosis in the metformin group would translate into worse adverse outcomes in individuals with COVID-19 and pre-existing T2D. We first noticed that there was no difference between the durations of hospitalization in the metformin and the non-metformin users (21 days versus 21 days, p = 0.687), although individuals with acidosis did have non-significantly longer hospitalization than those without acidosis (26 days versus 21 days, p = 0.213). In the Cox regression model with time-varying exposure, there was no significant difference in the mortalities of individuals between the metformin and the non-metformin groups (adjusted HR, 0.87; 95% CI, 0.36–2.12; p = 0.757) (Table 4 ). Notably, comorbidities as well as other potential covariables, including blood glucose, at hospital admission were adjusted in the analysis. Meanwhile, secondary endpoints, including acute respiratory distress syndrome (ARDS), disseminated intravascular coagulation (DIC), heart failure, acute kidney injury, and acute heart injury, were also analyzed. We found that the incidence of heart failure was significantly lower in the metformin group compared to the non-metformin group (adjusted HR, 0.61; 95% CI, 0.43–0.87; p = 0.006) (Table 4). The incidence of ARDS was also significantly lower in the metformin group compared to the non-metformin groups (adjusted HR, 0.66; 95% CI, 0.46–0.96; p = 0.028) (Table 4). Notably, Schoenfeld’s global test validated that the time-varying Cox models were consistent and fit for evaluating the outcomes in this study (Table S1). In this model, we also calculated the joint effect of metformin use on acute extra-pulmonary organ injury, including acute heart injury, acute kidney injury, and DIC. Consistent with the results calculated separately, metformin use was not associated with the outcome of acute extra-pulmonary organ injury (Table S7).
Table 4.
Hazard Ratios for Mortality and Second Outcomes between Individuals in the Metformin and the Non-metformin Groups
| Metformin versus Non-metformin | Time-Varying Cox Model Exposure before PSM |
Hazard in All Groups after PSM |
||
|---|---|---|---|---|
| Adjusted HRa (95% CI) | p Valueb | Adjusted HRc (95% CI) | p Valued | |
| Mortality | 0.87 (0.36,2.12) | 0.757 | 1.65 (0.71,3.86) | 0.247 |
| ARDS | 0.66 (0.46,0.96) | 0.028 | 0.85 (0.61,1.17) | 0.317 |
| DIC | 0.44 (0.05,4.00) | 0.467 | 1.68 (0.26,10.90) | 0.586 |
| Heart failure | 0.61 (0.43,0.87) | 0.006 | 0.59 (0.41,0.83) | 0.003 |
| Acute kidney injury | 0.71 (0.18,2.79) | 0.627 | 0.65 (0.19,2.24) | 0.491 |
| Acute heart injury | 1.14 (0.73,1.79) | 0.559 | 1.02 (0.62,1.66) | 0.947 |
HR, hazard ratio; CI, confidence interval; ARDS, acute respiratory distress syndrome; DIC, disseminated intravascular coagulation.
In the time-varying Cox model, adjusted variables for comparison between the metformin and the non-metformin cohorts included age, gender, comorbidities (cerebrovascular disease and coronary heart disease), blood glucose, C-reactive protein, estimated glomerular filtration rate, alanine aminotransferase, and creatinine.
The p values were calculated based on time-varying Cox model.
In the mixed-effect Cox proportional hazard model, adjusted variables for comparison between the metformin and the non-metformin cohorts included age, gender, C-reactive protein, aspartate aminotransferase, urea, red blood cell, creatinine, and hospital site as a random effect.
The p values were calculated based on mixed-effect Cox proportional hazard model.
To further validate these findings, a mixed-effect Cox model analysis following PSM analysis after balancing baseline clinical characteristics (including blood glucose) was applied. Again, this model found comparable mortalities between the metformin and the non-metformin groups (adjusted HR, 1.65; 95% CI, 0.71–3.86; p = 0.247), but revealed significantly lower incidence of heart failure in the metformin group (adjusted HR, 0.59; 95% CI, 0.41–0.83; p = 0.003) compared to the non-metformin group (Table 4), which was confirmed by sensitivity analyses. The validity of this model in predicting the association between metformin use and outcomes was also reflected by calculating C-indexes (Table S4). Altogether, these findings indicated that metformin use was not associated with increased mortality but with decreased incidence of developing heart failure in individuals with COVID-19 and pre-existing T2D.
This finding is in agreement with a Korean population-based cohort study, which also showed no significant association was indicated between metformin therapy and 30-day mortality in individuals with ARDS and pre-existing diabetes (Oh and Song, 2020). In an earlier study in a cohort from Israel consisting of individuals diagnosed with septic shock and severe lactic acidosis, the mortality rate was significantly lower in those receiving metformin treatment (Doenyas-Barak et al., 2016). One recent retrospective study with a limited number of cases (n = 283) also showed that metformin treatment was associated with decreased mortality in individuals with COVID-19 and diabetes, although without excluding individuals who received only insulin as a glucose-lowering agent in the non-metformin group the conclusions may have been biased (Luo et al., 2020).
The Association of Metformin Use with Lactic Acidosis and Acidosis Is Mainly in Individuals with T2D and Severe COVID-19
Diabetic individuals with a different severity of COVID-19 may have a different reaction to metformin treatment. To further delineate the effect of metformin use on developing acidosis, mortality, and acute organ injuries, individuals with COVID-19 and pre-existing T2D were analyzed in subgroups according to the severity of COVID-19 symptoms at baseline. The baseline characteristics for the mild and severe COVID-19 subgroups are shown in Table S8. In individuals with mild COVID-19, there were no cases of lactic acidosis and acidosis reported in either the metformin group or the non-metformin group. In individuals with severe COVID-19, the Cox regression model with time-varying exposure indicated that the incidences of both lactic acidosis (adjusted HR, 4.97; 95% CI, 1.66–14.92; p = 0.004) and acidosis (adjusted HR, 2.67; 95% CI, 1.20–5.94; p = 0.016) were significantly higher in the metformin group than in the non-metformin group (Table S9). These findings were further evaluated by balancing the baseline characteristics using PSM (Table S9) in both mild and severe groups. The characteristics and treatment records for the mild and the severe COVID-19 subgroups after PSM are shown in Tables S10 and S11, respectively. The following mixed-effect Cox model analysis also indicated that the metformin users had a higher risk of developing lactic acidosis (adjusted HR, 5.65; 95% CI, 1.06–30.10; p = 0.042) and acidosis (adjusted HR, 3.82; 95% CI, 1.27,11.50; p = 0.017) in individuals with severe COVID-19 (Table S9). While no patient with mild COVID-19 died during the 28-day observation, the degree of mortality of individuals with diabetes and severe COVID-19 was comparable between the metformin and the non-metformin groups using either the Cox regression model with time-varying exposure or mixed-effect Cox model following PSM analysis (Table S9). Notably, the lower incidence of heart failure was consistently observed in the metformin group compared to the non-metformin group by either statistical approach (Table S9). These results suggest that the acidosis-promoting effect of metformin may have been compensated by its protective effects in the heart (Foretz et al., 2014; Ursini et al., 2018) in individuals with COVID-19 and pre-existing T2D, even in severe COVID-19 cases.
Indicators of Heart Failure and Inflammation Are Lower in Individuals with COVID-19 and Pre-existing T2D in the Metformin Group versus the Non-metformin Group
The above analysis demonstrated that metformin use was associated with an increased incidence of developing acidosis, but not mortality, in individuals with COVID-19 and pre-existing T2D, particularly in individuals with severe COVID-19 symptoms. Accumulating evidence indicates that many individuals with severe COVID-19 exhibit cytokine storm syndrome. Therefore, it has been proposed to identify and test currently approved therapies with proven safety profiles to reduce hyper-inflammation in COVID-19 (Mehta et al., 2020). Metformin was originally derived from Galega officinalis and is believed to have bacteriostatic, antiviral, antimalarial, antipyretic, and analgesic properties (Amin et al., 2019). Currently, the pleiotropic actions of metformin in humans have been extensively documented, spanning from its well-established role in T2D treatment to cardio- and nephro-protection, as well as antiproliferative, antifbrotic, antioxidant, immune-modulatory, and antiaging effects (Ursini et al., 2018). Metformin has also been reported for its beneficial action on hepatitis C virus infections by ameliorating insulin resistance in the infected subjects (Tsai et al., 2017).
We therefore further explored the potential mechanisms underlying the paradox that metformin treatment is associated with increased acidosis, but not mortality, in individuals with COVID-19 and pre-existing T2D by delineating the dynamic profiles of indicators of cardiac injury and heart failure and inflammatory factors. Some indicators without uniform normal ranges among different sites were normalized with the corresponding upper limits of normal ranges (ULNs) according to the specific criteria set in each hospital (Table S12). These parameters were tracked from day 1 after admission to day 28 and plotted by using a locally weighted scatterplot smoothing (Loess) model (Figure 2 ). We found that the indicators for cardiac injury (CK-MB) and heart failure (B type natriuretic peptide [BNP] and N-terminal pro BNP [NTproBNP]) were consistently and markedly lower in the metformin group compared to the non-metformin group during the 28-day observation period (Figures 2A and 2B). Subgroup analysis showed that the reduction of these indicators was more evident in individuals with severe COVID-19. Metformin users also had a lower level of neutrophil counts, but a higher level of lymphocyte counts in the blood, particularly in individuals with severe COVID-19 status, compared to the nonusers (Figures 3A and 3B). Meanwhile, the dynamic trajectories of serum inflammatory factors, including CRP, interleukin-6 (IL-6), interleukin-2 (IL-2), and tumor necrosis factor-alpha (TNF-α), all showed lower degrees of elevation in the metformin group than the non-metformin group, particularly in the subgroup of individuals with severe COVID-19 (Figures 3C–3F).
Figure 2.

The Dynamic Profile of Cardiac Function in the Metformin and the Non-metformin Groups
Smooth trajectories of the relative levels of CK-MB (A) and NT-proBNP (B) in the metformin and the non-metformin groups, with 95% confidence interval represented by shaded regions. The relative levels of those parameters of each participant during the follow-up duration were applied and were normalized according to the upper limits of normal range in each hospital. The dotted line represents the upper limit or lower limit of the normal value of the corresponding indicator.
Figure 3.

The Dynamic Profile of Inflammatory Response Indicators in the Metformin and the Non-metformin Groups
(A and B) Smooth trajectories of the relative levels of neutrophil count (A) and leukocyte count (B) of the routine blood tests of the metformin and the non-metformin groups.
(C–F) Smooth trajectories of the relative levels of serum CRP (C), IL-6 (D), IL-2 (E), and TNF-α (F) in the metformin and the non-metformin groups. In all panels, the shaded regions represent 95% confidence interval and the relative levels of those parameters of each participant during the follow-up duration were applied and were normalized according to their upper limits of the normal range in each hospital. The dotted line represents the upper limit or lower limit of the normal value of the corresponding indicator.
This result is in good agreement with numerous previous reports demonstrating that metformin can modulate the immune response and restore immune homeostasis in T cells, B cells, monocytes, macrophages, and neutrophils via AMPK-dependent mechanisms (Pollak, 2017; Tomczynska et al., 2016; Ursini et al., 2018). The immune-modulatory property of metformin may also partially account for the cardioprotective function in addition to its impact on metabolic activity and energy utilization (Cameron et al., 2016; Tzanavari et al., 2016). Extensive studies have demonstrated that metformin can improve myocardial energy homeostasis by activating the AMPK pathway and improving lipid and glucose utilization in failing hearts (Dziubak et al., 2018). Indeed, the association of metformin use and reduced incidences of heart failure in the COVID-19 individuals with pre-existing T2D was consistently demonstrated by both the Cox regression model with time-varying exposure and mixed-effect Cox regression model following PSM.
The potential effect of metformin on ACE2 expression may also offer additional protection against COVID-19. Metformin activates AMPK, which phosphorylates ACE2 protein on its Ser-680 residue and decreases its ubiquitination and degradation (Zhang et al., 2018a). The protective function of ACE2 on the cardiopulmonary system has been well established (Imai et al., 2005; Monteil et al., 2020; Zhang et al., 2018a). Meanwhile, post-translational modifications on ACE2 may also lead to conformation changes that diminish the binding of SARS-CoV-2 to the cell surface. Overall, these known potential beneficial effects of metformin may underlie the paradox that increased acidosis did not translate into higher mortality in metformin-treated individuals compared to individuals treated with other anti-diabetic drugs among individuals with COVID-19 and pre-existing T2D.
Conclusions
In conclusion, metformin use is associated with increased incidence of acidosis, but not mortality, in individuals with COVID-19 and pre-existing T2D. The association between metformin use and acidosis is significantly correlated with the high dose of metformin, lower kidney function, and severity of COVID-19. Our findings provide clinical evidence in support of continuing metformin use in individuals with COVID-19 and pre-existing T2D, but such patients with severe COVID-19 should be monitored closely for the development of lactic acidosis, acidosis, and decreased kidney function. Our findings also suggest that the dose of metformin administration might be critical to avoid the development of acidosis, while metformin use in individuals with impaired kidney function should be careful considered in the setting of COVID-19.
Limitations of Study
This retrospective study has several limitations. First, all data were collected from the individuals admitted in hospitals in Hubei Province, China. Hence, the impact of metformin use on the prognosis of COVID-19 individuals with pre-existing T2D might be different in the outpatient setting or geographically or ethnically diverse cohorts. Second, the pre-hospitalization medication was not available under the urgent circumstance of the COVID-19 pandemic. Therefore, the impact of prehospital medications on the outcomes of the individuals could not be analyzed. Third, higher baseline blood glucose in the metformin group may have a confounding effect in analyzing the association between metformin use and clinical outcomes. However, we adjusted for the baseline blood glucose concentration as well as other confounding variables in the Cox regression model with time-varying exposure and balanced the difference in blood glucose along with other major confounding variables by applying PSM before the mixed-effect Cox analysis. These integrated analyzing strategies should maximally, although not completely, abolish the confounding effect of blood glucose in analyzing the association between metformin use and clinical outcomes. Fourth, due to the retrospective nature of the study, we could not determine the definitive causal effect between metformin use and the outcomes of the individuals in this study. Rather, randomized prospective studies will be needed in geographically and ethnically diverse cohorts to confirm the association between metformin use and the progression of COVID-19 in individuals with pre-existing T2D.
STAR★Methods
Key Resources Table
Resource Availability
Lead Contact
Requests for additional information, resources and reagents should be directed to the Lead Contact, Hongliang Li (lihl@whu.edu.cn).
Materials Availability
No new reagents or materials were generated in this study.
Data and Code Availability
Data related to this study is available from the lead corresponding author upon request. An email address will be provided for communicating with the research team once data sharing is approved. The request should include a proposal containing detailed aims, study plan, and other information and materials. It will be evaluated to ensure the scientific rationality of the request and the security of the data. The data related any specific patient can be shared only after internal review and approval of the submitted proposal and any related requested materials by an institutional committee. Under no circumstances will information and data with patient names and other identifiers will be shared.
Method Details
Participating Cohort
This retrospective cohort study was multi-centered and the study subjects included individuals with confirmed COVID-19 admitted to 16 hospitals from Hubei, China, between December 30th, 2019 and April 13th, 2020. The final date of follow up was April 16th, 2020. The study design and protocol were approved by the Institutional Ethics Committee of the central Institution as well as each of the institutional ethics boards of the participating hospitals. As this retrospective study only involved analysis of existing data without alteration of individuals’ intervention or welfare, the informed consent was waived by the ethics boards of the hospitals.
There were 2,563 individuals diagnosed with T2D out of 15,451 individuals with confirmed COVID-19. Individuals who were younger than 18 or older than 80 years or had incomplete medical records (e.g., transfer to any other hospital), or death from other acute lethal conditions (e.g., acute myocardial infarction, acute coronary syndrome, acute pulmonary embolism, or acute stroke), decompensated or end-stage of chronic organ dysfunctions (e.g., decompensated cirrhosis, decompensated chronic renal insufficiency or eGFR less than 30 mL/min/1.73 m2), pregnancy, prehospital ketoacidosis or hyperosmolar coma were excluded. Finally, there were 1,213 individuals entered statistical analysis.
Data Processing
The medical records from the participating cohort were processed and analyzed by a highly integrated research team composed of physicians, data scientists and statisticians, after deidentification to remove and replace all personal information (e.g., name and ID) of the participants using a coding system. All information related to the baseline characteristics, epidemiological records, symptoms, clinical manifestations, radiographic features from CT, laboratory findings, treatments, life-supporting interventions and clinical outcomes during the hospitalization were collected. The laboratory data included a routine blood test, fasting blood glucose, 2 h postprandial blood glucose (2 hPG), procalcitonin, CRP, D-dimer, lipid profiles, arterial blood gas analysis, serum electrolytes, serum indicators for acidosis, cardiac injury, liver injury, and kidney injury as well as serum inflammation mediators including IL-2, IL-6 and TNF-a. The heterogeneity in the clinical data from different hospitals was further systemically streamlined, mined and analyzed. All data were reviewed, interpreted and double-checked by the experienced physician team to guarantee the accuracy.
Diagnosis and Definition of Clinical Status
Diagnosis of COVID-19 was based on chest CT manifestations and/or reverse transcription-polymerase chain reaction (RT-PCR) according to the criteria of the New Coronavirus Pneumonia Prevention and Control Program (5th edition) issued by the National Health Commission of China and WHO interim guidance (National Health Commission of China, 2020; World Health Organization, 2020). Disease onset was defined when the first symptom of COVID-19 appeared. During hospitalization, individuals with fever or suspected respiratory infection, plus one of the following clinical manifestations including respiratory rate > 30 breaths/min, severe respiratory distress, SpO2 < 93% or PaO2/FiO2 ≤ 300 mmHg on room air were classified as severe cases (National Health Commission of China, 2020; World Health Organization, 2020). T2D was diagnosed according to the patient’s medical history and guideline for the prevention and control of T2D in China (2017) (Chinese Diabetes Society, 2018). Metformin use was defined as at least three days of continuous Metformin administration during the 28-day observation. Non-metformin use was defined as no Metformin had ever been administered during the 28-day observation.
ARDS was defined according to WHO interim guideline for “clinical management of severe acute respiratory infection when novel coronavirus (2019-nCoV) infection is suspected.” The cardiac injury was defined when the serum level of biomarkers indicating cardiac injury, i.e., cTNI, cardiac troponin T (cTNT), or high sensitivity cTNI (hs-cTNI), were above the upper limit of normal (ULN) (Huang et al., 2020; Yancy et al., 2017). Acute kidney injury was defined if the value of the serum creatinine level became ≥ 26.5 μmmol/L in 48 h (Kellum et al., 2012). DIC was defined according to the criteria of the International Society on Thrombosis and Hemostasis (ISTH) (Gando et al., 2013). Metabolic acidosis was defined as a blood pH < 7.35 and a decrease in plasma bicarbonate concentration (HCO3−) < 22 mmol/L (Kraut and Madias, 2010). Lactic acidosis was defined as acidosis (PH < 7.35) and Lactate levels > 5 mmol/L (Lalau, 2010; Lexis et al., 2014). Heart failure was defined when serum BNP or NTProBNP were above the ULNs according to 2017 ACC/AHA/HFSA Guideline for the Management of Heart Failure (Yancy et al., 2017). The primary endpoint of the study was 28-day all-cause death. The secondary endpoints included the occurrences of lactic acidosis, acidosis, ARDS, acute cardiac injury, acute kidney injury, heart failure, or DIC.
Analyzing the Association of Metformin Therapy and Clinical Outcomes
In current study, two independent statistical models were used to evaluate the association of metformin exposure and outcomes including 28-day mortality, lactic acidosis, acidosis, ARDS, acute cardiac injury, acute kidney injury, heart failure or DIC. One approach was Cox proportional hazards regression model based on the entire cohorts accounting for time-varying exposure that adjusted for baseline differences and accounted for immortal time bias (metformin therapy as a time-varying exposure); The other model was mixed effect Cox proportional hazards regression model after PSM for baseline characteristics, but without considering immortal time bias. The hospital site was considered as a random effect in the mixed-effect Cox model.
Cox Regression Model with Time-Varying Exposure
Metformin therapy may be delayed or discontinued in individuals with progressive conditions. The primary and secondary outcomes occurred before the use of metformin should not be considered as the endpoints associated with metformin application (Stricker and Stijnen, 2010). Therefore, we introduced Cox proportional hazards regression model with time-varying exposure using samples in the entire cohorts in the analysis. Based on the medication histories, metformin exposure status was defined every day during the follow-up until the outcomes (i.e., mortality, lactic acidosis, acidosis, ARDS, acute cardiac injury, acute kidney injury, heart failure or DIC) appeared. This strategy allowed us to determine the time from hospital admission to initiation of metformin and the time from stopping metformin administration to appearing of the outcomes, which contributed to the untreated follow-up time in statistical analysis (Bowker et al., 2010; Shirani et al., 2012). In each event time, there was a risk set that contains all cohort members under observation with an exposure status (exposed or unexposed). Besides, potential confounding variables at baseline were adjusted, which included pre-existing coronary heart disease and cerebrovascular disease, increase of CRP, ALT and serum creatine levels, blood glucose, and eGFR. Identical confounders were adjusted when analyzing the association of metformin therapy and clinical outcomes in the full T2D cohort, mild cohort and severe cohort. Adjusted hazard ratios (aHRs) with 95% confidence intervals were calculated. Schoenfeld’s global test was performed to validate the validity of the models (Zhang et al., 2018b).
Sensitivity Analysis
Sensitivity analyses were conducted related to the Cox regression model with time-varying exposure. To account for the possible variation by hospital site, we subclustered hospitals and performed time-varying Cox analysis with adjusted confounders. To evaluate the potential impact of unmeasured confounders to the conclusion derived from Cox regression model with time-varying exposure, the robustness of the association between metformin use and 28-day outcomes was evaluated by analyzing E-value (Haneuse et al., 2019; Mathur et al., 2018; VanderWeele and Ding, 2017).
Propensity Score-Matched Analysis
The PSM method was applied to balance the variables potentially confounding the association between metformin use and the outcomes in the study cohort (Waljee et al., 2013). The PSM cohorts were identified by balancing the age, sex, fever and dyspnea, vital signs (heart rate, breath and blood pressure), SpO2 < 95%, CT lesion, increase of neutrophils, blood glucose, increase of CRP, decrease of lymphocytes, kidney function (i.e., eGFR), proportion of insulin usage, indicators of liver injury (i.e., elevation of ALT) and heart injury (i.e., elevation of cTNI). The comorbidities (hypertension, coronary artery disease, cerebrovascular disease, chronic liver disease, chronic kidney disease and heart failure on admission) were also balanced in the matched Metformin and Non-metformin cohorts. The propensity score was estimated using multivariable logistic regression model to predict the probability of Metformin use contributed by the above variables. The logistic regression model was diagnosed by inspecting influential values and calculating multicollinearity. The matching ratio was at 1:1 for the Metformin group versus the Non-metformin group. For all matching pairs, a caliper size of 0.05 was applied according to the propensity scores. The balance between covariates was evaluated by estimating the standardized differences before and after matching. Only those with absolute value < 0.1 were considered as qualified matching.
The Mixed-effect Cox model based on PSM cohorts was used to analyze the risk for composite endpoints. Residual imbalanced variates were further adjusted in the mixed effect Cox proportional hazards regression model. The incidence of increased creatine, AST, CRP, urea and decrease in RBC count were the remaining difference in the Metformin group and Non-metformin group in all T2D individuals; The incidence of increased creatine and urea were post-PSM difference in the Metformin group and Non-metformin group in the mild individuals; and, in the severe cases, we further adjusted incidence of increased AST, CRP, urea, creatine kinase (CK), procalcitonin and decrease in RBC count, platelet count and eGFR. The hospital site was considered as a random effect in the mixed-effect Cox model. Furthermore, Harrell’s concordance indexes (C-indexes) were calculated to evaluate the prediction capability of the mixed-effect Cox model (Harrell et al., 1982). Two sensitivity analyses were performed to evaluate the robustness of propensity score-matched cohort analyses. In the first sensitivity analysis, the optimal caliper was set to 0.04, while in the second sensitivity analysis cerebrovascular disease was not included in matching.
A Binary Logistic Regression Model
A binary logistic regression model was applied to evaluate the association of baseline characteristics (age, gender, neutrophil to lymphocyte ratio, AST, eGFR, procalcitonin, SpO2 < 93%, pre-existing chronic obstructive pulmonary disease (COPD), coronary heart disease and cerebrovascular disease and use of ACE inhibitors (ACEI) or angiotensin receptor blockers (ARBs) or the dose of metformin used before lactic acidosis or metabolic acidosis with the lactic acidosis or metabolic acidosis in the longitudinal cohort. The parallel lines assumption of the model was also tested and met. The p values were 2-sided, and an alpha level of 0.05 was used to define statistical significance.
Statistical Analysis
R-3.6.3 (R Foundation for Statistical Computing, Vienna, Austria) and SPSS Statistics (version 23.0, IBM, Armonk, NY, USA) software were used to perform all statistical analysis. Data were presented as median and interquartile range (IQR) for continuous variables or as frequency rates and percentage (%) for categorical variables. Student’s t tests (normally distributed) or Mann-Whitney U test (nonnormally distributed) were used for comparison of continuous variables between 2 groups. Fisher’s exact test or χ2 test were used to analyze the comparison of categorical variables. Dynamic changes of factors related to acute cardiac injury, immunoregulation and inflammation in the metformin and the non-metformin groups from day 1 to day 28 after admission were depicted using locally weighted scatterplot smoothing (LOESS) model. Statistical difference was accepted only if a difference with a two-side α was less than 0.05.
Acknowledgments
This work was supported by grants from the National Key R&D Program of China (2016YFF0101504 to Z.-G.S. and 2019YFC2004700 to L.Z.), the Special Foundation for Emergency Research on Prevention and Control of COVID-19 of Guangdong Province (2020B1111330003), the National Science Foundation of China (81630011 to Hongliang Li, 81970364 to Z.-G.S., 81970070 to X.-J.Z., 81970011 to P.Z., and 81870171 to J.C.), the Major Research Plan of the National Natural Science Foundation of China (91639304 to Hongliang Li), the Hubei Science and Technology Support Project (2019BFC582, 2018BEC473, and 2017BEC001 to Hongliang Li), and Medical Flight Plan of Wuhan University.
Author Contributions
X.C., Y.-M.L., Haomiao Li, X.Z., and F.L. designed the study, collected and analyzed data, and wrote the manuscript. Z.C., K.-Q.D., L.L., M.-M.C., X.S., M.X., Xuewei Huang, W.L., P.Z., P.Y., W.M., Xiaodong Huang, J.X., B.-H.Z., J.G., L.Z., and Z.L. collected, reviewed, interpreted, and checked clinical, laboratory, and radiological data. J.-J.Q. and F.Z. performed the statistical analysis. J.C., X.-J.Z., Y.W., X.M., Q.X., X.Z., and J.Y. wrote and edited the manuscript and provided valuable suggestions for study design and data analysis. Y.Y., X.W., Z.-G.S., Y.-X.J., and Hongliang Li contributed equally, designed the project, edited manuscript, and supervised the study. All authors have approved the final version of this paper.
Declaration of Interests
We have no competing interests to declare.
Published: August 20, 2020
Footnotes
Supplemental Information can be found online at https://doi.org/10.1016/j.cmet.2020.08.013.
Supplemental Information
References
- American Diabetes Association 9. Pharmacologic approaches to glycemic treatment: standards of medical care in diabetes-2019. Diabetes Care. 2019;42(Suppl 1):S90–S102. doi: 10.2337/dc19-S009. [DOI] [PubMed] [Google Scholar]
- Amin S., Lux A., O’Callaghan F. The journey of metformin from glycaemic control to mTOR inhibition and the suppression of tumour growth. Br. J. Clin. Pharmacol. 2019;85:37–46. doi: 10.1111/bcp.13780. [DOI] [PMC free article] [PubMed] [Google Scholar]
- Bailey C.J. Metformin: historical overview. Diabetologia. 2017;60:1566–1576. doi: 10.1007/s00125-017-4318-z. [DOI] [PubMed] [Google Scholar]
- Bakker J., Coffernils M., Leon M., Gris P., Vincent J.L. Blood lactate levels are superior to oxygen-derived variables in predicting outcome in human septic shock. Chest. 1991;99:956–962. doi: 10.1378/chest.99.4.956. [DOI] [PubMed] [Google Scholar]
- Bodmer M., Meier C., Krähenbühl S., Jick S.S., Meier C.R. Metformin, sulfonylureas, or other antidiabetes drugs and the risk of lactic acidosis or hypoglycemia: a nested case-control analysis. Diabetes Care. 2008;31:2086–2091. doi: 10.2337/dc08-1171. [DOI] [PMC free article] [PubMed] [Google Scholar]
- Bornstein S.R., Rubino F., Khunti K., Mingrone G., Hopkins D., Birkenfeld A.L., Boehm B., Amiel S., Holt R.I., Skyler J.S. Practical recommendations for the management of diabetes in patients with COVID-19. Lancet Diabetes Endocrinol. 2020;8:546–550. doi: 10.1016/S2213-8587(20)30152-2. [DOI] [PMC free article] [PubMed] [Google Scholar]
- Bowker S.L., Yasui Y., Veugelers P., Johnson J.A. Glucose-lowering agents and cancer mortality rates in type 2 diabetes: assessing effects of time-varying exposure. Diabetologia. 2010;53:1631–1637. doi: 10.1007/s00125-010-1750-8. [DOI] [PubMed] [Google Scholar]
- Cameron A.R., Morrison V.L., Levin D., Mohan M., Forteath C., Beall C., McNeilly A.D., Balfour D.J., Savinko T., Wong A.K. Anti-inflammatory effects of metformin irrespective of diabetes status. Circ. Res. 2016;119:652–665. doi: 10.1161/CIRCRESAHA.116.308445. [DOI] [PMC free article] [PubMed] [Google Scholar]
- Chinese Diabetes Society Guidelines for the prevention and control of type 2 diabetes in China (2017 Edition) Zhongguo Shiyong Neike Zazhi. 2018;38:53. [Google Scholar]
- Doenyas-Barak K., Beberashvili I., Marcus R., Efrati S. Lactic acidosis and severe septic shock in metformin users: a cohort study. Crit. Care. 2016;20:10. doi: 10.1186/s13054-015-1180-6. [DOI] [PMC free article] [PubMed] [Google Scholar]
- Dziubak A., Wójcicka G., Wojtak A., Bełtowski J. Metabolic effects of metformin in the failing heart. Int. J. Mol. Sci. 2018;19:E2869. doi: 10.3390/ijms19102869. [DOI] [PMC free article] [PubMed] [Google Scholar]
- Foretz M., Guigas B., Bertrand L., Pollak M., Viollet B. Metformin: from mechanisms of action to therapies. Cell Metab. 2014;20:953–966. doi: 10.1016/j.cmet.2014.09.018. [DOI] [PubMed] [Google Scholar]
- Gando S., Wada H., Thachil J., Scientific and Standardization Committee on DIC of the International Society on Thrombosis and Haemostasis (ISTH) Differentiating disseminated intravascular coagulation (DIC) with the fibrinolytic phenotype from coagulopathy of trauma and acute coagulopathy of trauma-shock (COT/ACOTS) J. Thromb. Haemost. 2013;11:826–835. doi: 10.1111/jth.12190. [DOI] [PubMed] [Google Scholar]
- Haneuse S., VanderWeele T.J., Arterburn D. Using the E-value to assess the potential effect of unmeasured confounding in observational studies. JAMA. 2019;321:602–603. doi: 10.1001/jama.2018.21554. [DOI] [PubMed] [Google Scholar]
- Harrell F.E., Jr., Califf R.M., Pryor D.B., Lee K.L., Rosati R.A. Evaluating the yield of medical tests. JAMA. 1982;247:2543–2546. [PubMed] [Google Scholar]
- Hoffmann M., Kleine-Weber H., Schroeder S., Krüger N., Herrler T., Erichsen S., Schiergens T.S., Herrler G., Wu N.H., Nitsche A. SARS-CoV-2 cell entry depends on ACE2 and TMPRSS2 and is blocked by a clinically proven protease inhibitor. Cell. 2020;181:271–280.e8. doi: 10.1016/j.cell.2020.02.052. [DOI] [PMC free article] [PubMed] [Google Scholar]
- Huang C., Wang Y., Li X., Ren L., Zhao J., Hu Y., Zhang L., Fan G., Xu J., Gu X. Clinical features of patients infected with 2019 novel coronavirus in Wuhan, China. Lancet. 2020;395:497–506. doi: 10.1016/S0140-6736(20)30183-5. [DOI] [PMC free article] [PubMed] [Google Scholar]
- Imai Y., Kuba K., Rao S., Huan Y., Guo F., Guan B., Yang P., Sarao R., Wada T., Leong-Poi H. Angiotensin-converting enzyme 2 protects from severe acute lung failure. Nature. 2005;436:112–116. doi: 10.1038/nature03712. [DOI] [PMC free article] [PubMed] [Google Scholar]
- Inzucchi S.E., Lipska K.J., Mayo H., Bailey C.J., McGuire D.K. Metformin in patients with type 2 diabetes and kidney disease: a systematic review. JAMA. 2014;312:2668–2675. doi: 10.1001/jama.2014.15298. [DOI] [PMC free article] [PubMed] [Google Scholar]
- Kellum J.A., Lameire N., Aspelin P., Barsoum R.S., Burdmann E.A., Goldstein S.L., Herzog C.A., Joannidis M., Kribben A., Levey A.S. Kidney disease: improving global outcomes (KDIGO) acute kidney injury work group. KDIGO clinical practice guideline for acute kidney injury. Kidney Int. Suppl. 2012;2:1–138. [Google Scholar]
- Kraut J.A., Madias N.E. Metabolic acidosis: pathophysiology, diagnosis and management. Nat. Rev. Nephrol. 2010;6:274–285. doi: 10.1038/nrneph.2010.33. [DOI] [PubMed] [Google Scholar]
- Lalau J.D. Lactic acidosis induced by metformin: incidence, management and prevention. Drug Saf. 2010;33:727–740. doi: 10.2165/11536790-000000000-00000. [DOI] [PubMed] [Google Scholar]
- Lexis C.P., van der Horst I.C., Lipsic E., Wieringa W.G., de Boer R.A., van den Heuvel A.F., van der Werf H.W., Schurer R.A., Pundziute G., Tan E.S., GIPS-III Investigators Effect of metformin on left ventricular function after acute myocardial infarction in patients without diabetes: the GIPS-III randomized clinical trial. JAMA. 2014;311:1526–1535. doi: 10.1001/jama.2014.3315. [DOI] [PubMed] [Google Scholar]
- Liu J., Liu Y., Xiang P., Pu L., Xiong H., Li C., Zhang M., Tan J., Xu Y., Song R. Neutrophil-to-lymphocyte ratio predicts critical illness patients with 2019 coronavirus disease in the early stage. J. Transl. Med. 2020;18:206. doi: 10.1186/s12967-020-02374-0. [DOI] [PMC free article] [PubMed] [Google Scholar]
- Luo P., Qiu L., Liu Y., Liu X.L., Zheng J.L., Xue H.Y., Liu W.H., Liu D., Li J. Metformin treatment was associated with decreased mortality in COVID-19 patients with diabetes in a retrospective analysis. Am. J. Trop. Med. Hyg. 2020;103:69–72. doi: 10.4269/ajtmh.20-0375. [DOI] [PMC free article] [PubMed] [Google Scholar]
- Mathur M.B., Ding P., Riddell C.A., VanderWeele T.J. Web site and R package for computing E-values. Epidemiology. 2018;29:e45–e47. doi: 10.1097/EDE.0000000000000864. [DOI] [PMC free article] [PubMed] [Google Scholar]
- Mehta P., McAuley D.F., Brown M., Sanchez E., Tattersall R.S., Manson J.J., HLH Across Speciality Collaboration, UK COVID-19: consider cytokine storm syndromes and immunosuppression. Lancet. 2020;395:1033–1034. doi: 10.1016/S0140-6736(20)30628-0. [DOI] [PMC free article] [PubMed] [Google Scholar]
- Mikkelsen M.E., Miltiades A.N., Gaieski D.F., Goyal M., Fuchs B.D., Shah C.V., Bellamy S.L., Christie J.D. Serum lactate is associated with mortality in severe sepsis independent of organ failure and shock. Crit. Care Med. 2009;37:1670–1677. doi: 10.1097/CCM.0b013e31819fcf68. [DOI] [PubMed] [Google Scholar]
- Misbin R.I., Green L., Stadel B.V., Gueriguian J.L., Gubbi A., Fleming G.A. Lactic acidosis in patients with diabetes treated with metformin. N. Engl. J. Med. 1998;338:265–266. doi: 10.1056/NEJM199801223380415. [DOI] [PubMed] [Google Scholar]
- Monteil V., Kwon H., Prado P., Hagelkrüys A., Wimmer R.A., Stahl M., Leopoldi A., Garreta E., Hurtado Del Pozo C., Prosper F. Inhibition of SARS-CoV-2 infections in engineered human tissues using clinical-grade soluble human ACE2. Cell. 2020;181:905–913.e7. doi: 10.1016/j.cell.2020.04.004. [DOI] [PMC free article] [PubMed] [Google Scholar]
- National Health Commission of China New Coronavirus Pneumonia Prevention and Control Program (National Health Commission of China) 2020. http://www.nhc.gov.cn
- Oh T.K., Song I.A. Prior metformin therapy and 30-day mortality in patients with acute respiratory distress syndrome: a nationwide cohort study. Ann. Palliat. Med. 2020;9:903–911. doi: 10.21037/apm.2020.04.25. [DOI] [PubMed] [Google Scholar]
- Overbeek J.A., Heintjes E.M., Prieto-Alhambra D., Blin P., Lassalle R., Hall G.C., Lapi F., Bianchini E., Hammar N., Bezemer I.D., Herings R.M.C. Type 2 diabetes mellitus treatment patterns across Europe: a population-based multi-database study. Clin. Ther. 2017;39:759–770. doi: 10.1016/j.clinthera.2017.02.008. [DOI] [PubMed] [Google Scholar]
- Pollak M. The effects of metformin on gut microbiota and the immune system as research frontiers. Diabetologia. 2017;60:1662–1667. doi: 10.1007/s00125-017-4352-x. [DOI] [PubMed] [Google Scholar]
- Rena G., Hardie D.G., Pearson E.R. The mechanisms of action of metformin. Diabetologia. 2017;60:1577–1585. doi: 10.1007/s00125-017-4342-z. [DOI] [PMC free article] [PubMed] [Google Scholar]
- Richardson S., Hirsch J.S., Narasimhan M., Crawford J.M., McGinn T., Davidson K.W., Barnaby D.P., Becker L.B., Chelico J.D., Cohen S.L., Northwell COVID-19 Research Consortium Presenting characteristics, comorbidities, and outcomes among 5700 patients hospitalized with COVID-19 in the New York City area. JAMA. 2020;323:2052–2059. doi: 10.1001/jama.2020.6775. [DOI] [PMC free article] [PubMed] [Google Scholar]
- Shirani A., Zhao Y., Karim M.E., Evans C., Kingwell E., van der Kop M.L., Oger J., Gustafson P., Petkau J., Tremlett H. Association between use of interferon beta and progression of disability in patients with relapsing-remitting multiple sclerosis. JAMA. 2012;308:247–256. doi: 10.1001/jama.2012.7625. [DOI] [PubMed] [Google Scholar]
- Stricker B.H., Stijnen T. Analysis of individual drug use as a time-varying determinant of exposure in prospective population-based cohort studies. Eur. J. Epidemiol. 2010;25:245–251. doi: 10.1007/s10654-010-9451-7. [DOI] [PMC free article] [PubMed] [Google Scholar]
- Suetrong B., Walley K.R. Lactic acidosis in sepsis: it’s not all anaerobic: implications for diagnosis and management. Chest. 2016;149:252–261. doi: 10.1378/chest.15-1703. [DOI] [PubMed] [Google Scholar]
- Tomczynska M., Bijak M., Saluk J. Metformin - the drug for the treatment of autoimmune diseases; a new use of a known anti-diabetic drug. Curr. Top. Med. Chem. 2016;16:2223–2230. doi: 10.2174/1568026616666160216152324. [DOI] [PubMed] [Google Scholar]
- Tsai W.L., Chang T.H., Sun W.C., Chan H.H., Wu C.C., Hsu P.I., Cheng J.S., Yu M.L. Metformin activates type I interferon signaling against HCV via activation of adenosine monophosphate-activated protein kinase. Oncotarget. 2017;8:91928–91937. doi: 10.18632/oncotarget.20248. [DOI] [PMC free article] [PubMed] [Google Scholar]
- Tzanavari T., Varela A., Theocharis S., Ninou E., Kapelouzou A., Cokkinos D.V., Kontaridis M.I., Karalis K.P. Metformin protects against infection-induced myocardial dysfunction. Metabolism. 2016;65:1447–1458. doi: 10.1016/j.metabol.2016.06.012. [DOI] [PMC free article] [PubMed] [Google Scholar]
- Ursini F., Russo E., Pellino G., D’Angelo S., Chiaravalloti A., De Sarro G., Manfredini R., De Giorgio R. Metformin and autoimmunity: a “New Deal” of an old drug. Front. Immunol. 2018;9:1236. doi: 10.3389/fimmu.2018.01236. [DOI] [PMC free article] [PubMed] [Google Scholar]
- VanderWeele T.J., Ding P. Sensitivity analysis in observational research: introducing the E-value. Ann. Intern. Med. 2017;167:268–274. doi: 10.7326/M16-2607. [DOI] [PubMed] [Google Scholar]
- Waljee A.K., Mukherjee A., Singal A.G., Zhang Y., Warren J., Balis U., Marrero J., Zhu J., Higgins P.D. Comparison of imputation methods for missing laboratory data in medicine. BMJ Open. 2013;3:e002847. doi: 10.1136/bmjopen-2013-002847. [DOI] [PMC free article] [PubMed] [Google Scholar]
- World Health Organization . World Health Organization; 2020. Laboratory testing for 2019 novel coronavirus (2019-nCoV) in suspected human cases interim guidance. [Google Scholar]
- Yancy C.W., Jessup M., Bozkurt B., Butler J., Casey D.E., Jr., Colvin M.M., Drazner M.H., Filippatos G.S., Fonarow G.C., Givertz M.M. 2017 ACC/AHA/HFSA focused update of the 2013 ACCF/AHA guideline for the management of heart failure: a report of the American College of Cardiology/American Heart Association Task Force on Clinical Practice Guidelines and the Heart Failure Society of America. Circulation. 2017;136:e137–e161. doi: 10.1161/CIR.0000000000000509. [DOI] [PubMed] [Google Scholar]
- Zhang J., Dong J., Martin M., He M., Gongol B., Marin T.L., Chen L., Shi X., Yin Y., Shang F. AMP-activated protein kinase phosphorylation of angiotensin-converting enzyme 2 in endothelium mitigates pulmonary hypertension. Am. J. Respir. Crit. Care Med. 2018;198:509–520. doi: 10.1164/rccm.201712-2570OC. [DOI] [PMC free article] [PubMed] [Google Scholar]
- Zhang Z., Reinikainen J., Adeleke K.A., Pieterse M.E., Groothuis-Oudshoorn C.G.M. Time-varying covariates and coefficients in Cox regression models. Ann. Transl. Med. 2018;6:121. doi: 10.21037/atm.2018.02.12. [DOI] [PMC free article] [PubMed] [Google Scholar]
- Zhang P., Zhu L., Cai J., Lei F., Qin J.J., Xie J., Liu Y.M., Zhao Y.C., Huang X., Lin L. Association of inpatient use of angiotensin-converting enzyme inhibitors and angiotensin II receptor blockers with mortality among patients with hypertension hospitalized with COVID-19. Circ. Res. 2020;126:1671–1681. doi: 10.1161/CIRCRESAHA.120.317134. [DOI] [PMC free article] [PubMed] [Google Scholar]
- Zhu L., She Z.G., Cheng X., Qin J.J., Zhang X.J., Cai J., Lei F., Wang H., Xie J., Wang W. Association of blood glucose control and outcomes in patients with COVID-19 and pre-existing type 2 diabetes. Cell Metab. 2020;31:1068–1077.e3. doi: 10.1016/j.cmet.2020.04.021. [DOI] [PMC free article] [PubMed] [Google Scholar]
Associated Data
This section collects any data citations, data availability statements, or supplementary materials included in this article.
Supplementary Materials
Data Availability Statement
Data related to this study is available from the lead corresponding author upon request. An email address will be provided for communicating with the research team once data sharing is approved. The request should include a proposal containing detailed aims, study plan, and other information and materials. It will be evaluated to ensure the scientific rationality of the request and the security of the data. The data related any specific patient can be shared only after internal review and approval of the submitted proposal and any related requested materials by an institutional committee. Under no circumstances will information and data with patient names and other identifiers will be shared.