Supplemental Digital Content is available in the text
Keywords: age, dyslipidemia, gender, hyperuricemia, uric acid
Abstract
This study aimed to investigate the association of serum uric acid (SUA) levels with dyslipidemia and its components and to further explore the age- and gender-specific association of SUA levels with dyslipidemia in Chinese adults.
A cross-sectional study was performed among 8642 adults who underwent health examinations. A meta-analysis covering 17 studies was conducted to confirm the results.
The prevalence of hyperuricemia and dyslipidemia was 9.25% and 20.44%, respectively. Participants with hyperuricemia had higher prevalence of dyslipidemia than those without hyperuricemia (34.42% vs 19.01%, P < .005). Compared with participants with SUA in the first quintile, the odds ratio (OR) (95% confidence interval) of dyslipidemia in the second, third, fourth, and fifth quintiles of SUA were 1.095 (0.901–1.332), 1.582 (1.315–1.904), 2.095 (1.752–2.505), and 3.212 (2.702–3.818), respectively. Subgroup analysis showed that SUA quintiles were significantly correlated with the likelihood of dyslipidemia in females aged > 50 years and in males, but not in females aged ≤50 years. The meta-analysis also showed that hyperuricemia increased the likelihood of dyslipidemia and the pooled OR for the highest uric acid level vs the lowest uric acid level was 1.84 (1.49–2.28).
SUA levels are significantly associated with dyslipidemia, and this association is impacted by age and gender.
1. Introduction
Dyslipidemia is a modifiable risk factor of cardiovascular disease, which is a leading cause of death worldwide.[1] Dyslipidemia is also closely associated with obesity, type 2 diabetes mellitus, metabolic syndrome (MetS), and nonalcoholic fatty liver disease, all of which can cause serious public health issues worldwide.[2–4] Over the past few decades, the prevalence of dyslipidemia has grown in most developing countries with the changes in lifestyle that have come with economic development.[5]
Uric acid is the final enzymatic product of purine metabolism. Increasing amounts of evidence have indicated that elevated serum uric acid (SUA) levels or hyperuricemia is significantly associated with dyslipidemia.[6] However, the results of recent studies suggesting a possible association between SUA levels and dyslipidemia remain controversial. The umbrella term “dyslipidemia” covers several kinds of diseases, including hypercholesterolemia, hypertriglyceridemia, and low high-density lipoprotein cholesterolemia (low HDL-cholesterolemia). The relationship between SUA levels and each component of dyslipidemia is still not fully clear because some studies have found that SUA levels were significantly closely correlated with triglyceride (TG) but not high-density lipoprotein cholesterol (HDL-cholesterol).[7] It is also not clear whether the relationship between SUA levels and dyslipidemia holds consistent across different genders, which merits consideration. One recent cohort study established a strong positive association between SUA levels and dyslipidemia in man but not in women participants.[8] Therefore, it does merit further study to determine more about the association between SUA levels and dyslipidemia.
In this study, we first aimed to investigate the association of SUA levels with dyslipidemia and its components and to explore the age- and gender-specific association of SUA levels with dyslipidemia in a large sample of Chinese adults. We also reviewed recently published studies that assessed the association between SUA and dyslipidemia, and conducted a meta-analysis to confirm our findings.
2. Methods
2.1. Study population
This cross-sectional study was performed among adults who underwent their health examinations at Zhenhai Lianhua Hospital during 2013. The participants were excluded if they were taking antihypertensive agents or hypoglycemic agents or lipid-lowering agents, or antihyperuricemic agents. Participants with incomplete clinical data were also excluded. Finally, 8642 participants (5948 men and 2694 women) were enrolled in this study.
Ethical permission was obtained from the Ethic Committee of the First Affiliated Hospital, College of Medicine, Zhejiang University (reference number: 2019–1502). Given the observational nature of the study, written consent was not required. Personal information was anonymized during data collection and analysis.
2.2. Data collection
The survey consisted of health interview, physical measurements, and laboratory examination. The interview was performed to collect information on demographics (age, gender) and medical conditions. At the time of the examination, weight, height, waist circumference, and systolic and diastolic blood pressure were measured. Body mass index (BMI) was calculated as body weight in kilograms per height[2] (m2).
Fasting blood samples were obtained from all participates after an overnight fast. SUA, TG, total low-density lipoprotein (LDL)- and HDL-cholesterol, apoA1, apoB, fasting blood glucose, alanine aminotransferase, aspartate aminotransferase, γ-glutamyl transpeptidase, bile acids, and creatinine were measured using an automatic biochemistry analyzer (Olympus, Kobe, Japan) with standard methods. Hemoglobin, platelets, and white blood cell counts were determined using a SYSMEX XT-1800 hematology autoanalyzer according to the manufacturer's instructions.
2.3. Diagnostic criteria and definitions
Dyslipidemia could be classified as hypercholesterolemia, hypertriglyceridemia, low HDL-cholesterolemia, or mixed hyperlipidemia, the last of which refers to combinations of 2 or more types of hyperlipidemia.[9] Dyslipidemia was defined according to current lipids levels or use of anti-dyslipidemia medications in the past month. The cut-off values for hypercholesterolemia, hypertriglyceridemia, and low HDL-cholesterolemia were total cholesterol ≥6.22 mmol/L (≥ 240 mg/dL), triglyceride (TG) ≥ 2.26 mmol/L (≥ 200 mg/dL), and HDL-cholesterol ≤ 1.04 mmol/L (≤ 40 mg/dL), respectively.[10] Hyperuricemia was defined as SUA level > 420 μmol/L (> 7.0 mg/dL) for men and > 360 μmol/L (> 6.0 mg/dL) for women.[11] MetS was defined by the modified National Cholesterol Education Program Adult Treatment Panel III report. [12]
2.4. Meta-analysis
We complied with the Preferred Reporting Items for Systematic Reviews and Meta-analyses protocols throughout the design, implementation, analysis, and reporting of our meta-analysis.[13] This meta-analysis was conducted by combining the results of current study and those of previous studies on association between uric acids and dyslipidemia. PubMed, Web of Science, and EMBASE were searched for studies published as late as July 2019, using the following search terms: (“lipid” OR “triglyceride” OR “cholesterol” OR “dyslipidemia”) AND (“uric acid” OR “hyperuricemia”). (Related meta references are listed in the supplementary section.) The included studies all examined the association of dyslipidemia or its components with the SUA level.
The exclusion criteria were as follows:
-
(1)
Did not provide the data on odds ratio (OR) or HR with 95% confidence intervals (CIs) or provide the minimum information necessary to calculate these values,
-
(2)
Literature reviews, and
-
(3)
Editorials.
Two investigators (C.S.H., W.J.H.) independently extracted the data. Cases of disagreement were resolved by discussion with a third investigator. Information extracted from each article included the name of the first author, publication date, study location, study design, sample size, study population characteristics, covariates adjusted in the multivariable analysis, definition of dyslipidemia or its components, and OR (or HR) (95% CI) for comparison to the highest with lowest SUA level categories. I2 statistic and the Cochran Q tests were used to examine heterogeneity among the studies. A random effects model was used to synthesize the pooled OR in the presence (P < .10) or absence (P > .10) of heterogeneity. Potential publication bias was evaluated by Begg and Egger tests. The potential effect of publication bias was assessed by the Duval and Tweedie trim-and-fill method.
2.5. Statistical analysis
Statistical analyses were performed using SPSS 18.0 for Windows (SPSS, Chicago, IL). Continuous variables are here presented as mean and standard division and were compared using the Student t test. Categorical variables were compared using the χ2 test. Pearson correlation analysis was used to analysis the correlation between SUA and lipid profile. A quintile-based analysis was used by dividing SUA levels into quintiles, and the lowest quintile was set as reference. The cutoff levels of SUA quintiles were based on gender as follows. For males: quintile 1 (Q1) < 278 μmol/L, 278 ≤ Q2 < 315 μmol/L, 315 ≤ Q3 < 347 μmol/L, 347 ≤ Q4 < 391 μmol/L, and Q5 ≥ 391 μmol/L; for females: Q1 < 200 μmol/L, 200 ≤ Q2 < 228 μmol/L, 228 ≤ Q3 < 256 μmol/L, 256 ≤ Q4 < 294 μmol/L, and Q5 ≥ 294 μmol/L. We used multivariable logistic regression to analyze the factors associated with the likelihood of dyslipidemia or its components. We also used 3 models with increasing degree of adjustment. Model 1 was unadjusted, model 2 was adjusted for age, gender and BMI, and model 3 was further adjusted for potential confounders. Further subgroup analyses, which depended on age and gender, were performed to explore the possible factors that could affect the relationship between SUA levels and dyslipidemia. A 2-sided P < .05 was considered significant.
3. Results
3.1. Clinical characteristics of the participants
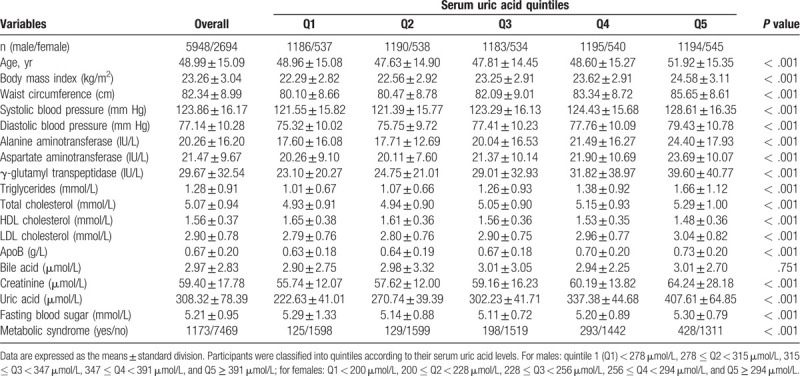
A total of 8642 participants (mean age 48.99 ± 15.09 years, 68.83% men) were enrolled in this study. All the participants were divided into quintiles according to their SUA levels, and their clinical characteristics were compared based on the SUA quintiles. We found that participants with higher SUA quintiles were older and had higher BMI, waist circumference, systolic and diastolic blood pressure, serum liver enzymes, TG, total- and LDL-cholesterol, apoB, fasting blood sugar, and creatinine levels but lower HDL-cholesterol levels (Table 1). These results suggest a significant association between SUA levels and metabolic abnormalities.
Table 1.
Clinical characteristics of participants according to serum uric acid quintiles.
3.2. Association of SUA levels with prevalence of dyslipidemia
Of 8642 participants enrolled, 799 met the diagnostic criteria for hyperuricemia, and 1766 met the diagnostic criteria for dyslipidemia. Of 1766 participants with dyslipidemia, 425 were hypertriglyceridemia, 779 were hypercholesterolemia, and 215 were low HDL-cholesterolemia, and 347 had mixed dyslipidemia. The prevalence of dyslipidemia was significantly higher in participants with hyperuricemia than those without hyperuricemia (Table 2). We found that the prevalence of dyslipidemia was positively associated with SUA quintiles (Fig. 1). Furthermore, Pearson correlation analysis indicated that SUA was positively correlated with TG (r = 0.271, P < .001), while SUA was negative correlated with HDL-c (r = -0.315, P < 0.001). These results indicate a positive association between SUA levels and dyslipidemia and its components.
Table 2.
Comparison of dyslipidemia prevalence between hyperuricemic and non-hyperuricemic participants.

Figure 1.
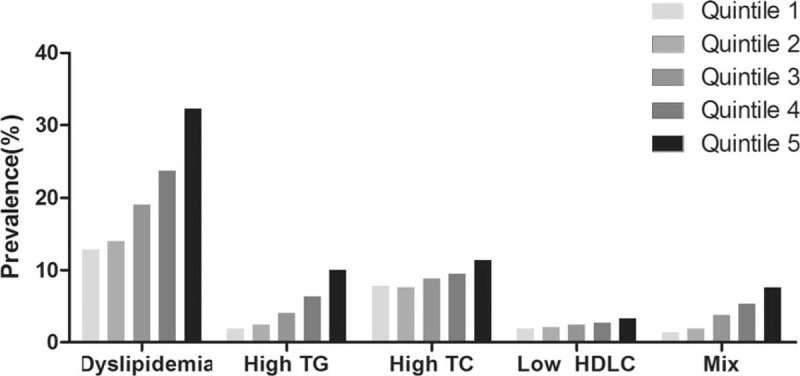
Prevalence of dyslipidemia and its classification according to quintiles of serum uric acid levels. The participants were classified into quintiles according to their serum uric acid levels. For males: quintile 1 (Q1) < 278 μmol/L, 278 ≤ Q2 < 315 μmol/L, 315 ≤ Q3 < 347 μmol/L, 347 ≤ Q4 < 391 μmol/L, and Q5 ≥ 391 μmol/L; for females: Q1 < 200 μmol/L, 200 ≤ Q2 < 228 μmol/L, 228 ≤ Q3 < 256 μmol/L, 256 ≤ Q4 < 294 μmol/L, and Q5 ≥ 294 μmol/L. High TG = hypertriglyceridemia, High TC = hypercholesterolemia, Low HDLC = low high-density lipoprotein cholesterolemia, Mix = two or more combinations of hyperlipidemia. P-values for positive association between SUA levels and dyslipidemia and its classification are less than .001.
3.3. Association of SUA levels with the likelihood of dyslipidemia
Both univariable and multivariable logistic regression analyses were performed to explore risk factors associated with dyslipidemia (Table 3). In univariable analysis, SUA levels were significantly closely associated with the likelihood of dyslipidemia, the OR and 95% CI was 1.004 (1.004–1.005). In multivariable analysis, SUA levels remained significantly closely associated with the likelihood of dyslipidemia. We further analyzed the association of SUA quintiles with the likelihood of dyslipidemia. We found that SUA quintiles were linearly correlated with the likelihood for dyslipidemia (Table 4). Compared with participants with SUA in the first quintile, the OR (95% CI) of dyslipidemia in the second, third, fourth, and fifth quintiles of SUA were 1.095 (0.901–1.332), 1.582 (1.315–1.904), 2.095 (1.752–2.505), and 3.212 (2.702–3.818), respectively. In models 2 and 3, the correlation was attenuated but remained significant after adjustment for other covariates. We also found that SUA quintiles were linearly correlated with the likelihood for the components of dyslipidemia (Table S1). These results suggest that participants with higher SUA levels had higher likelihood of dyslipidemia.
Table 3.
Logistic regression analysis of dyslipidemia with anthropometric and biochemical variables.
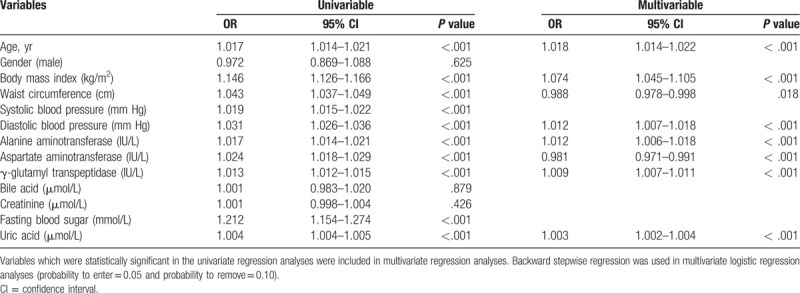
Table 4.
Odds ratios and 95% confidence intervals for dyslipidemia according to serum uric acid quintiles.

3.4. Effect of age and gender on the association of SUA levels with dyslipidemia
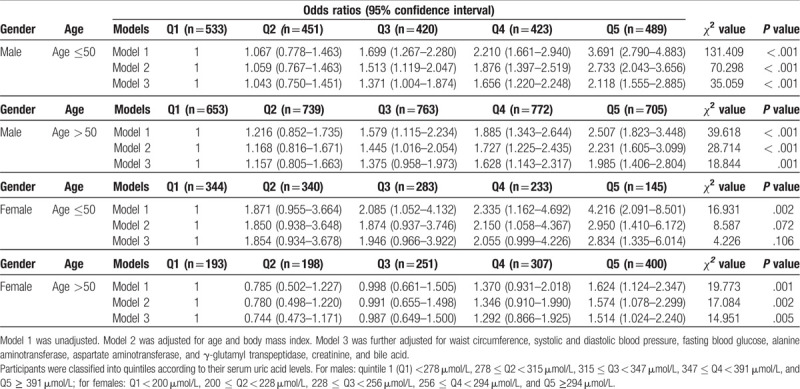
Subgroup analyses were conducted to determine whether the correlation between SUA levels and dyslipidemia was affected by gender. In these subgroup analyses, SUA quartiles were linearly associated with dyslipidemia in both sexes (Table S2). In addition, we further conducted subgroup analyses depend on age and gender. We found that in females aged > 50 years and in males, SUA quintiles were linearly correlated with the likelihood of dyslipidemia (Table 5). However, the association between SUA quintiles and the likelihood of dyslipidemia was not statistically significant in females aged ≤50 years, after adjusting for related covariates in models 2 and 3 (Table 5). These results indicate that the association between SUA levels and dyslipidemia is affected by age and gender.
Table 5.
Odds ratios and 95% confidence intervals for dyslipidemia according to serum uric acid quintiles in different age and gender group.
3.5. Meta-analysis
A total of 17 studies met the criteria for this meta-analysis. Of these, 5 studies (6 data points) investigated the association between dyslipidemia and SUA level, 12 studies (16 data points) investigated the association between hypertriglyceridemia and SUA level, and 10 studies (14 data points) investigated the association between low HDL-cholesterolemia and SUA level. The detailed steps of literature search are given in Figure S1, and the characteristics of the included studies are listed in Table S3. Fig. 2 summarizes the association between uric acids and dyslipidemia or its components, based on the previously published studies and the current study. Higher uric acid level was significantly related to an increased likelihood of dyslipidemia and the pooled OR for the highest uric acid level vs the lowest uric acid level was 1.84 (95% CI: 1.49–2.28) (I2 = 74.9%, P < .01). A higher uric acid level was significantly related with an increased likelihood of hypertriglyceridemia and the pooled OR for the highest uric acid level vs. the lowest uric acid level was 2.27 (95% CI: 1.86–2.77) (I2 = 84.6%, P < .01). Higher uric acid levels were significantly closely related to an increased likelihood of low HDL-cholesterolemia, and the pooled OR for the highest uric acid level vs the lowest uric acid level was 1.39 (95% CI: 1.12–1.73) (I2 = 78.8%, P < .01). We conducted a further sensitivity analysis, shown in Figure S2, and found that no matter which article we excluded, the results did not change.
Figure 2.
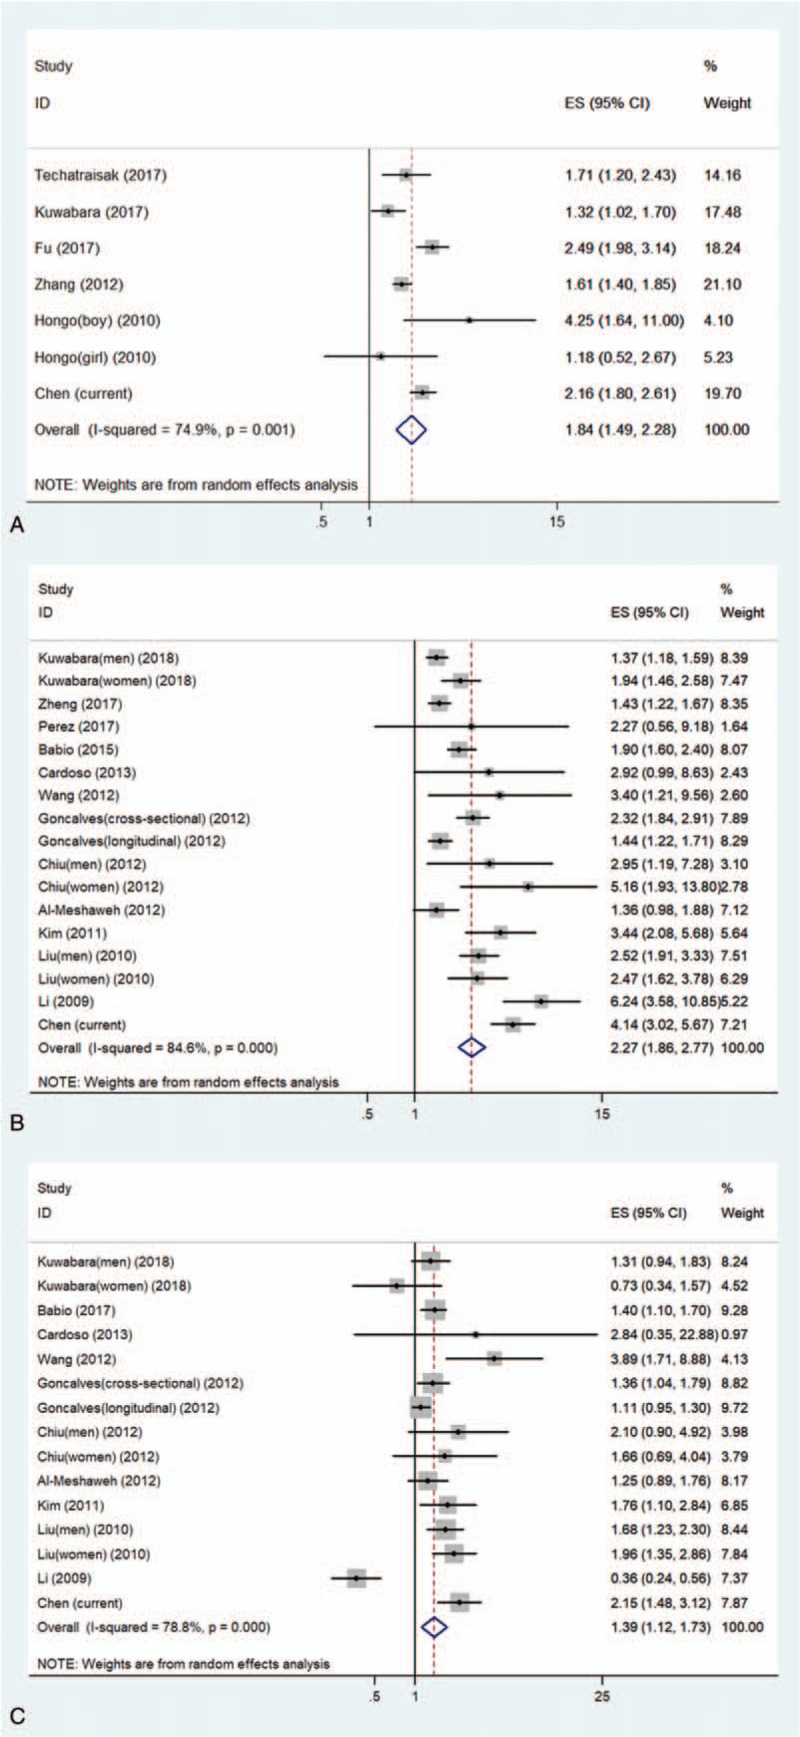
Meta-analysis of the association between serum uric acids and dyslipidemia, hypertriglyceridemia, and low HDL-cholesterolemia. (A) The association between serum uric acids and dyslipidemia; (B) the association between serum uric acids and hypertriglyceridemia; (C) the association between serum uric acids and low HDL-cholesterolemia. low HDL-cholesterolemia = low high-density lipoprotein cholesterolemia.
The results of Egger and Begg tests gave no evidence of significant bias in the dyslipidemia studies and low HDL-cholesterolemia (Dyslipidemia: Egger tests, P = .758, Begg tests, P = 1.000; low HDL-cholesterolemia: Egger tests, P = .390, Begg tests, P = .621) (Figure S3). However, the Egger regression test (P = .005) suggested the possibility of publication bias in hypertriglyceridemia related studies. The existing publication bias was adjusted using the trim-and-fill method. These results suggested that six hypothetical negative, unpublished prospective studies generated an asymmetric funnel plot. To achieve symmetry, we incorporated these six hypothetical studies. The statistical significance of this relationship remained (pooled OR, 1.79; 95% CI, 1.46–2.18).
4. Discussion
In the literature, the correlation between hyperuricemia and dyslipidemia remains uncertain. In this study, we conducted a large cross-sectional study and subsequent meta-analysis to clarify the relationship between SUA levels and dyslipidemia. We found that SUA levels were significantly closely associated with dyslipidemia and its components. We also expanded upon previous findings that SUA levels was not significantly associated with dyslipidemia in females age ≤50 years. These results suggested that age and gender may affect the relationship between SUA levels and dyslipidemia.
Many studies have confirmed that not all components of dyslipidemia are associated with SUA levels, especially HDL-cholesterol. For example, recent studies conducted in humans of different races described a significant association between SUA levels and TG but no association with HDL-cholesterol.[14,15] In addition, inconsistent opinions also have been published that uric acid is related positively to HDL-cholesterol.[16] However, despite mixed results across other studies, our study showed a positive association with each component of dyslipidemia, including hypertriglyceridemia, hypercholesterolemia and low HDL-cholesterolemia. Our results are also consistent with some prospective studies that established that high SUA levels increase the likelihood of dyslipidemia, [17] and this is independently associated with an increased likelihood of development of MetS.[18] These results also indicated that uric acid might contribute to the development of dyslipidemia. Uric acid has been widely recognized as a risk factor for the development of various cardiovascular diseases (CVDs), such as hypertension [19] and coronary heart disease.[8] Some clinical studies also suggested that treating of hyperuricemia have a positive effect on outcomes in CVDs.[20] It is widely accepted that dyslipidemia and CVDs cause and affect each other. Therefore, diet control and management of uric acid level might be advisable in patients with hyperuricemia so that those at an increased likelihood of developing dyslipidemia and further CVDs. This could be used to identify patients who might benefit from precautions to reduce the likelihood of diseases.
In terms of the gender differences, most studies have suggested that the association between SUA and dyslipidemia is not present in female humans.[8] However, in our study, we observed such an association in both male and female participants. When we divided the female participants into 2 groups by the age of 50, which is considered menopausal age for the majority of Asian women, [21] the association between SUA levels and dyslipidemia was present among post-menopausal but not pre-menopausal women. Similar results were also reported by Techatraisak et al in post-menopausal Thai women.[22] Thus, the inconsistency among previous studies might be attributable to menopausal status. Several epidemiological studies have reported that SUA levels are higher in men than in women,[23] and the levels increased after menopause.[24] It has been reported that estrogen plays a role in renal clearance, secretion, and reabsorption, so affecting SUA levels.[24] Estrogen in pre-menopausal women enhances uric acid excretion and causes a greater renal clearance of uric acid. [25] Therefore, it is very likely that endogenous estrogen may be the cause of the lack of any relationship between SUA levels and dyslipidemia in pre-menopausal women. Further studies are needed to clarify the mechanism for this phenomenon.
The present work has several limitations. First, our cross-sectional study could not establish any causal relationship between SUA levels and dyslipidemia. Second, a selection bias could be introduced, for the study participants volunteered for the health examination. Third, parameters of lifestyle factors such as diet and physical activity were not included in the questionnaire, which may affect the SUA levels. Fourth, the relationship between uric acid and fractions of cholesterol is very complex, and our study examined only the relationship between uric acid and lipid profiles as a variable to variable relationship. Further studies are necessary for a deeper explanation and to clarify these issues.
5. Conclusions
In conclusion, we found that elevated SUA levels were significantly related to dyslipidemia and its components, and we provided evidence for the first time that this relationship is affected by age and gender.
Author contributions
Conceptualization: Chengfu Xu.
Data curation: Hua Yang, Jinghua Wang, Lei Xu, Min Miao, Chengfu Xu.
Funding acquisition: Chengfu Xu.
Investigation: Shenghui Chen, Yishu Chen, Jinghua Wang, Lei Xu, Min Miao, Chengfu Xu.
Methodology: Shenghui Chen, Hua Yang, Yishu Chen, Jinghua Wang, Chengfu Xu.
Project administration: Shenghui Chen, Hua Yang.
Writing – original draft: Shenghui Chen, Chengfu Xu.
Writing – review & editing: Shenghui Chen, Hua Yang, Yishu Chen, Jinghua Wang, Chengfu Xu.
Supplementary Material
Supplementary Material
Supplementary Material
Supplementary Material
Supplementary Material
Supplementary Material
Supplementary Material
Footnotes
Abbreviations: BMI = body mass index, CI = confidence interval, CVDs = cardiovascular diseases, HDL- cholesterol = high-density lipoprotein cholesterol, LDL = low-density lipoprotein, Low HDL- cholesterolemia = low high-density lipoprotein cholesterolemia, MetS = metabolic syndrome, NAFLD = nonalcoholic fatty liver disease, OR = odds ratio, SUA = serum uric acid, TG = triglyceride.
How to cite this article: Chen S, Yang H, Chen Y, Wang J, Xu L, Miao M, Xu C. Association between serum uric acid levels and dyslipidemia in Chinese adults: A cross-sectional study and further meta-analysis. Medicine. 2020;99:11(e19088).
This work was supported by the National Natural Science Foundation of China (Nos. 81722009, and 81770573) and the Key Research and Development Program of Zhejiang Province (No. 2020C03033). The funders did not play any role in the study design, data collection and analysis, decisions regarding data release, or manuscript preparation.
The authors have no conflicts of interest to disclose.
Supplemental Digital Content is available for this article.
References
- [1].Prabhakaran D, Anand S, Watkins D, et al. Cardiovascular, respiratory, and related disorders: key messages from disease control priorities 3rd edition. Lancet 2018;391:1224–36. [DOI] [PMC free article] [PubMed] [Google Scholar]
- [2].Klop B, Elte JW, Cabezas MC. Dyslipidemia in obesity: mechanisms and potential targets. Nutrients 2013;5:1218–40. [DOI] [PMC free article] [PubMed] [Google Scholar]
- [3].Liang Z, Qiu QY, Wu JH, et al. Alcohol drinking, dyslipidemia, and diabetes: a population-based prospective cohort study among inner mongolians in China. Biomed Environ Sci 2016;29:555–62. [DOI] [PubMed] [Google Scholar]
- [4].Katsiki N, Mikhailidis DP, Mantzoros CS. Non-alcoholic fatty liver disease and dyslipidemia: an update. Metabolism 2016;65:1109–23. [DOI] [PubMed] [Google Scholar]
- [5].Zhang M, Deng Q, Wang L, et al. Prevalence of dyslipidemia and achievement of low-density lipoprotein cholesterol targets in Chinese adults: a nationally representative survey of 163,641 adults. Int J Cardiol 2018;260(undefined):196–203. [DOI] [PubMed] [Google Scholar]
- [6].Masanari K, Claudio B, Arrigo FGC, et al. Elevated serum uric acid increases risks for developing high LDL cholesterol and hypertriglyceridemia: a five-year cohort study in Japan. Int J Cardiol 2018;261(undefined):183–8. [DOI] [PubMed] [Google Scholar]
- [7].Gonçalves JP, Oliveira A, Severo M, et al. Cross-sectional and longitudinal associations between serum uric acid and metabolic syndrome. Endocrine 2012;41:450–7. [DOI] [PubMed] [Google Scholar]
- [8].Kuwabara M, Niwa K, Hisatome I, et al. Asymptomatic hyperuricemia without comorbidities predicts cardiometabolic diseases: five-year Japanese cohort study. Hypertension 2017;69:1036–44. [DOI] [PMC free article] [PubMed] [Google Scholar]
- [9].Jacobson TA, Ito MK, Maki KC, et al. National lipid association recommendations for patient-centered management of dyslipidemia: part 1--full report. J Clin Lipidol 2015;9:129–69. [DOI] [PubMed] [Google Scholar]
- [10].Joint Committee for Developing Chinese guidelines on Prevention and Treatment of Dyslipidemia in Adults. [Chinese guidelines on prevention and treatment of dyslipidemia in, adults]. Chin J Cardiol 2007;35:390–419. [PubMed] [Google Scholar]
- [11].Fang J, Alderman MH. Serum uric acid and cardiovascular mortality the NHANES I epidemiologic follow-up study, 1971-1992. JAMA 2000;283:2404–10. [DOI] [PubMed] [Google Scholar]
- [12].National Cholesterol Education Program (NCEP) Expert Panel on Detection, Evaluation, and Treatment of High Blood Cholesterol in Adults (Adult Treatment Panel III). Third report of the National Cholesterol Education Program (NCEP) expert panel on detection, evaluation, and treatment of high blood cholesterol in adults (Adult Treatment Panel III) final, report. Circulation 2002;106:3143–421. [PubMed] [Google Scholar]
- [13].Moher D, Liberati A, Tetzlaff J, et al. Preferred reporting items for systematic reviews and meta-analyses: the PRISMA Statement. Open Med 2009;3:e123–30. [PMC free article] [PubMed] [Google Scholar]
- [14].Cardoso AS, Gonzaga NC, Medeiros CC, et al. Association of uric acid levels with components of metabolic syndrome and non-alcoholic fatty liver disease in overweight or obese children and adolescents. J Pediatr 2013;89:412–8. [DOI] [PubMed] [Google Scholar]
- [15].Chiu CC, Chen CH, Huang MC, et al. The Relationship between serum uric acid concentration and metabolic syndrome in patients with Schizophrenia or Schizoaffective disorder. J Clin Psychopharmacol 2012;32:585–92. [DOI] [PubMed] [Google Scholar]
- [16].Li NF, Wang HM, Yang J, et al. Serum uric acid is associated with metabolic risk factors for cardiovascular disease in the Uygur population. Appl Physiol Nutr Metab 2009;34:1032–9. [DOI] [PubMed] [Google Scholar]
- [17].Zheng R, Ren P, Chen Q, et al. Serum uric acid levels and risk of incident hypertriglyceridemia: a longitudinal population-based epidemiological study. Ann Clin Lab Sci 2017;47:586–91. [PubMed] [Google Scholar]
- [18].Babio N, Martínez-González MA, Estruch R, et al. Associations between serum uric acid concentrations and metabolic syndrome and its components in the PREDIMED study. Nutr Metab Cardiovasc Dis 2015;25:173–80. [DOI] [PubMed] [Google Scholar]
- [19].Kuwabara M, Hisatome I, Niwa K, et al. Uric acid is a strong risk marker for developing hypertension from prehypertension novelty and significance. Hypertension 2018;71:78–86. [DOI] [PMC free article] [PubMed] [Google Scholar]
- [20].Higgins P, Walters MR, Murray HM, et al. Allopurinol reduces brachial and central blood pressure, and carotid intima-media thickness progression after ischaemic stroke and transient ischaemic attack: a randomised controlled trial. Heart 2014;100:1085–92. [DOI] [PubMed] [Google Scholar]
- [21].Shi J, Zhang B, Choi JY, et al. Age at menarche and age at natural menopause in East Asian women: a genome-wide association study. Age (Dordr) 2016;38:513–23. [DOI] [PMC free article] [PubMed] [Google Scholar]
- [22].Techatraisak K, Kongkaew T. The association of hyperuricemia and metabolic syndrome in Thai postmenopausal women. Climacteric 2017;20:552–7. [DOI] [PubMed] [Google Scholar]
- [23].Gao N, Yu Y, Zhang B, et al. Dyslipidemia in rural areas of North China: prevalence, characteristics, and predictive value. Lipids Health Dis 2016;15:154. [DOI] [PMC free article] [PubMed] [Google Scholar]
- [24].Wingrove CS, Walton C, Stevenson JC. The effect of menopause on serum uric acid levels in non-obese healthy women. Metabolism 1998;47:435–8. [DOI] [PubMed] [Google Scholar]
- [25].Anton FM, Garcia Puig J, Ramos T, et al. Sex differences in uric acid metabolism in adults: evidence for a lack of influence of estradiol-17 beta (E2) on the renal handling of urate. Metabolism 1986;35:343–8. [DOI] [PubMed] [Google Scholar]
Associated Data
This section collects any data citations, data availability statements, or supplementary materials included in this article.


