Abstract
Background:
The incidence of triple negative breast cancer (TNBC) is at a relatively high level, and our study aimed to identify differentially expressed genes (DEGs) in TNBC and explore the key pathways and genes of TNBC.
Methods:
The gene expression profiling (GSE86945, GSE86946 and GSE102088) data were obtained from Gene Expression Omnibus Datasets, DEGs were identified by using R software, Gene Ontology (GO) analysis and Kyoto Encyclopedia of Genes and Genomes (KEGG) pathway enrichment analyses of DEGs were performed by the Database for Annotation, Visualization and Integrated Discovery (DAVID) tools, and the protein-protein interaction (PPI) network of the DEGs was constructed by the STRING database and visualized by Cytoscape software. Finally, the survival value of hub DEGs in breast cancer patients were performed by the Kaplan–Meier plotter online tool.
Results:
A total of 2998 DEGs were identified between TNBC and health breast tissue, including 411 up-regulated DEGs and 2587 down-regulated DEGs. GO analysis results showed that down-regulated DEGs were enriched in gene expression (BP), extracellular exosome (CC), and nucleic acid binding, and up-regulated were enriched in chromatin assembly (BP), nucleosome (CC), and DNA binding (MF). KEGG pathway results showed that DEGs were mainly enriched in Pathways in cancer and Systemic lupus erythematosus and so on. Top 10 hub genes were picked out from PPI network by connective degree, and 7 of top 10 hub genes were significantly related with adverse overall survival in breast cancer patients (P < .05). Further analysis found that only EGFR had a significant association with the prognosis of triple-negative breast cancer (P < .05).
Conclusions:
Our study showed that DEGs were enriched in pathways in cancer, top 10 DEGs belong to up-regulated DEGs, and 7 gene connected with poor prognosis in breast cancer, including HSP90AA1, SRC, HSPA8, ESR1, ACTB, PPP2CA, and RPL4. These can provide some guidance for our research on the diagnosis and prognosis of TNBC, and further research is needed to evaluate their value in the targeted therapy of TNBC.
Keywords: bioinformatics analysis, gene expression, Gene Expression Omnibus, triple-negative breast cancer
1. Introduction
The incidence of breast cancer is at a relatively high level and is the most common diagnosis in cancer in women around the world.[1] Triple-negative breast cancer refers to a special type of breast cancer in which estrogen receptor (ER), progesterone receptor (PR), and human epidermal growth factor receptor 2 (HER-2) are all negatively expressed and counts about 15% to 20% in all breast cancer.[2,3] Triple negative breast cancer (TNBC), with a unique biological and clinical features, is more aggressive than other subtypes of breast cancer, and has shorter disease-free survival, high soft tissue and visceral metastasis,[4] and higher mortality within 5 years than non-TNBC patients.[5,6] At present, breast cancer treatment is mainly targeted at ER, PR, and HER2, however TNBC patients cannot benefit from endocrine therapy and targeted therapy because of lacking of targets, and results in poor prognosis, high recurrence and metastasis rate and mortality. Therefore, it is necessary to find the key genes and important pathways of TNBC, thereby identifying its pathogenesis and providing a certain direction for new treatment options.
In our study, we aimed to find out TNBC-specific differentially expressed genes (DEGs). With the Gene Expression Omnibus (GEO) Datasets, we identified DEGs by comparing TNBC samples tissue with health control samples tissue. GO functional annotation, as well as Kyoto Encyclopedia of Genes and Genomes (KEGG) pathway enrichment analysis, was performed for the screened DEGs, protein-protein interaction (PPI) network of DEGs were constructed by STRING Datasets and visualized by Cytoscape software to explore and identify hub genes associated with TNBC. Finally, the survival analysis of these hub genes derived from PPI was completed by Kaplan–Meier plotter online survival analysis tool. Our research will provide DEGs with comprehensive bioinformatics and contribute to a better understanding of the mechanisms, progression, and metastasis of triple-negative breast cancer.
2. Materials and methods
2.1. Microarray data
The data analyzed in our study were downloaded from GEO Datasets (https://www.ncbi.nlm.nih.gov/geo/). The gene expression profiling (GSE86945, GSE86946, and GSE102088) were from GPL17586 Affymetrix Human Transcriptome Array 2.0. 158 TNBC samples were from GSE86945 and GSE86946, and 114 health samples were from GSE102088. The data processed by our research were freely available online. Ethics and patient consent are not applicable.
2.2. Data processing
Analysis of DEGs and was conducted by using limma package[7] (version = “3,8”) in R software (version x64 3,5,3). The oligo Bioconductor package[8] was used to complete the reading of gene expression profile CEL format data files. Background correction, normalization and standardization were performed by RMA - Robust Multichip Average algorithm.[9] DEGs were identified with a level of fold change >2 (log FC > 1) and adj. P value <.01. And the heatmaps of the top 20 DEGs (10 up-DEGs and 10 down-DEGs) was produced by heatmap package (version 1,0,12) and R software.
2.3. GO and KEGG pathway analysis
Gene Ontology (GO) is an ontology widely used in the field of bioinformatics for annotating large scale genes and gene products.[10] It covers 3 aspects of biology: biological process (BP), molecular function (MF), and cellular component (CC). KEGG is a practical database resource for genome sequencing and polymer experiment technology. It is generated by molecular level information, especially macromolecular datasets, which can be used to predict which pathways a particular gene is enriched.[11] It covers information resources such as diseases and pathways, GO analysis and KEGG analysis were performed by DAVID tools (https://david.ncifcrf.gov/). P < ,01 was considered statistically significant.[12]
2.4. PPI network of DEGs
We uploaded the top 1000 down-regulated DEGs and all the up-regulated DEGs to the online tool, STRING database (https://string-db.org/). And the Cytoscape software (version 3.7.1) was used to analysis the PPI networks basing on the STRING results. The PPI sub-networks were analysis by using the plug-in Molecular Complex Detection (MCODE), and we defined sub-networks with a level of MCODE scores >5 and number of nodes >20. The higher the degree of connectivity of nodes, the greater the role of network stability. And the degree of connectivity of each node was calculated by using the plug-in CytoHubba. The top ten genes with the highest connectivity were identified as key genes.
2.5. Survival analysis of hub genes
The Kaplan–Meier plotter (https://www.kmplot.com), containing microarray gene expression data and survival information covering GEO, The Cancer Genome Atlas (TCGA) and Cancer Biomedical informatics Grid (caBIG),[13] was used to analyze the survival analysis of key genes in breast cancer. The top 10 hub genes were uploaded to Kaplan–Meier, respectively. The probe of each gene was chosen by “only JetSet best probe set” and P < .05 was considered to be statistically significant.
3. Results
3.1. Identification of DEGs
We analyzed 158 TNBC samples tissue and 114 health control samples tissue from GSE86945, GSE86946, and GSE102088. With R software, limma package and RMA - Robust Multichip Average algorithm, a total of 2998 DEGs were identified between TNBC samples tissue and health control samples tissue, including 411 up-regulated DEGs and 2587 down-regulate DEGs. And the heatmap of top 20 DEGs (top 10 up-regulated DEGs and top 10 down-regulated DEGs) was drawn by heatmap package and R software (Fig. 1).
Figure 1.
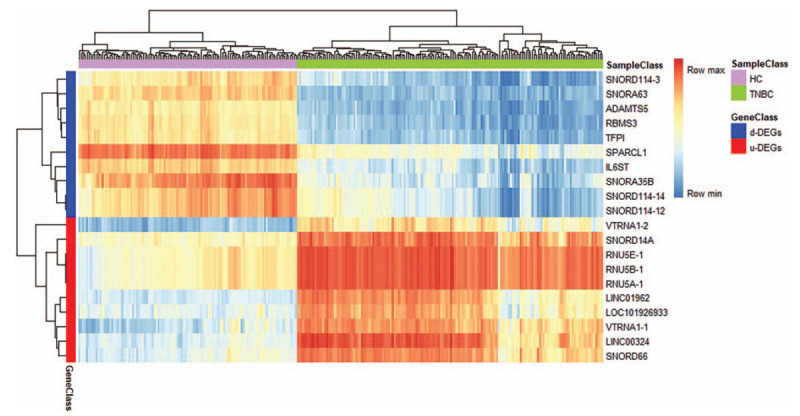
Heatmap of top 10 up-regulated DEGs and top 10 down-regulated DEGs. Red, means up-regulation; Blue, means down-regulation. The value of expression intensity is derived from the gene expression level obtained by R software analysis. TNBC = Triple Negative Breast Cancer, HC = Health Control, d-DEGs = down-regulated DEGs, u-DEGs = up-regulated DEGs, DEGs = differentially expressed genes.
3.2. GO analyses
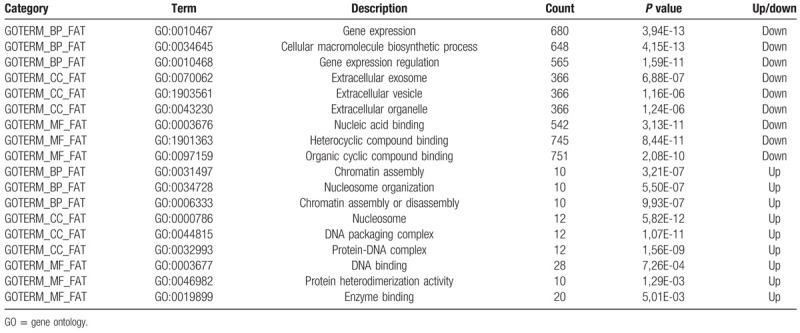
The DAVID tools were used to perform GO analysis and KEGG pathways enrichment analysis (Table 1). We upload all DEGs to DAVID tool. The results of GO analysis were divided into biological processes (BP), cellular component (CC) and molecular function (MF). GO results indicated that the down-DEGs were significantly enriched in BP, CC, and MF. BP includes gene expression, cellular macromolecule biosynthetic process and gene expression regulation. CC includes extracellular exosome, extracellular vesicle, and extracellular organelle. And MF includes nucleic acid binding, heterocyclic compound binding, and organic cyclic compound binding. Up-DEGs also were significantly enriched in BP, CC, and MF. BP includes chromatin assembly, nucleosome organization, and chromatin assembly or disassembly. CC includes nucleosome, DNA packaging complex, and protein-DNA complex. And MF includes DNA binding, protein heterodimerization activity, and enzyme binding.
Table 1.
Top 3 significantly enriched GO terms.
3.3. KEGG pathway analysis
The up-DEGs and down-DEGs were uploaded separately. Down-DEGs were enriched in Pathways in cancer, Neurotrophin signaling pathway, MAPK signaling pathway, FoxO signaling pathway and cGMP-PKG signaling pathway. And up-DEGs were significantly enriched in Systemic lupus erythematosus, Alcoholism and Viral carcinogenesis (Table 2).
Table 2.
KEGG pathway analysis of DEGs associated with TNBC.

3.4. PPI network of DEGs and identification of key gene
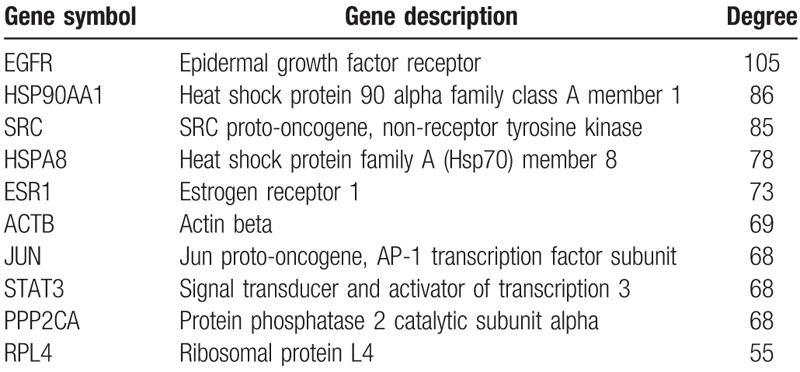
We uploaded the top 1000 down-DEGs and all of the up-DEGs to STRING to generate the PPI network (Fig. 2). We entered the results of the STRING web tool into the Cytoscape software and found that the PPI network only analyzed 822 nodes and 4429 edges (Figure not shown). And we used the plug-in MCODE based on Cytoscape software to analysis primary modules of the PPI sub-network. Based on the level of MCODE scores >5 and number of nodes >20, we got 6 sub-networks from the PPI network. And the top 3 sub-networks are shown in Figure 3. Sub-network 1 owned 26.296 score (Density∗#Nodes) and includes 28 nodes, 355 edges. Sub-network 2 owned 13.294 score and includes 18 nodes, 133 edges. And sub-network 3 owned 10.255 score and includes 56 nodes, 282 edges. After the calculation and analysis of the plug-in CytoHubba, we obtained the connectivity degree of each node, and we identified the top 10 genes assessed by the degree of connectivity in the PPI network (Table 3). The results showed that epidermal growth factor receptor (EGFR) was the most prominent gene with connectivity degree = 105, followed by heat shock protein 90 alpha family class A member 1 (HSP90AA1, degree = 86), SRC proto-oncogene, non-receptor tyrosine kinase (SRC, degree = 85), heat shock protein family A (Hsp70) member 8 (HSPA8, degree = 78), estrogen receptor 1 (ESR1, degree = 73), actin beta (ACTB, degree = 69), Jun proto-oncogene, AP-1 transcription factor subunit (JUN, degree = 68), signal transducer and activator of transcription 3 (STAT3, degree = 68), protein phosphatase 2 catalytic subunit alpha (PPP2CA, degree = 68) and ribosomal protein L4 (RPL4, degree = 55). All the top 10 genes belong to up-DEGs in TNBC.
Figure 2.
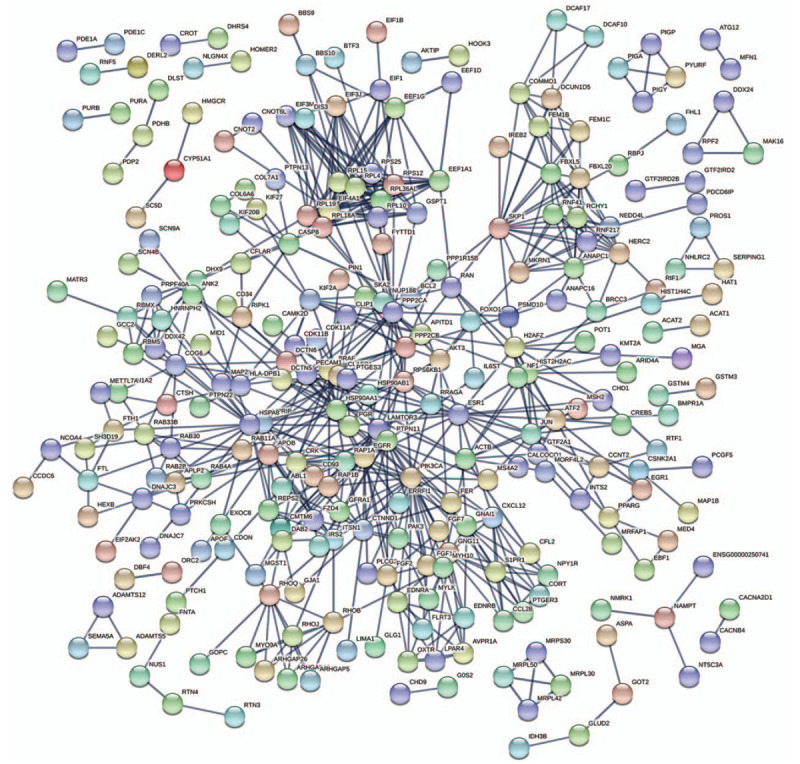
Protein-protein interaction network of top 1000 up-DEGs and all the down-DEGs. DEGs = differentially expressed genes.
Figure 3.

Top 3 primary modules of protein-protein interaction sub networks analyzed by the plug in molecular complex detection in Cytoscape software. (A) module 1; (B) module 2; (C) module 3.
Table 3.
Top 10 hub genes with higher degree of connectivity.
3.5. Survival analysis of hub genes
To analyze the survival analysis of top 10 hub genes, we uploaded them to Kaplan–Meier plotter Breast cancer which contains 3951 patients. As the result showed that, 7 of top 10 hub genes were significant relative with adverse overall survival in breast cancer patients, including HSP90AA1, SRC, HSPA8, ESR1, ACTB, PPP2CA, and RPL4. Further studies found that EGFR gene is a good predictor of TNBC prognosis (Fig. 4).
Figure 4.
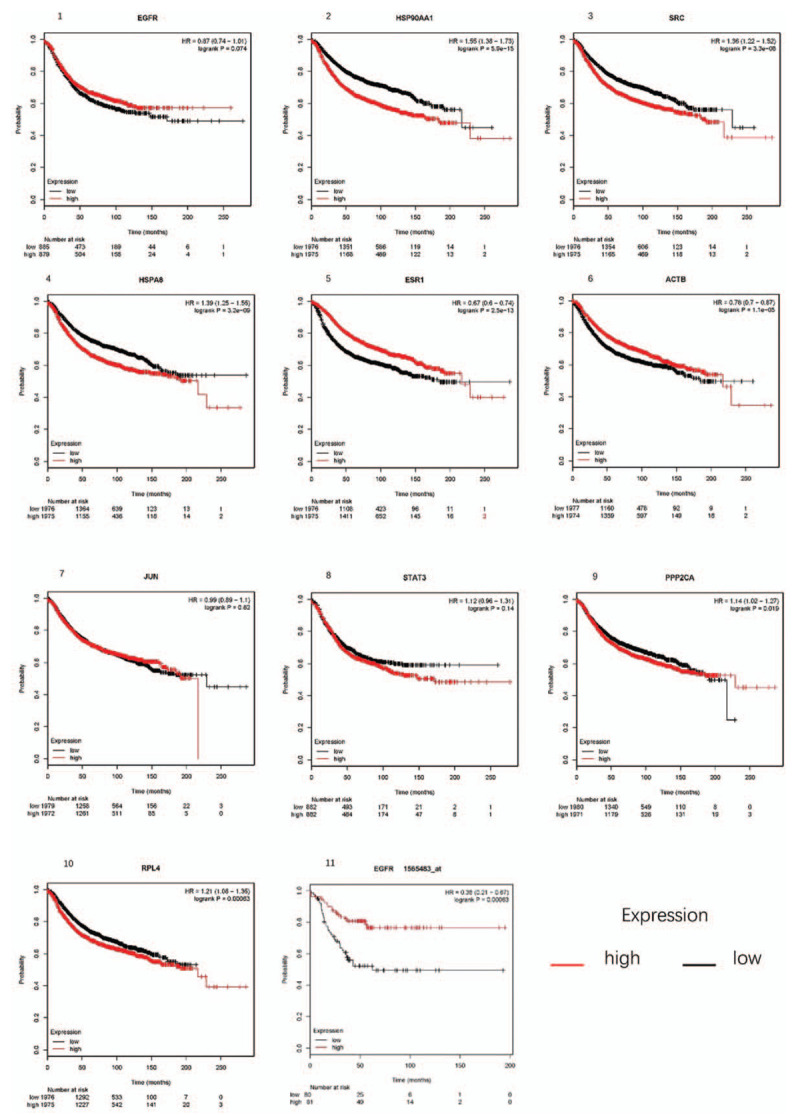
Kaplan–Meier analysis. 1–10, Kaplan–Meier analysis of overall survival (months) of the top 10 key genes in breast cancer patients; 11, Kaplan–Meier analysis of EGFR in triple negative breast cancer.
4. Discussion
TNBC is a special type of pathology in breast cancer with high invasiveness, recurrence rate and mortality, and poor prognosis,[14,15] and it occurs mostly in premenopausal young women, especially African women.[16] Numerous researches have studied the different expressed genes associated TNBC.[17–20] However, the pathogenesis of TNBC is still unclear, it is necessary for us to continue to analyze the different expressed genes in TNBC with the latest data.
In our bioinformatics research, 3 datasets, GSE86945, GSE86946, and GSE102088, contained 158 TNBC patients and 114 heath people, downloaded from GEO datasets, were used to extract the DEGs. We found 2998 genes expressed different between TNBC and health control, including 411 up-regulated DEGs and 2587 down-regulated DEGs. After analyzed by DAVID database, we found down-regulated DEGs were enriched in gene expression, cellular macromolecule biosynthetic process, regulation of gene expression, extracellular exosome, extracellular vesicle, extracellular organelle, nucleic acid binding, heterocyclic compound binding as well as organic cyclic compound binding. And up-regulated DEGs were enriched in chromatin assembly, nucleosome organization, chromatin assembly or disassembly, nucleosome, DNA packaging complex, protein-DNA complex, DNA binding, protein heterodimerization activity, and enzyme binding. We selected top 10 hub genes sorted by PPI networks connective degree, and 7 of them were significantly related to the prognosis of breast cancer. These genes include HSP90AA1, SRC, HSPA8, ESR1, ACTB, PPP2CA, and RPL4. However, further studies found that only EGFR gene was a good predictor of TNBC prognosis. It was exactly the opposite of what we predicted. May be due to the relatively small number of cases that can be analyzed, and we need to collect more patients for analysis. Though the hub we identified were different from previous studies,[20–22] we all have provided some reference directions for the diagnosis, treatment and prognosis of TNBC. And the difference may be due to different number of cases analyzed, different identification criteria and experimental errors, or other reasons.
HSP90AA1, heat shock protein 90 alpha family class A member 1, is highly express in brain, testis, placenta, gall gladder, and adrenal,[23] and plays a significant role in the activity and stability of many proteins responsible for tumor initiation, progression and metastasis.[24] HSP90AA1 has ability to bind and hydrolyze ATP, which is essential for its chaperone function.[25] HSP90AA1 is also identified by Zeng[26] as a DEG of breast cancer. However, Jarzab et al[27] thinks that it is low express in breast cancer, it was just the opposite of the results of our analysis. In addition, our results were somewhat close to the study of Cheng.[28] Perhaps there is a difference in gene expression between breast cancer and triple-negative breast cancer.
SRC, SRC proto-oncogene, non-receptor tyrosine kinase, is also high express in stomach, testis, gall bladder, and duodenum.[23] SRC can regulate the expression of some enzymes that mediate tumor biological activity[29] and it is activated in many human cancers.[30] Previous several mouse models experiments showed that SRC played a vital role during mammary gland development and breast cancer progression,[31] and SRC is highly expressed in most of breast cancer patient samples.[32] Additional, Abdullah found that SRC can promote MYC mRNA, one transcription factor was important in breast cancer, expression in estrogen receptor-positive breast cancer.[33] In vitro experiments show that increased SRC kinase activity can promote breast cancer invasiveness.[34] Importantly, some SRC inhibitors have been developed for targeted therapy of TNBC,[35] so we consider that SRC is a target gene in TNBC, and we need to further study targeted therapy for the SRC, as well as prevent the occurrence and early diagnosis of TNBC.
HSPA8, heat shock protein family A (Hsp70) member 8, belongs to HSP70 (heat-shock protein 70) families containing 13 members.[36] According to previous reports, Hsp70 can promote cancer cell growth through different mechanisms.[37] And experiments showed that HSC70 was a small target for somatic mutations and deletions in breast cancer.[38] HSPA8, expressed highly in many tumors,[39,40] is stress proteins and closely related to the occurrence and prognosis of various tumors, and plays a significant regulatory role in tumor cell proliferation and apoptosis.[41] Interestingly, some researchers have shown that HSPA8 can be used as an early biomarker for liver cancer.[42] In our study, HSPA8 was high expressing in TNBC compared health control samples. Our survival analysis also showed that it has a poor prognosis for TNBC. So in our study, HSPA8 was also considered as a biomarker, a prognostic factor and even a potential targeted therapeutic target for TNBC, just as previous report.[43]
Except HSP90AA1, SRC and HSPA8, ESR1, ACTB, PPP2CA, and RPL4 were also up-regulated expressed in TNBC samples tissue compared with health breast samples tissue, and they all were related to poor prognosis in breast cancer patients. However, we found down-regulated DEGs enriched in Pathways in cancer (hsa05200) with a largest amount of genes (P value = 1.33 E–04). There is still no report about the low expression genes of Pathways in cancer will promote the development of cancer. We speculated that there may be another new pathogenesis of TNBC. Thus, further study of the pathogenesis of TNBC and the relationship between Pathways in cancer and TNBC is needed.
5. Conclusion
Our study identified 411 up-regulated genes and 2587 down-regulated genes between TNBC and health breast from 3 GEO series. With connective degree of PPI network, we selected top 10 hub genes, and after the analysis of Kaplan–Meier plotter, we identified 7 of them were hub genes in TNBC. These genes included HSP90AA1, SRC, HSPA8, ESR1, ACTB, PPP2CA, and RPL4. These new hub genes associated TNBC will provide us with some new research directions on TNBC.
Author contributions
Conceptualization: Jiarui Chen.
Data curation: Jiarui Chen, Tuo Liang, Haopeng Zeng.
Formal analysis: Jiarui Chen, Chong Liu.
Funding acquisition: Jiarui Chen, Xinli Zhan.
Investigation: Jiarui Chen, Chong Liu, Jiang Xue.
Methodology: Jiarui Chen, Chong Liu, Jie Jiang.
Project administration: Jiarui Chen, Chong Liu.
Resources: Jiarui Chen, Zide Zhang.
Software: Jiarui Chen, Tuo Liang, Guoyong Xu, Zhaojun Lu.
Supervision: Jiarui Chen, Xinli Zhan, Jiemei Cen.
Validation: Jiarui Chen, Chong Liu, Xinli Zhan, Jiemei Cen, Jian Zeng.
Visualization: Jiarui Chen, Tuo Liang, Jiang Xue, Zequn Wang.
Writing – original draft: Jiarui Chen.
Writing – review & editing: Jiarui Chen, Chong Liu, Jiemei Cen.
Footnotes
Abbreviations: DAVID = Database for Annotation, Visualization and Integrated Discovery, DEGs = differentially expressed genes, GEO = Gene Expression Omnibus, GO = gene ontology, KEGG = Kyoto Encyclopedia of Genes and Genomes, PPI = protein-protein interaction, TNBC = triple negative breast cancer.
How to cite this article: Chen J, Liu C, Cen J, Liang T, Xue J, Zeng H, Zhang Z, Xu G, Yu C, Lu Z, Wang Z, Jiang J, Zhan X, Zeng J. KEGG-expressed genes and pathways in triple negative breast cancer: protocol for a systematic review and data mining. Medicine. 2020;99:18(e19986).
JC and CL have contributed to the work equally and should be regarded as co-first authors.
This article does not contain any studies with human participants or animals performed by any of the authors.
The authors have no funding and conflicts of interests to disclose.
References
- [1].Siegel RL, Miller KD, Jemal A. Cancer statistics, 2017. CA Cancer J Clin 2017;67:7–30. [DOI] [PubMed] [Google Scholar]
- [2].Criscitiello C, Azim HAJ, Schouten PC, et al. Understanding the biology of triple-negative breast cancer. Ann Oncol 2012;23: Suppl 6: vi13–8. [DOI] [PubMed] [Google Scholar]
- [3].Lehmann BD, Pietenpol JA. Identification and use of biomarkers in treatment strategies for triple-negative breast cancer subtypes. J Pathol 2014;232:142–50. [DOI] [PMC free article] [PubMed] [Google Scholar]
- [4].Prat A, Adamo B, Cheang MC, et al. Molecular characterization of basal-like and non-basal-like triple-negative breast cancer. Oncologist 2013;18:123–33. [DOI] [PMC free article] [PubMed] [Google Scholar]
- [5].Hudis CA, Gianni L. Triple-negative breast cancer: an unmet medical need. Oncologist 2011;16: Suppl 1: 1–1. [DOI] [PubMed] [Google Scholar]
- [6].Jiang YZ, Liu YR, Xu XE, et al. Transcriptome analysis of triple-negative breast cancer reveals an integrated mRNA-lncRNA signature with predictive and prognostic value. Cancer Res 2016;76:2105–14. [DOI] [PubMed] [Google Scholar]
- [7].Ritchie ME, Phipson B, Wu D, et al. limma powers differential expression analyses for RNA-sequencing and microarray studies. Nucleic Acids Res 2015;43:e47. [DOI] [PMC free article] [PubMed] [Google Scholar]
- [8].Carvalho BS. Working with oligonucleotide arrays. Methods Mol Biol 2016;1418:145–59. [DOI] [PubMed] [Google Scholar]
- [9].Irizarry RA, Hobbs B, Collin F, et al. Exploration, normalization, and summaries of high density oligonucleotide array probe level data. Biostatistics 2003;4:249–64. [DOI] [PubMed] [Google Scholar]
- [10].Gene Ontology C. The Gene Ontology (GO) project in 2006. Nucleic Acids Res 2006;34(Database issue):D322–6. [DOI] [PMC free article] [PubMed] [Google Scholar]
- [11].Kanehisa M, Furumichi M, Tanabe M, et al. KEGG: new perspectives on genomes, pathways, diseases and drugs. Nucleic Acids Res 2017;45:D353–61. [DOI] [PMC free article] [PubMed] [Google Scholar]
- [12].Delker DA, Geter DR, Roop BC, et al. Oncogene expression profiles in K6/ODC mouse skin and papillomas following a chronic exposure to monomethylarsonous acid. J Biochem Mol Toxicol 2009;23:406–18. [DOI] [PubMed] [Google Scholar]
- [13].Gyorffy B, Lanczky A, Szallasi Z. Implementing an online tool for genome-wide validation of survival-associated biomarkers in ovarian-cancer using microarray data from 1287 patients. Endocr Relat Cancer 2012;19:197–208. [DOI] [PubMed] [Google Scholar]
- [14].Fayaz MS, El-Sherify MS, El-Basmy A, et al. Clinicopathological features and prognosis of triple negative breast cancer in Kuwait: a comparative/perspective analysis. Rep Pract Oncol Radiother 2013;19:173–81. [DOI] [PMC free article] [PubMed] [Google Scholar]
- [15].Chalakur-Ramireddy NKR, Pakala SB. Combined drug therapeutic strategies for the effective treatment of triple negative breast cancer. Biosci Rep 2018;38:ii:BSR20171357. [DOI] [PMC free article] [PubMed] [Google Scholar]
- [16].Brewster AM, Chavez-MacGregor M, Brown P. Epidemiology, biology, and treatment of triple-negative breast cancer in women of African ancestry. Lancet Oncol 2014;15:e625–34. [DOI] [PMC free article] [PubMed] [Google Scholar]
- [17].Zhai Q, Li H, Sun L, et al. Identification of differentially expressed genes between triple and non-triple-negative breast cancer using bioinformatics analysis. Breast Cancer 2019;26:784–91. [DOI] [PubMed] [Google Scholar]
- [18].Jiao Y, Li Y, Liu S, et al. ITGA3 serves as a diagnostic and prognostic biomarker for pancreatic cancer. Onco Targets Ther 2019;12:4141–52. [DOI] [PMC free article] [PubMed] [Google Scholar]
- [19].Wang SS, Chen G, Li SH, et al. Identification and validation of an individualized autophagy-clinical prognostic index in bladder cancer patients. Onco Targets Ther 2019;12:3695–712. [DOI] [PMC free article] [PubMed] [Google Scholar]
- [20].Dong P, Yu B, Pan L, et al. Identification of key genes and pathways in triple-negative breast cancer by integrated bioinformatics analysis. Biomed Res Int 2018;2018:2760918. [DOI] [PMC free article] [PubMed] [Google Scholar]
- [21].Li MX, Jin LT, Wang TJ, et al. Identification of potential core genes in triple negative breast cancer using bioinformatics analysis. Onco Targets Ther 2018;11:4105–12. [DOI] [PMC free article] [PubMed] [Google Scholar]
- [22].Guo J, Gong G, Zhang B. Screening and identification of potential biomarkers in triple-negative breast cancer by integrated analysis. Oncol Rep 2017;38:2219–28. [DOI] [PubMed] [Google Scholar]
- [23].Fagerberg L, Hallstrom BM, Oksvold P, et al. Analysis of the human tissue-specific expression by genome-wide integration of transcriptomics and antibody-based proteomics. Mol Cell Proteomics 2014;13:397–406. [DOI] [PMC free article] [PubMed] [Google Scholar]
- [24].Rohl A, Rohrberg J, Buchner J. The chaperone Hsp90: changing partners for demanding clients. Trends in biochemical sciences. Trends Biochem Sci 2013;38:253–62. [DOI] [PubMed] [Google Scholar]
- [25].Panaretou B, Prodromou C, Roe SM, et al. ATP binding and hydrolysis are essential to the function of the Hsp90 molecular chaperone in vivo. EMBO J 1998;17:4829–36. [DOI] [PMC free article] [PubMed] [Google Scholar]
- [26].Zeng F, Fu J, Hu F, et al. Identification of key pathways and genes in response to trastuzumab treatment in breast cancer using bioinformatics analysis. Oncotarget 2018;9:32149–60. [DOI] [PMC free article] [PubMed] [Google Scholar]
- [27].Jarzab M, Kowal M, Bal W, et al. Ratio of proliferation markers and HSP90 gene expression as a predictor of pathological complete response in breast cancer neoadjuvant chemotherapy. Folia Histochem Cytobiol 2016;54:202–9. [DOI] [PubMed] [Google Scholar]
- [28].Cheng Q, Chang JT, Geradts J, et al. Amplification and high-level expression of heat shock protein 90 marks aggressive phenotypes of human epidermal growth factor receptor 2 negative breast cancer. Breast Cancer Res 2012;14:R62. [DOI] [PMC free article] [PubMed] [Google Scholar]
- [29].Takacova M, Holotnakova T, Barathova M, et al. Src induces expression of carbonic anhydrase IX via hypoxia-inducible factor 1. Oncol Rep 2010;23:869–74. [PubMed] [Google Scholar]
- [30].Turro E, Greene D, Wijgaerts A, et al. A dominant gain-of-function mutation in universal tyrosine kinase SRC causes thrombocytopenia, myelofibrosis, bleeding, and bone pathologies. Sci Transl Med 2016;8:328ra30. [DOI] [PMC free article] [PubMed] [Google Scholar]
- [31].Marcotte R, Smith HW, Sanguin-Gendreau V, et al. Mammary epithelial-specific disruption of c-Src impairs cell cycle progression and tumorigenesis. Proc Natl Acad Sci U S A 2012;09:2808–13. [DOI] [PMC free article] [PubMed] [Google Scholar]
- [32].Elsberger B. Translational evidence on the role of Src kinase and activated Src kinase in invasive breast cancer. Crit Rev Oncol Hematol 2014;89:343–51. [DOI] [PubMed] [Google Scholar]
- [33].Abdullah C, Korkaya H, Iizuka S, et al. SRC increases MYC mRNA expression in estrogen receptor-positive breast cancer via mRNA stabilization and inhibition of p53 function. Mol Cell Biol 2018;38:pii:e00463–517. [DOI] [PMC free article] [PubMed] [Google Scholar]
- [34].Hiscox S, Jordan NJ, Smith C, et al. Dual targeting of Src and ER prevents acquired antihormone resistance in breast cancer cells. Breast Cancer Res Treat 2009;115:57–67. [DOI] [PubMed] [Google Scholar]
- [35].Ndagi U, Mhlongo NN, Soliman ME. Emergence of a promising lead compound in the treatment of triple negative breast cancer: an insight into conformational features and ligand binding landscape of c-Src protein with UM-164. Appl Biochem Biotechnol 2018;185:655–75. [DOI] [PubMed] [Google Scholar]
- [36].Kumada K, Fuse N, Tamura T, et al. HSP70/DNAJA3 chaperone/cochaperone regulates NF-kappaB activity in immune responses. Biochem Biophys Res Commun 2019;513:947–51. [DOI] [PubMed] [Google Scholar]
- [37].Rohde M, Daugaard M, Jensen MH, et al. Members of the heat-shock protein 70 family promote cancer cell growth by distinct mechanisms. Genes Dev 2005;19:570–82. [DOI] [PMC free article] [PubMed] [Google Scholar]
- [38].Bakkenist CJ, Koreth J, Williams CS, et al. Heat shock cognate 70 mutations in sporadic breast carcinoma. Cancer Res 1999;59:4219–21. [PubMed] [Google Scholar]
- [39].Xiang X, You XM, Li LQ. Expression of HSP90AA1/HSPA8 in hepatocellular carcinoma patients with depression. Onco Targets Ther 2018;11:3013–23. [DOI] [PMC free article] [PubMed] [Google Scholar]
- [40].Shan N, Zhou W, Zhang S, et al. Identification of HSPA8 as a candidate biomarker for endometrial carcinoma by using iTRAQ-based proteomic analysis. Onco Targets Ther 2016;9:2169–79. [DOI] [PMC free article] [PubMed] [Google Scholar]
- [41].Gross C, Hansch D, Gastpar R, et al. Interaction of heat shock protein 70 peptide with NK cells involves the NK receptor CD94. Biol Chem 2003;384:267–79. [DOI] [PubMed] [Google Scholar]
- [42].Chuma M, Sakamoto M, Yamazaki K, et al. Expression profiling in multistage hepatocarcinogenesis: identification of HSP70 as a molecular marker of early hepatocellular carcinoma. Hepatology 2003;37:198–207. [DOI] [PubMed] [Google Scholar]
- [43].Powers MV, Jones K, Barillari C, et al. Targeting HSP70: the second potentially druggable heat shock protein and molecular chaperone? Cell cycle 2010;9:1542–50. [DOI] [PubMed] [Google Scholar]


